


2020 Vol. 42, No. 11
Display Method:
2020, (11): 1-3.
Abstract:
2020, 42(11): 1-11.
doi: 10.3969/j.issn.0253-4193.2020.11.001
Abstract:
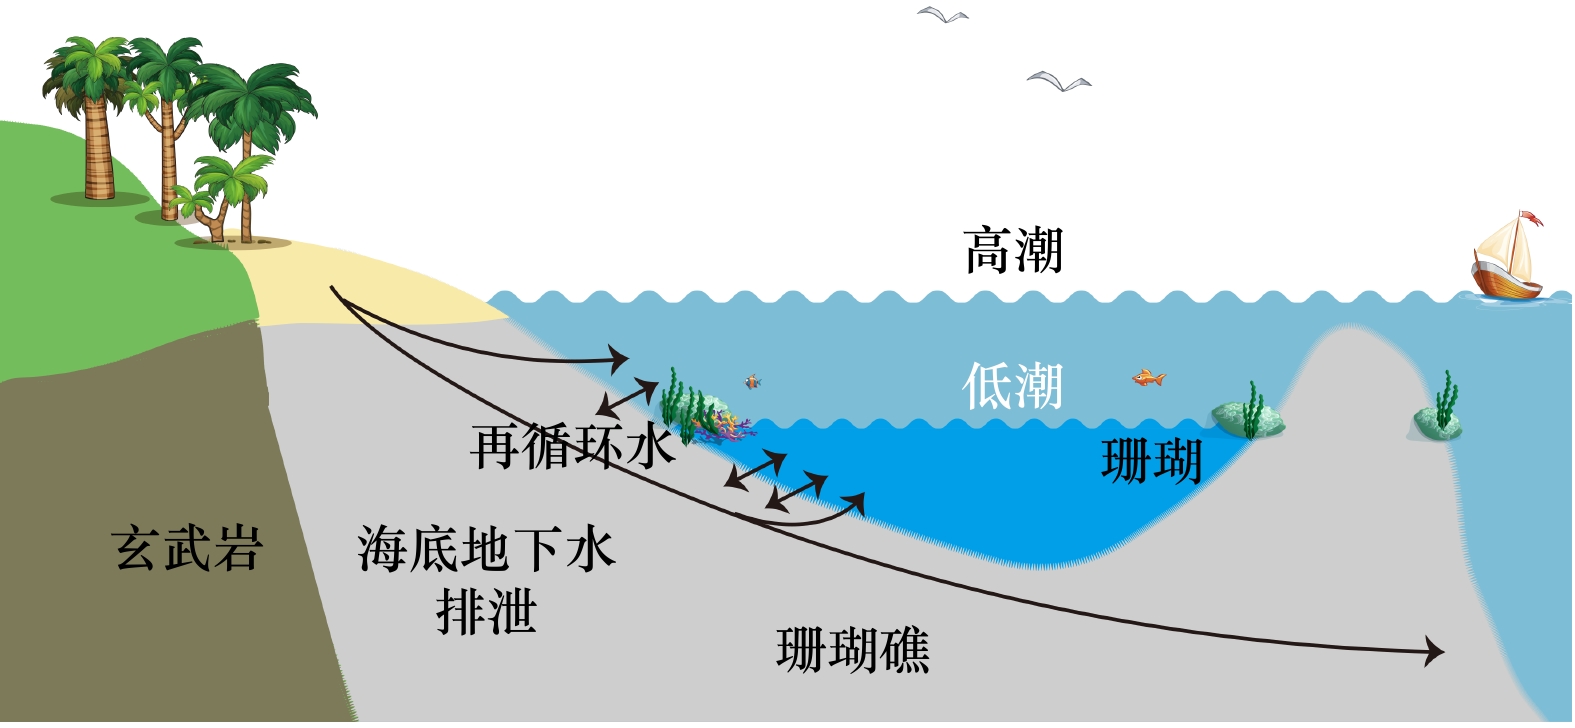
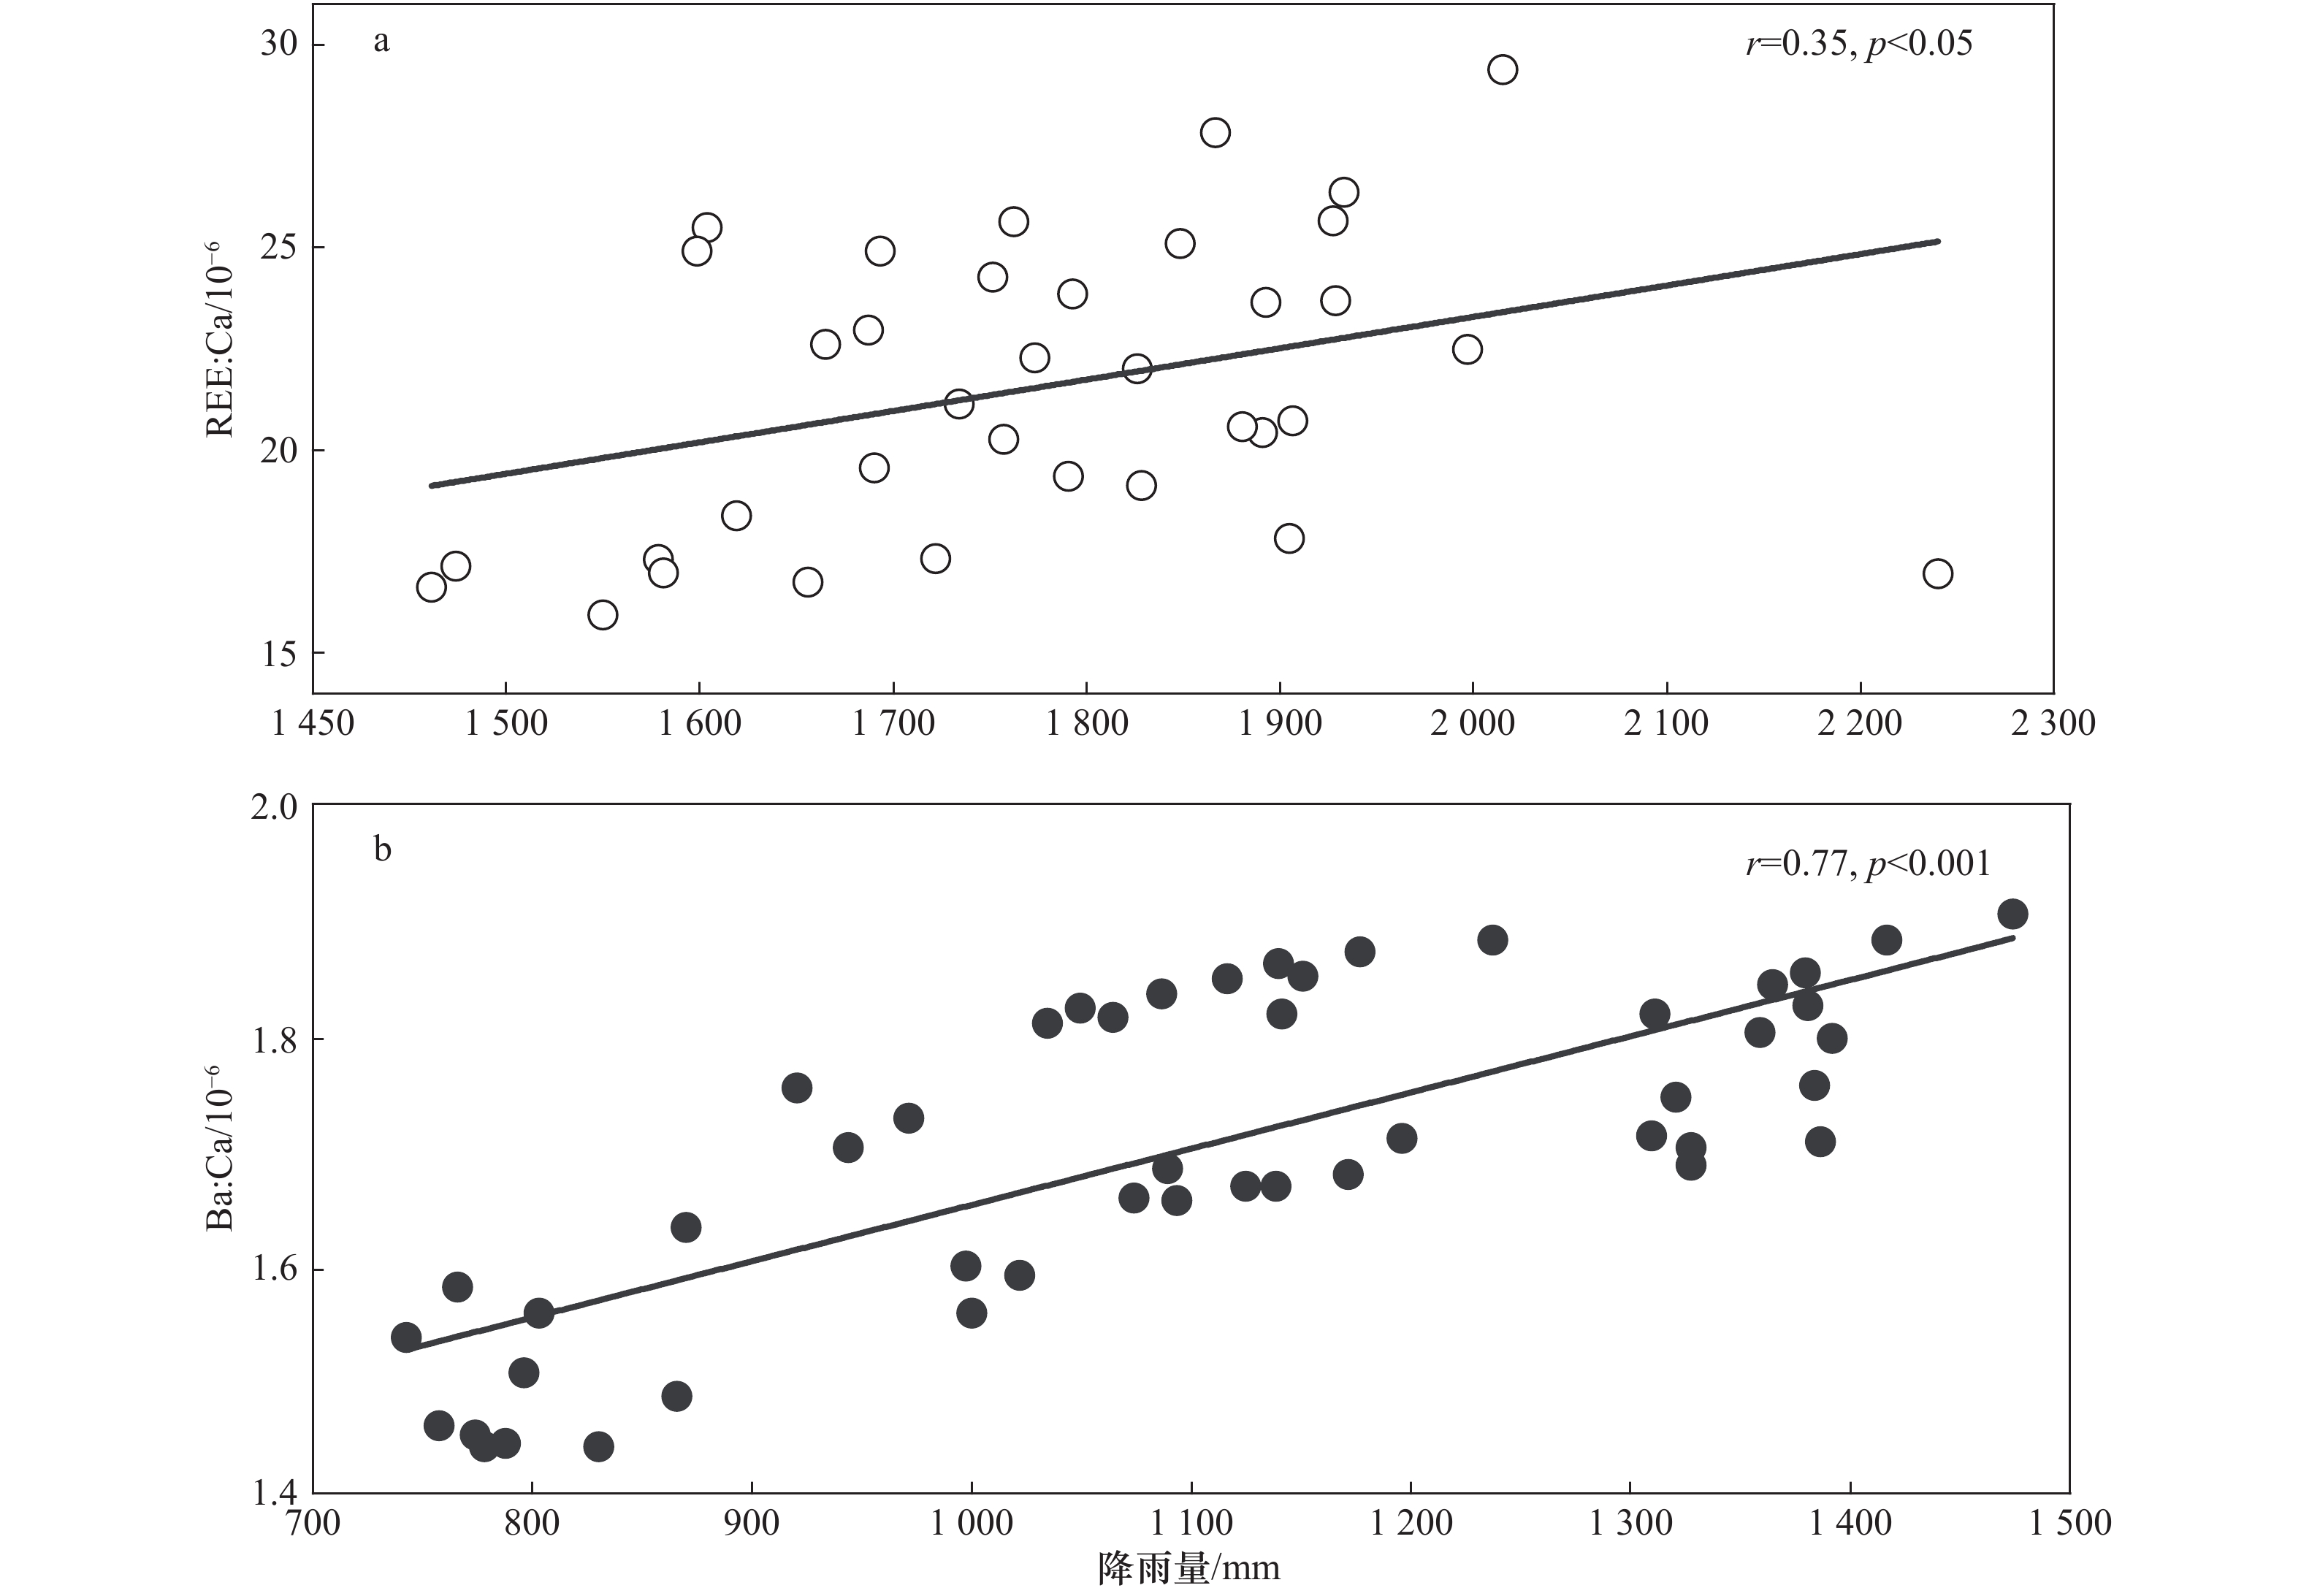
Submarine groundwater discharge (SGD) is a significant driving factor of marine chemistry and coastal ecosystem evolution, and plays a very important role in the development and degradation of coral reefs due to supplying large loads of chemicals into the coastal ocean. This paper reviews the characteristics of SGD in coral reefs and the potential ecological environment effect. Meanwhile, the northern South China Sea was taken as an example to explore the dominant factors controlling the development and degradation of coral reefs, as well as the potential effects. Results show that the research on the long time serial variations of dynamic changes of SGD in coral reefs, especially in fringing reef areas, is quite weak; it is feasible to reconstruct the historical patterns of the annual fluxes of SGD in local seas by using the geochemical coral skeletons proxies; SGD is likely to be an important factor contributing to the degradation of coral reefs in the northern South China Sea, nevertheless SGD has received limited concerns and attentions from both governmental agencies and the public. The future researches should focus on the high-resolution coral records of SGD and chemicals it carries in coral reefs, explore the key processes and mechanisms of effects from SGD on the development and degradation of coral reefs, and then offer scientific and reasonable advice.
Submarine groundwater discharge (SGD) is a significant driving factor of marine chemistry and coastal ecosystem evolution, and plays a very important role in the development and degradation of coral reefs due to supplying large loads of chemicals into the coastal ocean. This paper reviews the characteristics of SGD in coral reefs and the potential ecological environment effect. Meanwhile, the northern South China Sea was taken as an example to explore the dominant factors controlling the development and degradation of coral reefs, as well as the potential effects. Results show that the research on the long time serial variations of dynamic changes of SGD in coral reefs, especially in fringing reef areas, is quite weak; it is feasible to reconstruct the historical patterns of the annual fluxes of SGD in local seas by using the geochemical coral skeletons proxies; SGD is likely to be an important factor contributing to the degradation of coral reefs in the northern South China Sea, nevertheless SGD has received limited concerns and attentions from both governmental agencies and the public. The future researches should focus on the high-resolution coral records of SGD and chemicals it carries in coral reefs, explore the key processes and mechanisms of effects from SGD on the development and degradation of coral reefs, and then offer scientific and reasonable advice.


2020, 42(11): 49-61.
doi: 10.3969/j.issn.0253-4193.2020.11.006
Abstract:
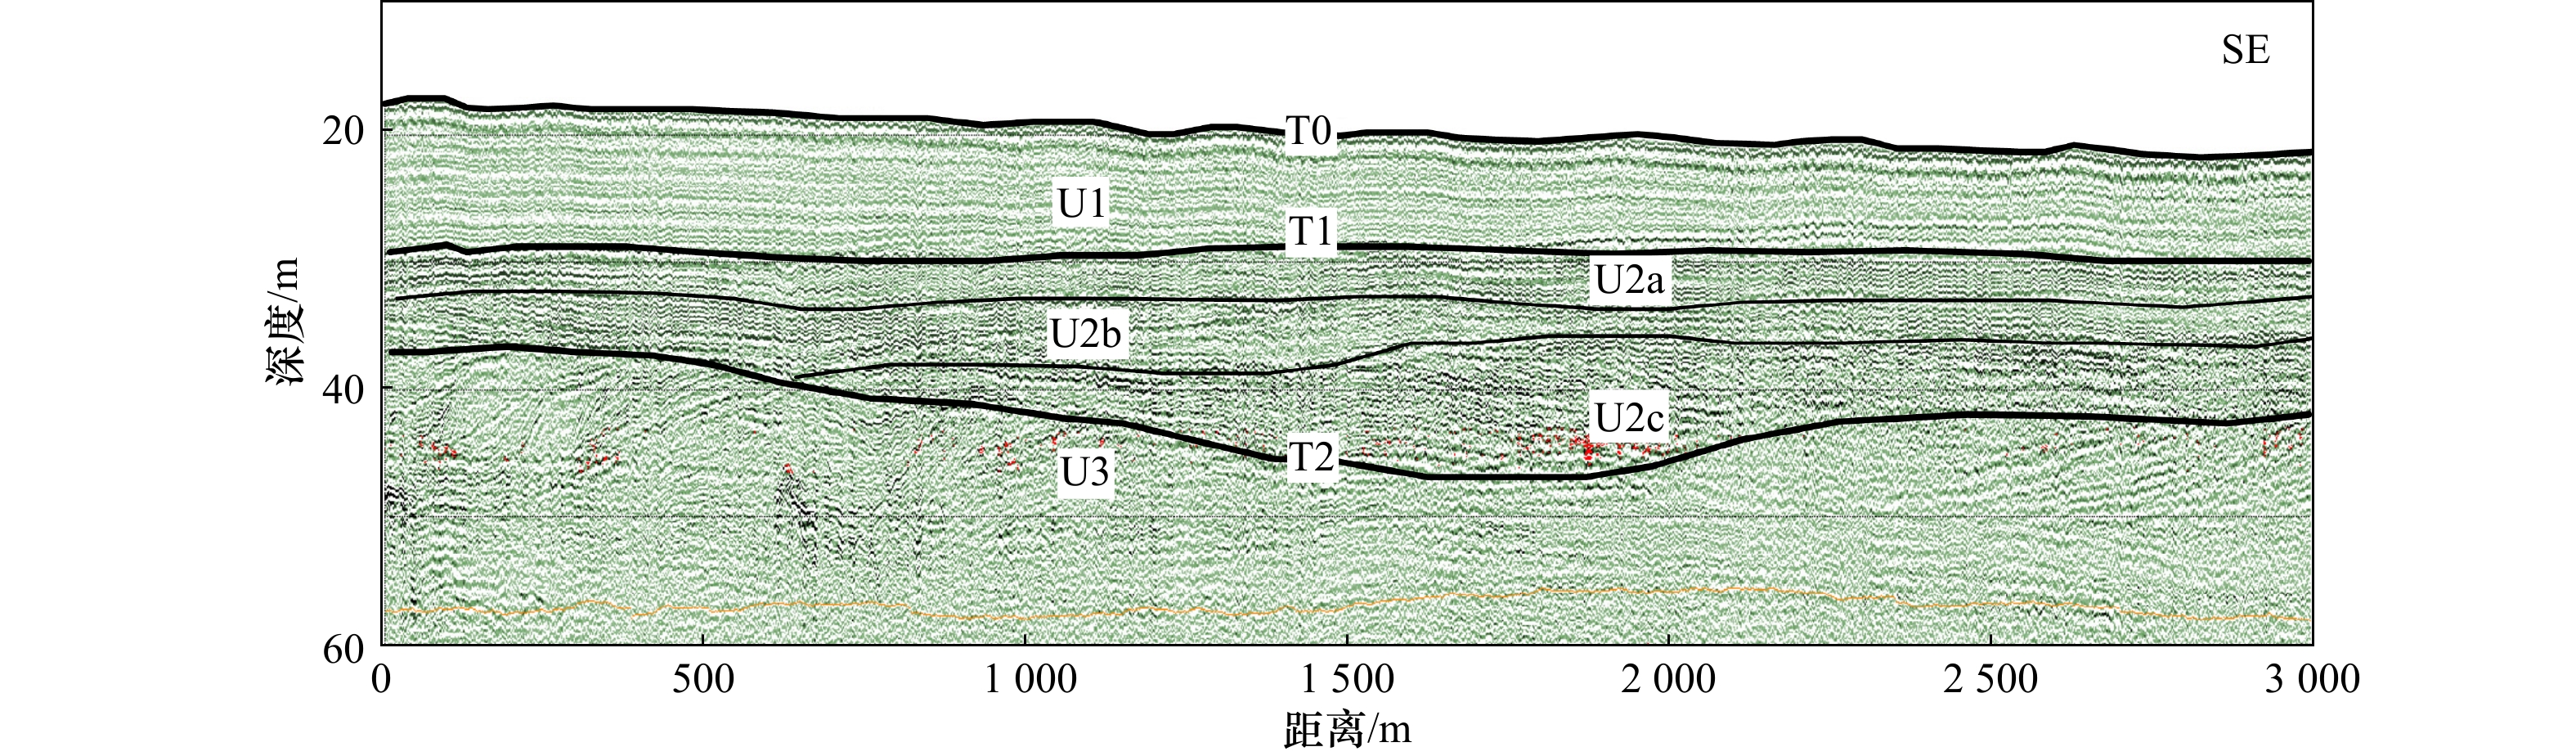
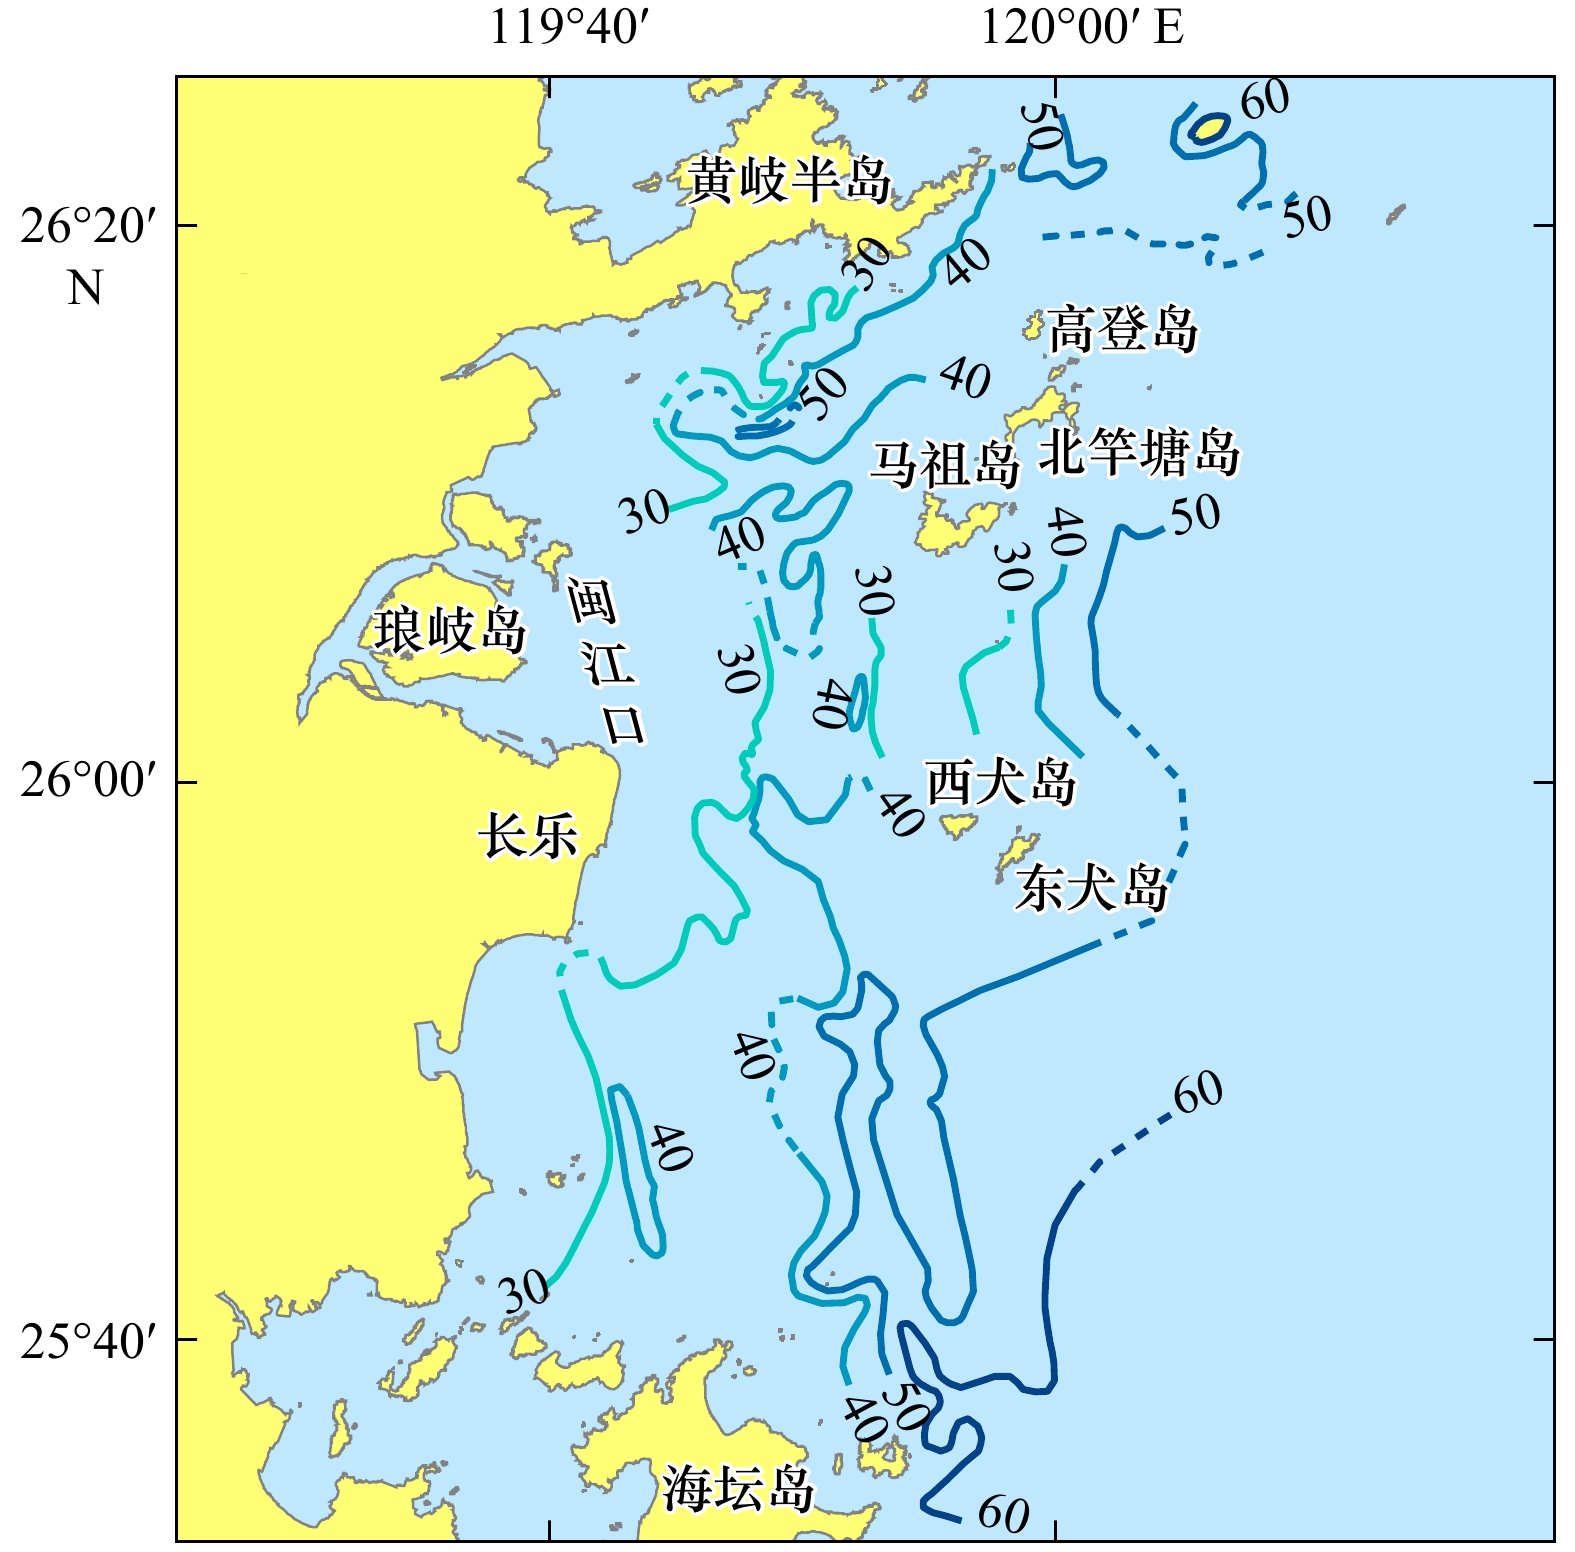
High-resolution single channel shallow-seismic profiles were used to analyze the Holocene sedimentation off the Minjiang River Estuary. The base surface of the Holocene is an erosional surface of MIS 2, locally paleo-river channels. Its depth is usually between 30 m and 60 m with the maximum of 65 m below present sea level. Generally, the surface is shallower near the shore and deeper toward the open sea, locally showing strips of negative topography due to paleo-river channels. The Holocene consists of marine depositional unit (U1) formed after late Early Holocene and fluvial-lacustrine-swamp depositional unit (U2) of early Holocene. The former unit is in turn composed of offshore-shallow sea parallel seismic facies and estuary-inshore clinoform seismic facies. Their landward onlap and seaward downlap against base surfaces are indicative, combined with distribution characteristics of sediment thickness, of major sediment sources and their transport tendency. The thickness of the all Holocene sediment is usually between 10 m and 20 m, with the maximum of 38 m in paleo-river channel areas, but absent in the area between Mazu Archipalegos and Baiquan Archipalegos. The marine Holocene is a few meters to 20 m, with the maximum of some 25 m in the southeastern area (east of the Haitan Island). Since the Holocene transgressive, there were three main sediment sources. Sediments from the Taiwan Strait in south covered the southern part of the study area. Minjiang River-delivered suspended sediments deposited in the northern area, mainly toward NE to the open sea with a southerly tongue-branch near the mouth. Its modern depocenter located in the northern estuary, indicated by a thickness of more than 15 m of mud. The northeastern part of the area was affected by suspended sediments from Zhejiang-Fujian Costal Current. Four sedimentary zones are distinguished. They are sedimentary zone of Taiwan Strait source, sedimentary zone of Minjiang River source, northeastern mixture zone and non-sedimentation zone between Mazu Archipalegos and Baiquan Archipalegos. Their average sedimentary rates are about 0.8 mm/a, 1.0 mm/a, 1.1 mm/a and 0 mm/a, respectively. The non-sedimentation zone between Mazu Archipalegos and Baiquan Archipalegos was mainly controlled by a flowing of island-circling sediment.
High-resolution single channel shallow-seismic profiles were used to analyze the Holocene sedimentation off the Minjiang River Estuary. The base surface of the Holocene is an erosional surface of MIS 2, locally paleo-river channels. Its depth is usually between 30 m and 60 m with the maximum of 65 m below present sea level. Generally, the surface is shallower near the shore and deeper toward the open sea, locally showing strips of negative topography due to paleo-river channels. The Holocene consists of marine depositional unit (U1) formed after late Early Holocene and fluvial-lacustrine-swamp depositional unit (U2) of early Holocene. The former unit is in turn composed of offshore-shallow sea parallel seismic facies and estuary-inshore clinoform seismic facies. Their landward onlap and seaward downlap against base surfaces are indicative, combined with distribution characteristics of sediment thickness, of major sediment sources and their transport tendency. The thickness of the all Holocene sediment is usually between 10 m and 20 m, with the maximum of 38 m in paleo-river channel areas, but absent in the area between Mazu Archipalegos and Baiquan Archipalegos. The marine Holocene is a few meters to 20 m, with the maximum of some 25 m in the southeastern area (east of the Haitan Island). Since the Holocene transgressive, there were three main sediment sources. Sediments from the Taiwan Strait in south covered the southern part of the study area. Minjiang River-delivered suspended sediments deposited in the northern area, mainly toward NE to the open sea with a southerly tongue-branch near the mouth. Its modern depocenter located in the northern estuary, indicated by a thickness of more than 15 m of mud. The northeastern part of the area was affected by suspended sediments from Zhejiang-Fujian Costal Current. Four sedimentary zones are distinguished. They are sedimentary zone of Taiwan Strait source, sedimentary zone of Minjiang River source, northeastern mixture zone and non-sedimentation zone between Mazu Archipalegos and Baiquan Archipalegos. Their average sedimentary rates are about 0.8 mm/a, 1.0 mm/a, 1.1 mm/a and 0 mm/a, respectively. The non-sedimentation zone between Mazu Archipalegos and Baiquan Archipalegos was mainly controlled by a flowing of island-circling sediment.


Morphologic characteristics and controlling factors of the northeastern South China Sea canyon group
2020, 42(11): 62-74.
doi: 10.3969/j.issn.0253-4193.2020.11.007
Abstract:
Submarine canyons are widely distributed on global continental margins, they are the main channels for sediment transport from shallow sea to deep sea. Submarine canyons are of great significance for understanding the triggering mechanism of turbidity currents, the transport pattern of sediments, the evolution of deep-sea/abysmal fans, and the exploration of oil and gas resources in deep sea. Based on high-resolution multi-beam bathymetric data, this paper studies the large submarine canyon group in the northeast of the South China Sea. The morphologic characteristics and controlling factors of the four large submarine canyons, the Kaoping, the Penghu, the South Taiwan Bank and the Dongsha submarine canyons, are described in detail. Seabed slope, tectonic movement, the development of seamounts and seaknolls are important factors affecting the orientation and characteristics of the Northeastern South China Sea Canyon Group. Seabed slope has an important influence on the multi-branch and "V"-shape of the upper reaches of the canyon. The orientation of the Kaoping submarine canyon is controlled by tectonic movement, the orientation of the Penghu submarine canyon is related to the collision between the Philippine Sea Plate and the South China Sea Plate, the orientation of the Dongsha submarine canyon is related to the Dongsha tectonic movement, and the upper reaches of the South Taiwan Bank submarine canyon is controlled by the NW-SE faults. The blocking effect of the seamounts changes the local orientation and morphologic characteristics of the submarine canyons. And the submarine canyon group acts as a channel to transport large amounts of terrigenous sediments to the deep-sea basin and form a large scale of sediment waves, while the development of seamounts and sediment waves leads to the "rejuvenation" and steering of the lower reaches of the Dongsha submarine canyon.
Submarine canyons are widely distributed on global continental margins, they are the main channels for sediment transport from shallow sea to deep sea. Submarine canyons are of great significance for understanding the triggering mechanism of turbidity currents, the transport pattern of sediments, the evolution of deep-sea/abysmal fans, and the exploration of oil and gas resources in deep sea. Based on high-resolution multi-beam bathymetric data, this paper studies the large submarine canyon group in the northeast of the South China Sea. The morphologic characteristics and controlling factors of the four large submarine canyons, the Kaoping, the Penghu, the South Taiwan Bank and the Dongsha submarine canyons, are described in detail. Seabed slope, tectonic movement, the development of seamounts and seaknolls are important factors affecting the orientation and characteristics of the Northeastern South China Sea Canyon Group. Seabed slope has an important influence on the multi-branch and "V"-shape of the upper reaches of the canyon. The orientation of the Kaoping submarine canyon is controlled by tectonic movement, the orientation of the Penghu submarine canyon is related to the collision between the Philippine Sea Plate and the South China Sea Plate, the orientation of the Dongsha submarine canyon is related to the Dongsha tectonic movement, and the upper reaches of the South Taiwan Bank submarine canyon is controlled by the NW-SE faults. The blocking effect of the seamounts changes the local orientation and morphologic characteristics of the submarine canyons. And the submarine canyon group acts as a channel to transport large amounts of terrigenous sediments to the deep-sea basin and form a large scale of sediment waves, while the development of seamounts and sediment waves leads to the "rejuvenation" and steering of the lower reaches of the Dongsha submarine canyon.


2020, 42(11): 75-87.
doi: 10.3969/j.issn.0253-4193.2020.11.008
Abstract:
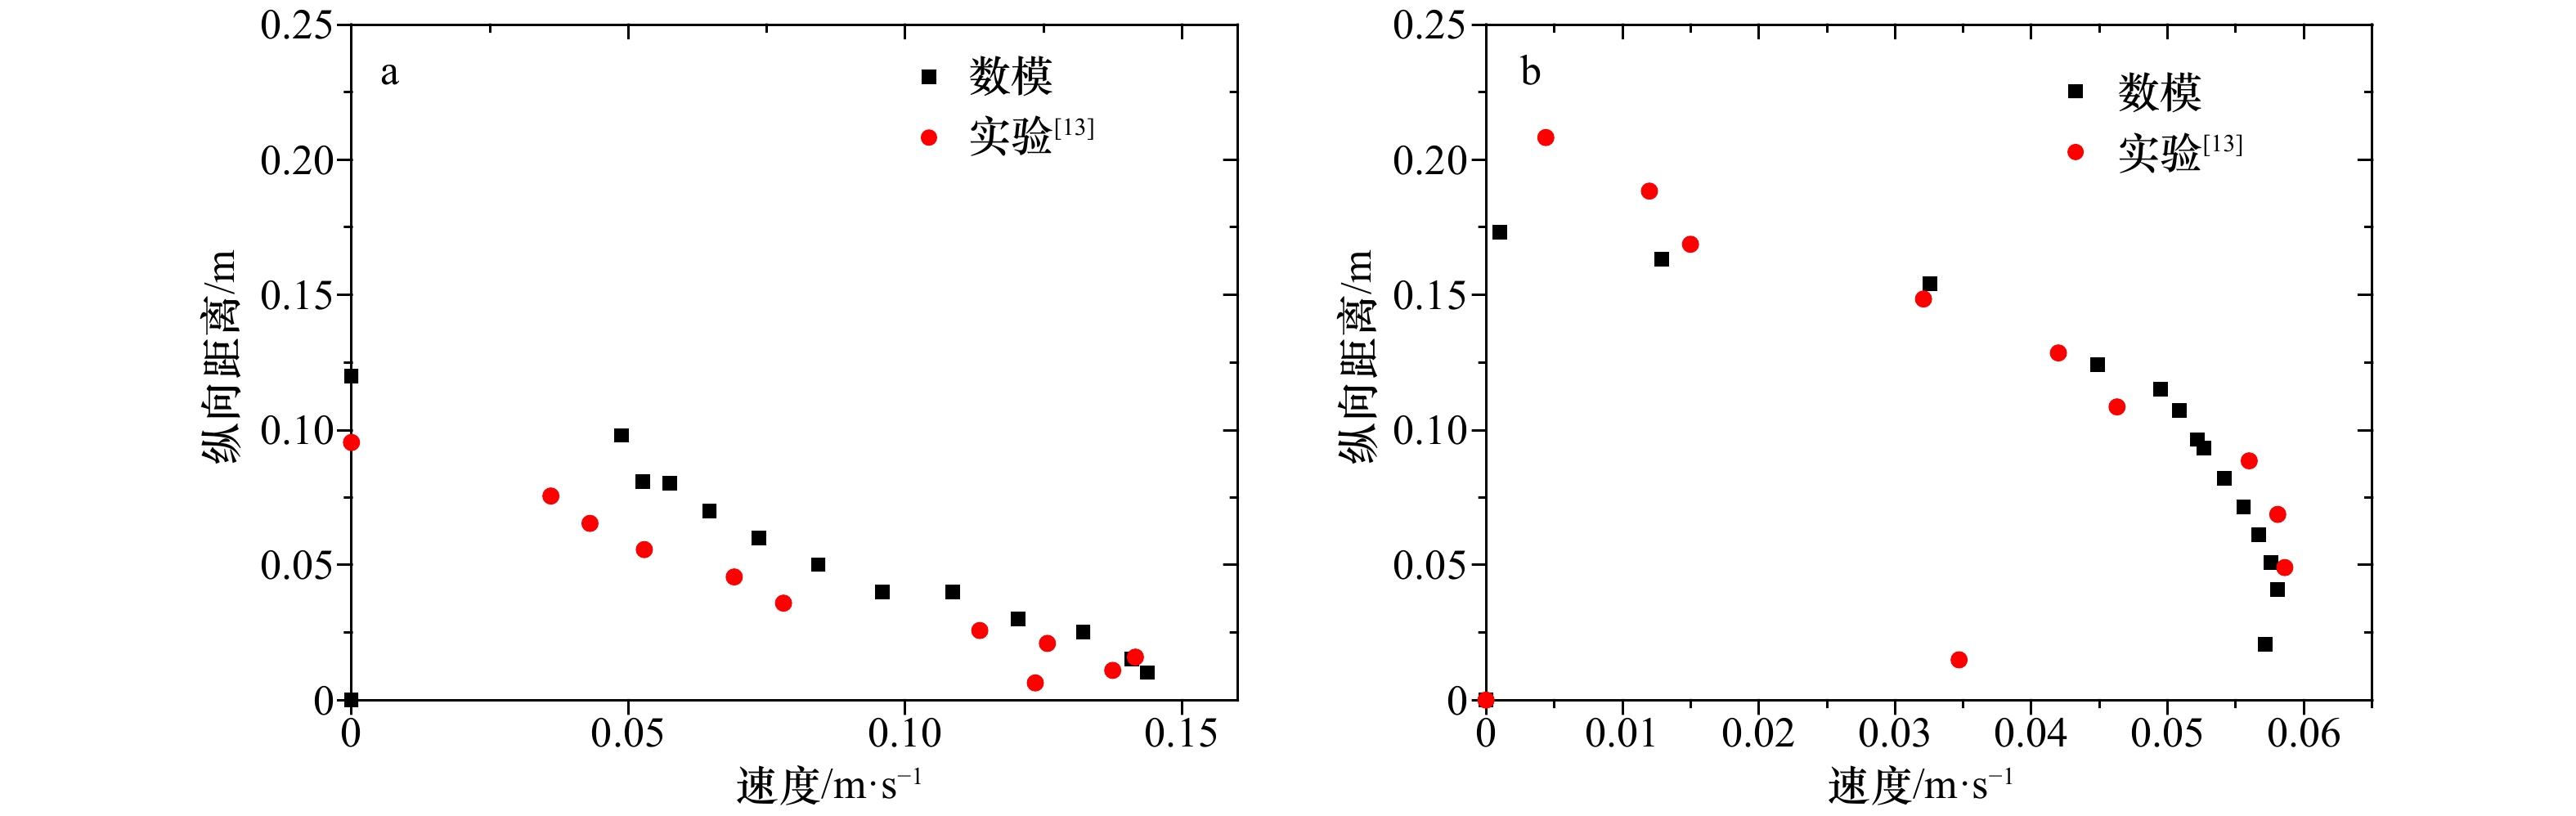
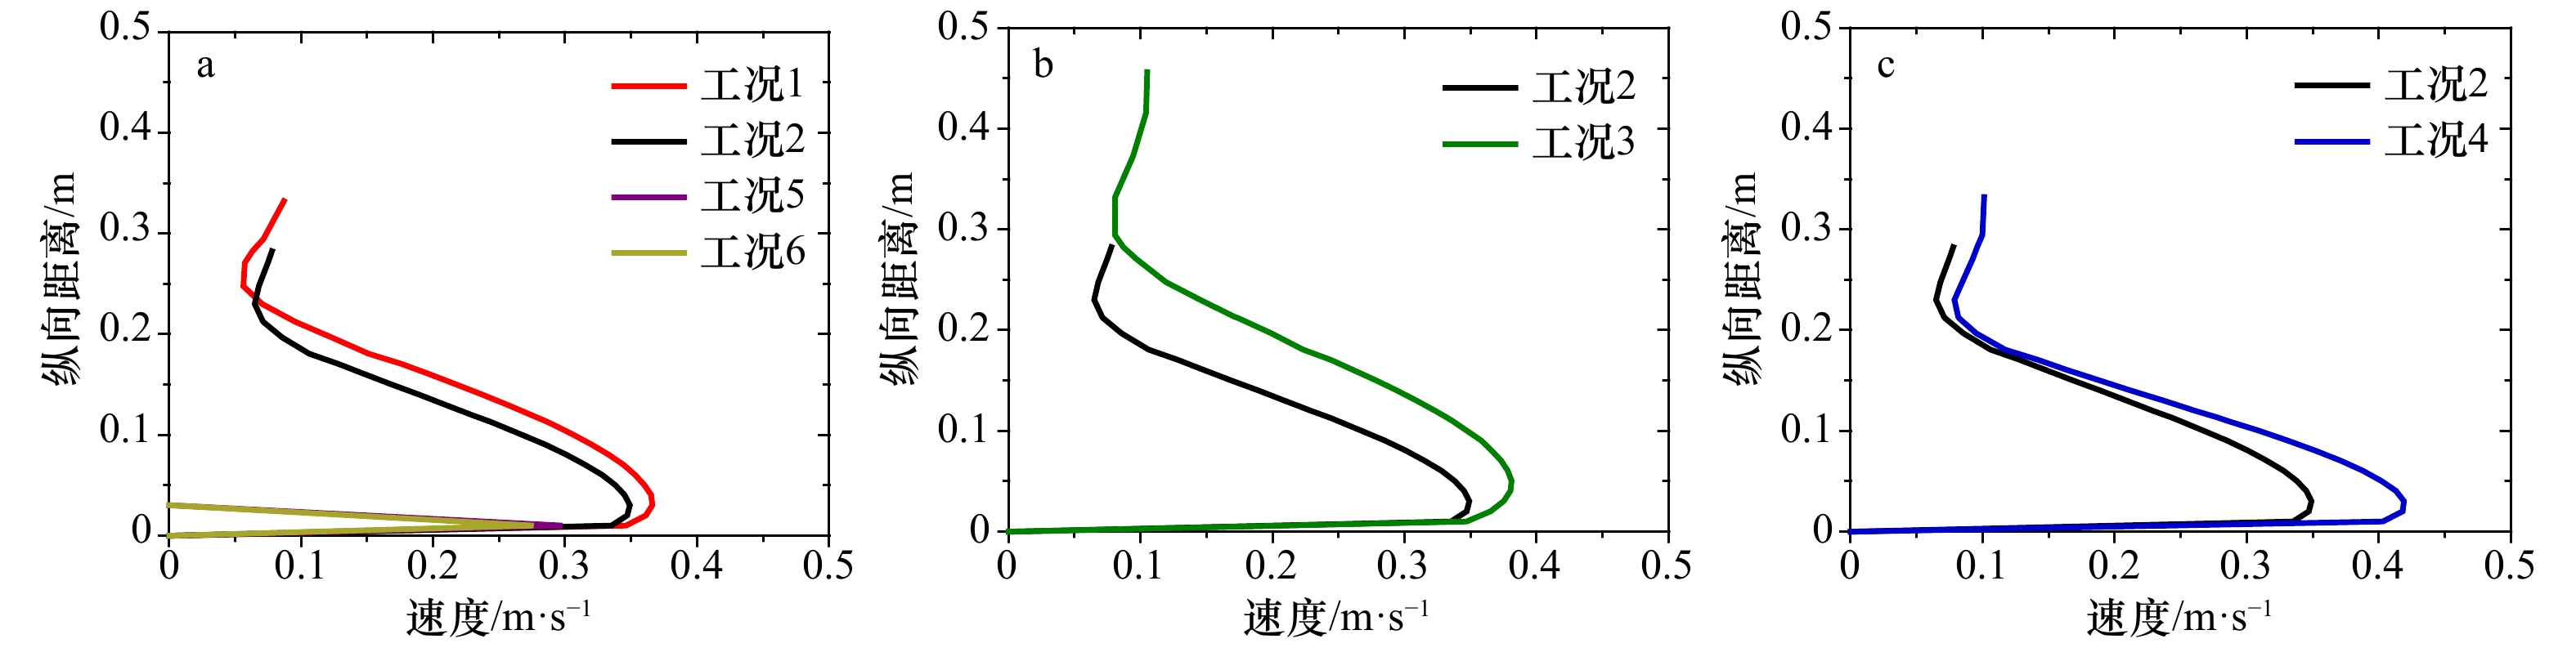
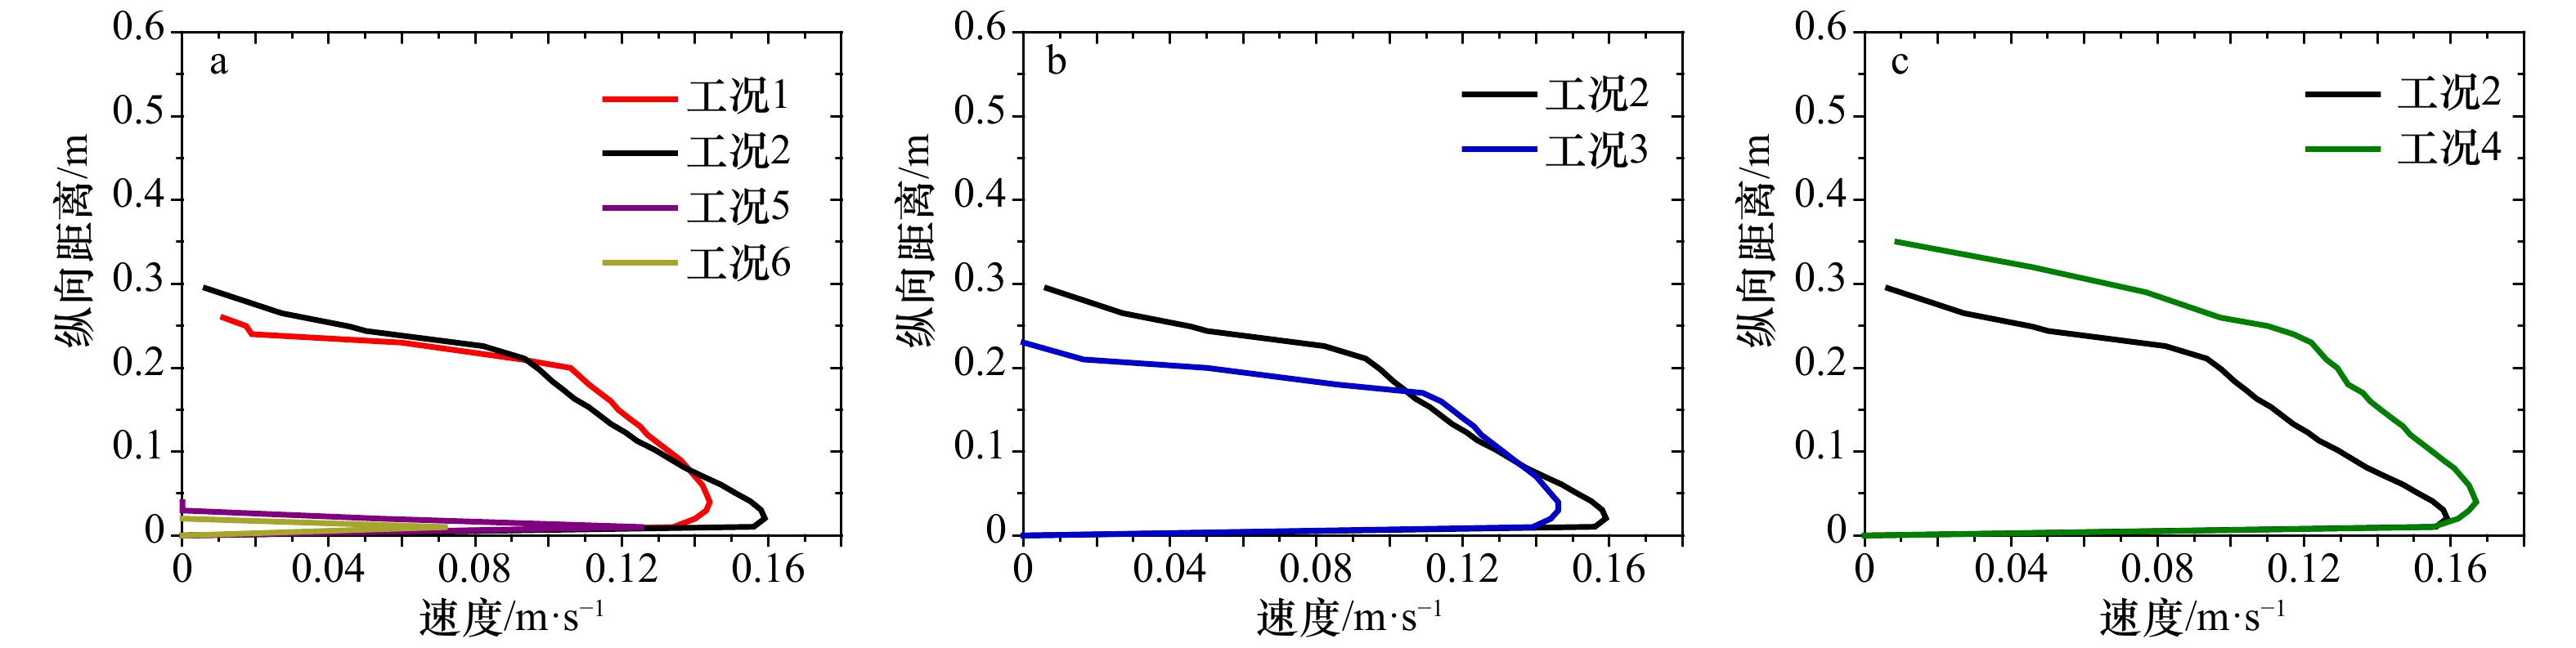
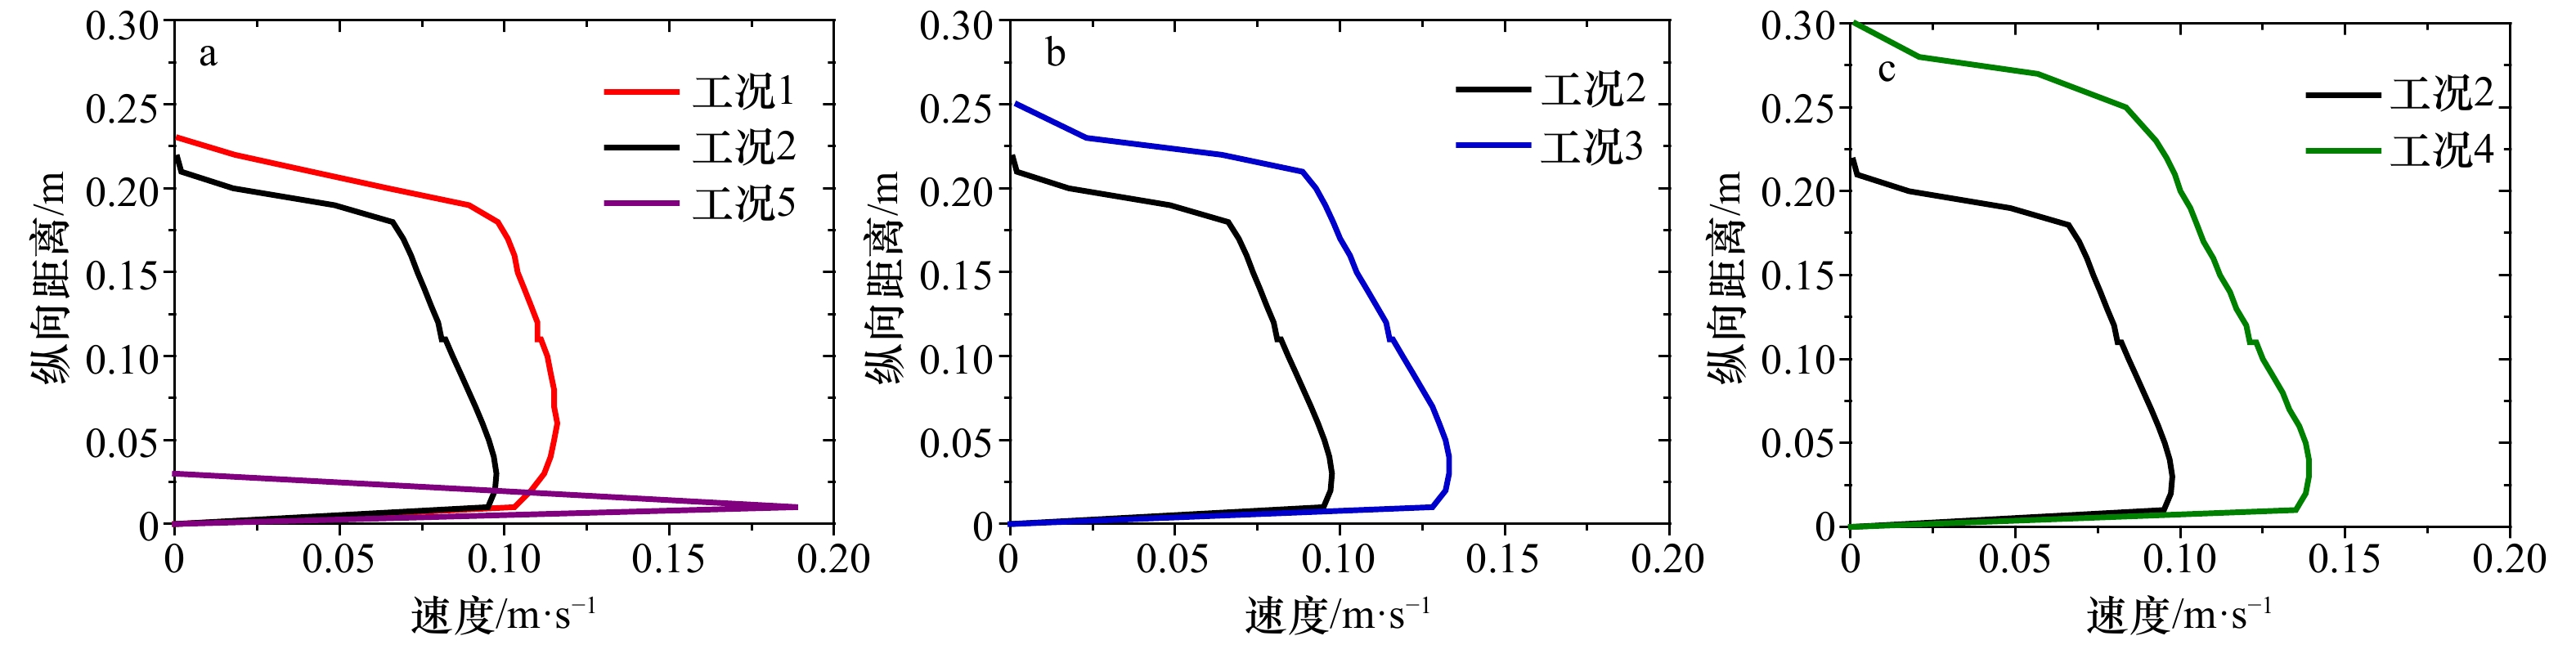
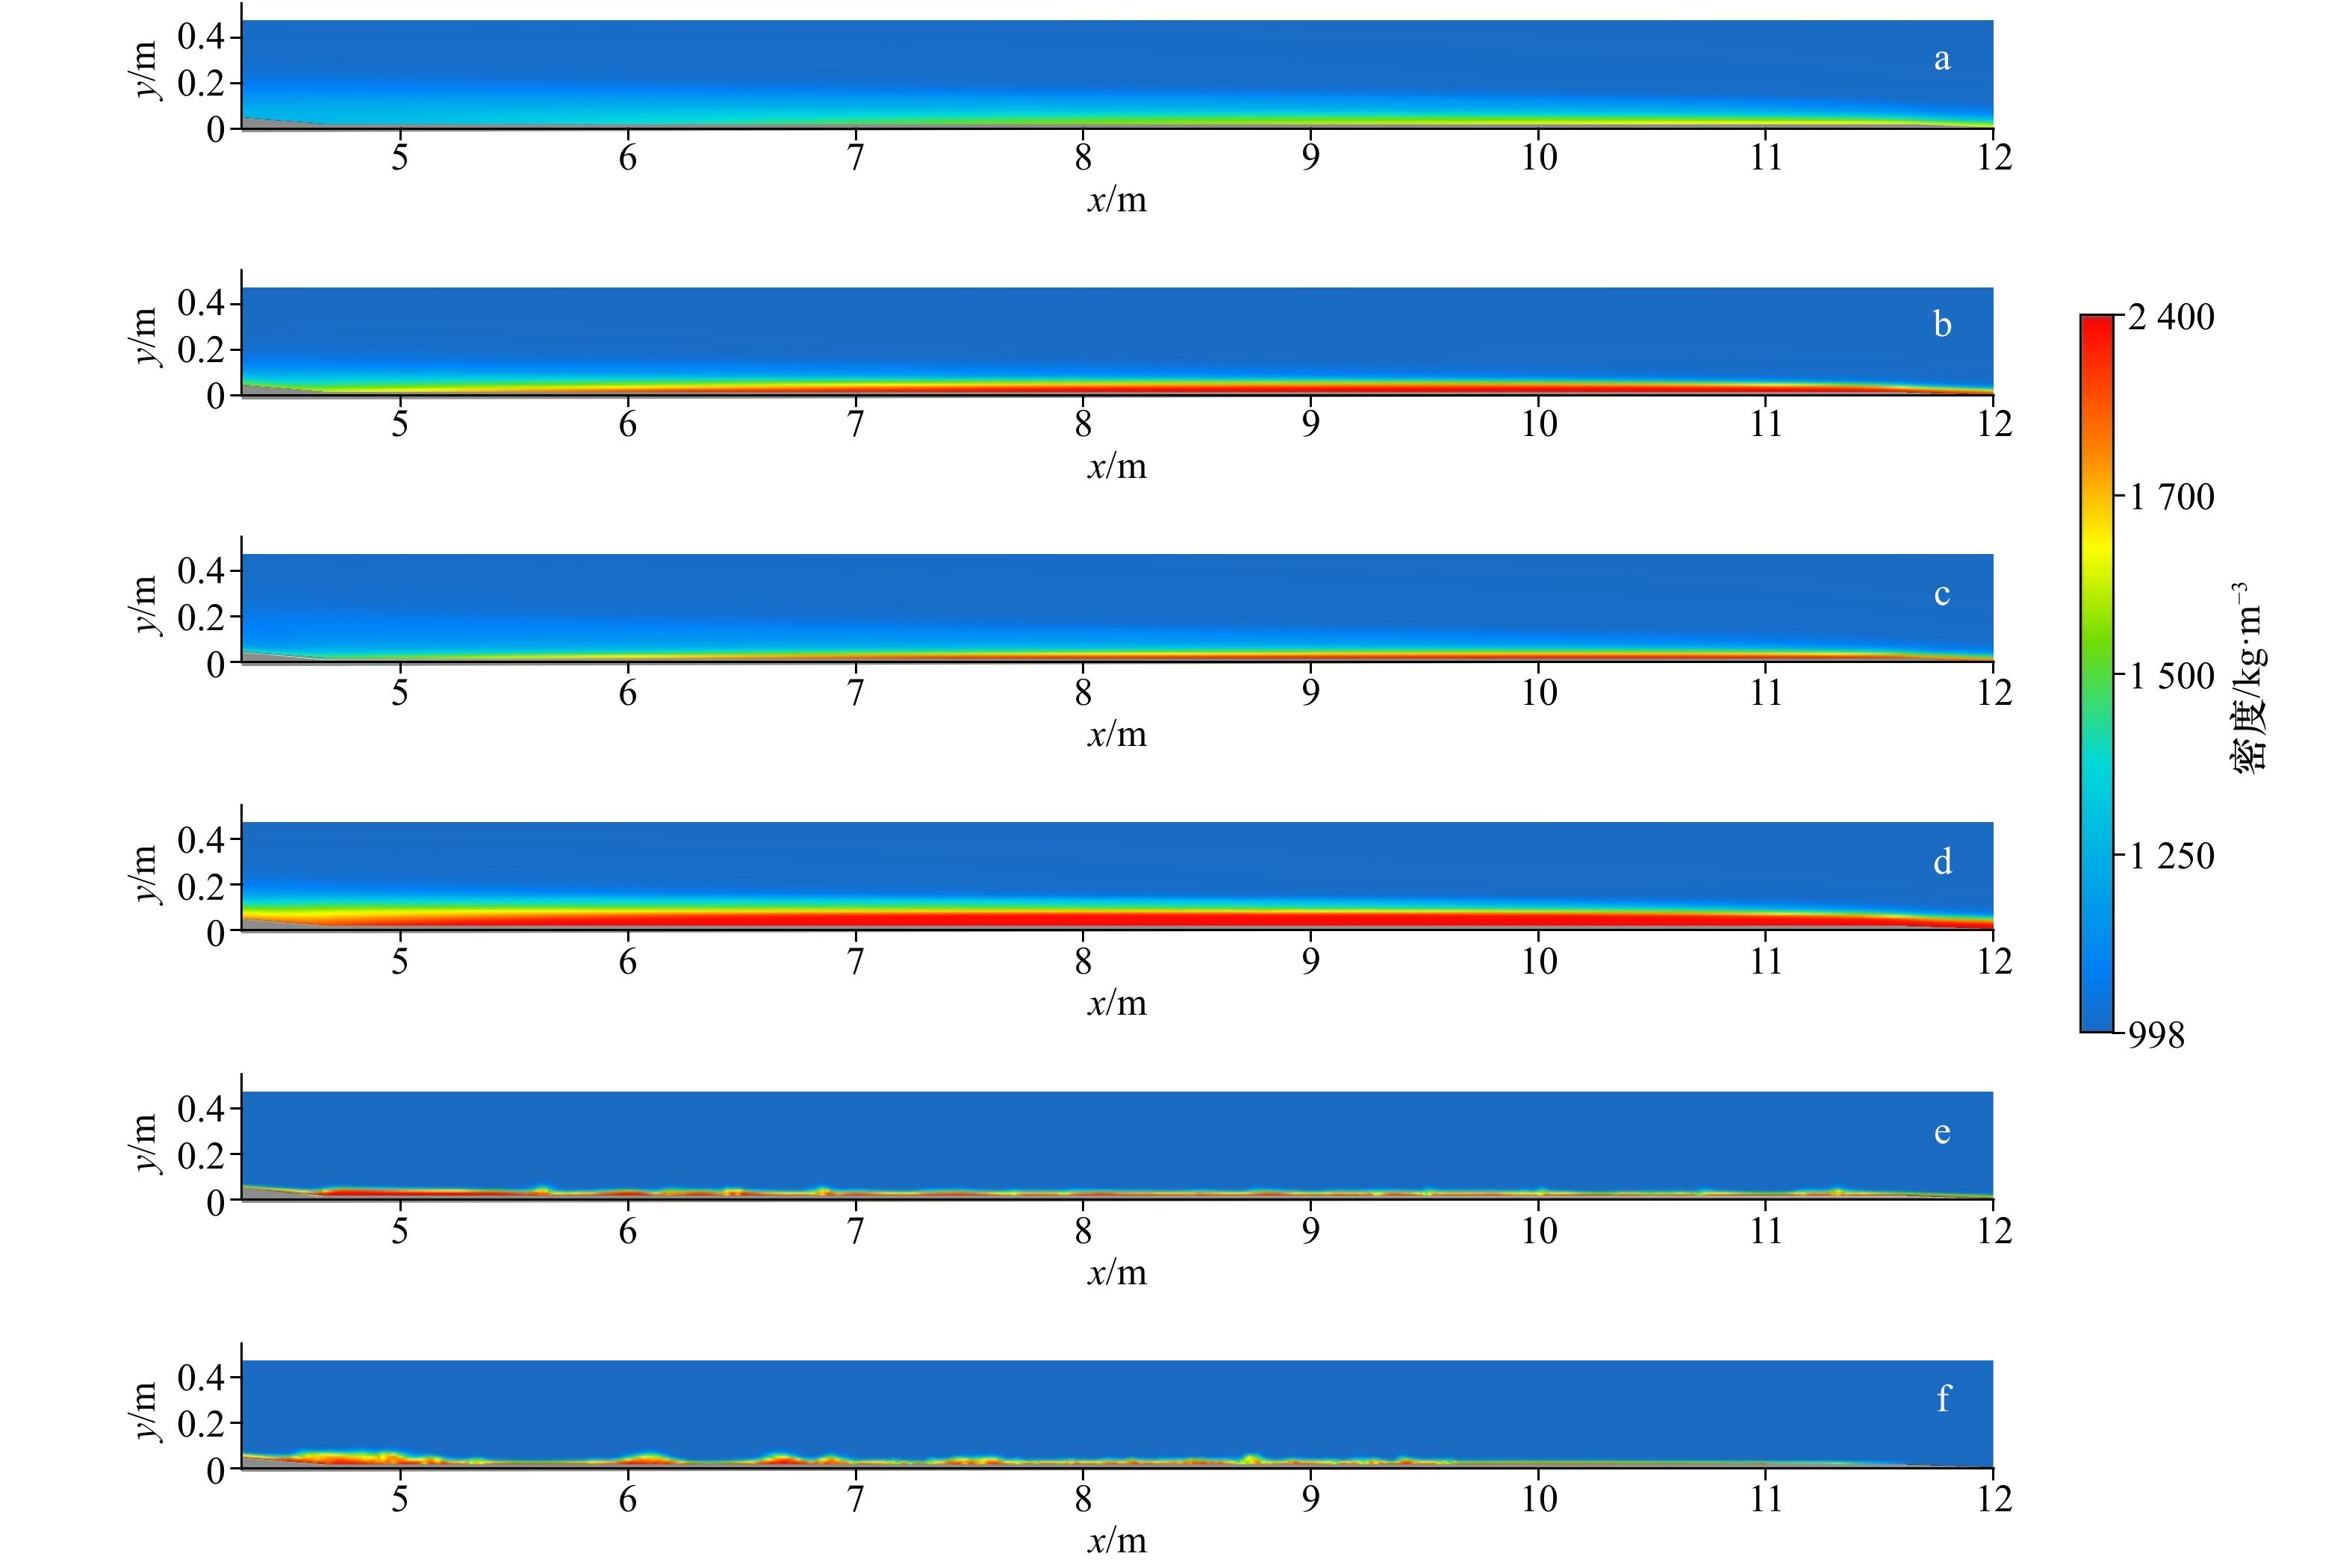
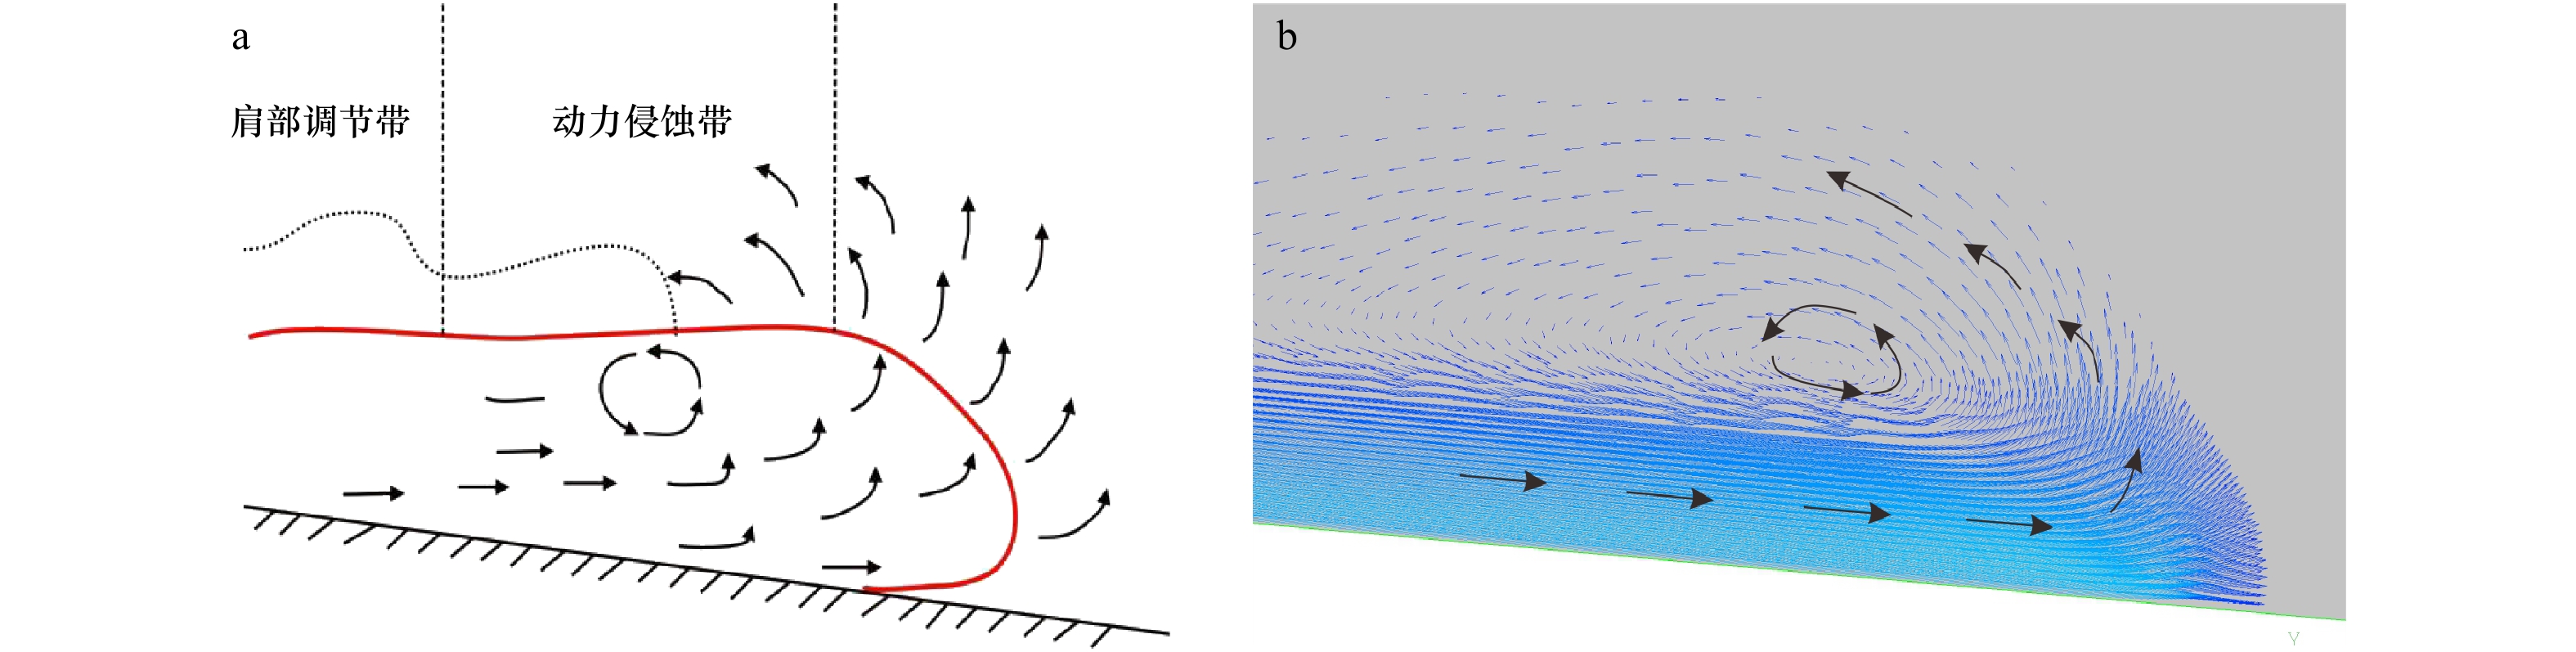
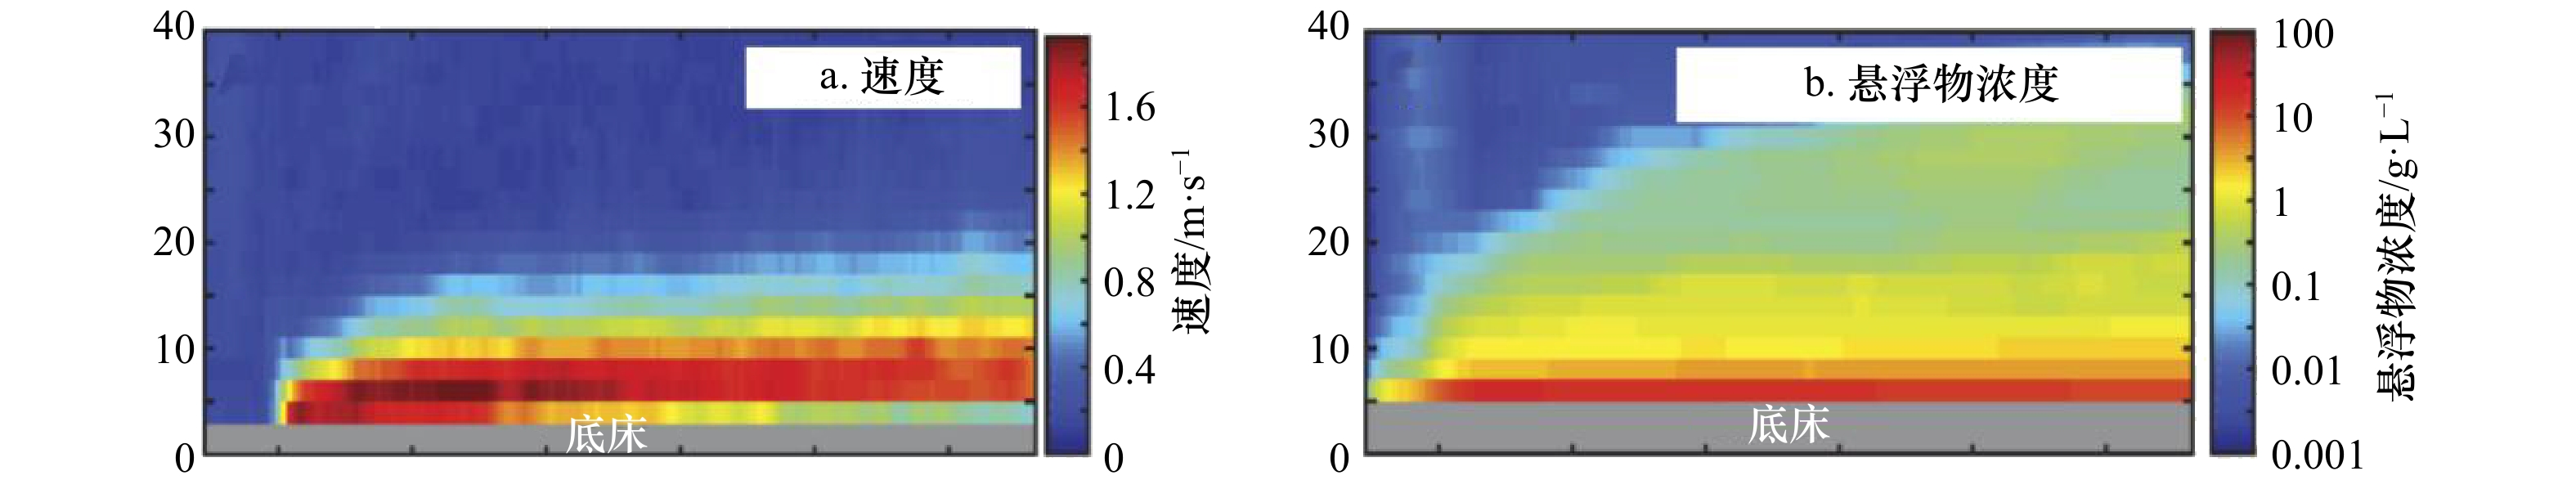
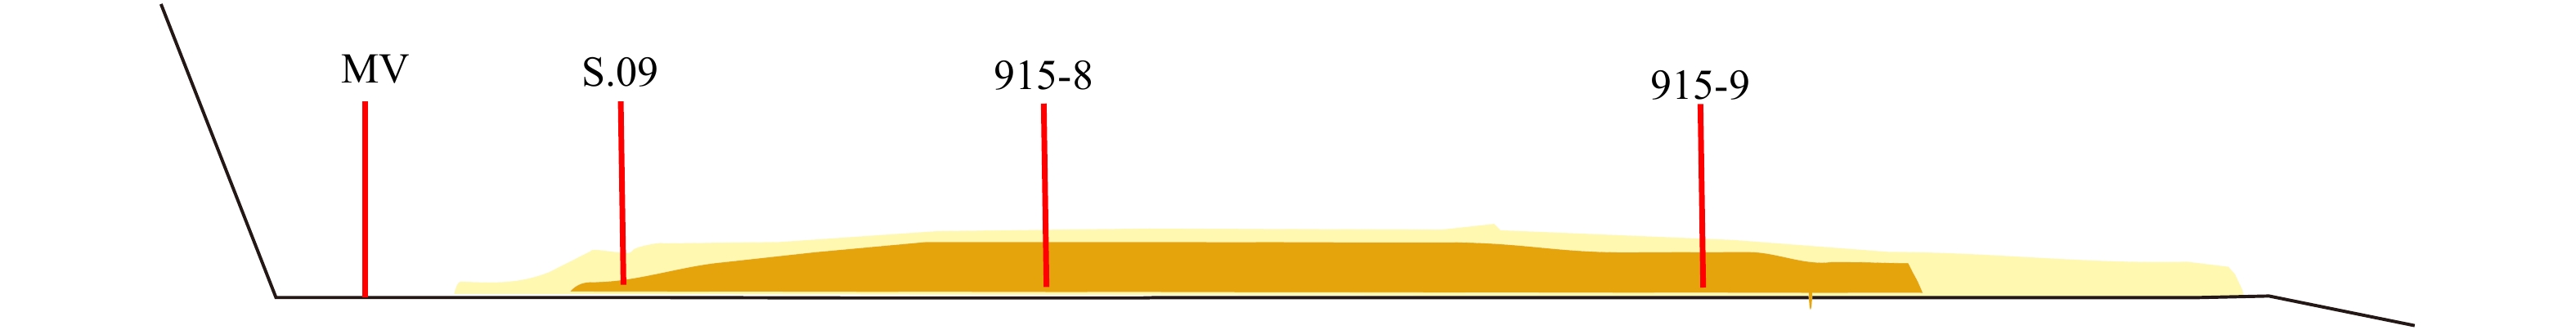
Numerical simulation has become an important way to research the turbidity current on the seabed. The numerical simulation of the current and sedimentary characteristics of the turbidity current on the seabed is significance to the deep water sedimentary system, the stability evaluation of seabed engineering and the deep-sea oil and gas resource exploration. A numerical model based on Navier-Stokes equation and the turbulence k-ε model for the simulation of turbidity current is applied to study the current and deposition of turbidity current with constant inflows into continuous slope breaks. Initial conditions such as different particle size, velocity and suspended particle volume fraction were set in the simulation. Simulated results show that the averaged velocity of the turbidity current accelerates at the slope, on the nearly horizontal bed, velocity drops obviously and gradually deposits at the horizontal bed. The acceleration of turbidity current at small slope does not affect the deposition trend. The thickness of the current gradually increases due to the environmental water entrainment, and the turbidity current head shape and flow characteristics are conformed favorably with the measured data. In addition, this paper also simulates the turbidity current of multi-frequency continuous inflow, and compares the simulation results with the measured sedimentary characteristics. The results show that the deposition of multi-frequency continuous inflow turbidity current may form the superposition of several discontinuous bauma sequences on the vertical strata.
Numerical simulation has become an important way to research the turbidity current on the seabed. The numerical simulation of the current and sedimentary characteristics of the turbidity current on the seabed is significance to the deep water sedimentary system, the stability evaluation of seabed engineering and the deep-sea oil and gas resource exploration. A numerical model based on Navier-Stokes equation and the turbulence k-ε model for the simulation of turbidity current is applied to study the current and deposition of turbidity current with constant inflows into continuous slope breaks. Initial conditions such as different particle size, velocity and suspended particle volume fraction were set in the simulation. Simulated results show that the averaged velocity of the turbidity current accelerates at the slope, on the nearly horizontal bed, velocity drops obviously and gradually deposits at the horizontal bed. The acceleration of turbidity current at small slope does not affect the deposition trend. The thickness of the current gradually increases due to the environmental water entrainment, and the turbidity current head shape and flow characteristics are conformed favorably with the measured data. In addition, this paper also simulates the turbidity current of multi-frequency continuous inflow, and compares the simulation results with the measured sedimentary characteristics. The results show that the deposition of multi-frequency continuous inflow turbidity current may form the superposition of several discontinuous bauma sequences on the vertical strata.


2020, 42(11): 88-99.
doi: 10.3969/j.issn.0253-4193.2020.11.009
Abstract:
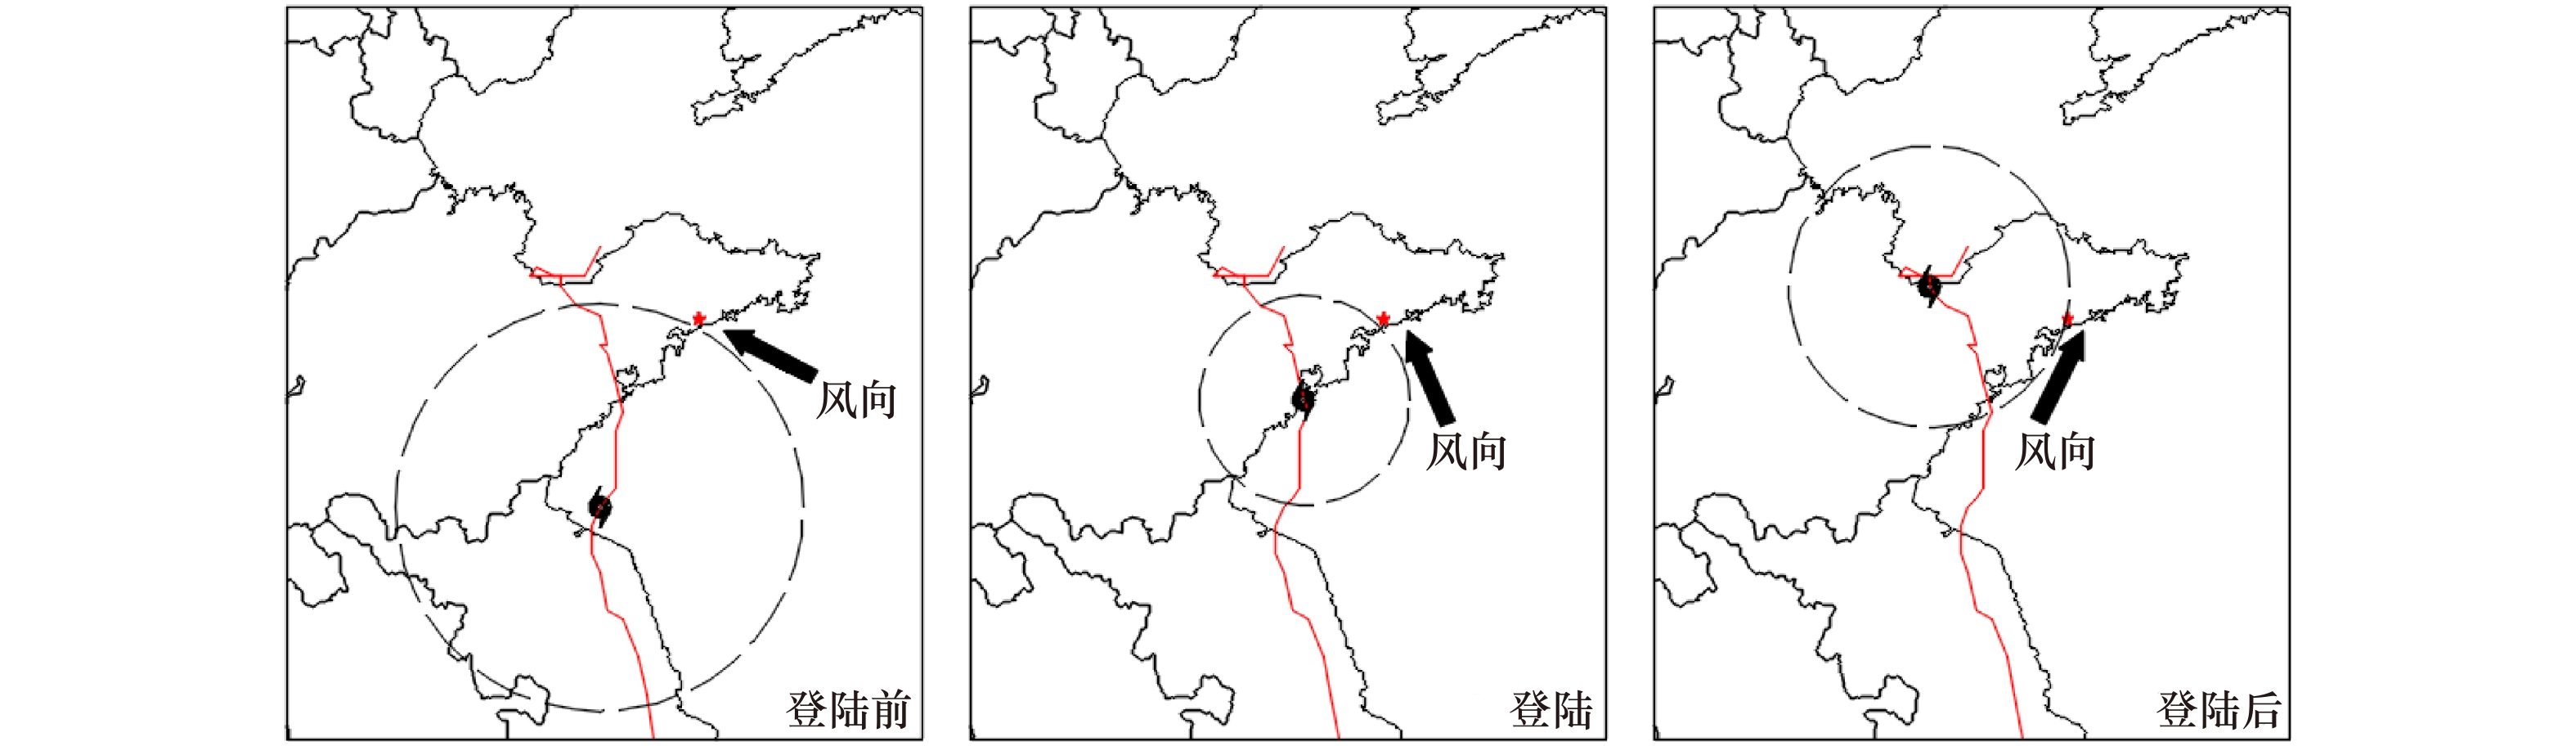
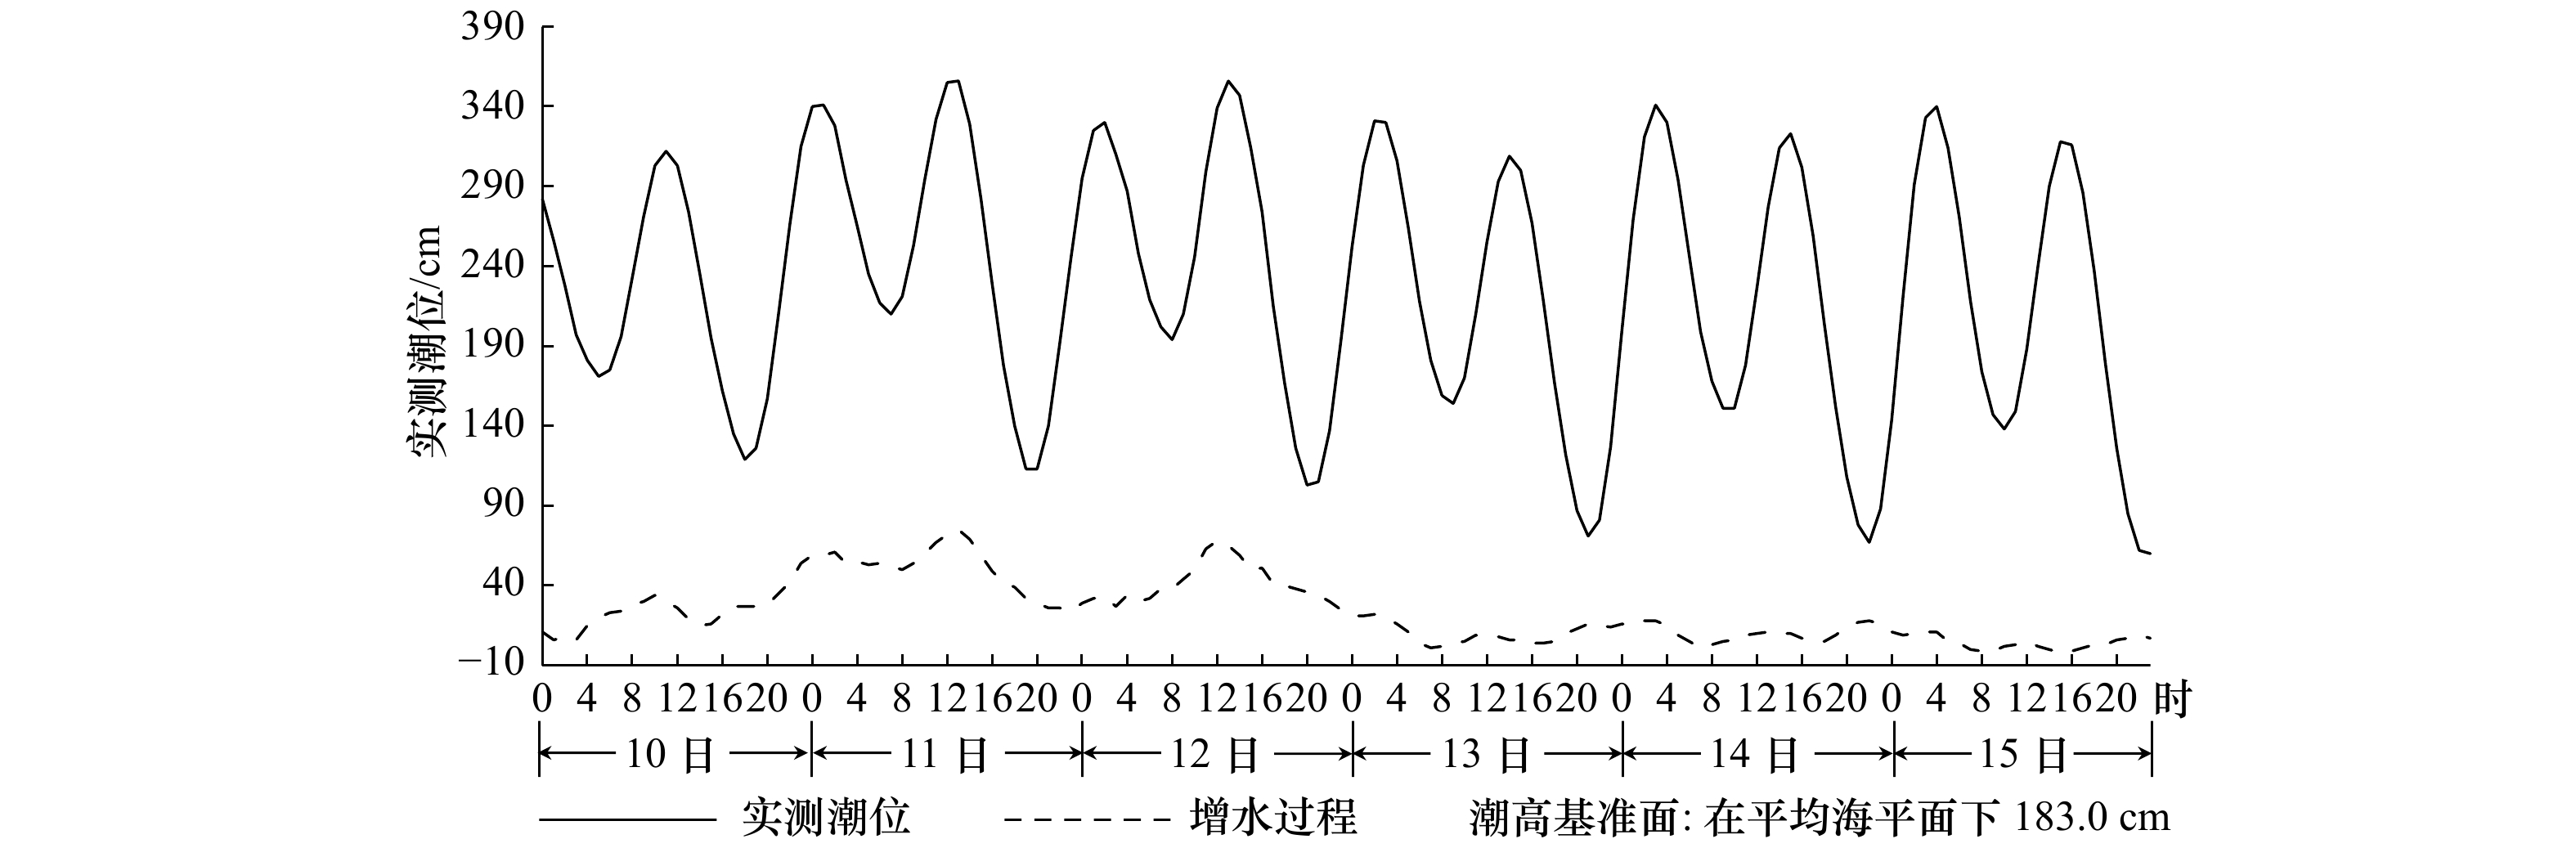
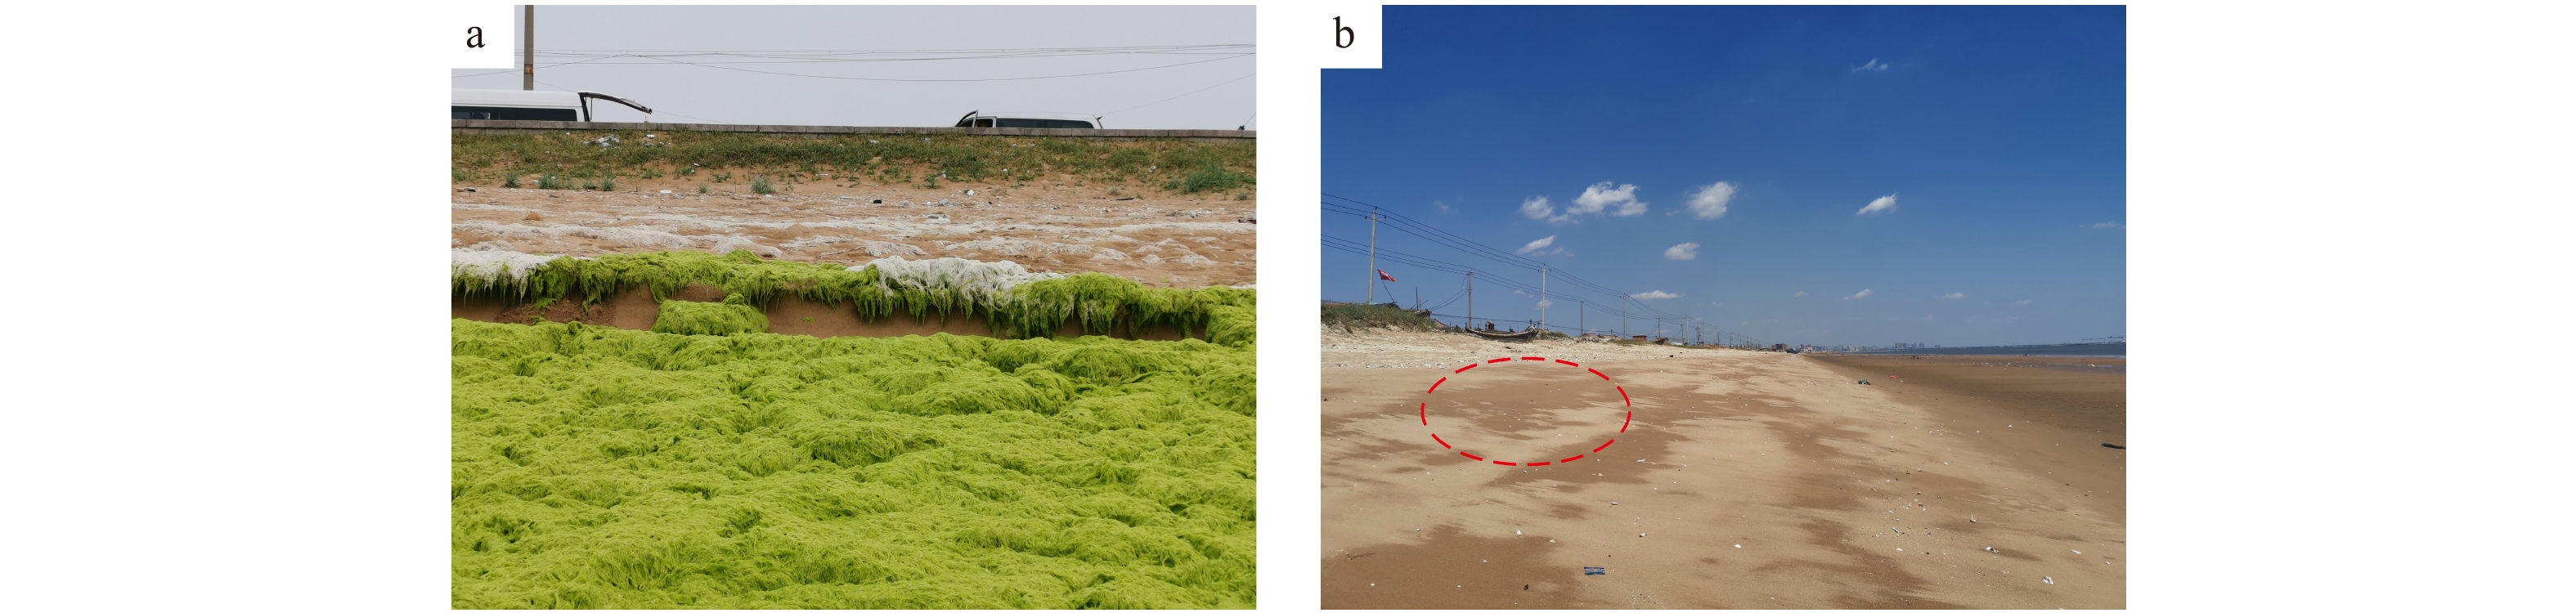
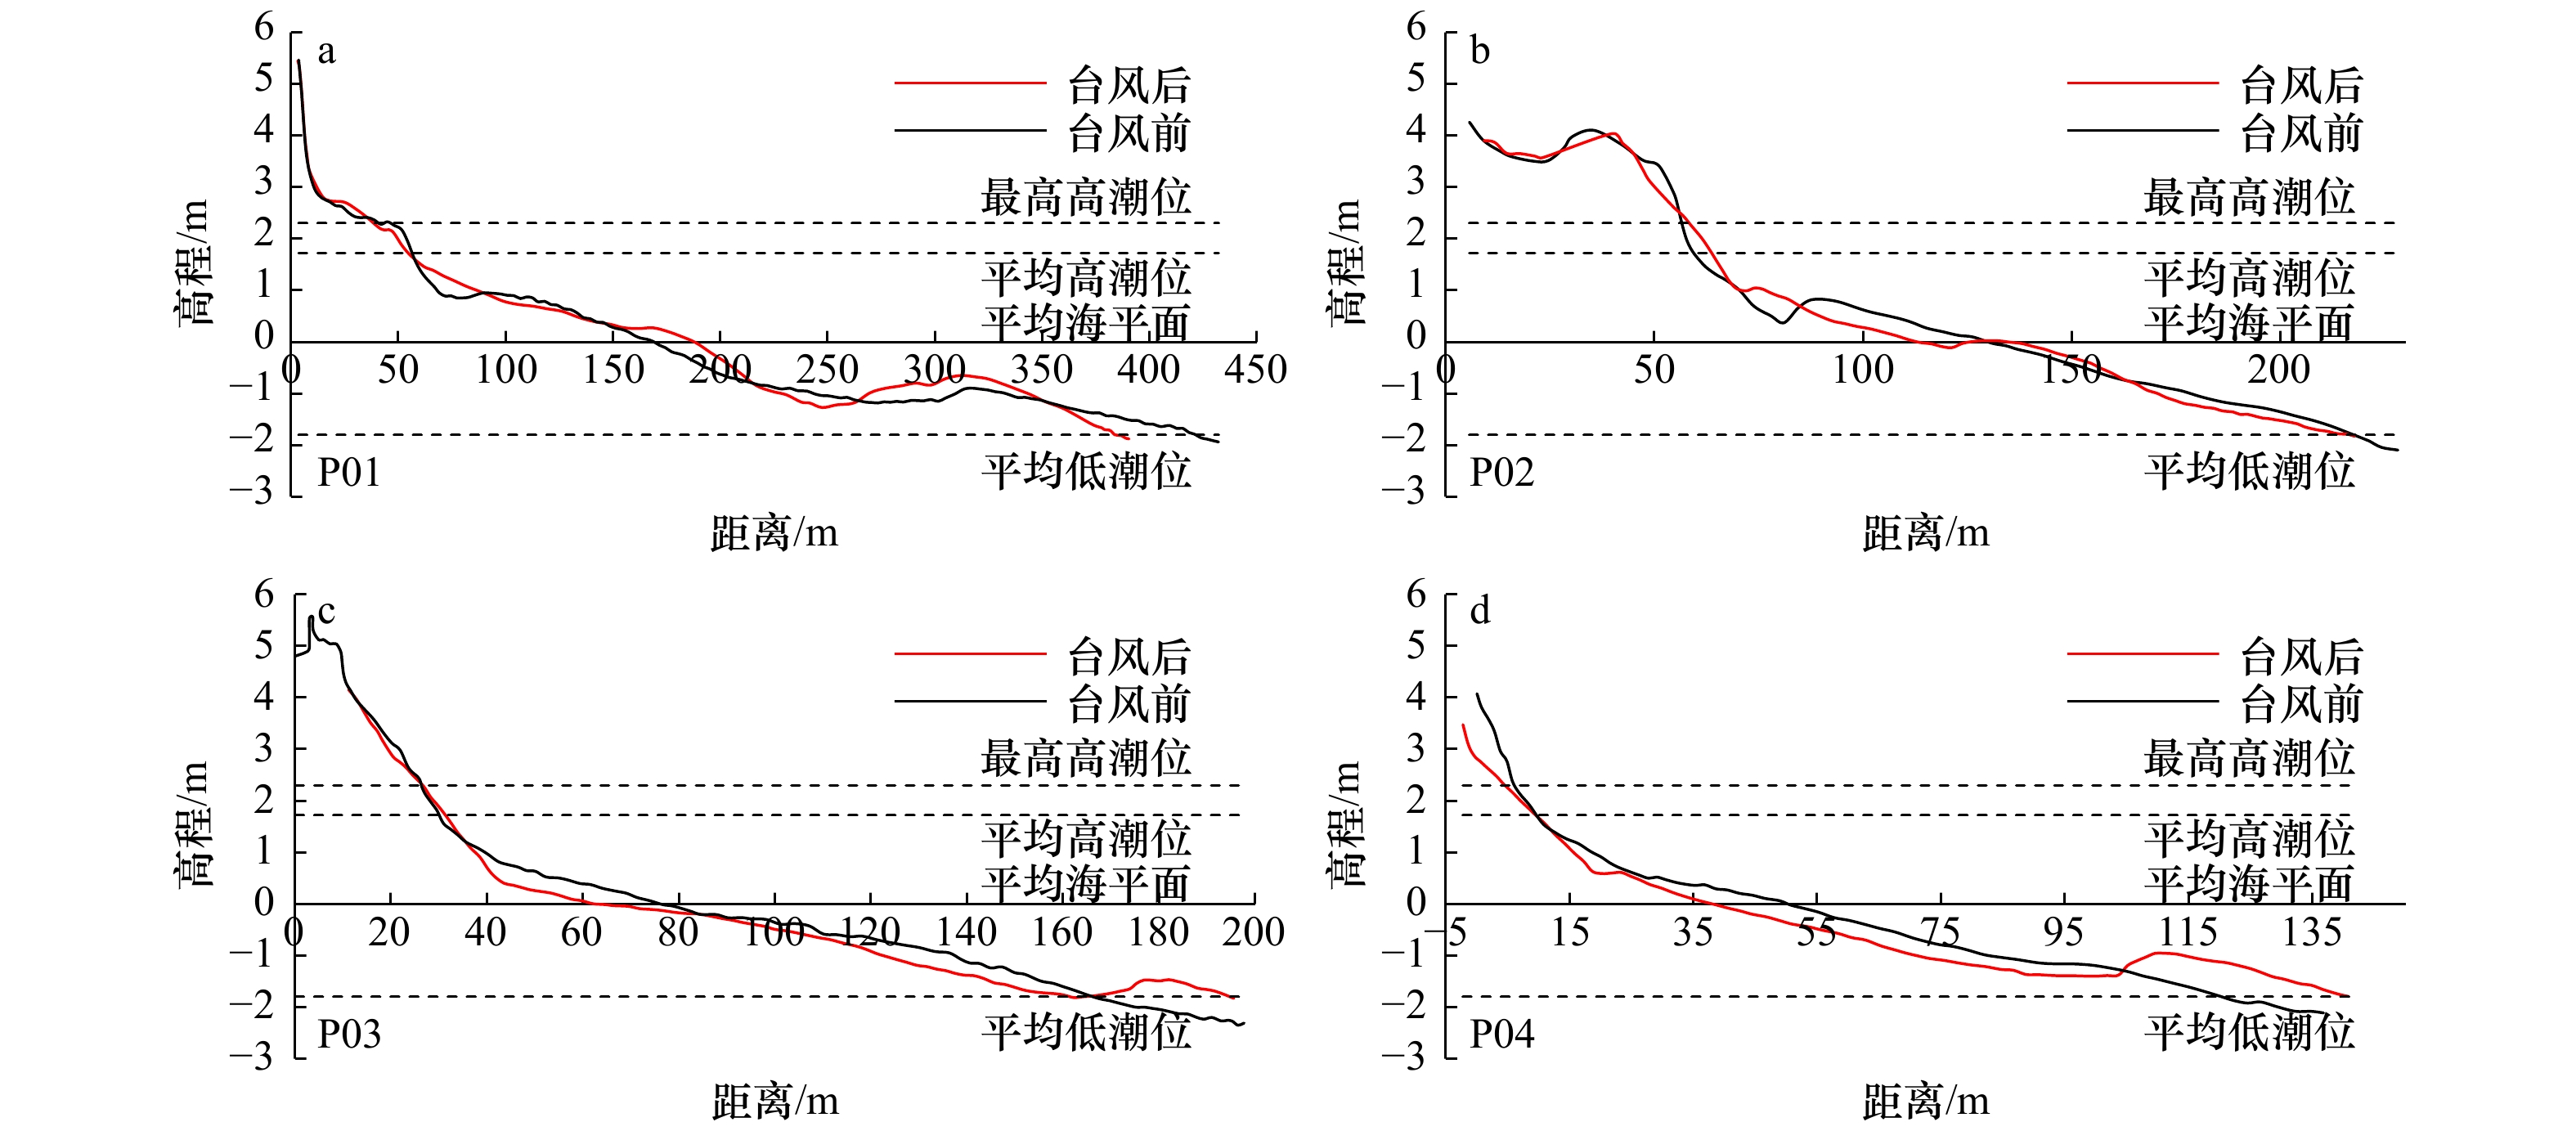
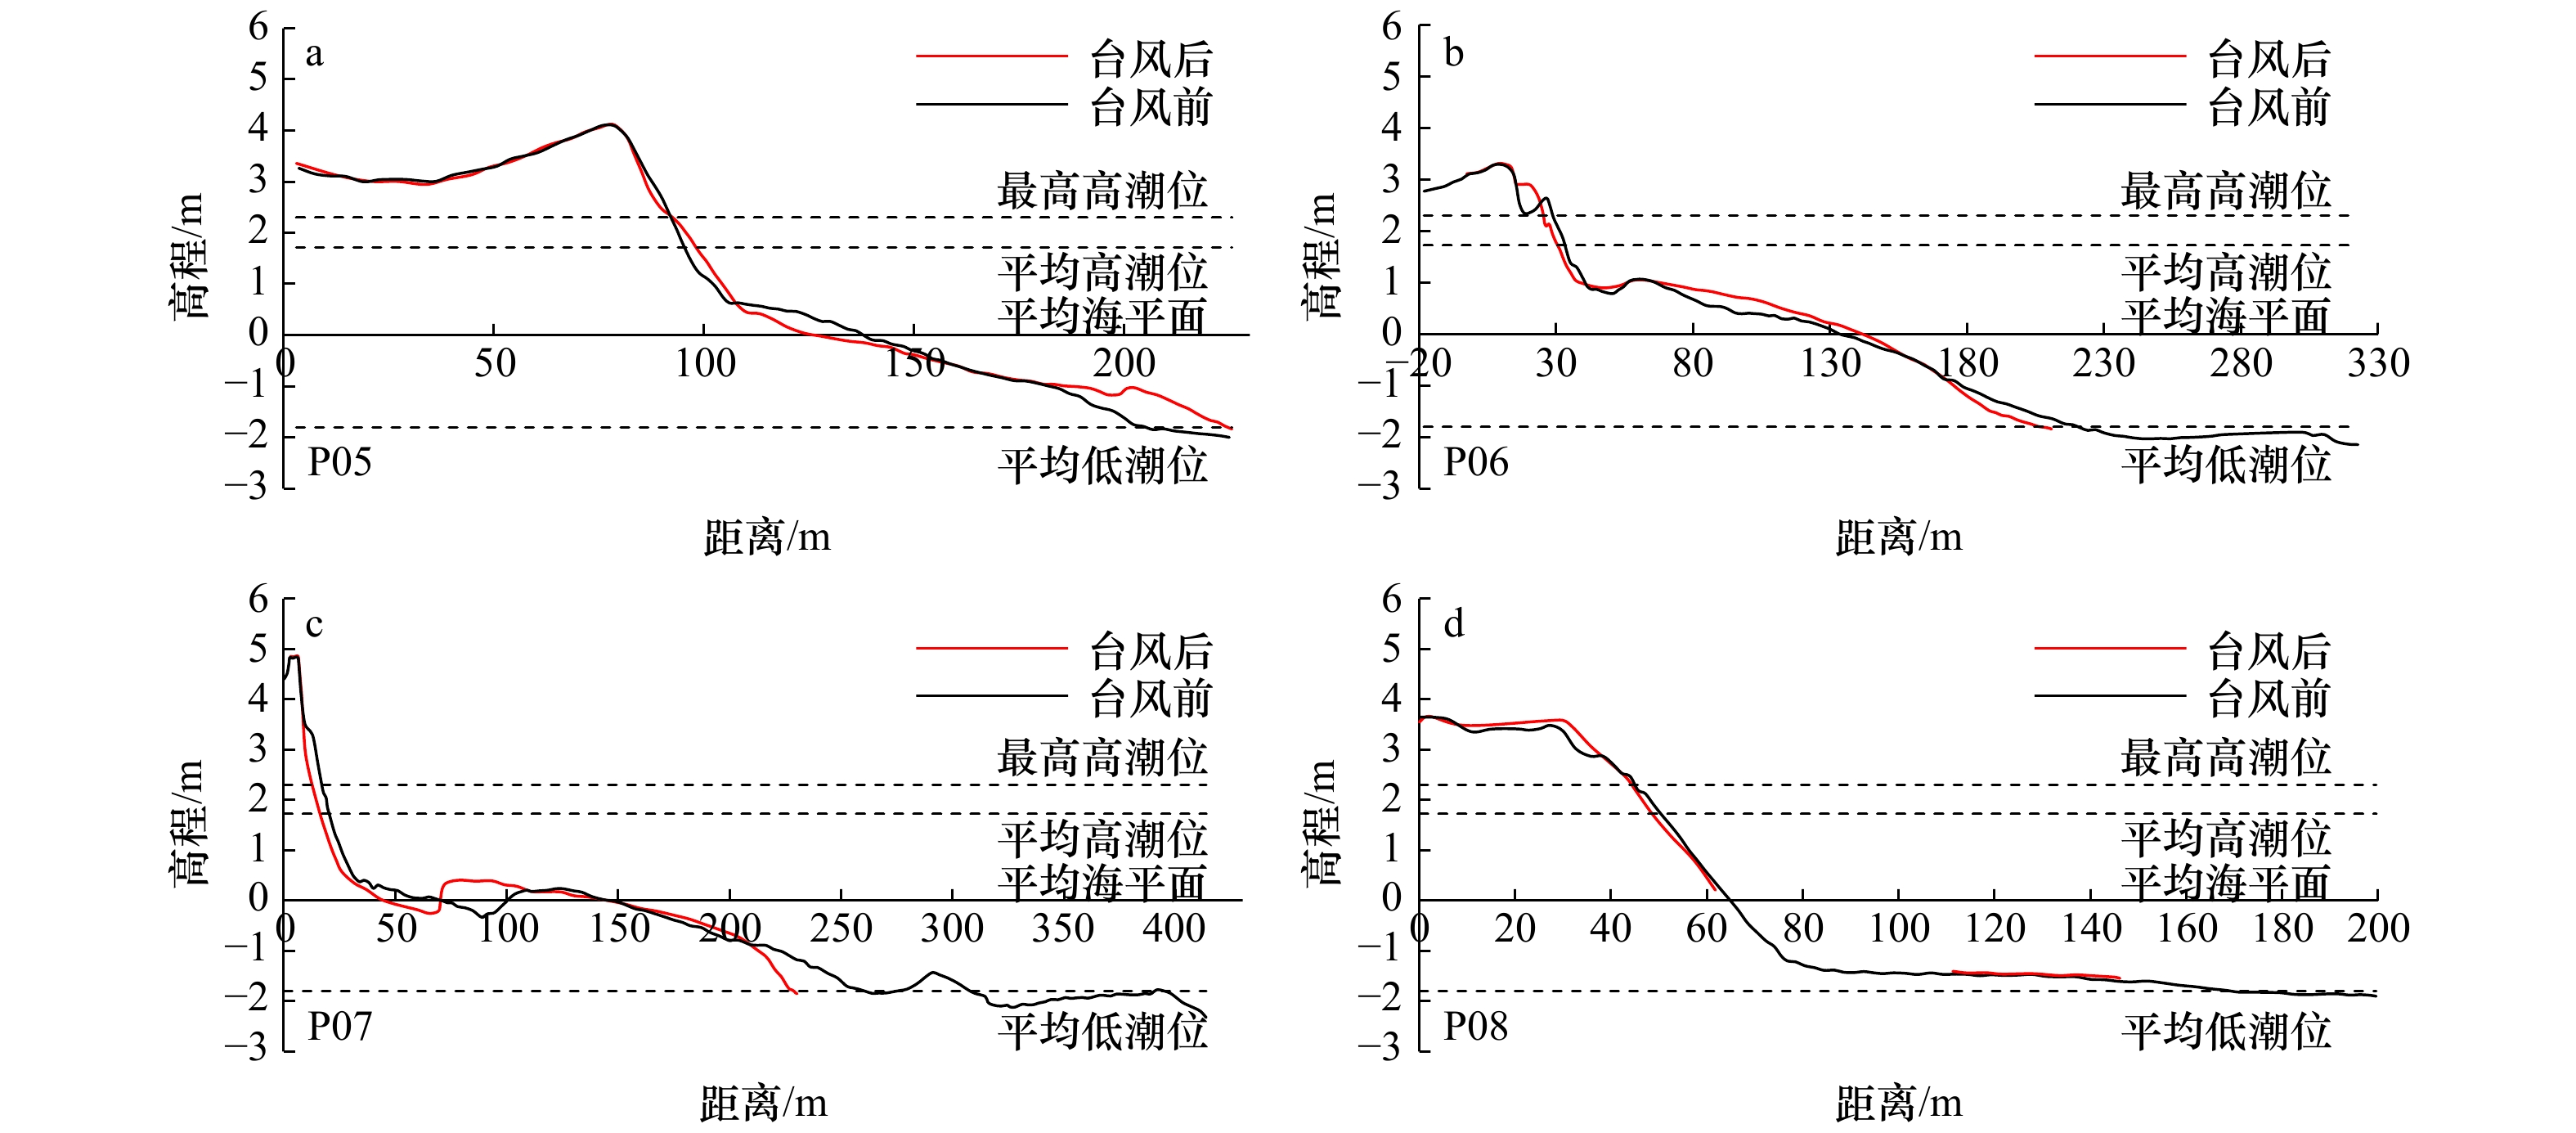
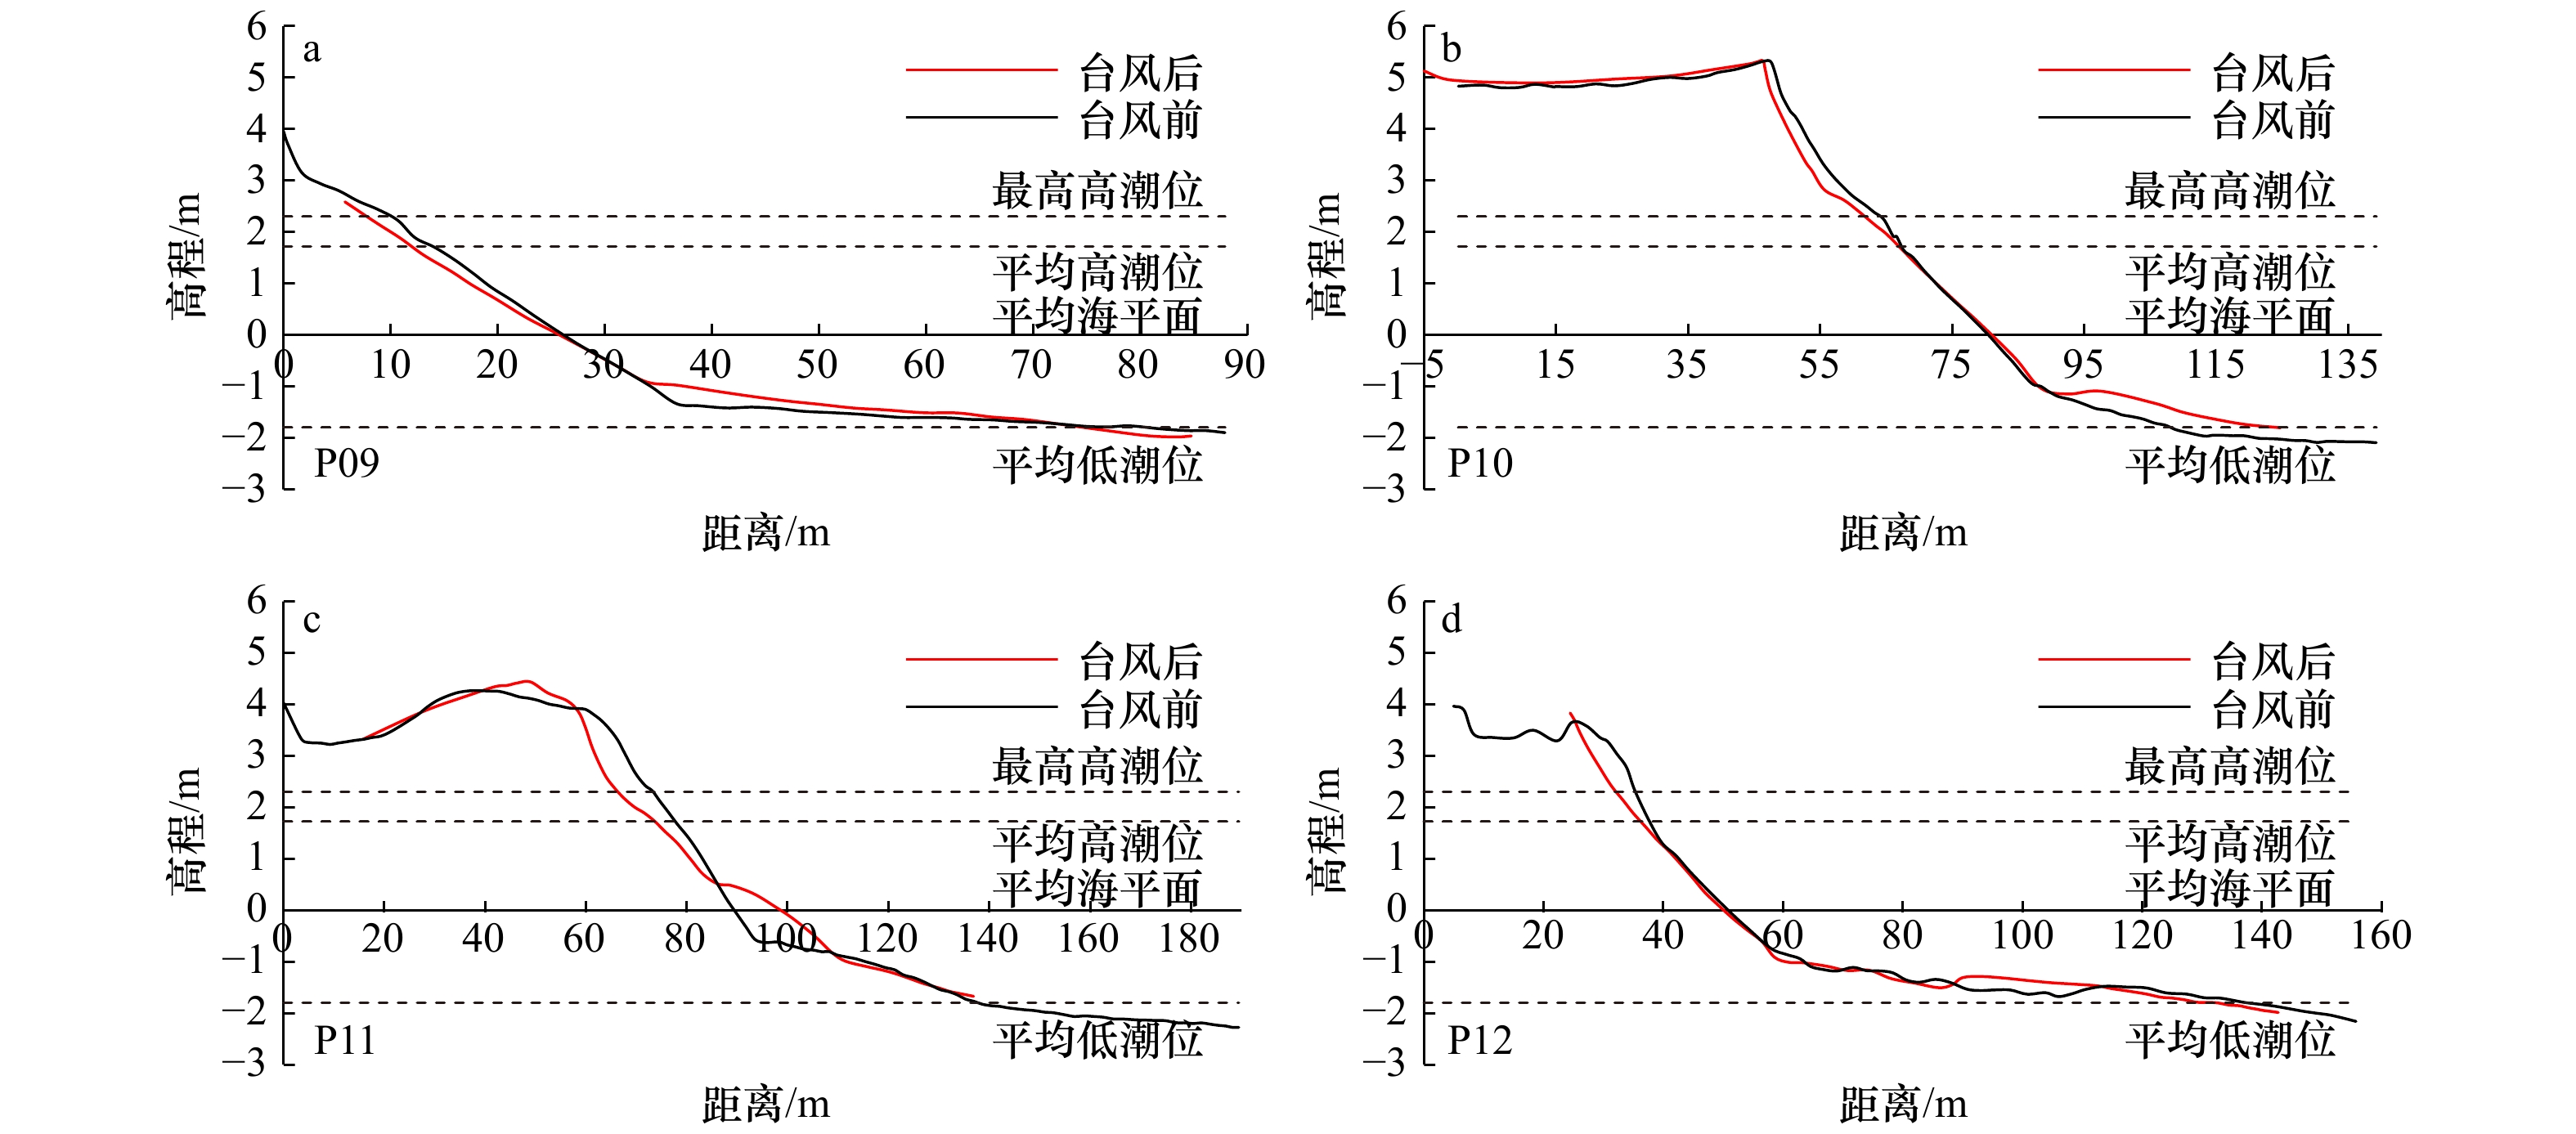
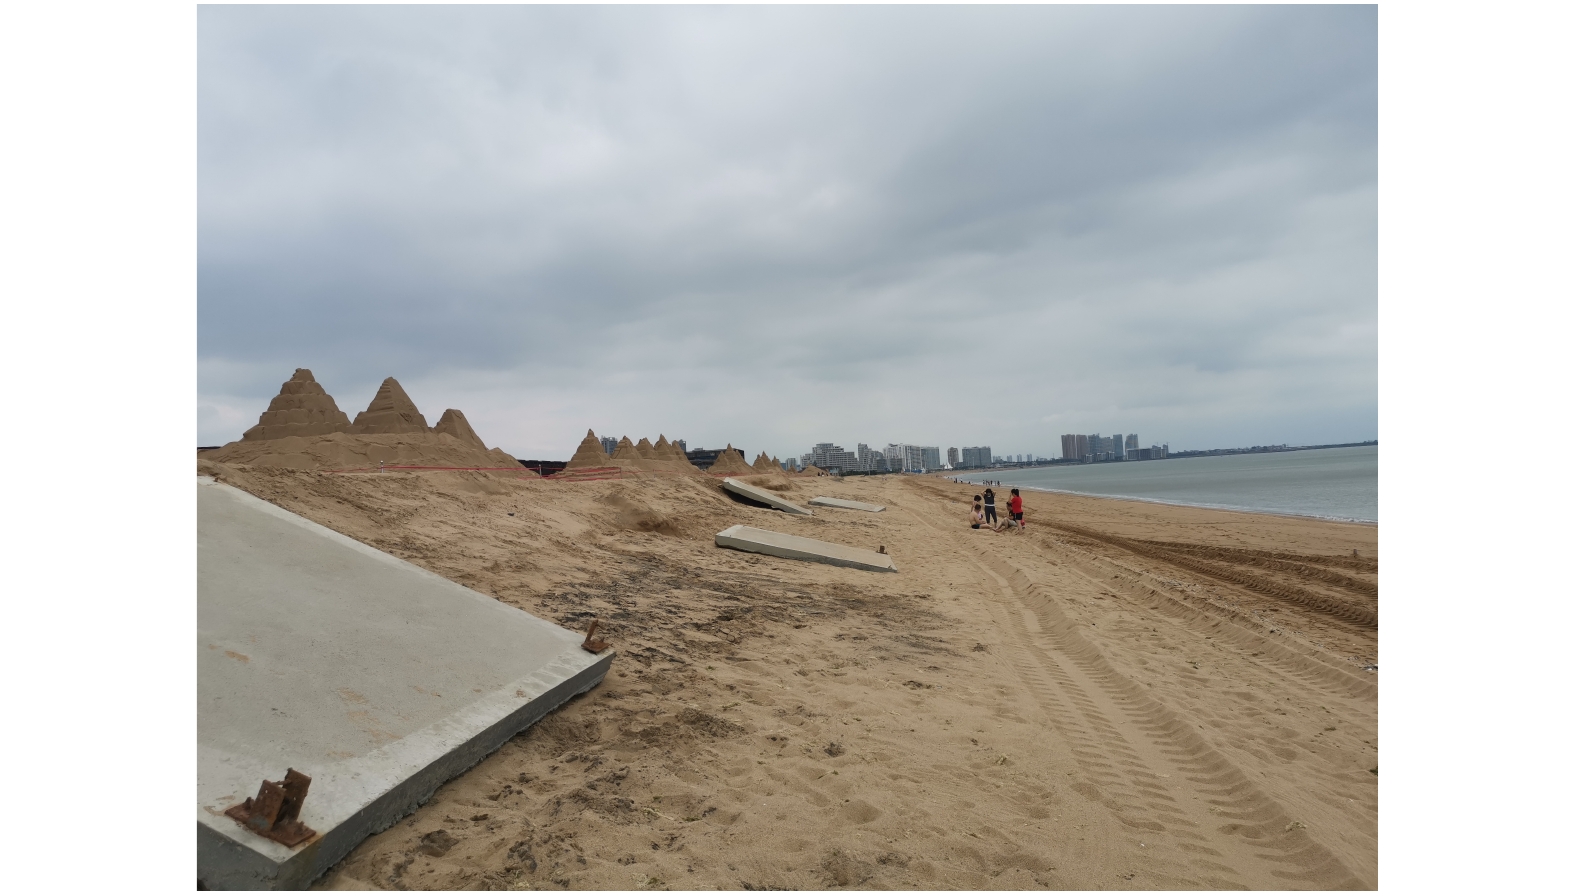
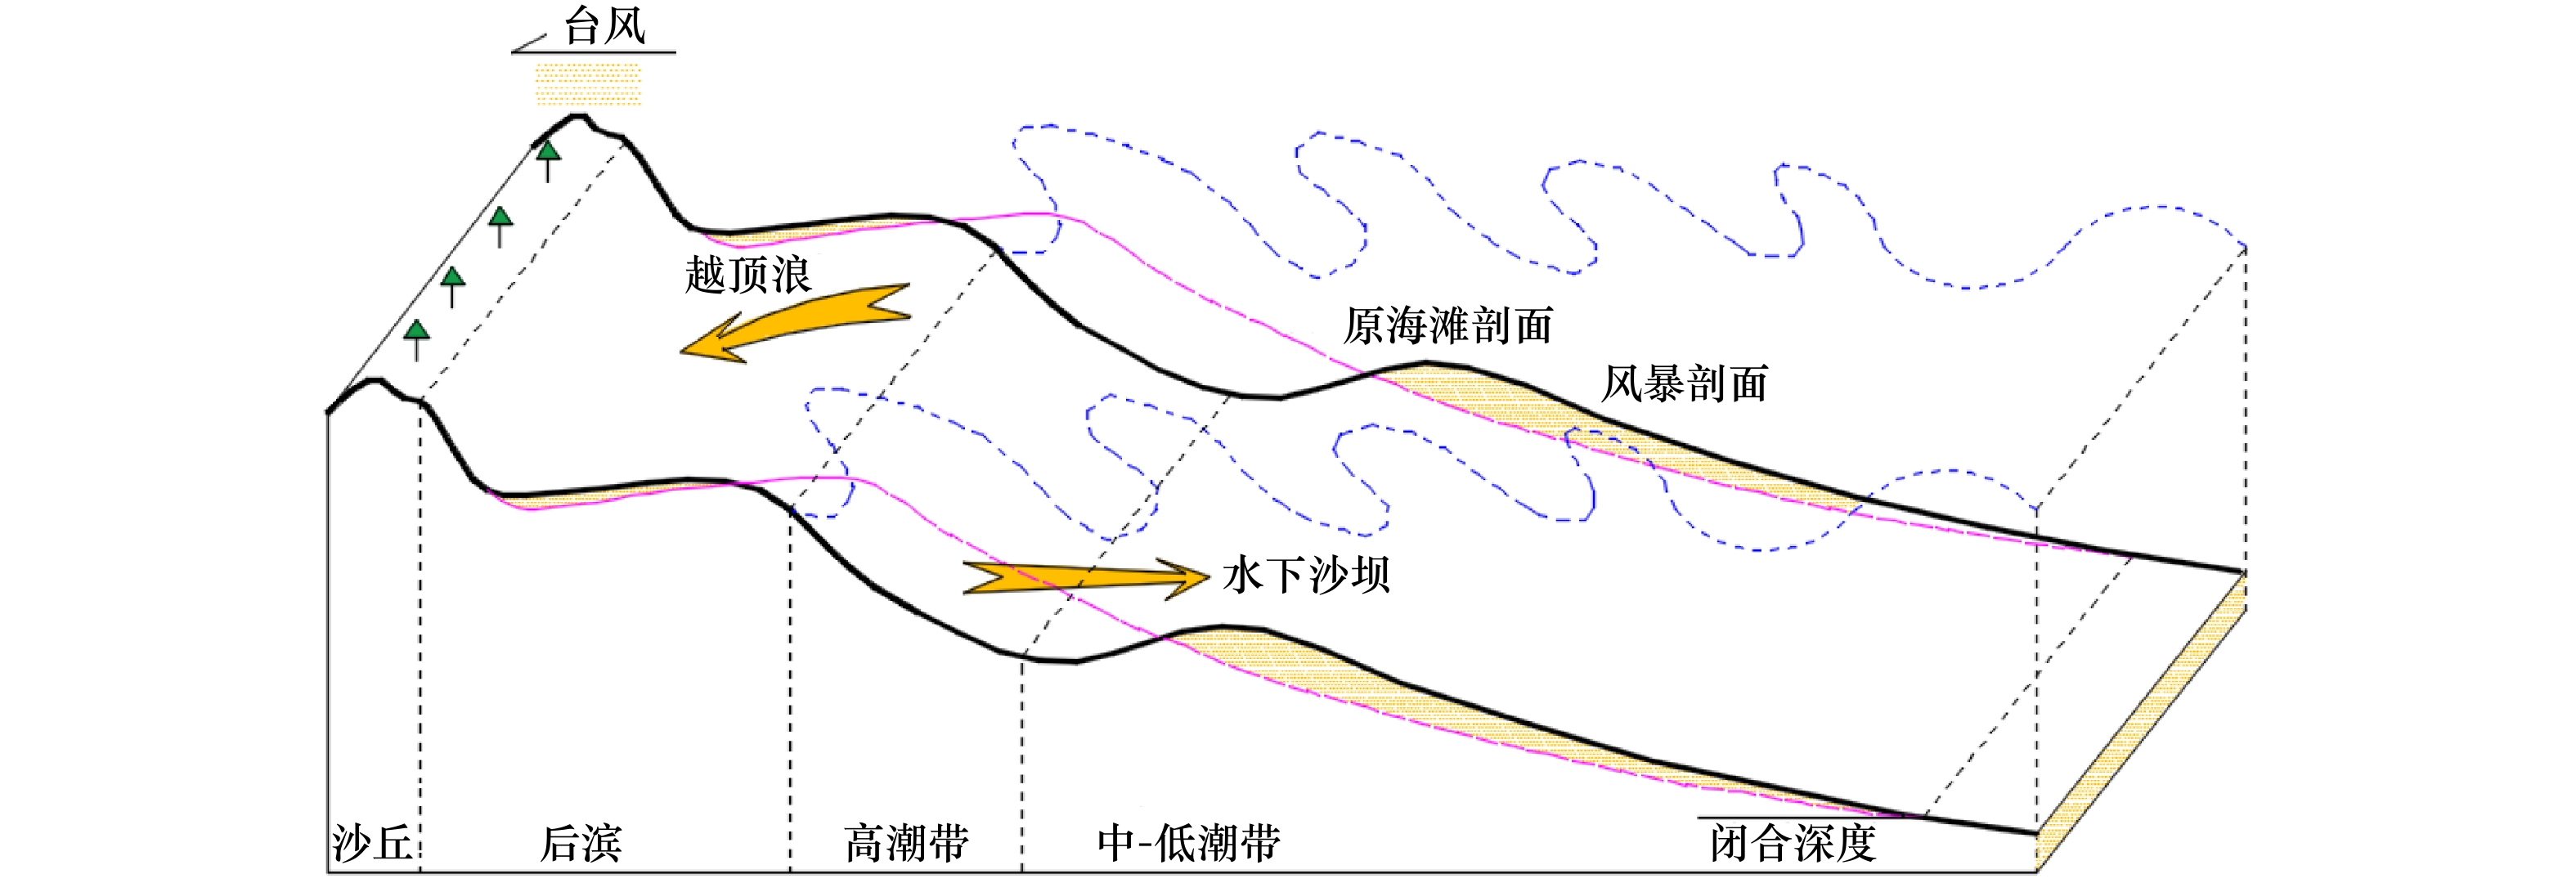
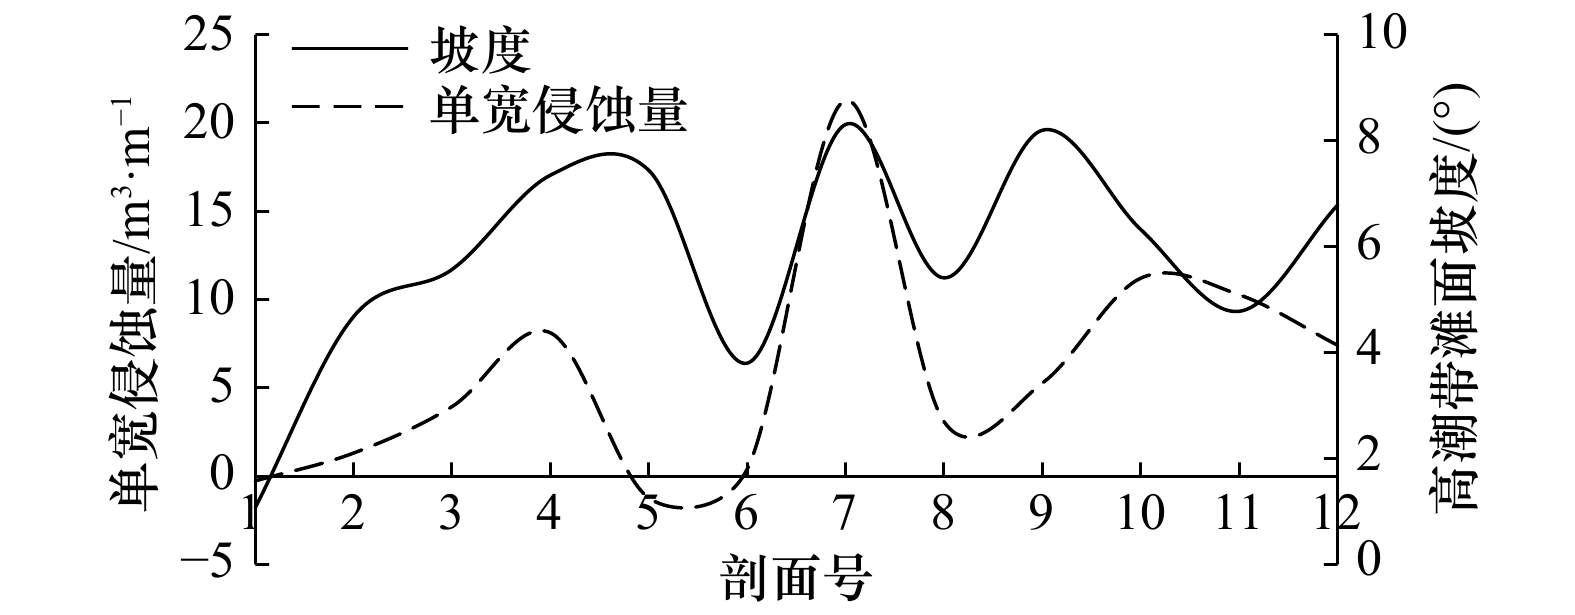
By using the beach monitoring technologies such as Unmanned Aerial Vehicle (UAV) and elevation monitoring equipment, the monitoring data of Haiyang beach before and after Typhoon Lekima (No.1909) were obtained, the morphology changes, erosion and accretion variation of beach profiles during Typhoon Lekima landing were analyzed, and the response of beach evolution to the typhoon was discussed. The result shows that beach morphology evolution after the typhoon is mainly including the expansion of the aeolian dune area, erosion of the beach surface in the high-middle tidal zone, micro-topography disappearance and so on. The typhoon mainly affected the beach by erosion, resulting in an erosion volume about 2.43×10⁴ m3, which mainly occurred on the high tide zone. The aeolian dunes were weakly silted, but some of them were eroded seriously. The backshore was weakly silted because of sand deposition from strong wind and alluvial flow. In the middle and low tide zones, beach morphology changes were mainly controlled by the beach surfaces lope, which was manifested as erosion with high slope, weak deposition with low slope, and several small sandbanks formed after the typhoon. On the whole, the typhoon impacts on the beach evolution mainly lead to the sediment budget deficit, and further exacerbated the erosion of Haiyang beach.
By using the beach monitoring technologies such as Unmanned Aerial Vehicle (UAV) and elevation monitoring equipment, the monitoring data of Haiyang beach before and after Typhoon Lekima (No.1909) were obtained, the morphology changes, erosion and accretion variation of beach profiles during Typhoon Lekima landing were analyzed, and the response of beach evolution to the typhoon was discussed. The result shows that beach morphology evolution after the typhoon is mainly including the expansion of the aeolian dune area, erosion of the beach surface in the high-middle tidal zone, micro-topography disappearance and so on. The typhoon mainly affected the beach by erosion, resulting in an erosion volume about 2.43×10⁴ m3, which mainly occurred on the high tide zone. The aeolian dunes were weakly silted, but some of them were eroded seriously. The backshore was weakly silted because of sand deposition from strong wind and alluvial flow. In the middle and low tide zones, beach morphology changes were mainly controlled by the beach surfaces lope, which was manifested as erosion with high slope, weak deposition with low slope, and several small sandbanks formed after the typhoon. On the whole, the typhoon impacts on the beach evolution mainly lead to the sediment budget deficit, and further exacerbated the erosion of Haiyang beach.


2020, 42(11): 100-111.
doi: 10.3969/j.issn.0253-4193.2020.11.010
Abstract:
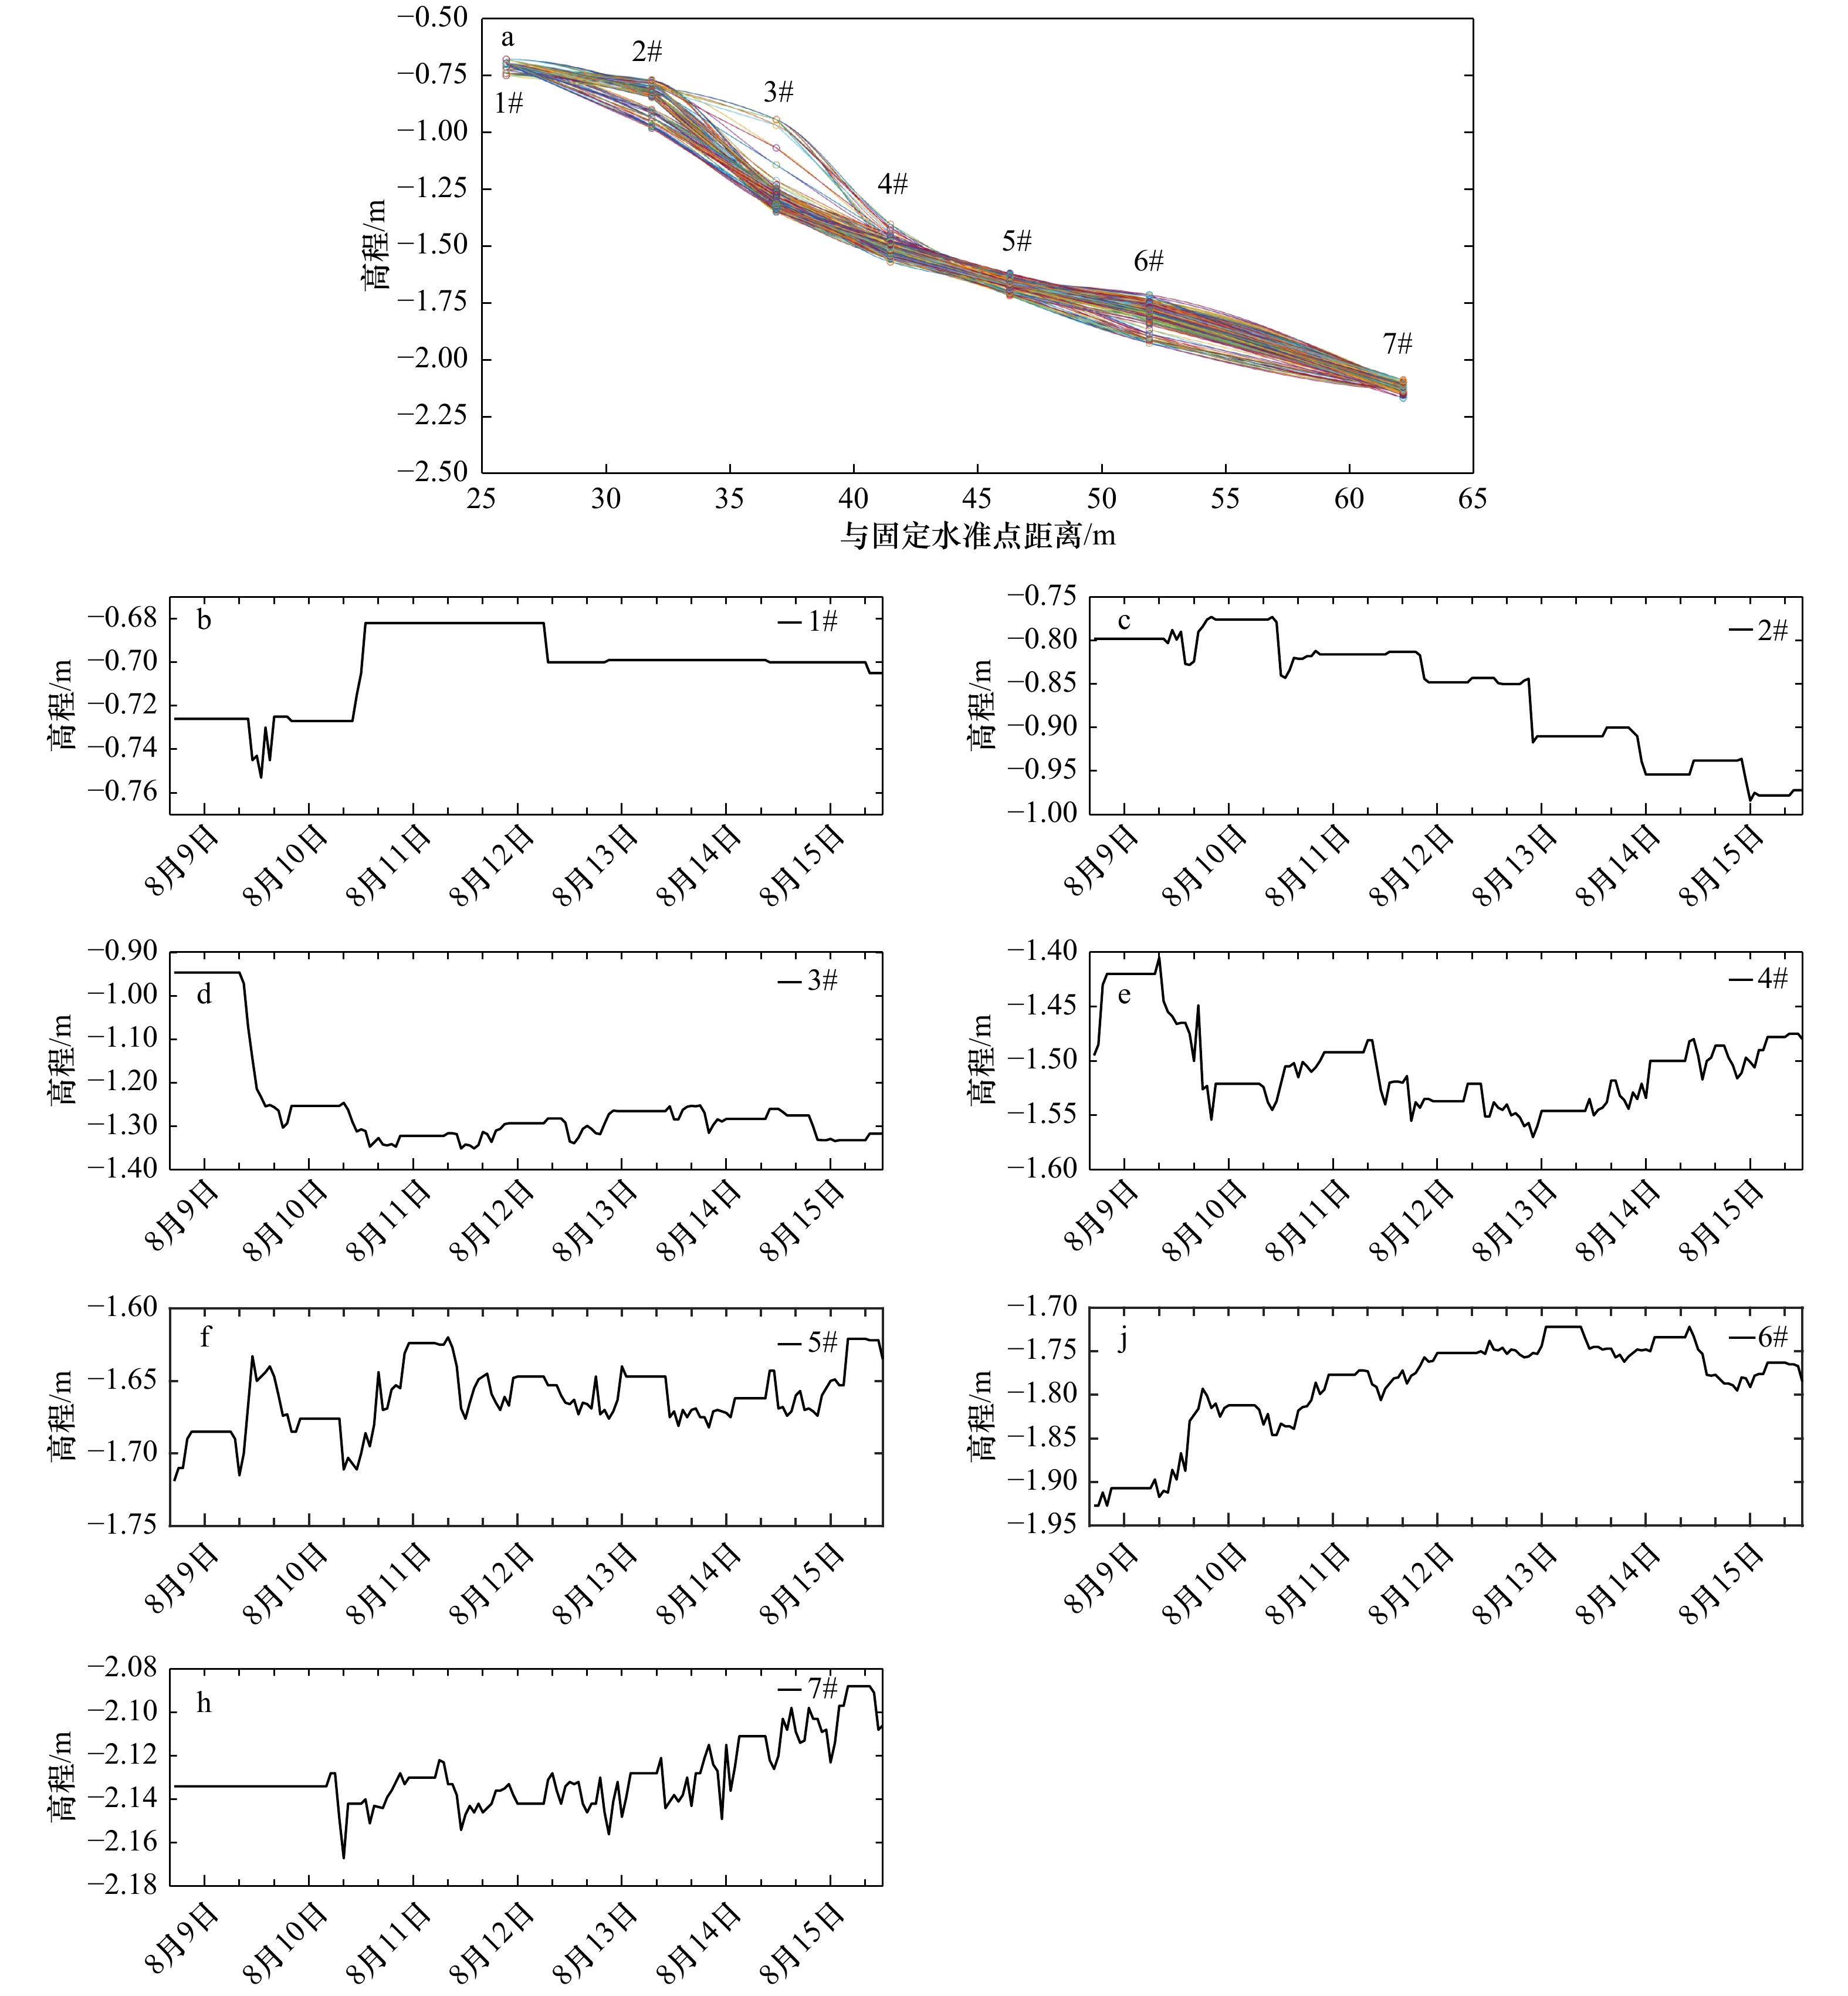
Tropical cyclone is one of the most active dynamic factors for beach evolution. However, there are few field observations of beach during storms due to terrible working conditions. In this paper, 6 and a half days of high-frequency observation during the Typhoon Bebinca was conducted at the Qing’an Bay beach. The observation data included full-time hydrodynamics and 164 groups hourly variation of beach surface elevation. Three main analysis results were identified: (1) Controlled by the spatial distribution of Hainan Island-Leizhou Peninsula and the changeable track of the Typhoon Bebinca, the storm surge was maintained between 0.38−0.5 m, the wave height first decreased from 0.78 m to 0.43 m and then increased to 0.56 m. (2) The beach berm was eroded and a sand bar was formed under the water. There were three response stages of the beach berm during the Typhoon Bebinca, eroded downward fast, eroded slowly to the maximum, and recovered by oscillating deposition. The recovery amplitude could reach one quarter of the maximum erosion depth during the Typhoon Bebinca. (3) The response process of the Qing'an Bay beach to Typhoon Bebinca was mainly composed of four modes. The first mode reflected the erosion process of the spring tidal beach berm and the formation of the sand bar. The second mode indicated the erosion of the storm beach berm, the compensatory recovery of the spring tidal beach berm and the growth of the sand bar. The third mode revealed the bilateral transport process of sediment caused by the uprush and undertow at the secondary breaking position of waves. The fourth mode showed that the strong waves suspended the sediment in the surf zone, and some of the suspended sediment which was transported to the deep-water area by littoral current and offshore current may lost permanently.
Tropical cyclone is one of the most active dynamic factors for beach evolution. However, there are few field observations of beach during storms due to terrible working conditions. In this paper, 6 and a half days of high-frequency observation during the Typhoon Bebinca was conducted at the Qing’an Bay beach. The observation data included full-time hydrodynamics and 164 groups hourly variation of beach surface elevation. Three main analysis results were identified: (1) Controlled by the spatial distribution of Hainan Island-Leizhou Peninsula and the changeable track of the Typhoon Bebinca, the storm surge was maintained between 0.38−0.5 m, the wave height first decreased from 0.78 m to 0.43 m and then increased to 0.56 m. (2) The beach berm was eroded and a sand bar was formed under the water. There were three response stages of the beach berm during the Typhoon Bebinca, eroded downward fast, eroded slowly to the maximum, and recovered by oscillating deposition. The recovery amplitude could reach one quarter of the maximum erosion depth during the Typhoon Bebinca. (3) The response process of the Qing'an Bay beach to Typhoon Bebinca was mainly composed of four modes. The first mode reflected the erosion process of the spring tidal beach berm and the formation of the sand bar. The second mode indicated the erosion of the storm beach berm, the compensatory recovery of the spring tidal beach berm and the growth of the sand bar. The third mode revealed the bilateral transport process of sediment caused by the uprush and undertow at the secondary breaking position of waves. The fourth mode showed that the strong waves suspended the sediment in the surf zone, and some of the suspended sediment which was transported to the deep-water area by littoral current and offshore current may lost permanently.


2020, 42(11): 112-122.
doi: 10.3969/j.issn.0253-4193.2020.11.011
Abstract:
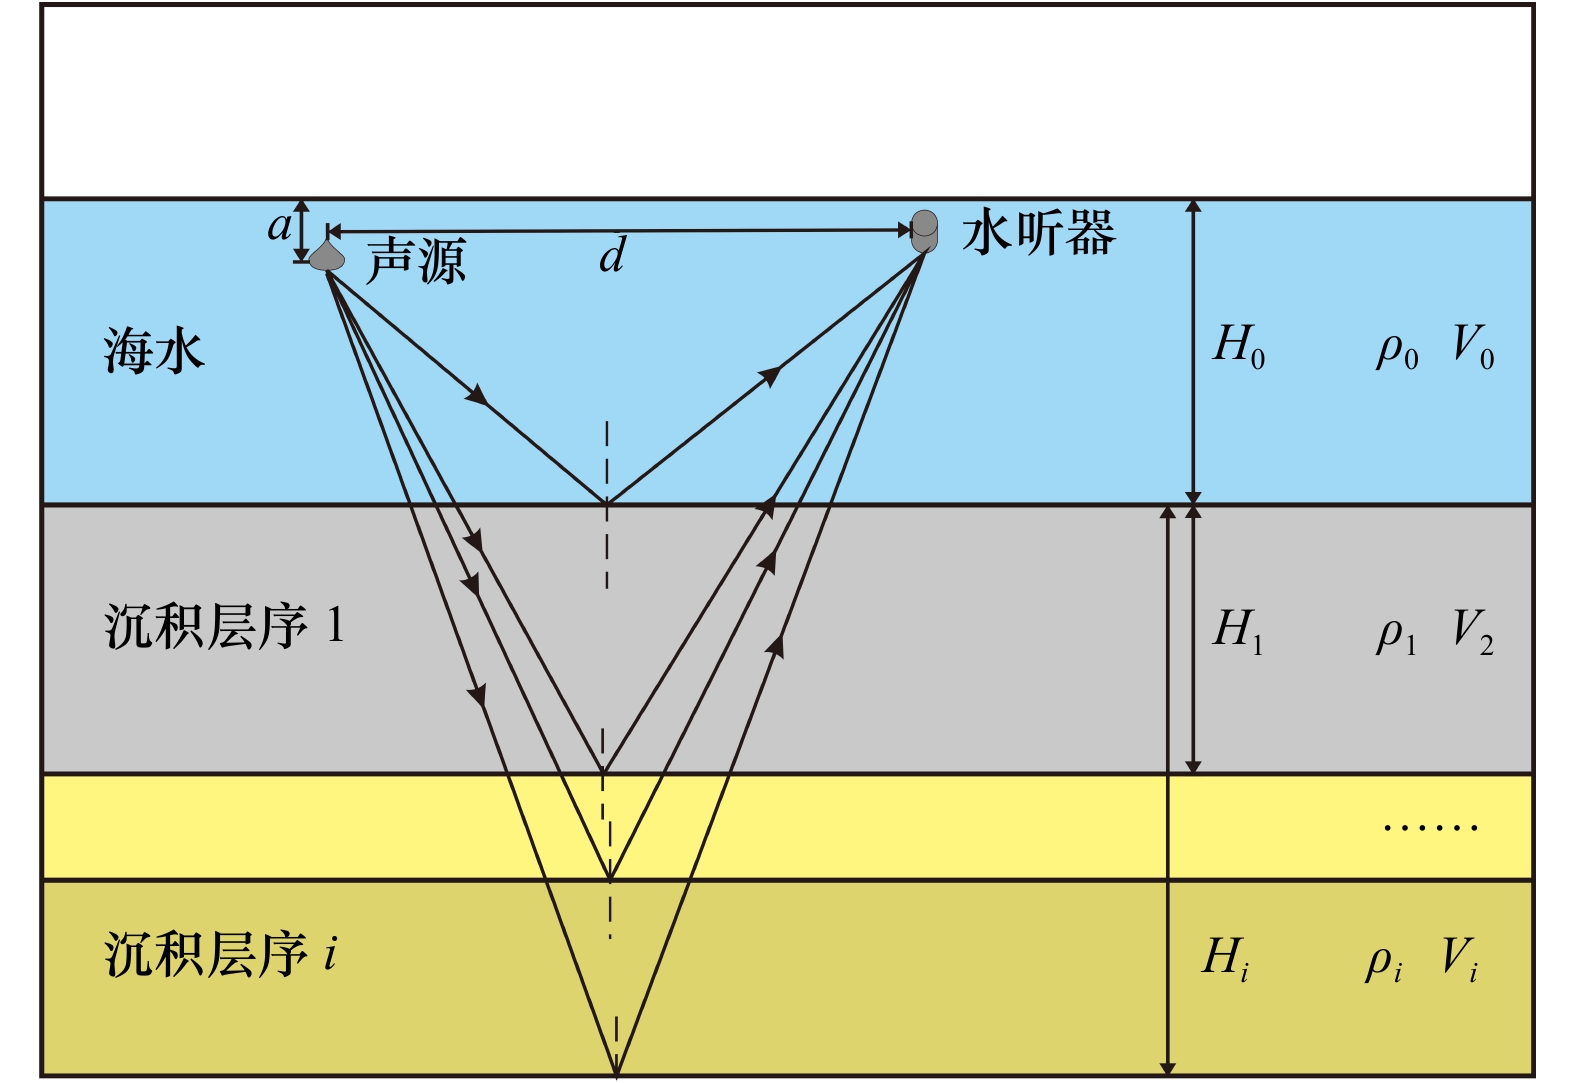
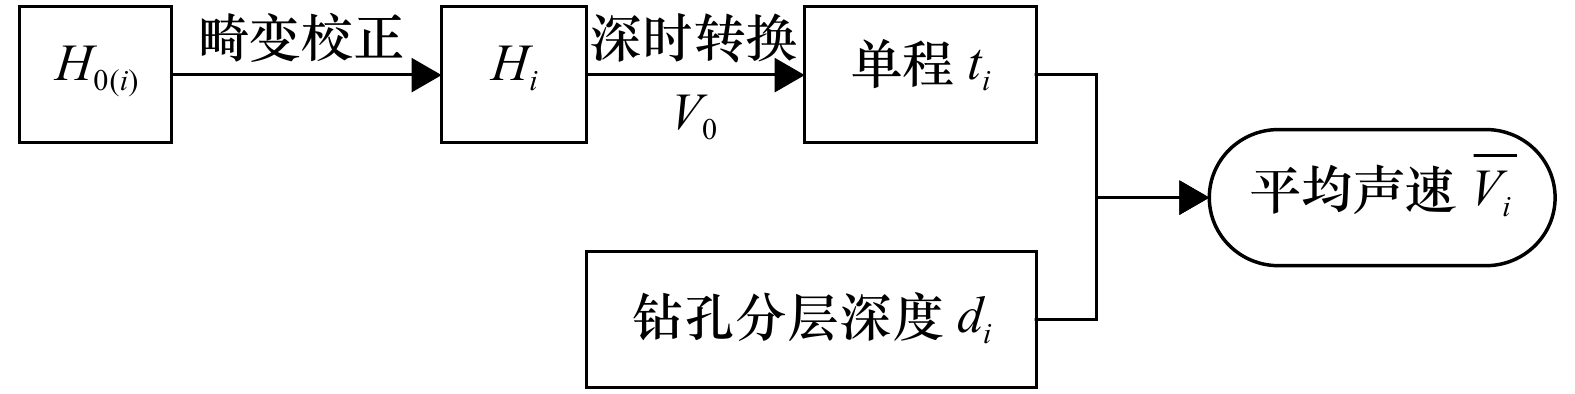
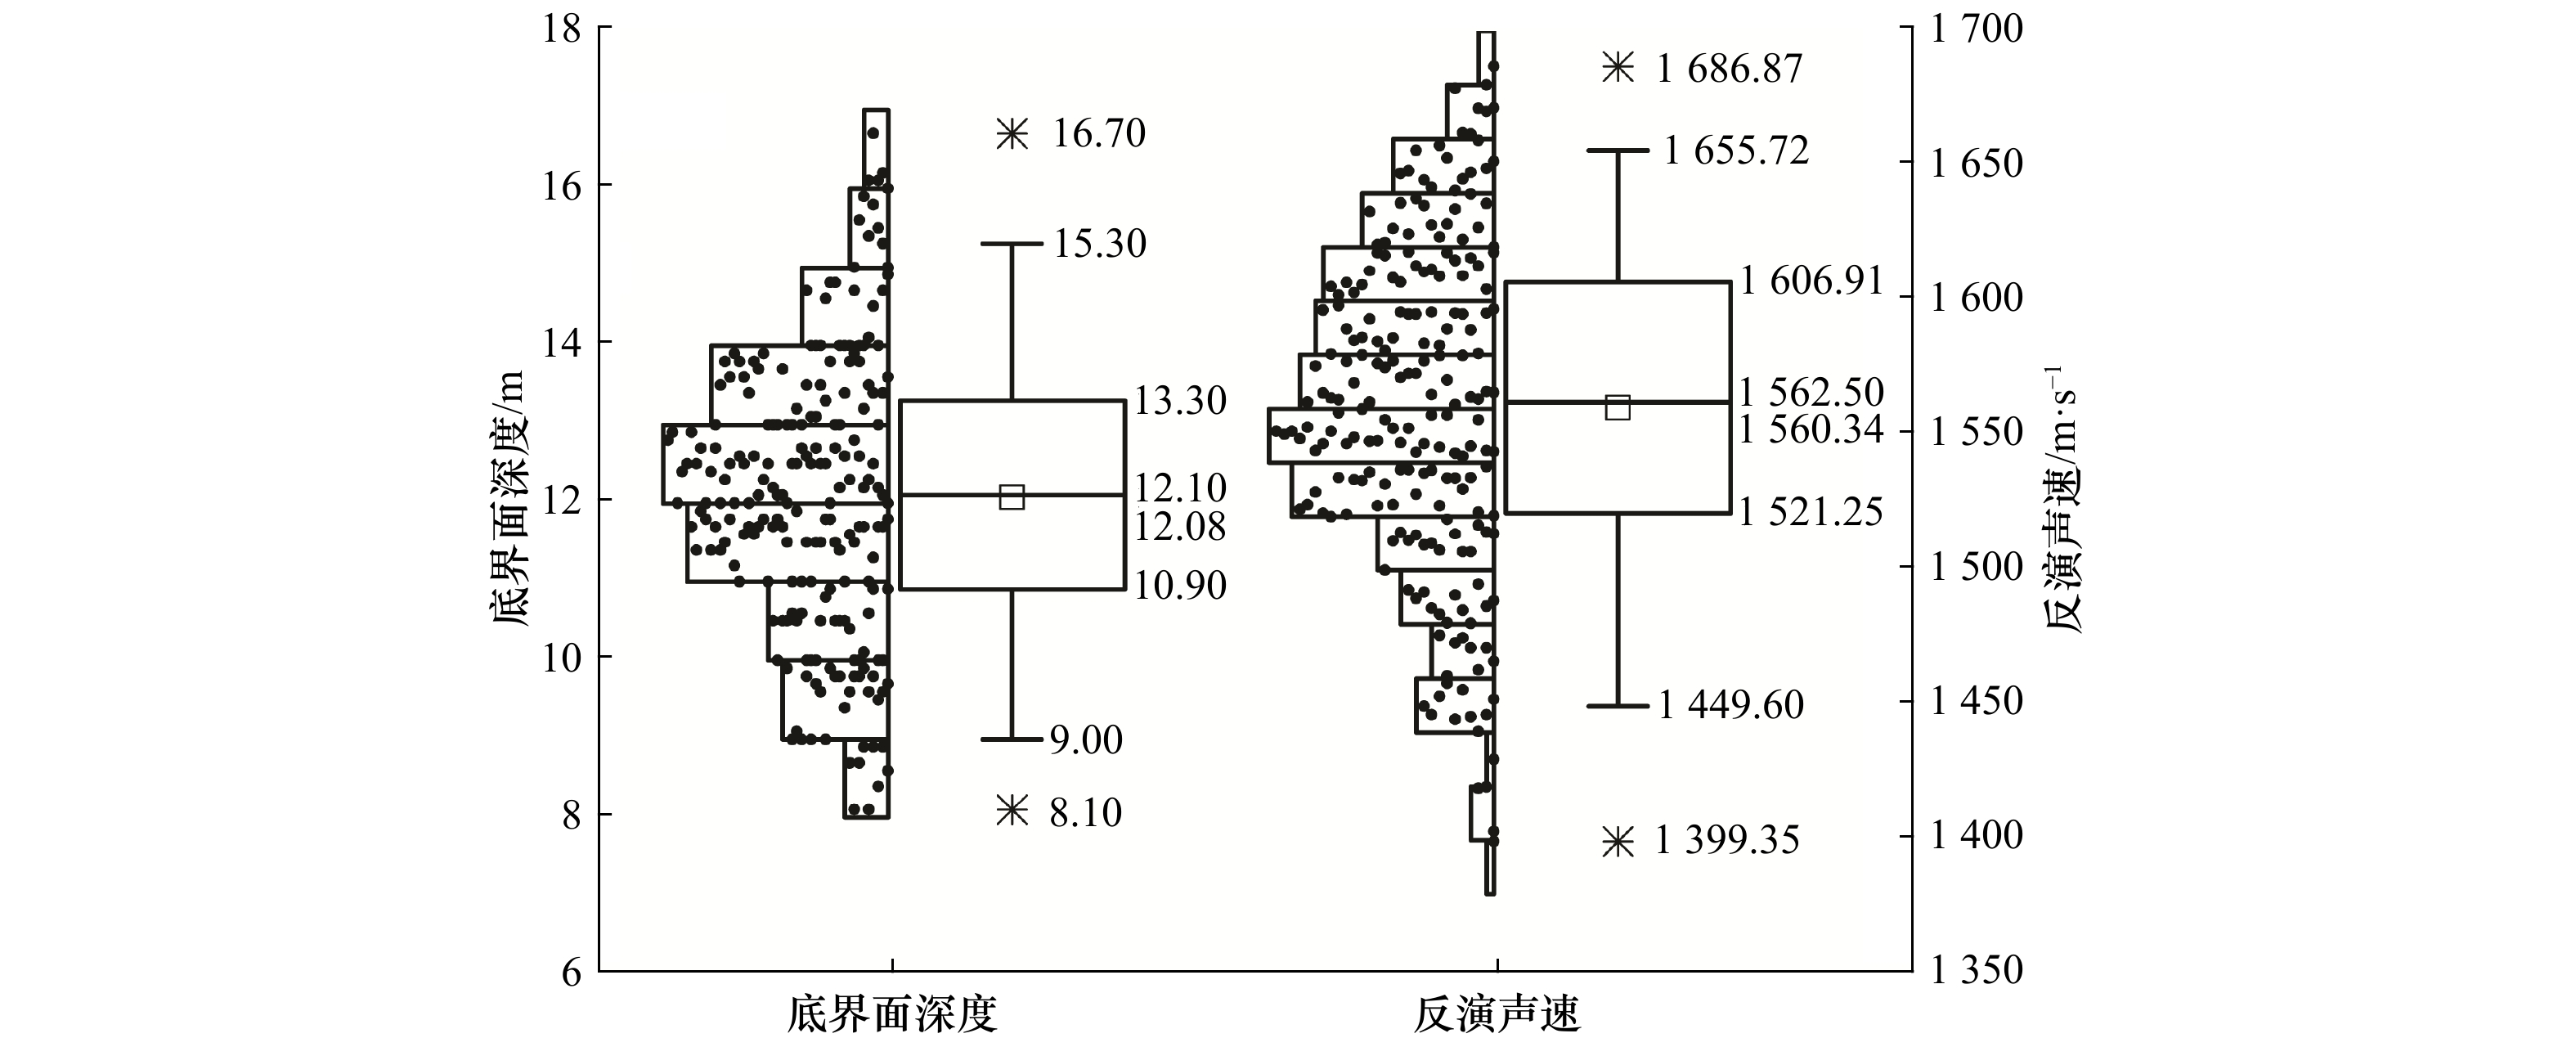
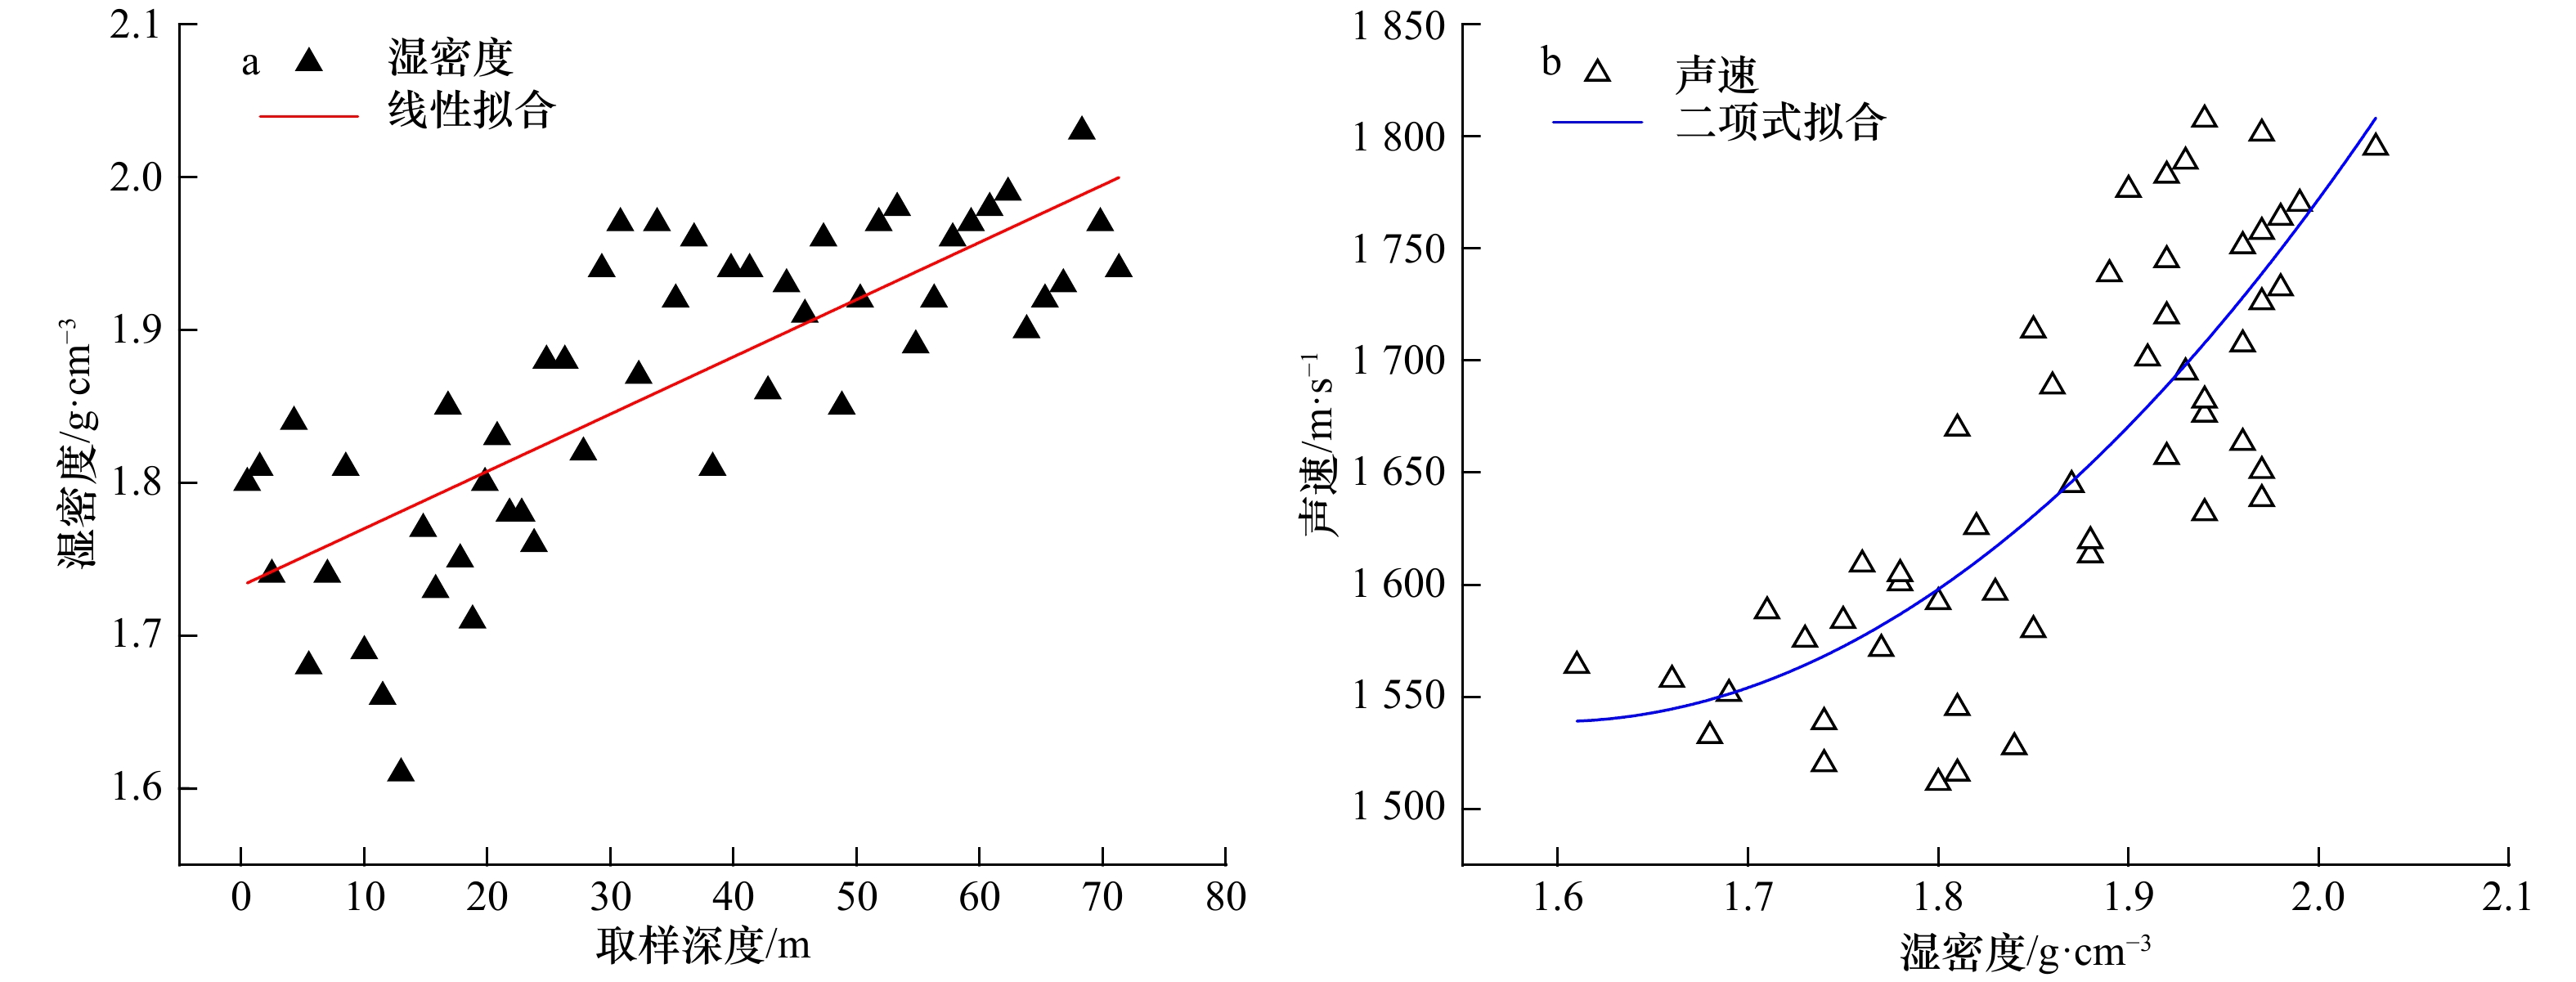
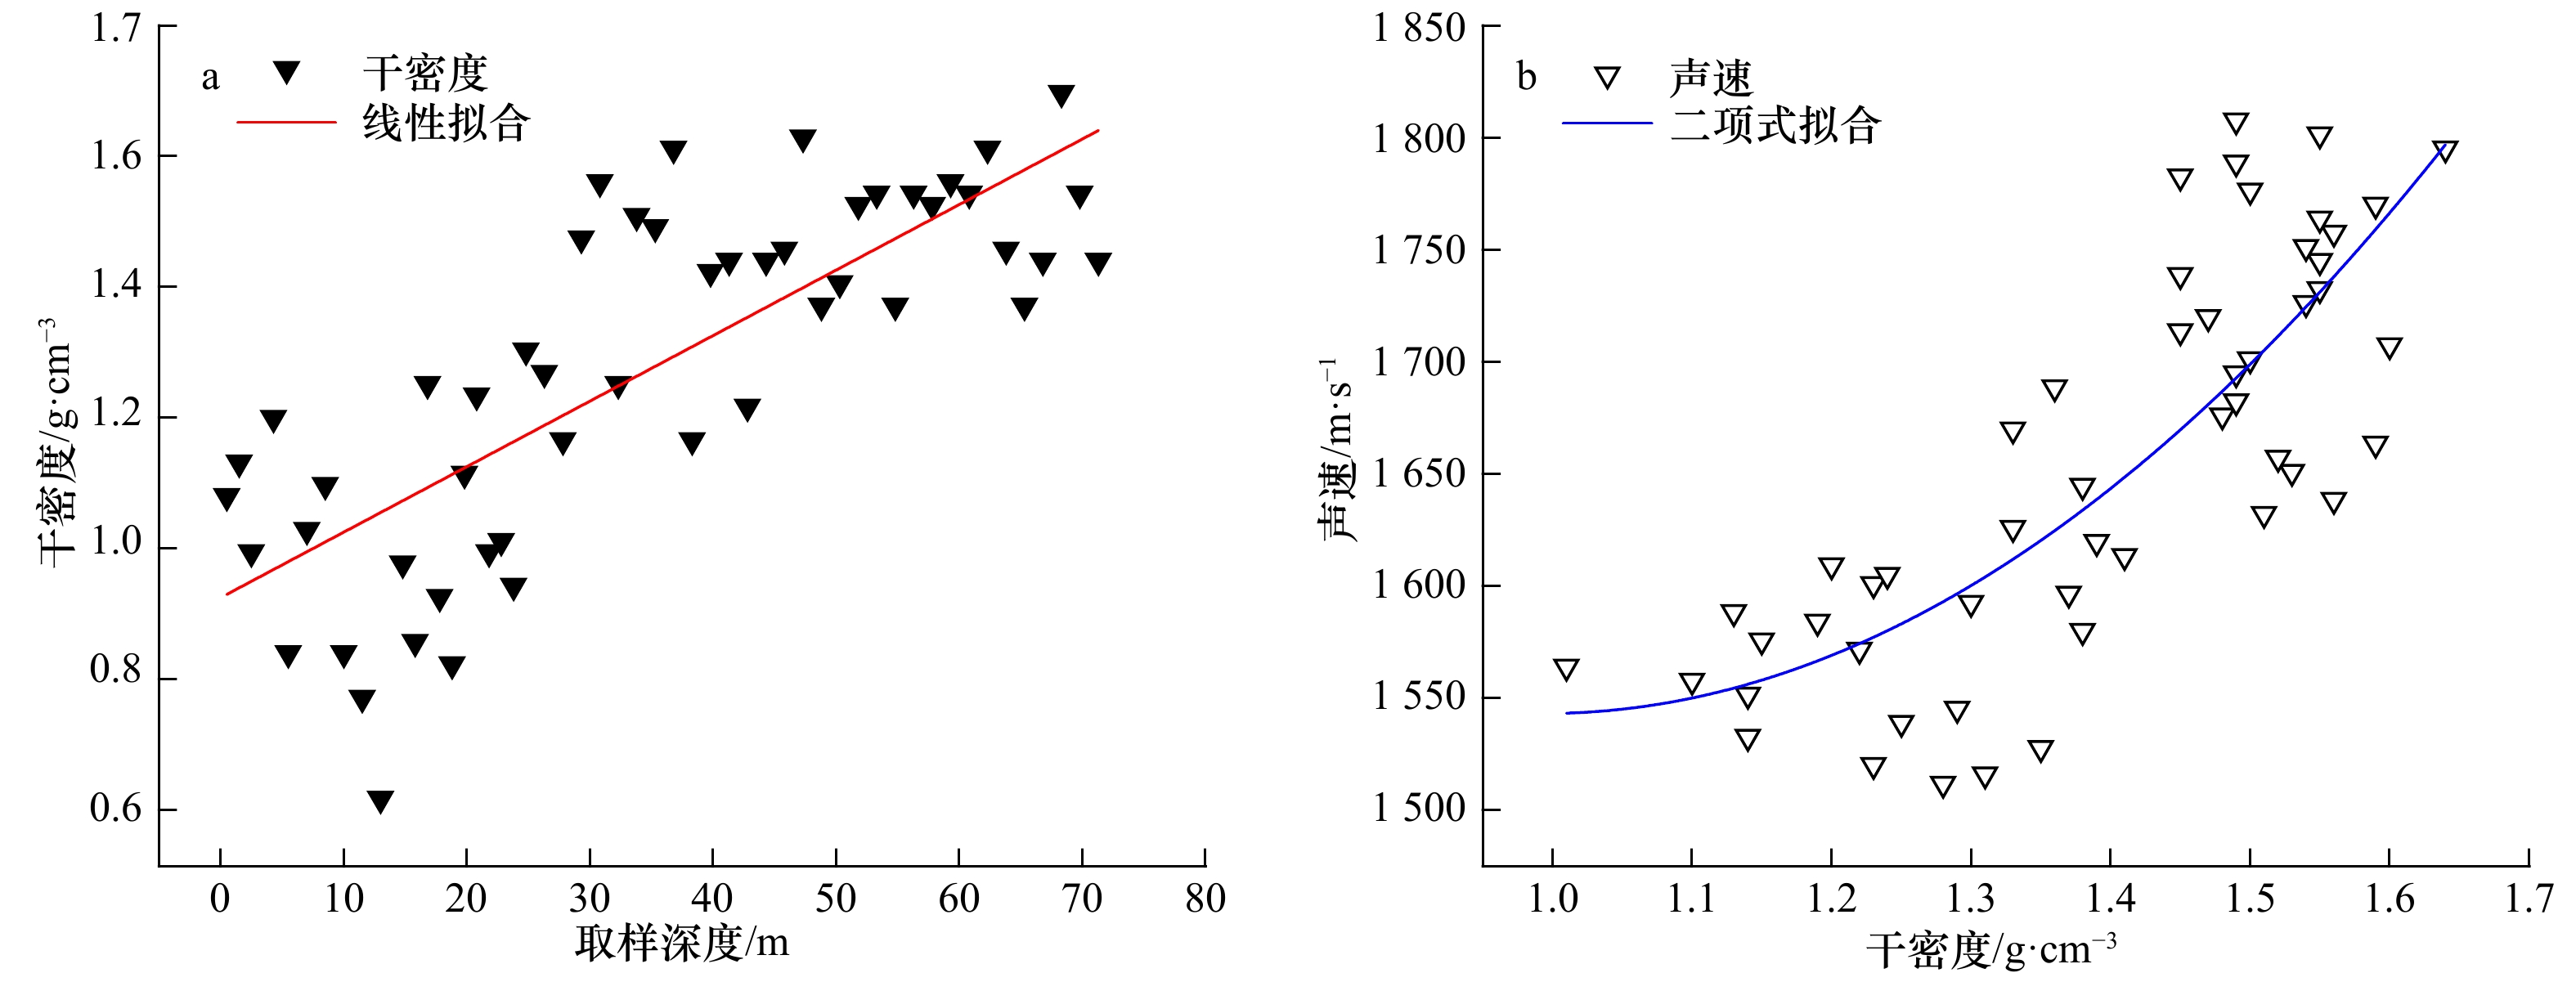
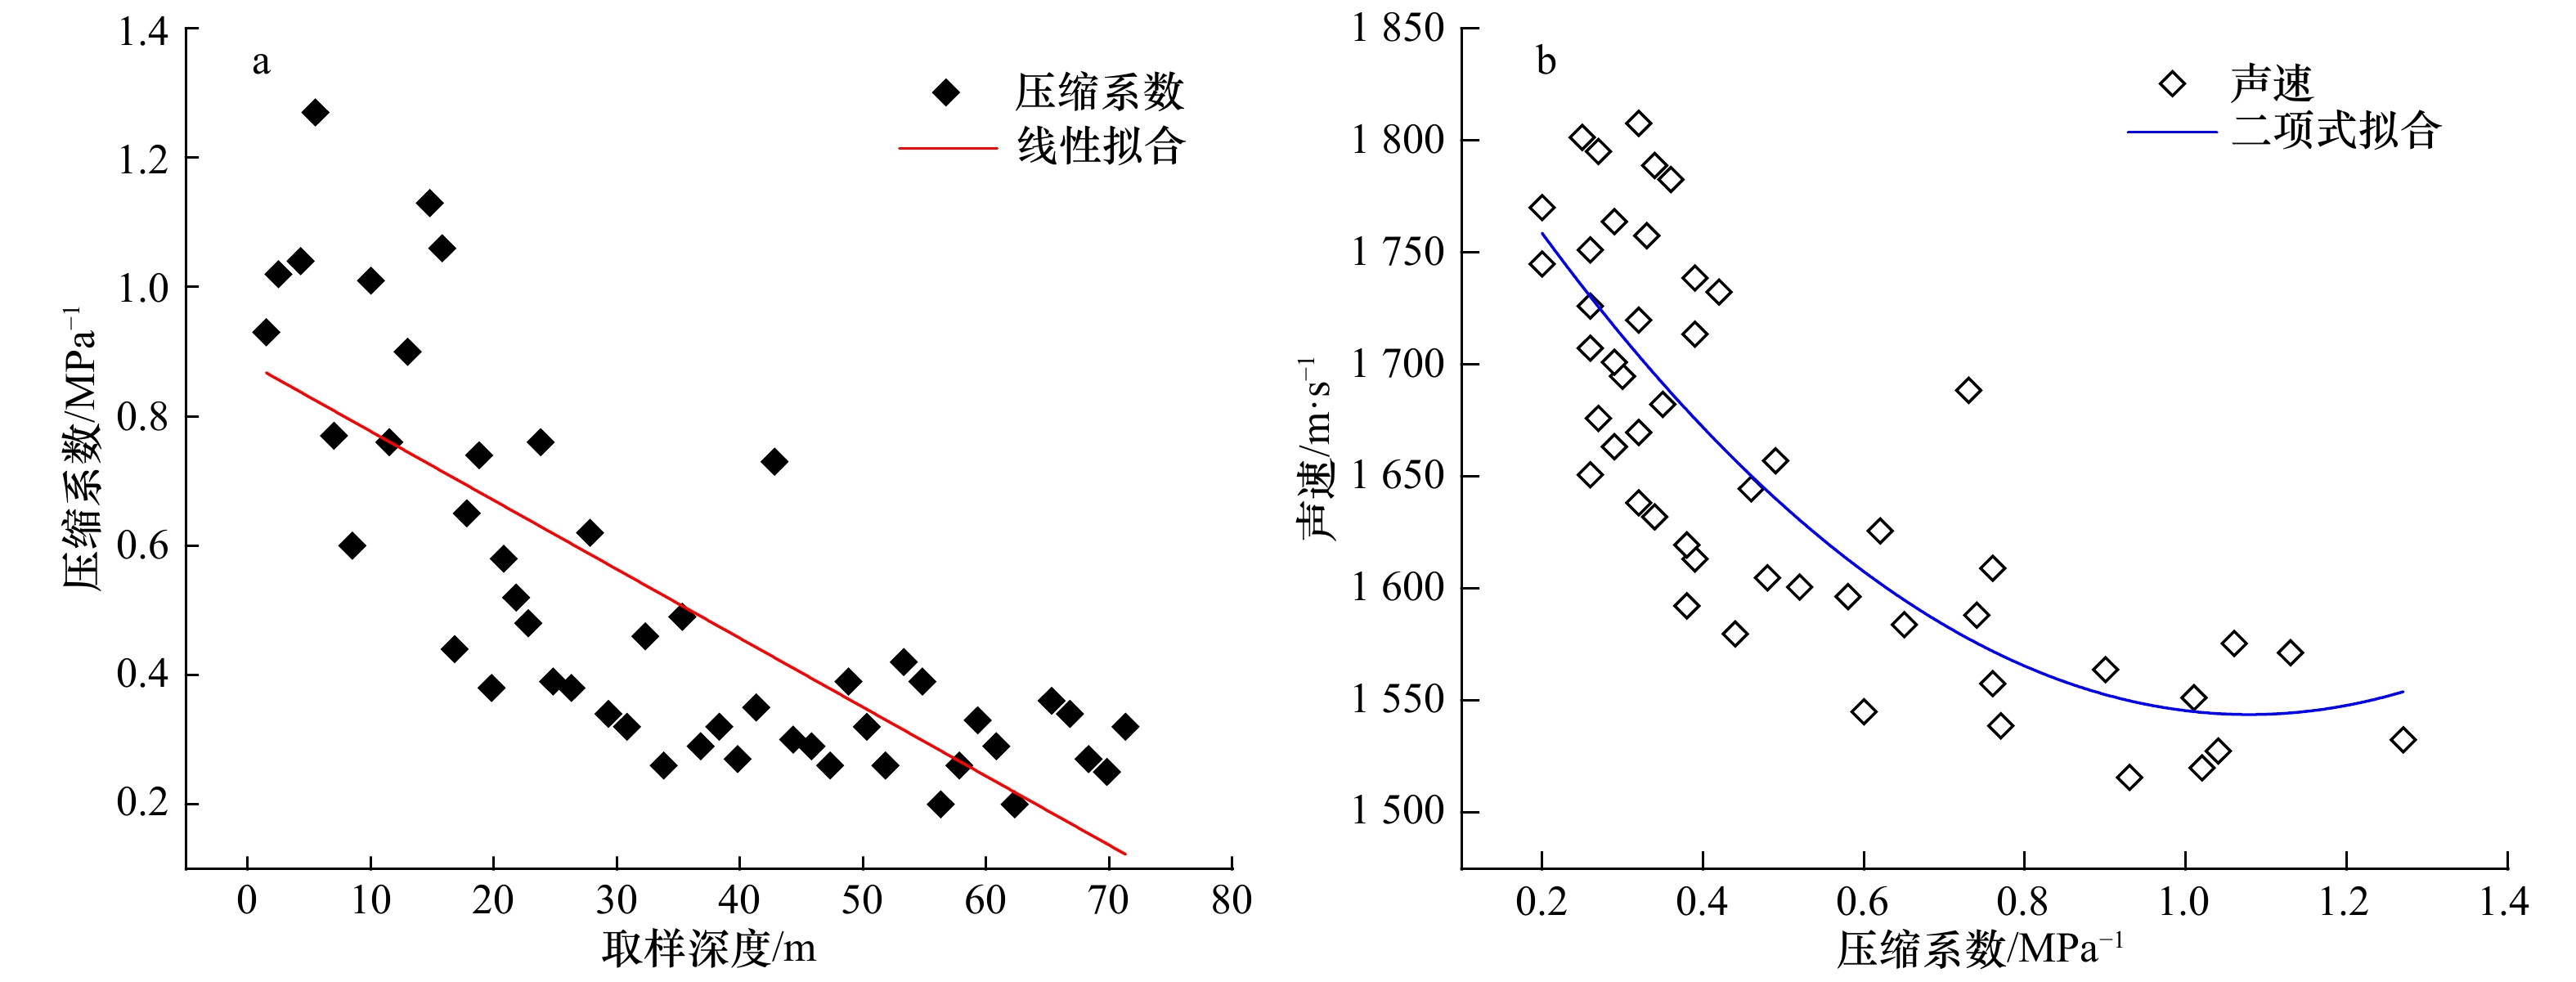
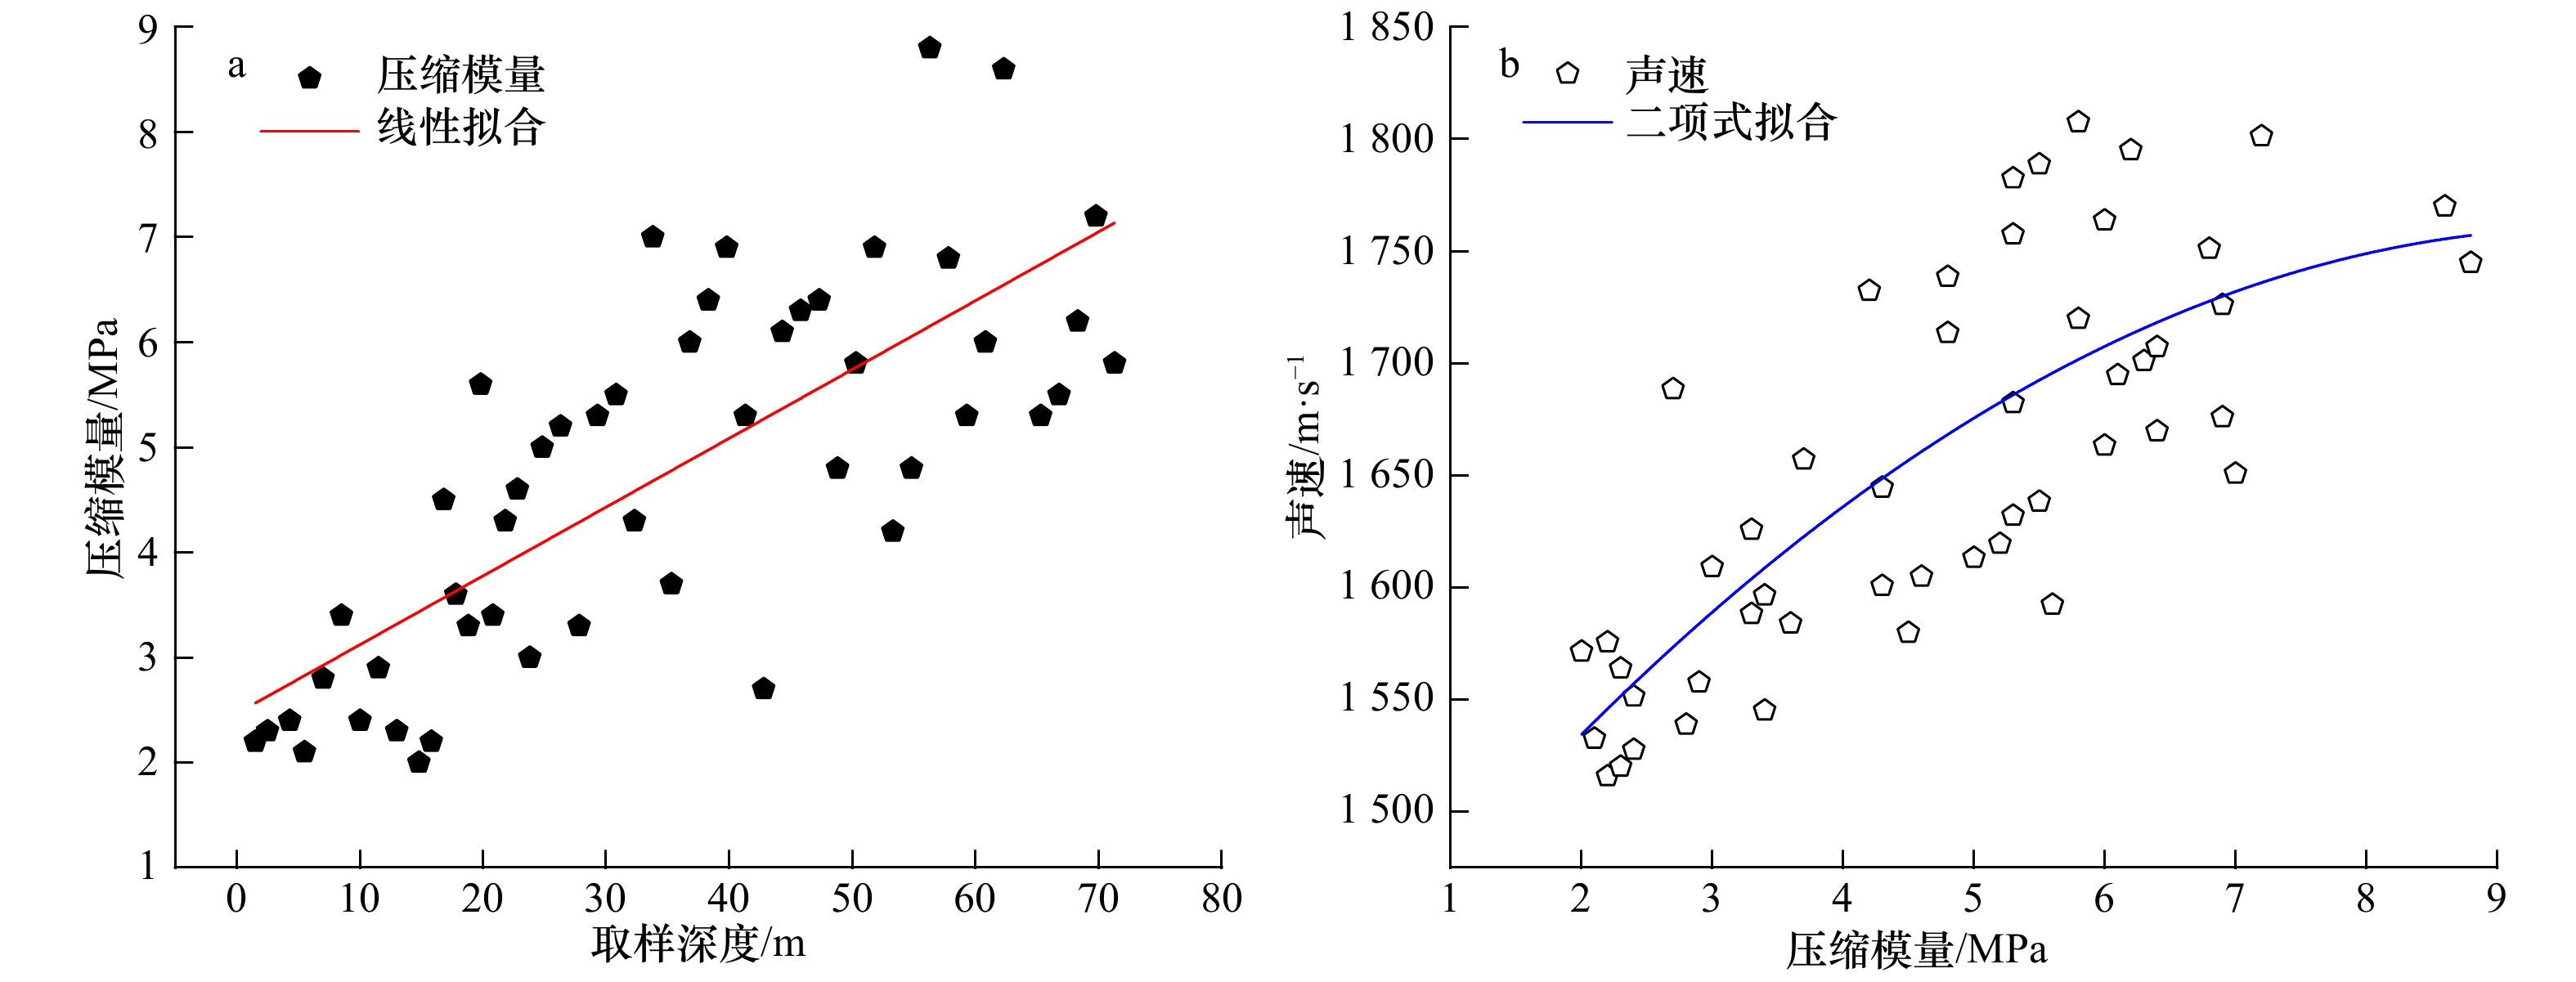
The sound velocity of marine sedimentary sequence is an important parameter. Finding out the changing rule of the seabed sound velocity is of extremely important significance. On the basis of distortion correction, by comparatively analyzing of high resolution sub-bottom profile data and borehole data, the accurate inversions of sound velocity in Holocene and above-bedrock sedimentary sequence are achieved in the Jinzhou Bay, Bohai Sea, China. Then, the characteristics and changing rules of seabed sound velocity in the study area are analyzed and discussed by statistical method. The 95% confidence interval of sound velocity of Holocene sequence is 1 449.60 m/s to 1 655.72 m/s, and the average is 1 560.34 m/s. The 95% confidence interval of sound velocity of above-bedrock sequence is 1 657.96 m/s to 1 970.80 m/s, and the average is 1 765.63 m/s. There is a significant positive linear correlation between the sound velocity of the sedimentary sequence and the burial depth in the study area, and the gradient of sound velocity is 4.18 s−1.
The sound velocity of marine sedimentary sequence is an important parameter. Finding out the changing rule of the seabed sound velocity is of extremely important significance. On the basis of distortion correction, by comparatively analyzing of high resolution sub-bottom profile data and borehole data, the accurate inversions of sound velocity in Holocene and above-bedrock sedimentary sequence are achieved in the Jinzhou Bay, Bohai Sea, China. Then, the characteristics and changing rules of seabed sound velocity in the study area are analyzed and discussed by statistical method. The 95% confidence interval of sound velocity of Holocene sequence is 1 449.60 m/s to 1 655.72 m/s, and the average is 1 560.34 m/s. The 95% confidence interval of sound velocity of above-bedrock sequence is 1 657.96 m/s to 1 970.80 m/s, and the average is 1 765.63 m/s. There is a significant positive linear correlation between the sound velocity of the sedimentary sequence and the burial depth in the study area, and the gradient of sound velocity is 4.18 s−1.


2020, 42(11): 12-22.
doi: 10.3969/j.issn.0253-4193.2020.11.002
Abstract:
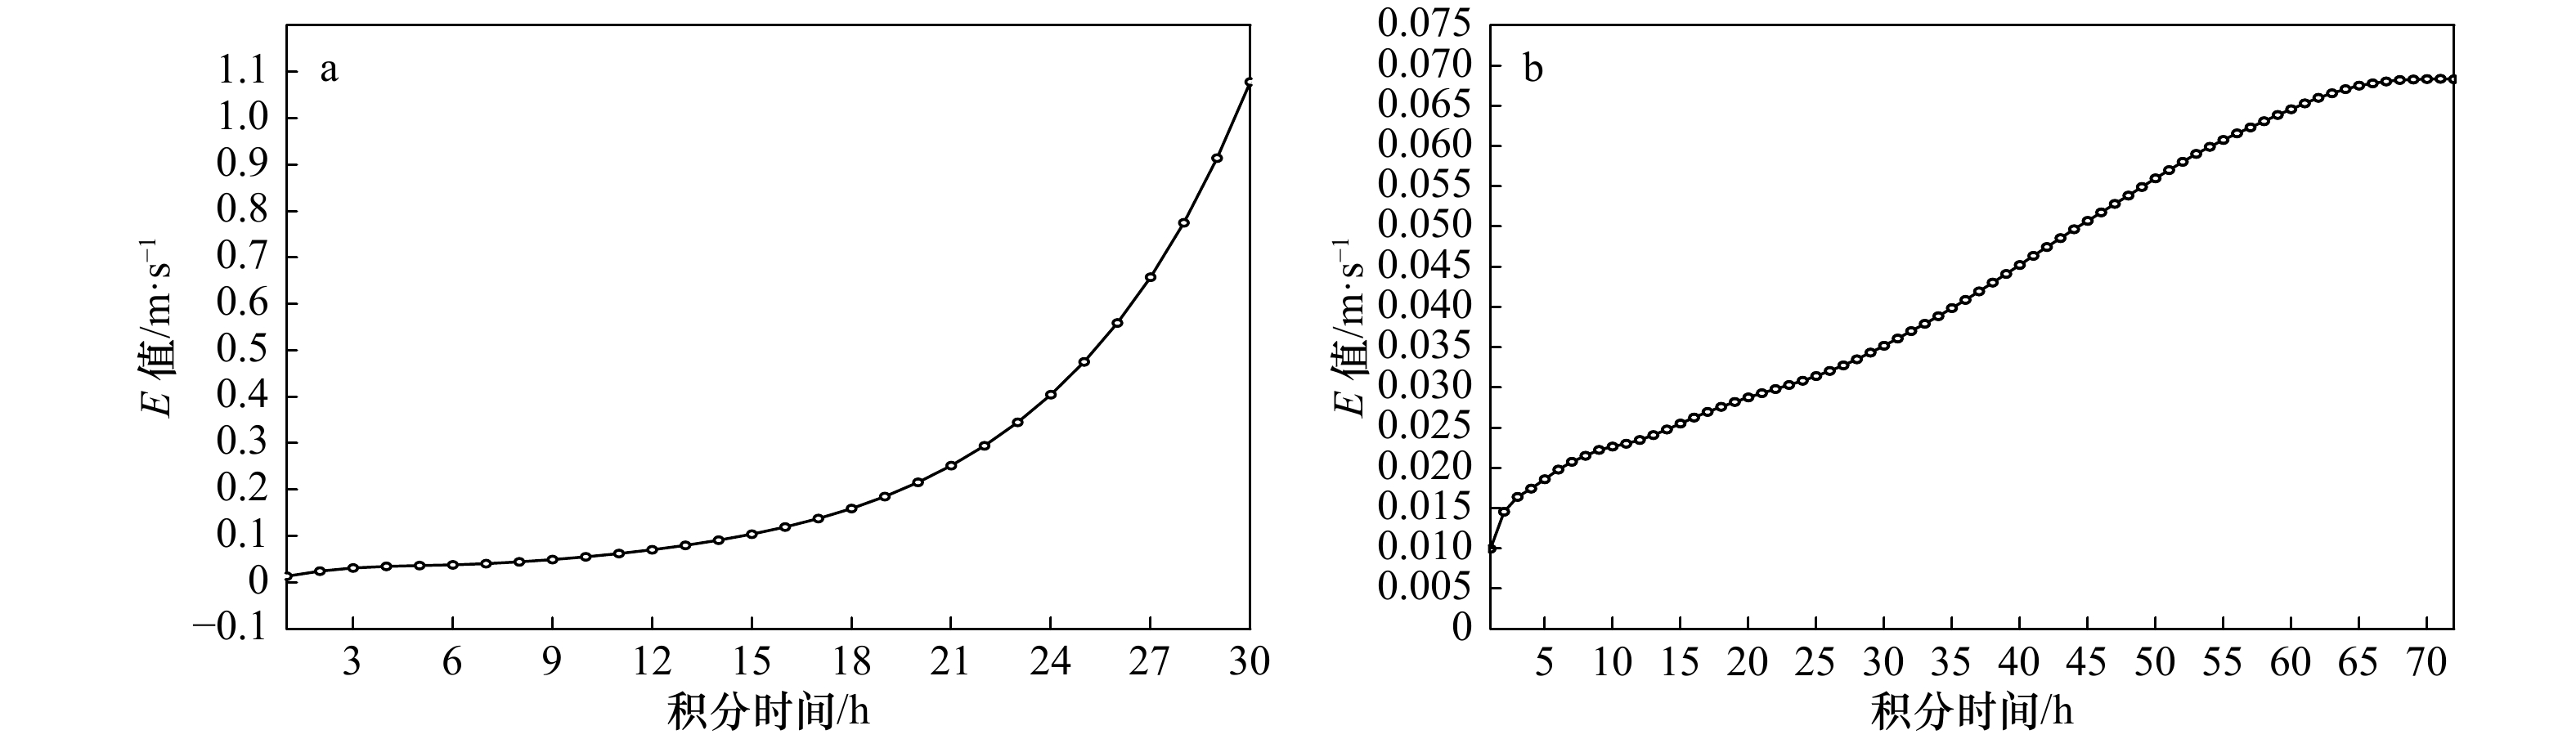
Using the two-dimensional non-static numerical model, which neglect the submarine topography but consider the pycnocline and background shear flow, the numerical experiment was made on the generation and evolution of linear and nonlinear symmetric ocean internal waves in the unstable downward shear background flow. After analyzing and comparing the results, the main conclusions are as follows: the linear internal wave strength is exponentially growing with integral time, and there’s symmetric instability of the wave, while nonlinear internal wave strength is growing quasi-linearly in the development stage, and finally enters the stabilization stage. The linear growing is much faster than the nonlinear growing and the latter has a stabilizing effect. For linear and nonlinear symmetric internal waves, there are maximum value of potential density perturbation, which is captured by the pycnocline. This is consistent with actual observations. The stream function and potential density perturbation are well coordinated, which is reflected in the positive and negative centers of the potential density perturbation corresponding to the rising and sinking movements of the stream function, respectively. This shows that there is a slantwise convection occurred from the bottom of the sea and the pycnocline is the top cover. For linear internal waves, with the increase of integral time, its waveform is basically the same and the positive and negative amplitude is also about the same. There are two slantwise circulations that grow in opposite signs and between them is a strong slantwise upwelling. The waveform of nonlinear internal wave changes with the integration time and the number of slantwise circulations is also increasing, resulting in the stronger negative circulations and a sharp increase in the horizontal gradient of stream function and potential density perturbation. The sharp increase can be regarded as an interruption.
Using the two-dimensional non-static numerical model, which neglect the submarine topography but consider the pycnocline and background shear flow, the numerical experiment was made on the generation and evolution of linear and nonlinear symmetric ocean internal waves in the unstable downward shear background flow. After analyzing and comparing the results, the main conclusions are as follows: the linear internal wave strength is exponentially growing with integral time, and there’s symmetric instability of the wave, while nonlinear internal wave strength is growing quasi-linearly in the development stage, and finally enters the stabilization stage. The linear growing is much faster than the nonlinear growing and the latter has a stabilizing effect. For linear and nonlinear symmetric internal waves, there are maximum value of potential density perturbation, which is captured by the pycnocline. This is consistent with actual observations. The stream function and potential density perturbation are well coordinated, which is reflected in the positive and negative centers of the potential density perturbation corresponding to the rising and sinking movements of the stream function, respectively. This shows that there is a slantwise convection occurred from the bottom of the sea and the pycnocline is the top cover. For linear internal waves, with the increase of integral time, its waveform is basically the same and the positive and negative amplitude is also about the same. There are two slantwise circulations that grow in opposite signs and between them is a strong slantwise upwelling. The waveform of nonlinear internal wave changes with the integration time and the number of slantwise circulations is also increasing, resulting in the stronger negative circulations and a sharp increase in the horizontal gradient of stream function and potential density perturbation. The sharp increase can be regarded as an interruption.


2020, 42(11): 23-33.
doi: 10.3969/j.issn.0253-4193.2020.11.003
Abstract:
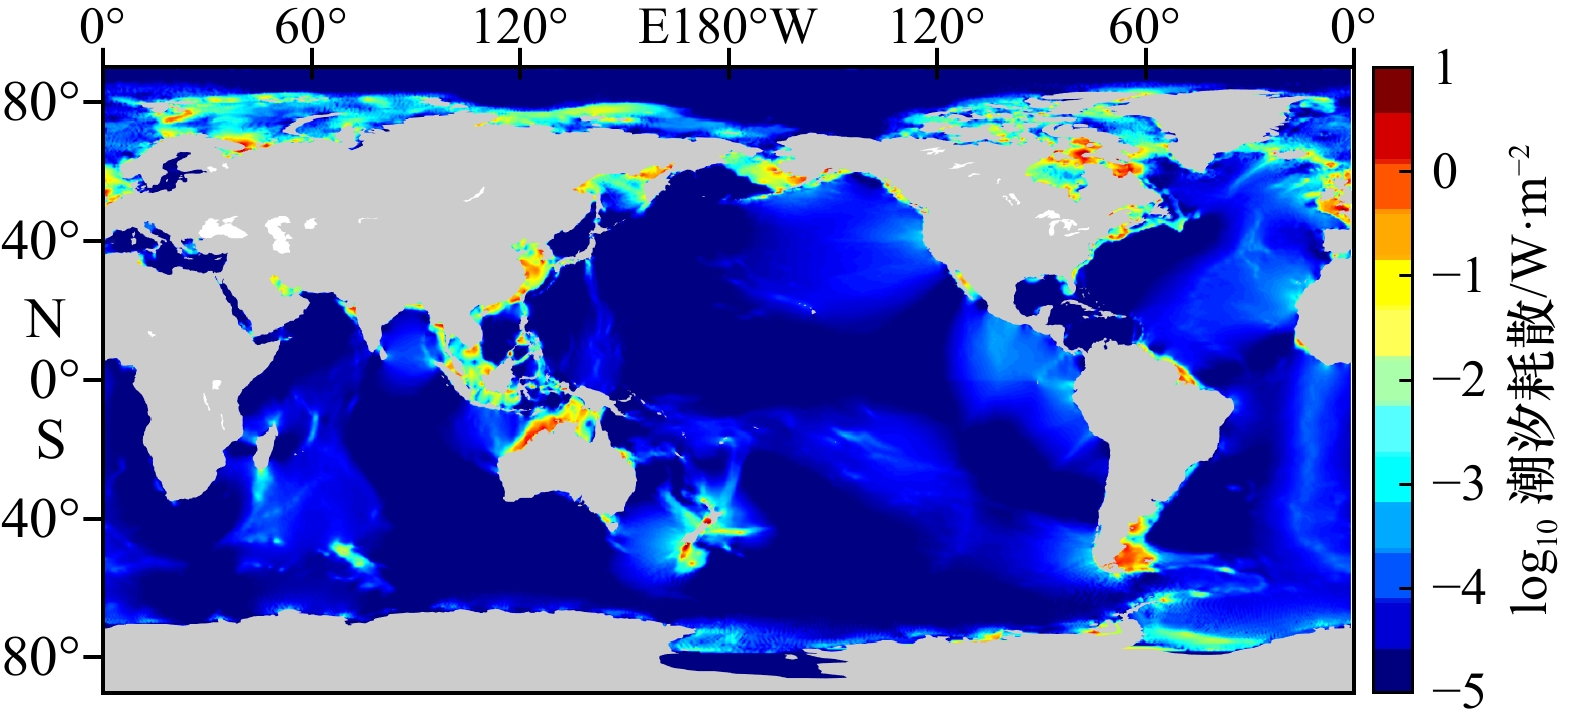
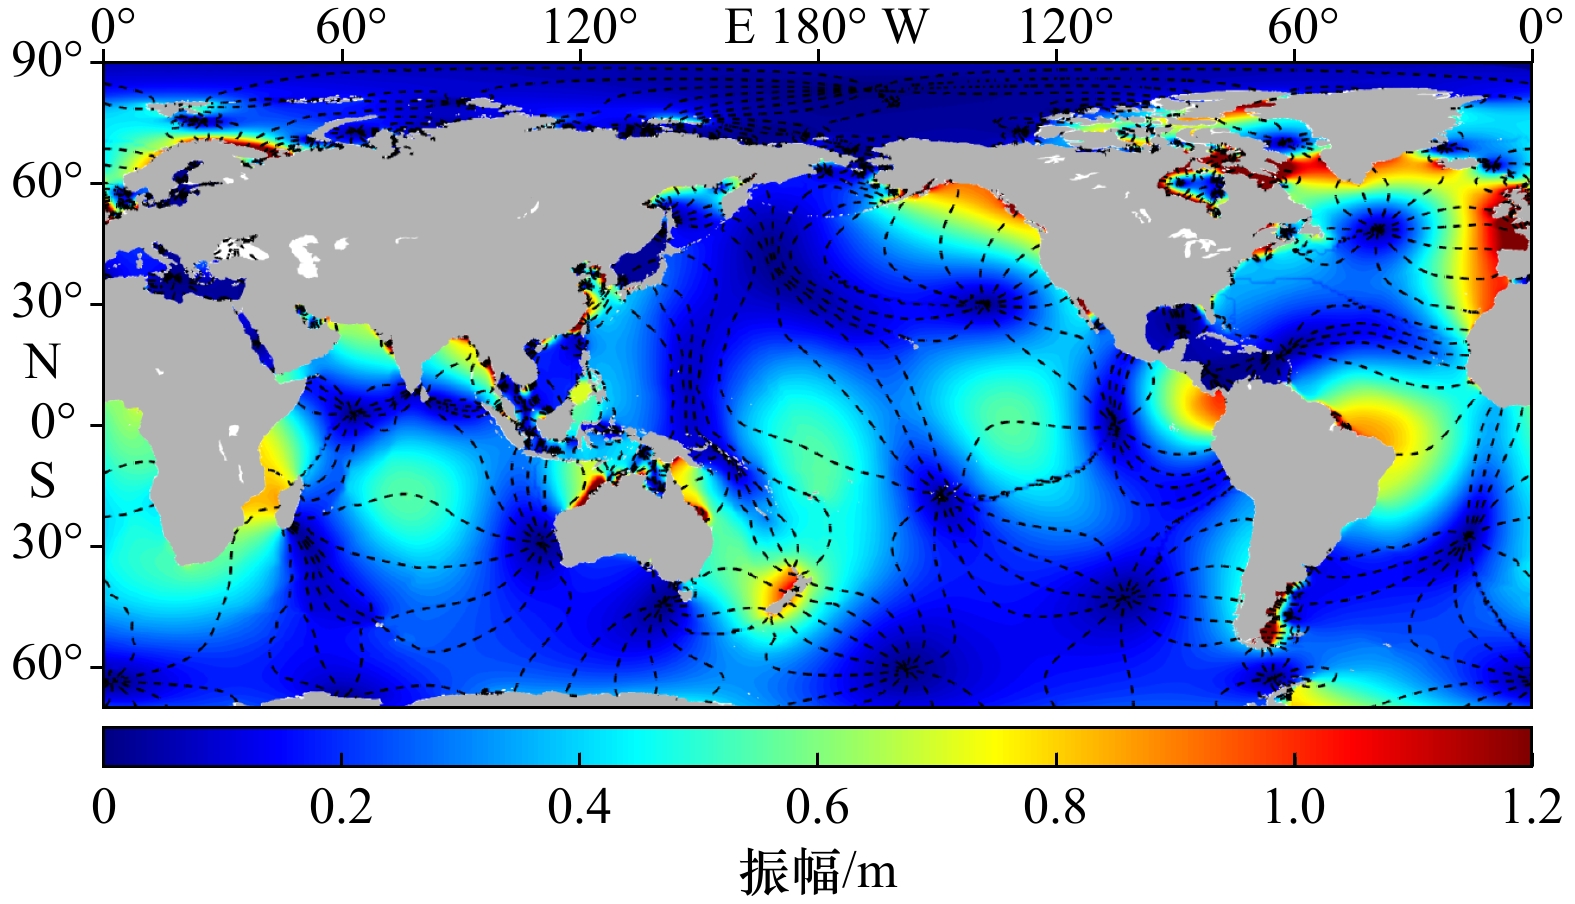
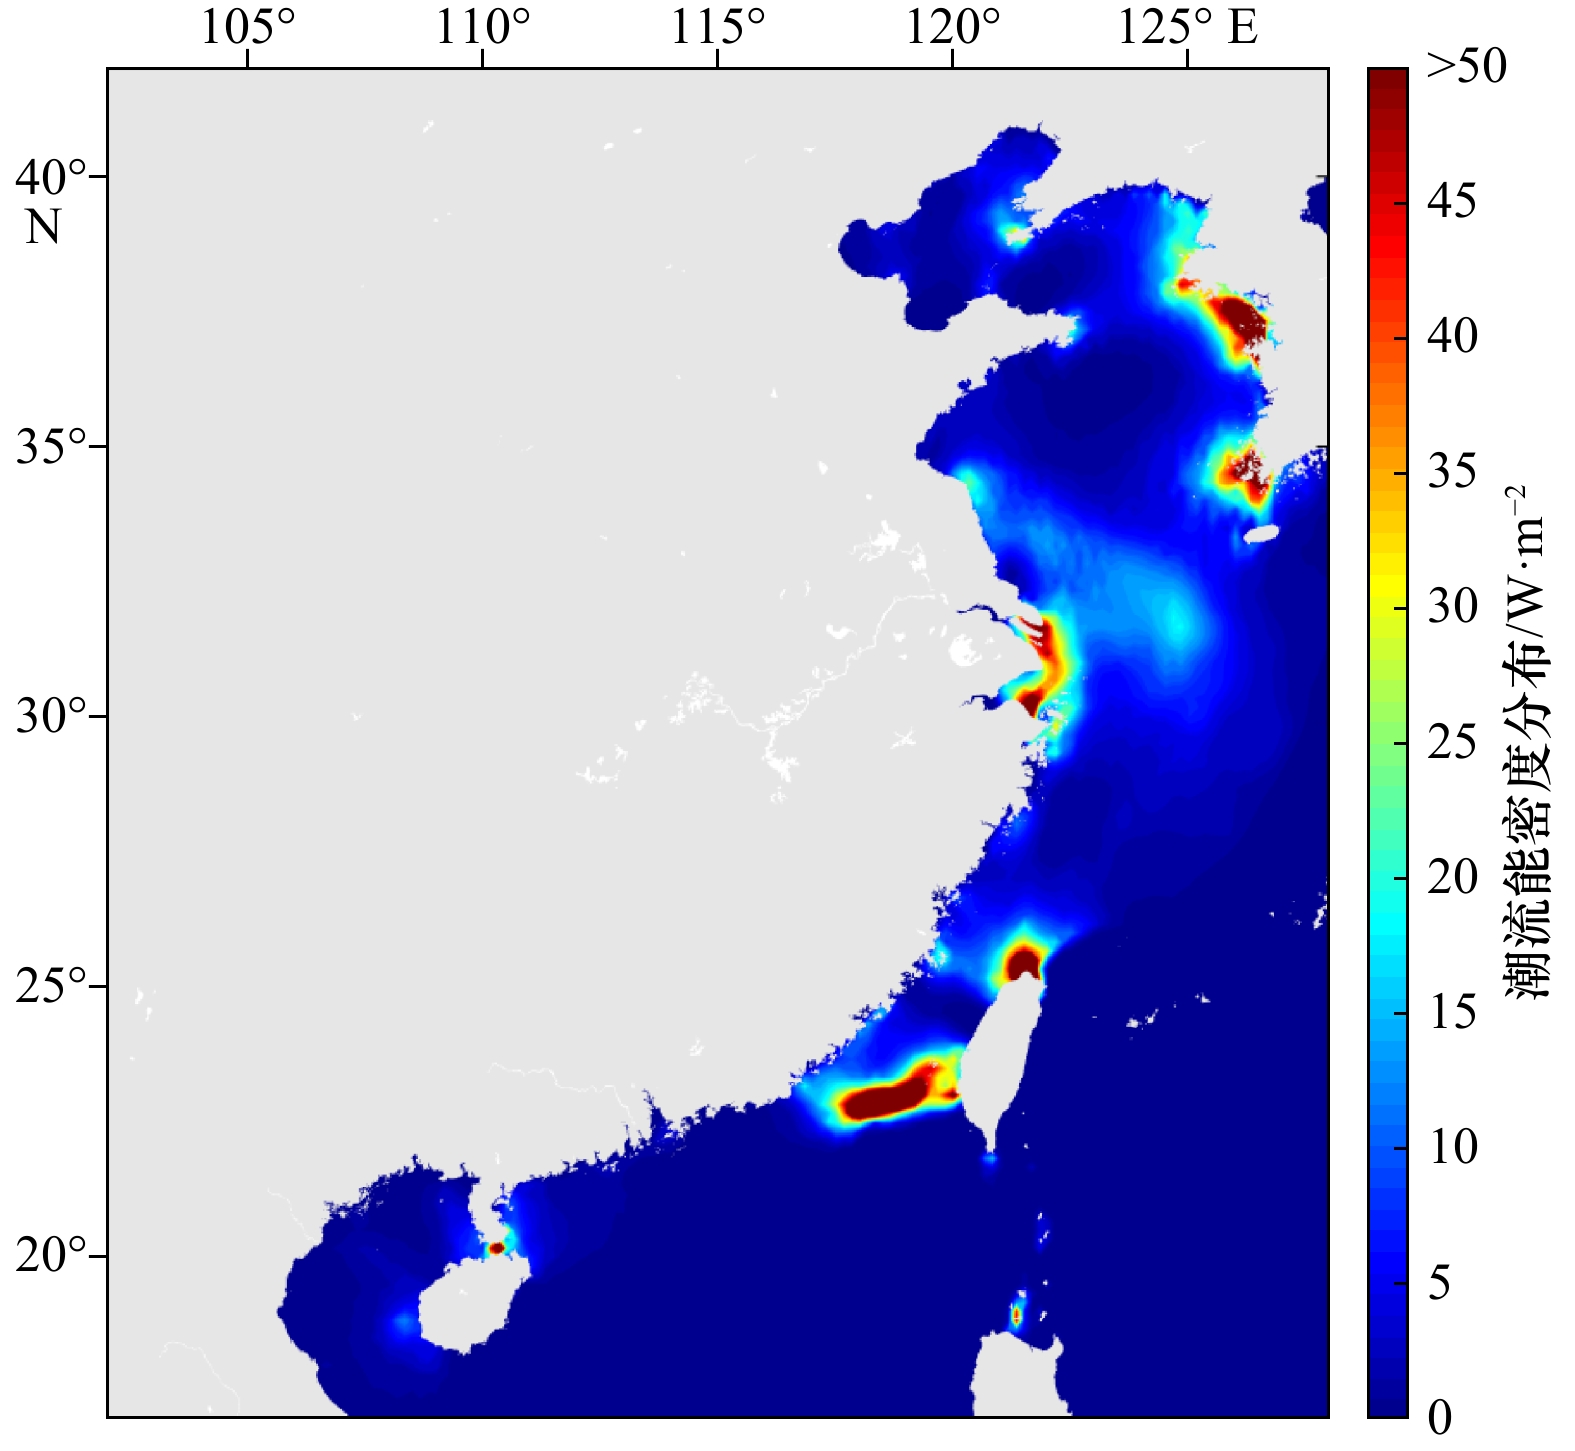
Using the Finite-Volume Community Ocean Model (FVCOM) numerical model, considering the combination of parameterization of internal tidal dissipation and self-attraction and loading tide in the unstructured mesh model for the first time, a total of six tide-generation forces including M2、S2、N2、K1、O1、Q1 are established to drive the global forward tidal model. Based on the verification of the global tidal model results, we calculate and statistically estimate average density of the global tidal current energy, and show the tidal current energy distributions where there is greater tidal current energy in the world. The results show that there is a large tidal current energy belt with an area of nearly 33 000\begin{document}$ {{\rm{k}}{\rm{m}}}^{2} $\end{document} ![]()
![]()
\begin{document}$ {\rm{W}}/{{\rm{m}}}^{2} $\end{document} ![]()
![]()
\begin{document}$ {\rm{W}}/{{\rm{m}}}^{2} $\end{document} ![]()
![]()
\begin{document}$ {\rm{W}}/{{\rm{m}}}^{2} $\end{document} ![]()
![]()
\begin{document}$ {\rm{W}}/{{\rm{m}}}^{2} $\end{document} ![]()
![]()
\begin{document}$ {\rm{W}}/{{\rm{m}}}^{2} $\end{document} ![]()
![]()
\begin{document}$ {\rm{W}}/{{\rm{m}}}^{2} $\end{document} ![]()
![]()
Using the Finite-Volume Community Ocean Model (FVCOM) numerical model, considering the combination of parameterization of internal tidal dissipation and self-attraction and loading tide in the unstructured mesh model for the first time, a total of six tide-generation forces including M2、S2、N2、K1、O1、Q1 are established to drive the global forward tidal model. Based on the verification of the global tidal model results, we calculate and statistically estimate average density of the global tidal current energy, and show the tidal current energy distributions where there is greater tidal current energy in the world. The results show that there is a large tidal current energy belt with an area of nearly 33 000


2020, 42(11): 34-38.
doi: 10.3969/j.issn.0253-4193.2020.11.004
Abstract:
For the wave model, we combine the variational multiscale method with the free surface captured technology, and decompose various physical quantities of the wave model into “coarse” scale and “fine” scale following the variational multiscale method, and introduce the stabilization structure to eliminate numerical pseudo oscillation. Finally, the total variational multiscale equation of coupling “coarse” scale and “fine” scale is solved to simulate the water wave oscillating freely in a cycle and wave propagation. The numerical results show that the numerical results is accurate, and the method eliminates the spurious oscillations, and simulate correctly the phenomenon of periodic changes of water waves oscillating freely and wave propagation.
For the wave model, we combine the variational multiscale method with the free surface captured technology, and decompose various physical quantities of the wave model into “coarse” scale and “fine” scale following the variational multiscale method, and introduce the stabilization structure to eliminate numerical pseudo oscillation. Finally, the total variational multiscale equation of coupling “coarse” scale and “fine” scale is solved to simulate the water wave oscillating freely in a cycle and wave propagation. The numerical results show that the numerical results is accurate, and the method eliminates the spurious oscillations, and simulate correctly the phenomenon of periodic changes of water waves oscillating freely and wave propagation.


2020, 42(11): 39-48.
doi: 10.3969/j.issn.0253-4193.2020.11.005
Abstract:
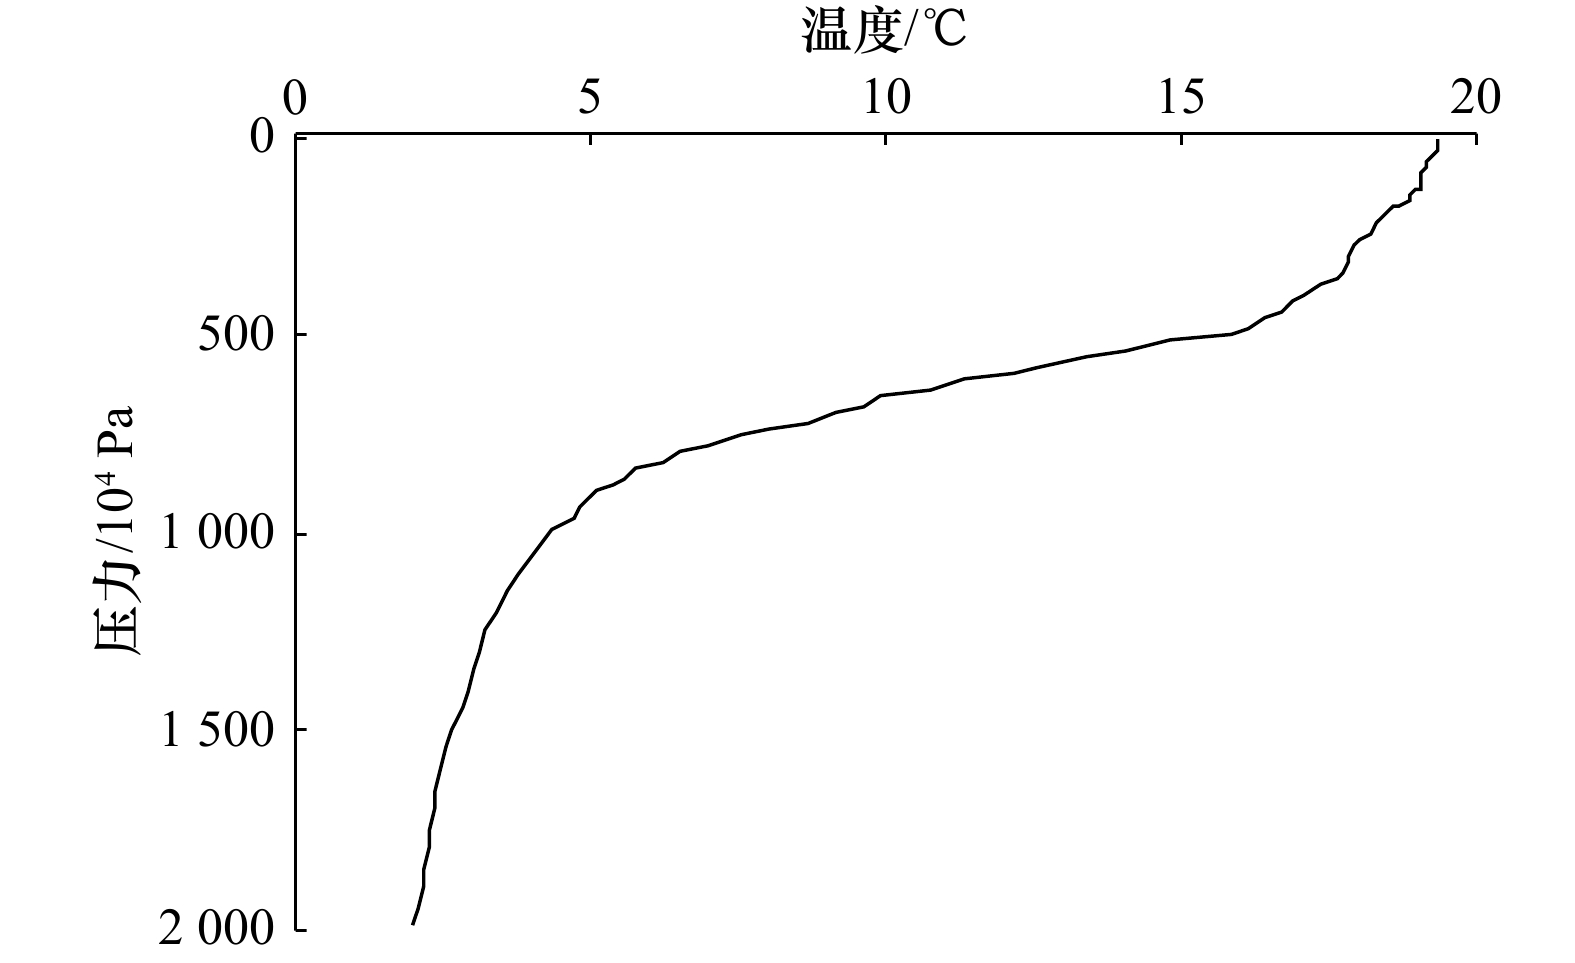
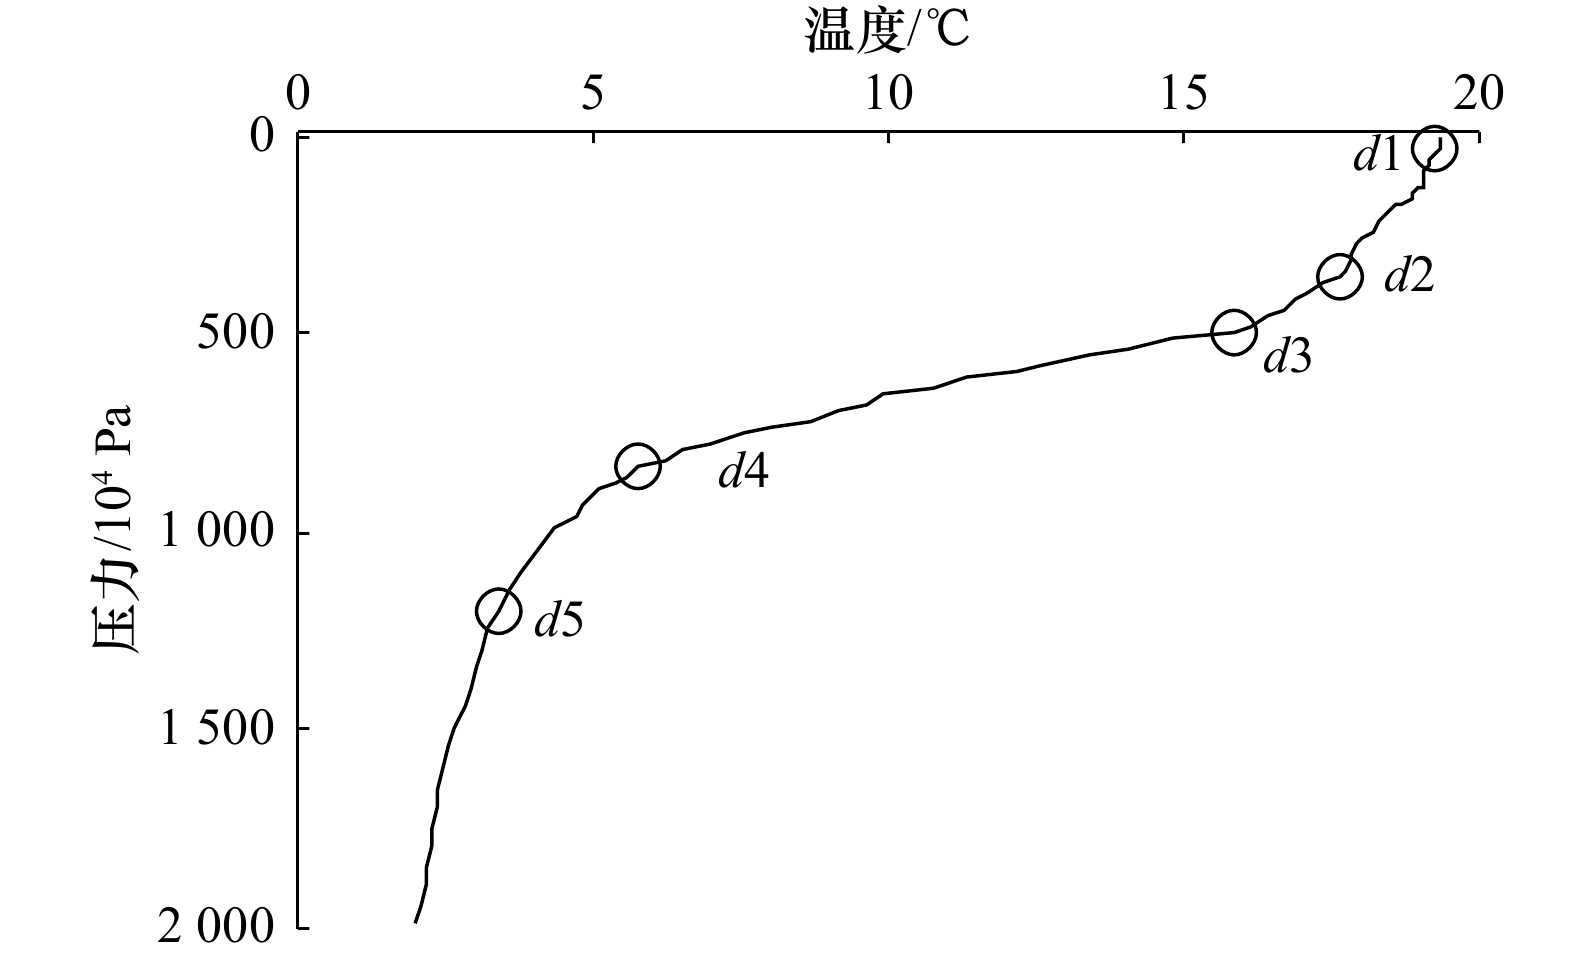
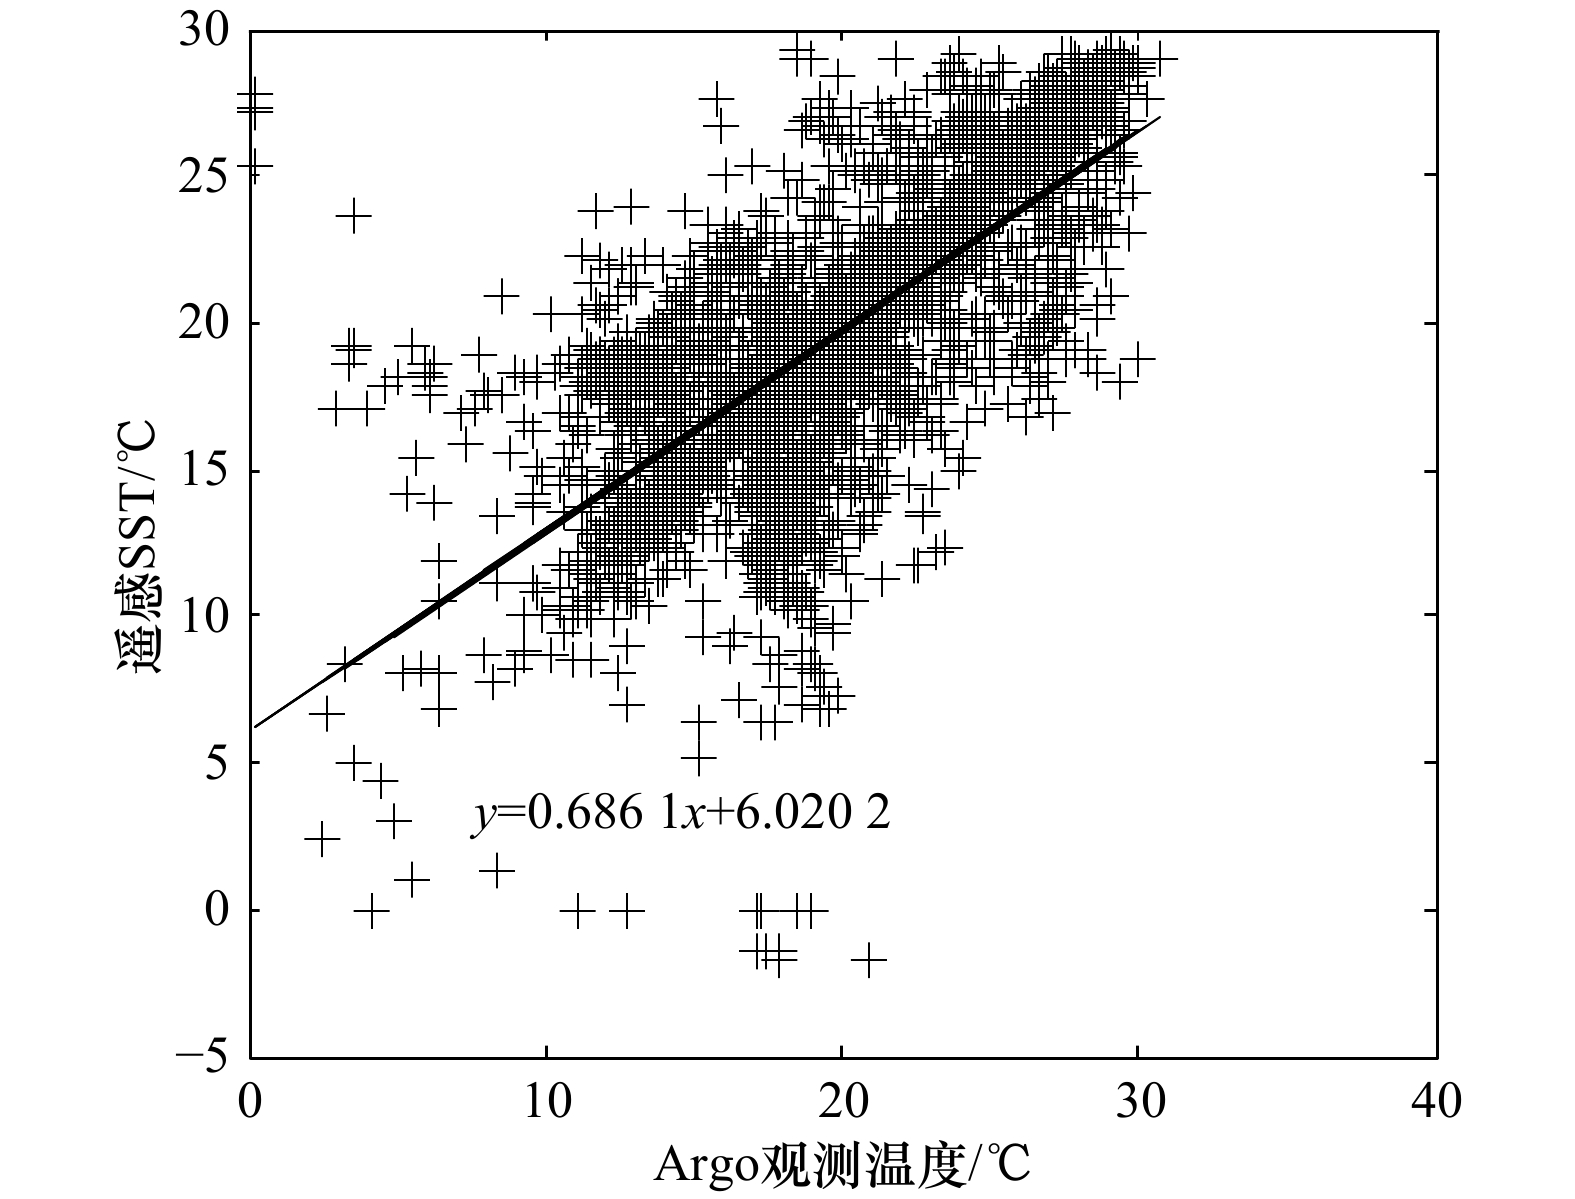
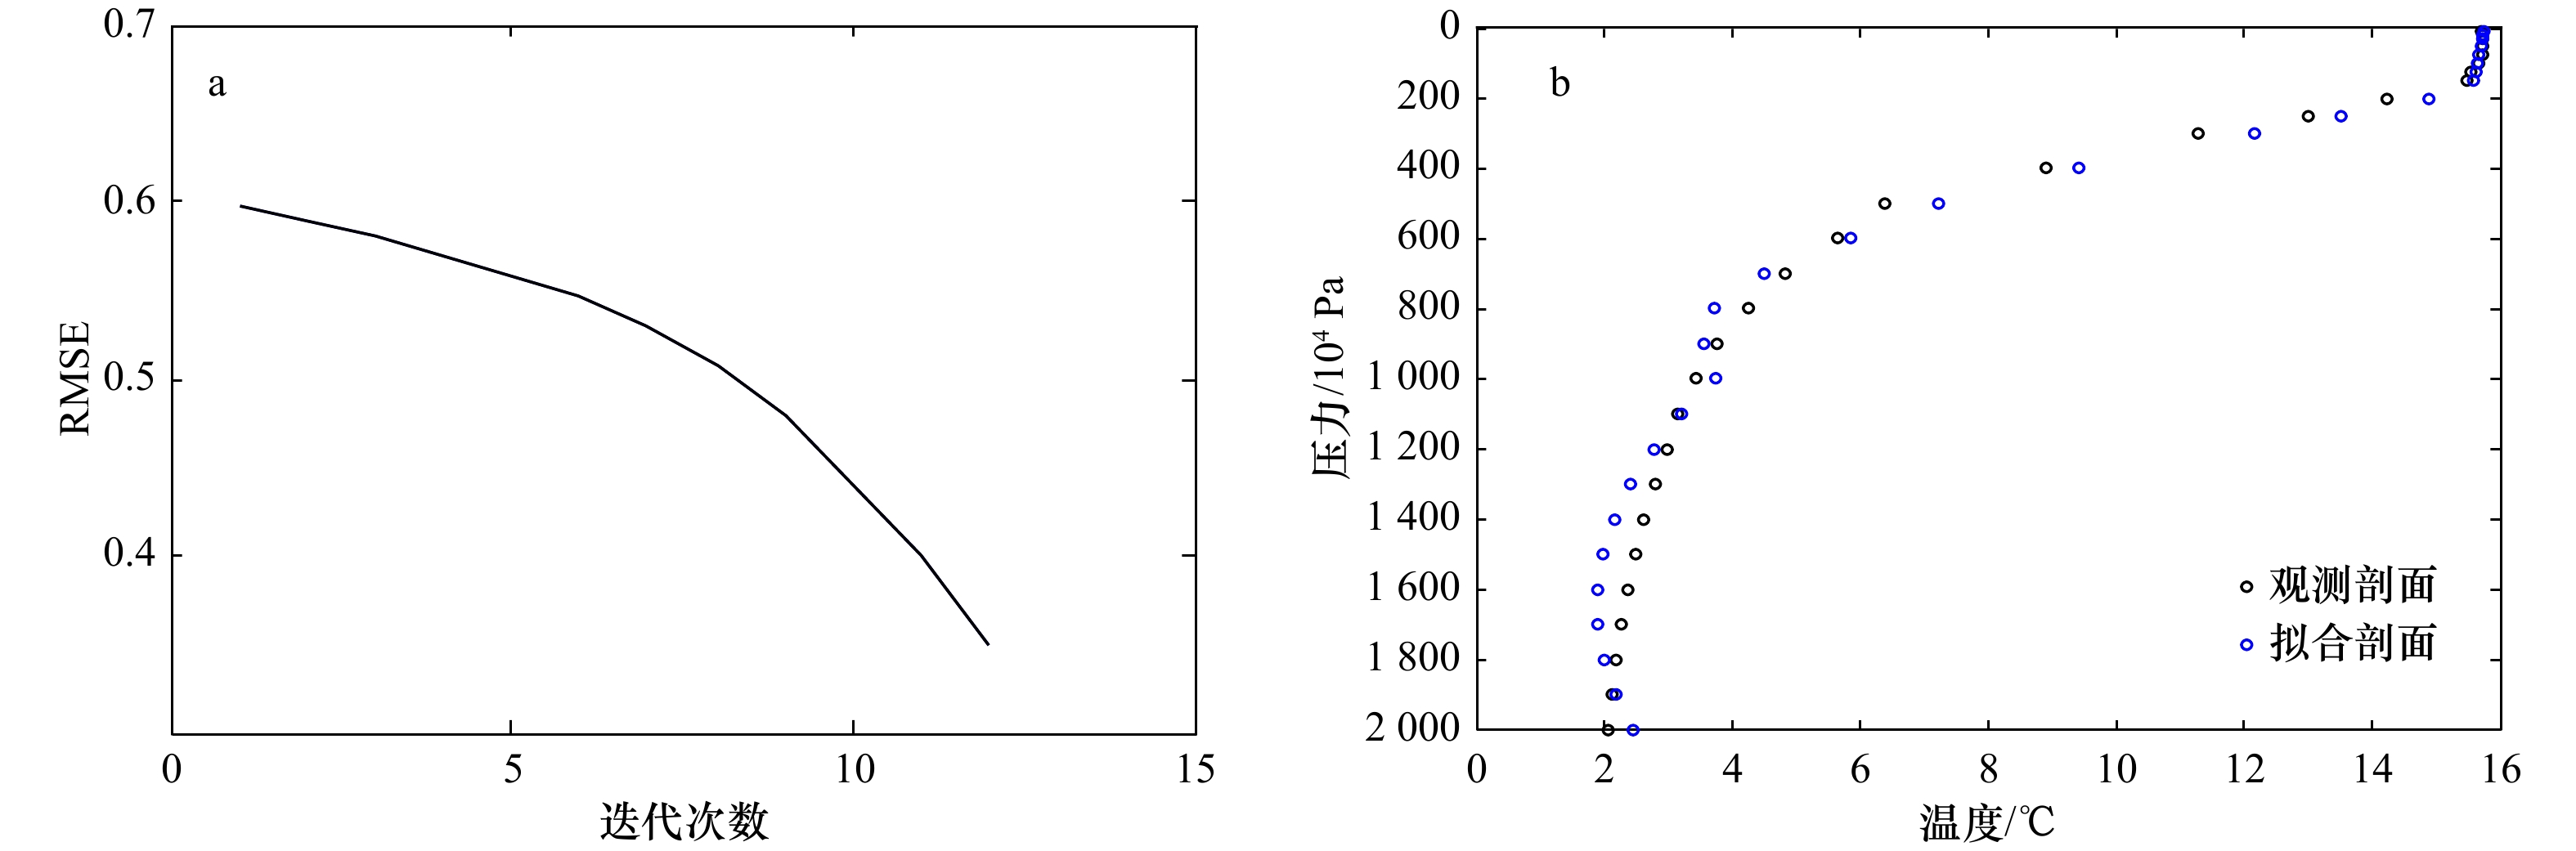
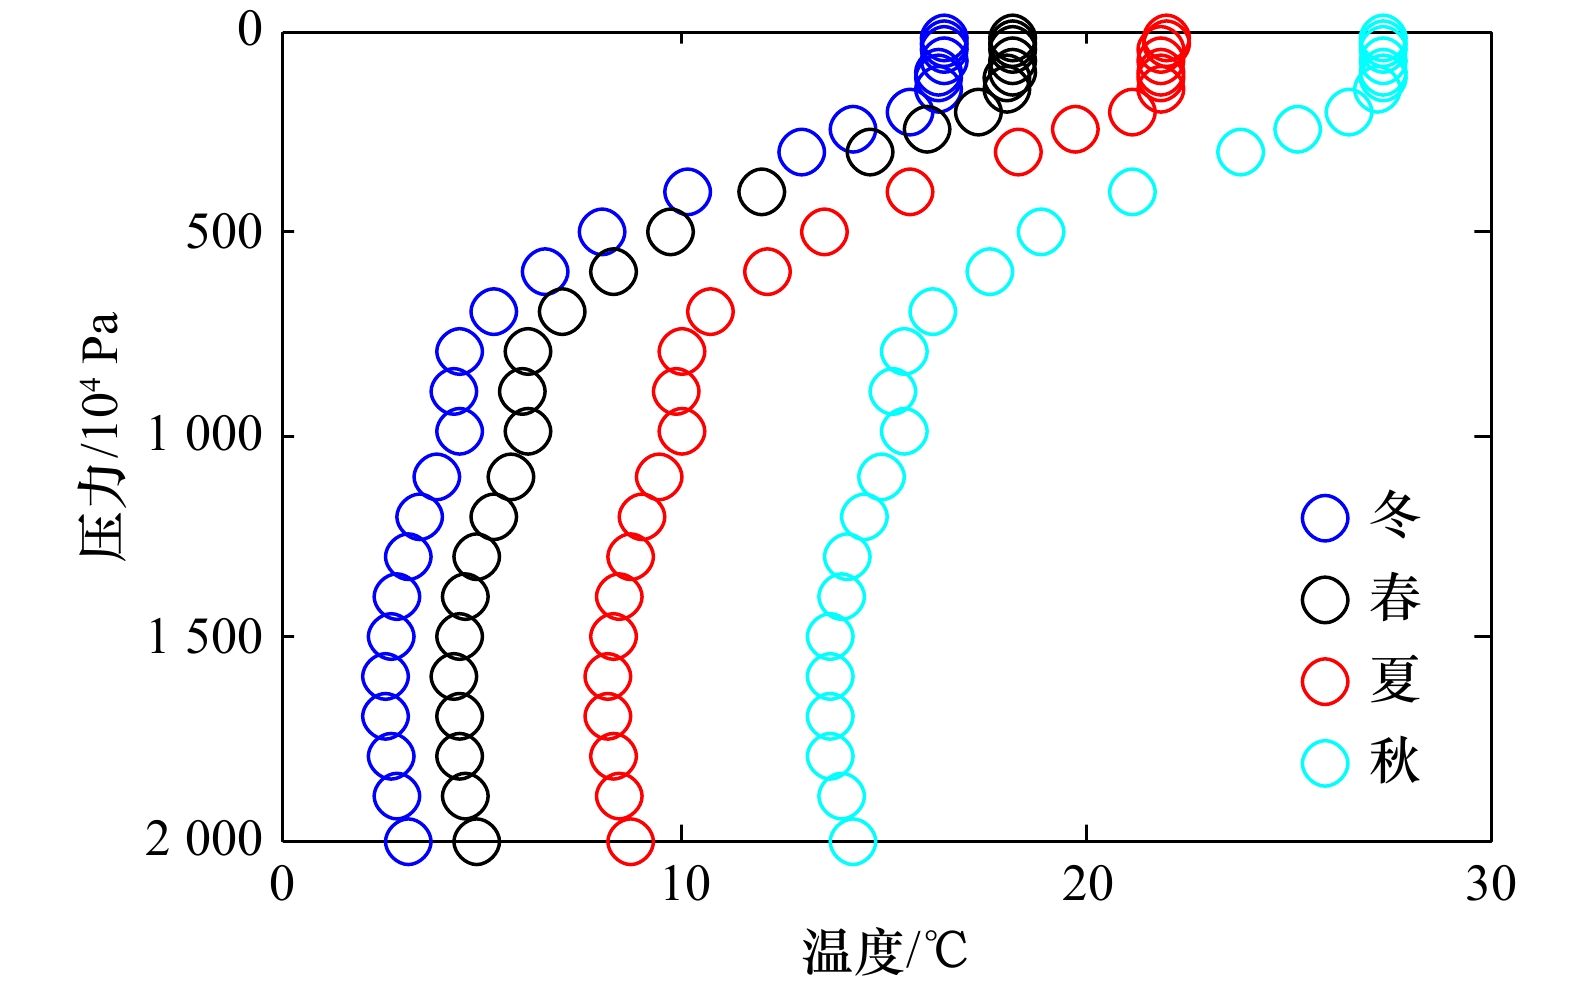
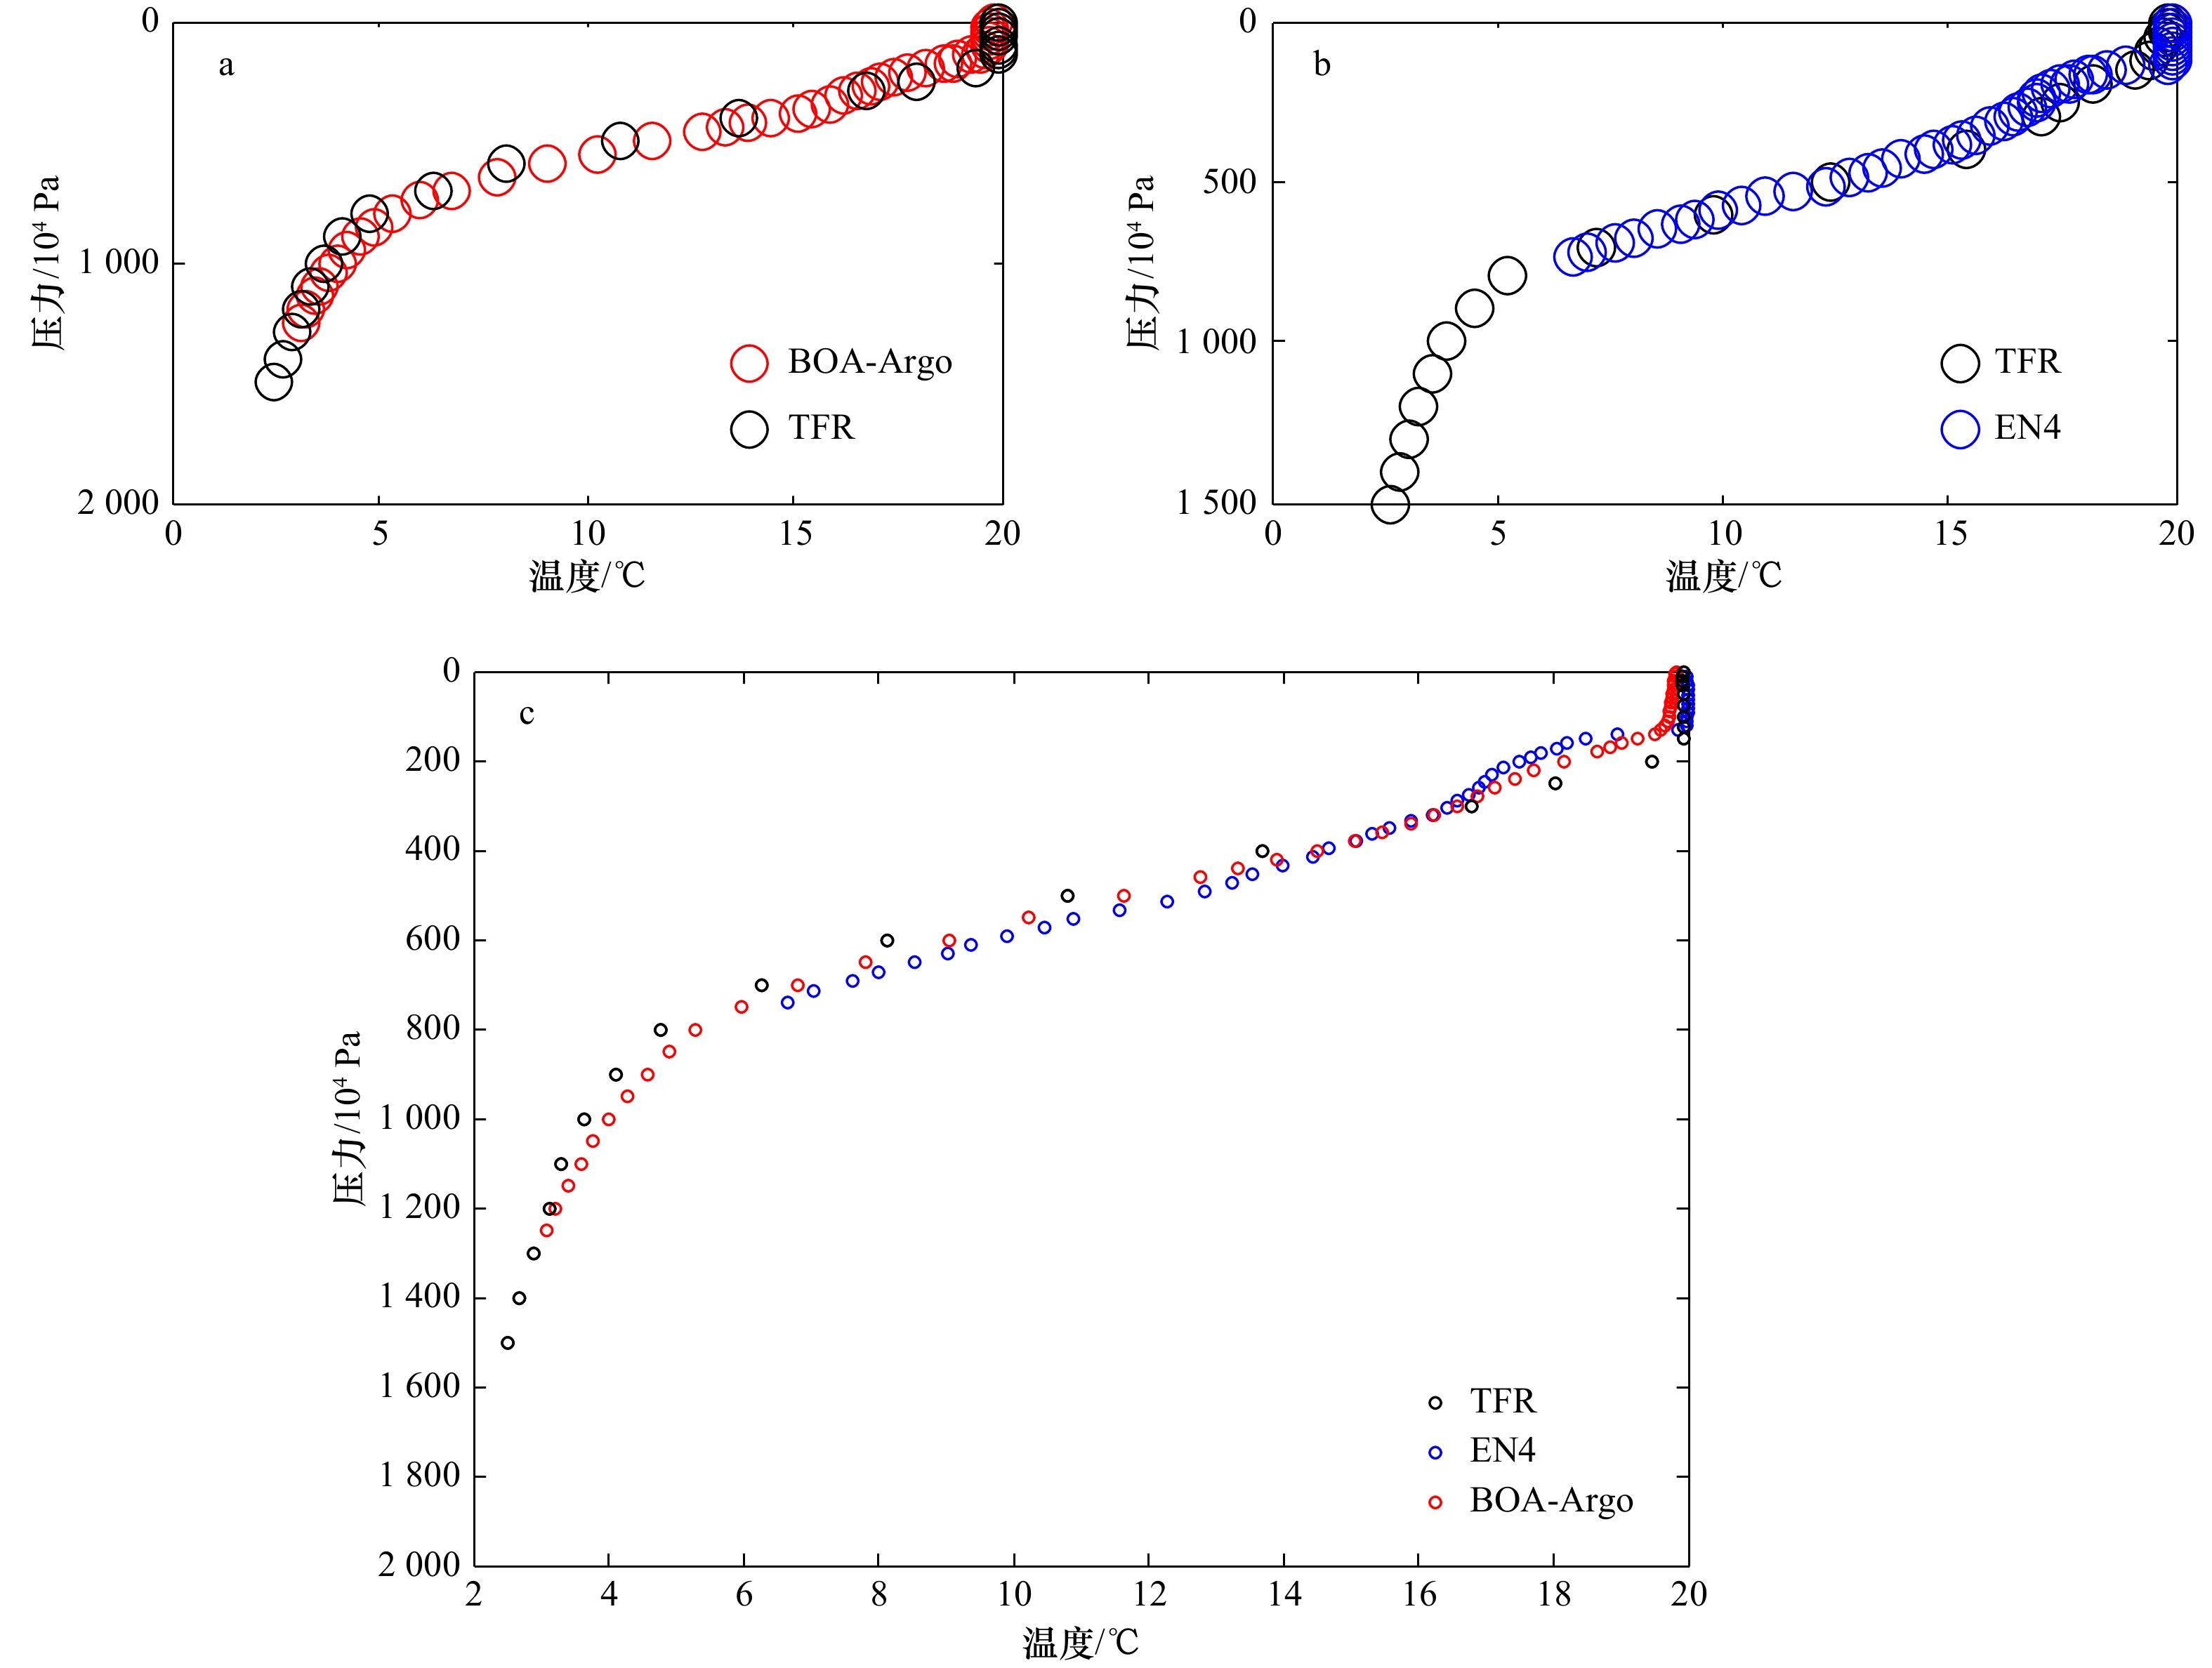
To meet the needs of marine research and marine surveys, a new algorithm for fitting three-dimensional temperature fields was developed based on the Argo profile and sea surface temperature data. The Northwest Pacific region was selected as the experimental sea area to validate the algorithm. The latitude and longitude range of the water area was set as: 30°–40°N, 140°–155°E, and the horizontal resolution was 0.25°. The depth direction was from the sea surface to 2 000 m underwater, and the water area was divided into 29 layers. First the fitting algorithm divided the Argo temperature profile into six layers with five depths. The layers were mixed layer, inter layer, thermocline, transition layer, the first deep layer, and the second deep layer. The first guess and the sea surface temperature obtained by linear regression were used as the initial conditions to reconstruct the three-dimensional temperature field. The RMSE of the reconstructed three-dimensional temperature field was small and well correlated with the original observation profile, indicating that the algorithm is reasonable and effective.
To meet the needs of marine research and marine surveys, a new algorithm for fitting three-dimensional temperature fields was developed based on the Argo profile and sea surface temperature data. The Northwest Pacific region was selected as the experimental sea area to validate the algorithm. The latitude and longitude range of the water area was set as: 30°–40°N, 140°–155°E, and the horizontal resolution was 0.25°. The depth direction was from the sea surface to 2 000 m underwater, and the water area was divided into 29 layers. First the fitting algorithm divided the Argo temperature profile into six layers with five depths. The layers were mixed layer, inter layer, thermocline, transition layer, the first deep layer, and the second deep layer. The first guess and the sea surface temperature obtained by linear regression were used as the initial conditions to reconstruct the three-dimensional temperature field. The RMSE of the reconstructed three-dimensional temperature field was small and well correlated with the original observation profile, indicating that the algorithm is reasonable and effective.


2020, 42(11): 123-130.
doi: 10.3969/j.issn.0253-4193.2020.11.012
Abstract:
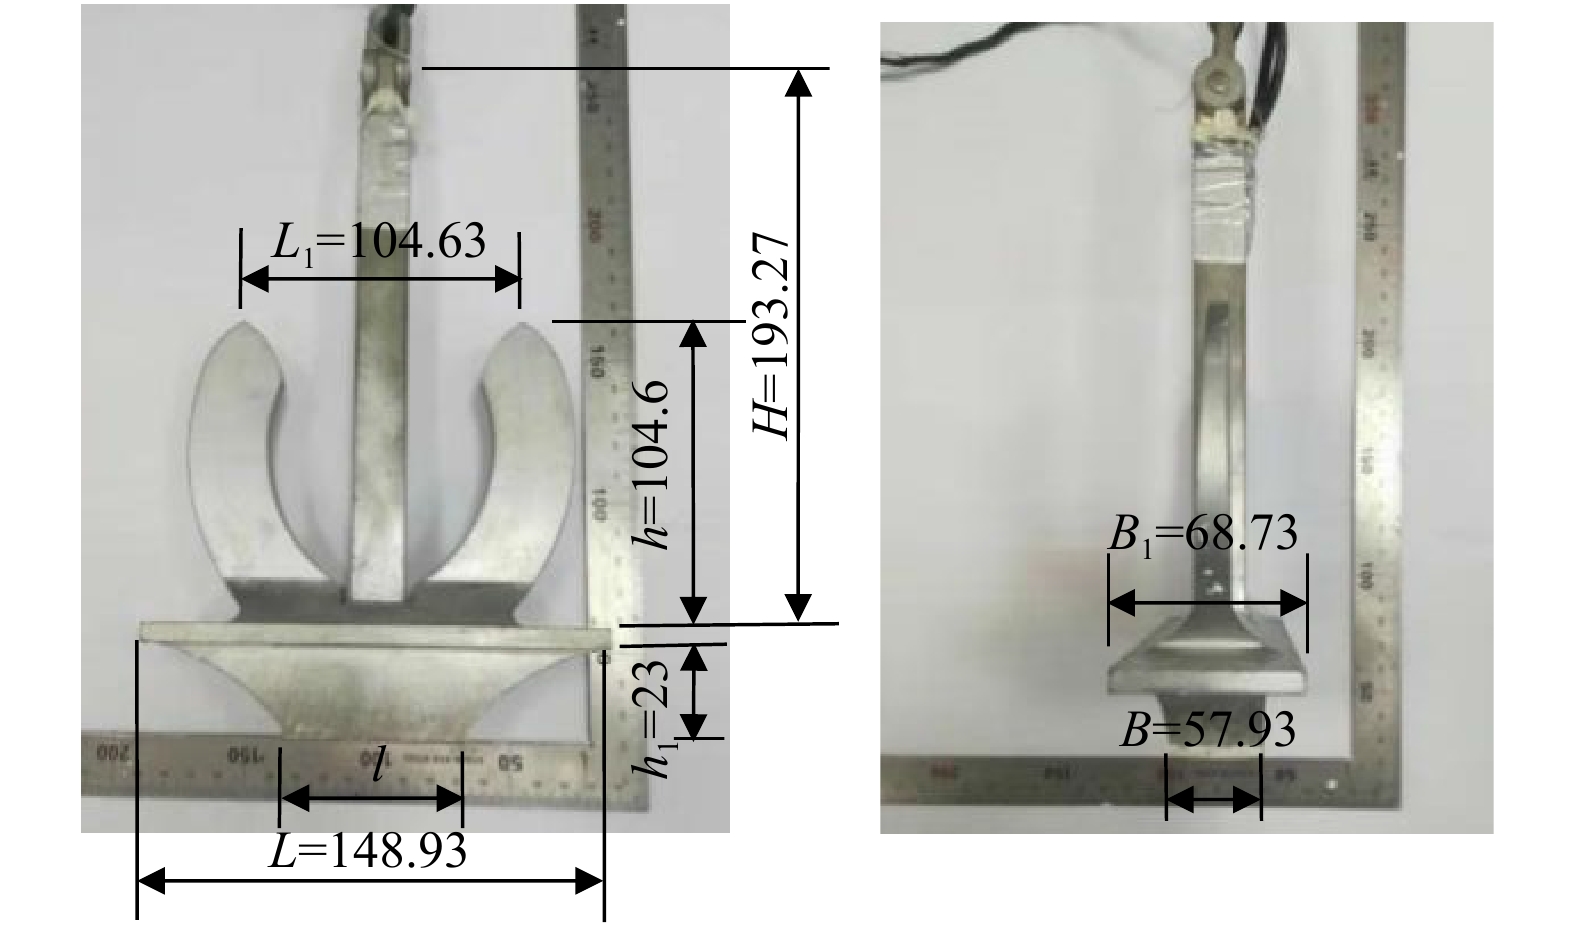
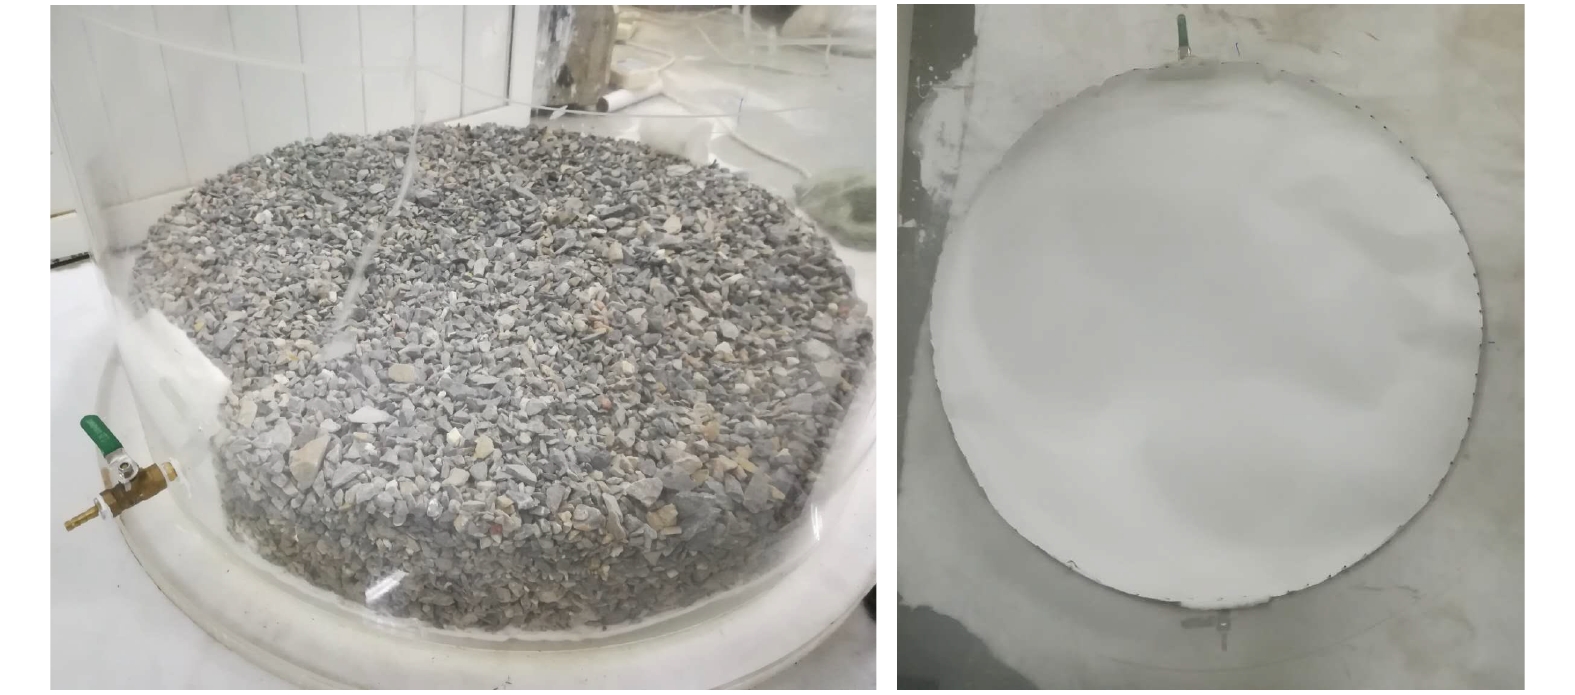
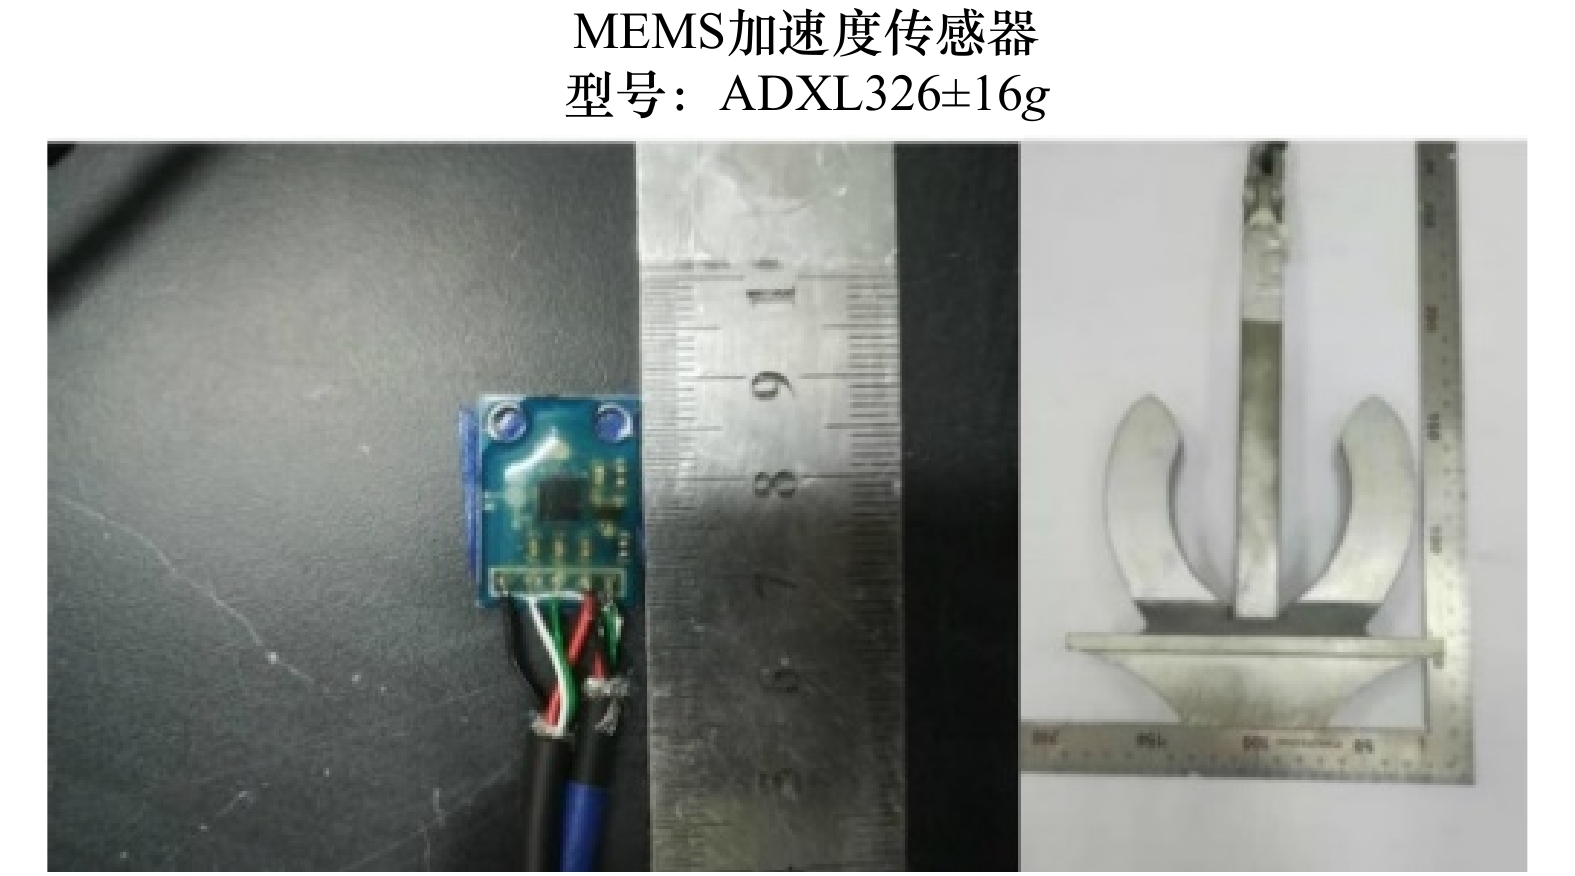
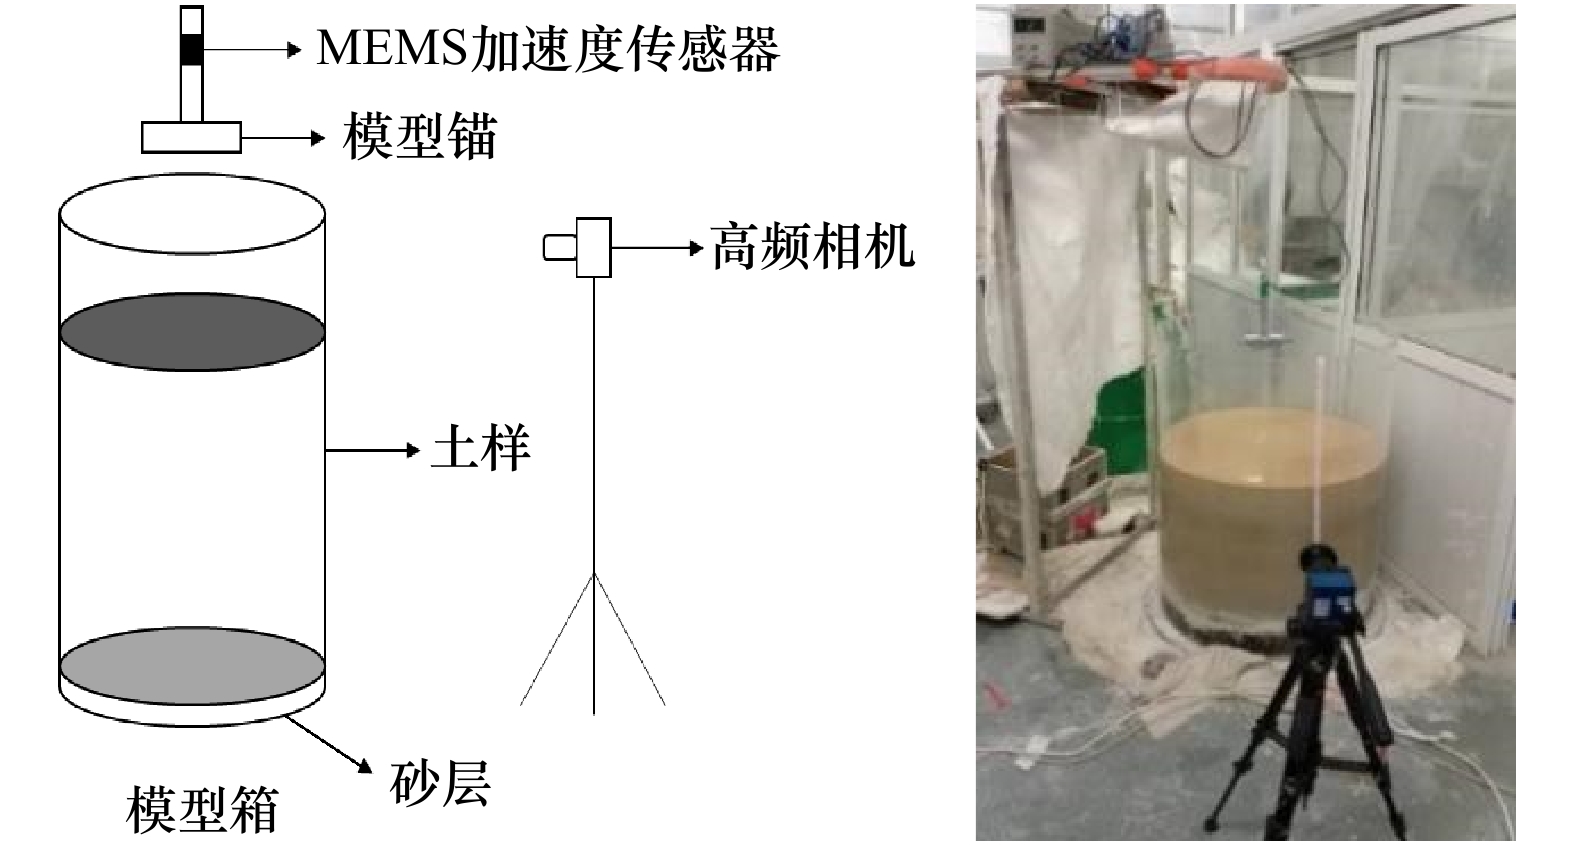
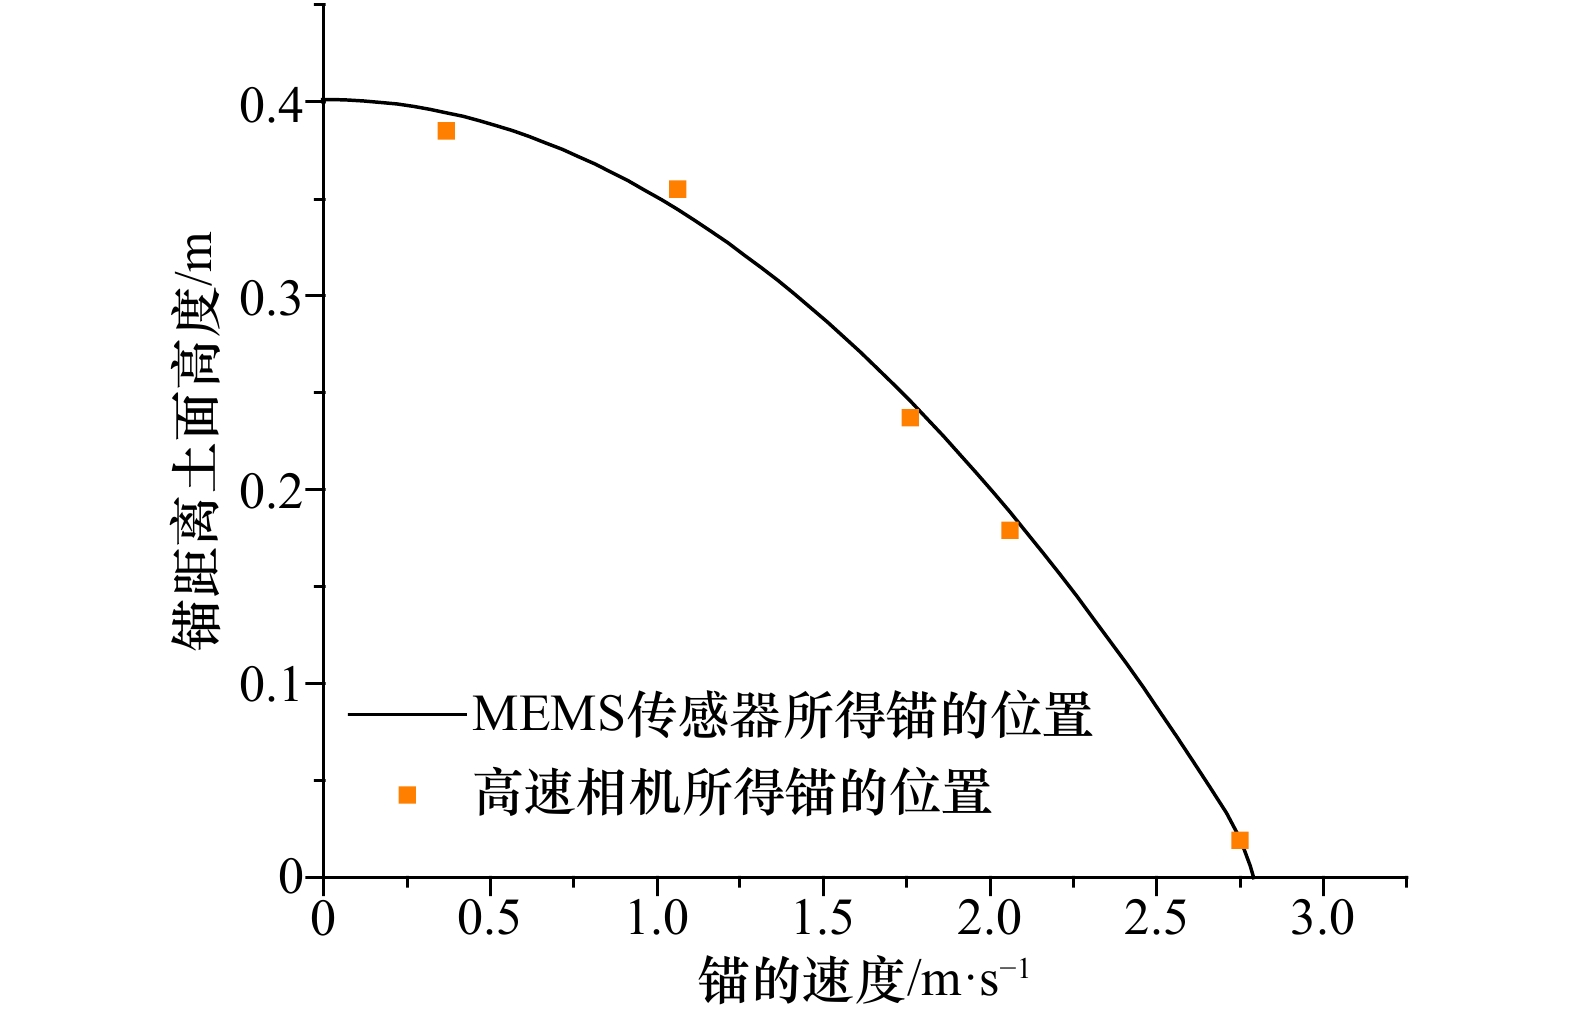
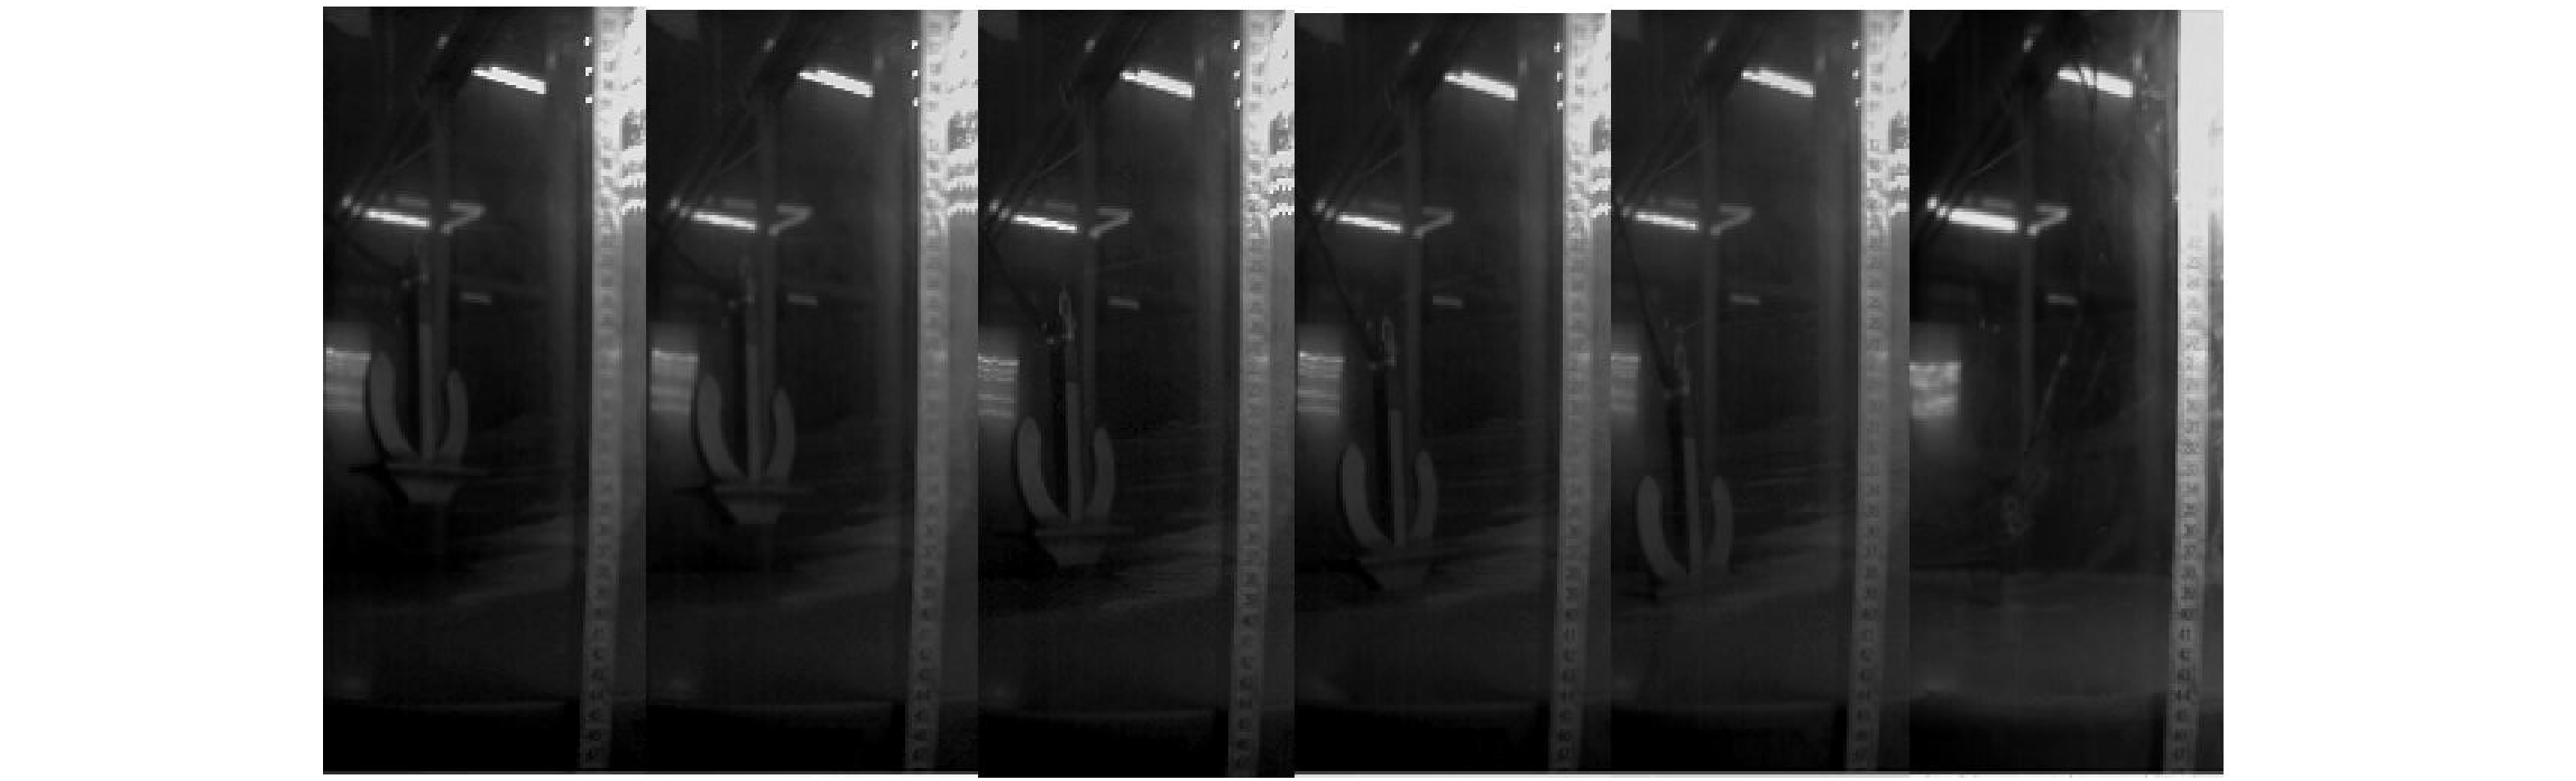
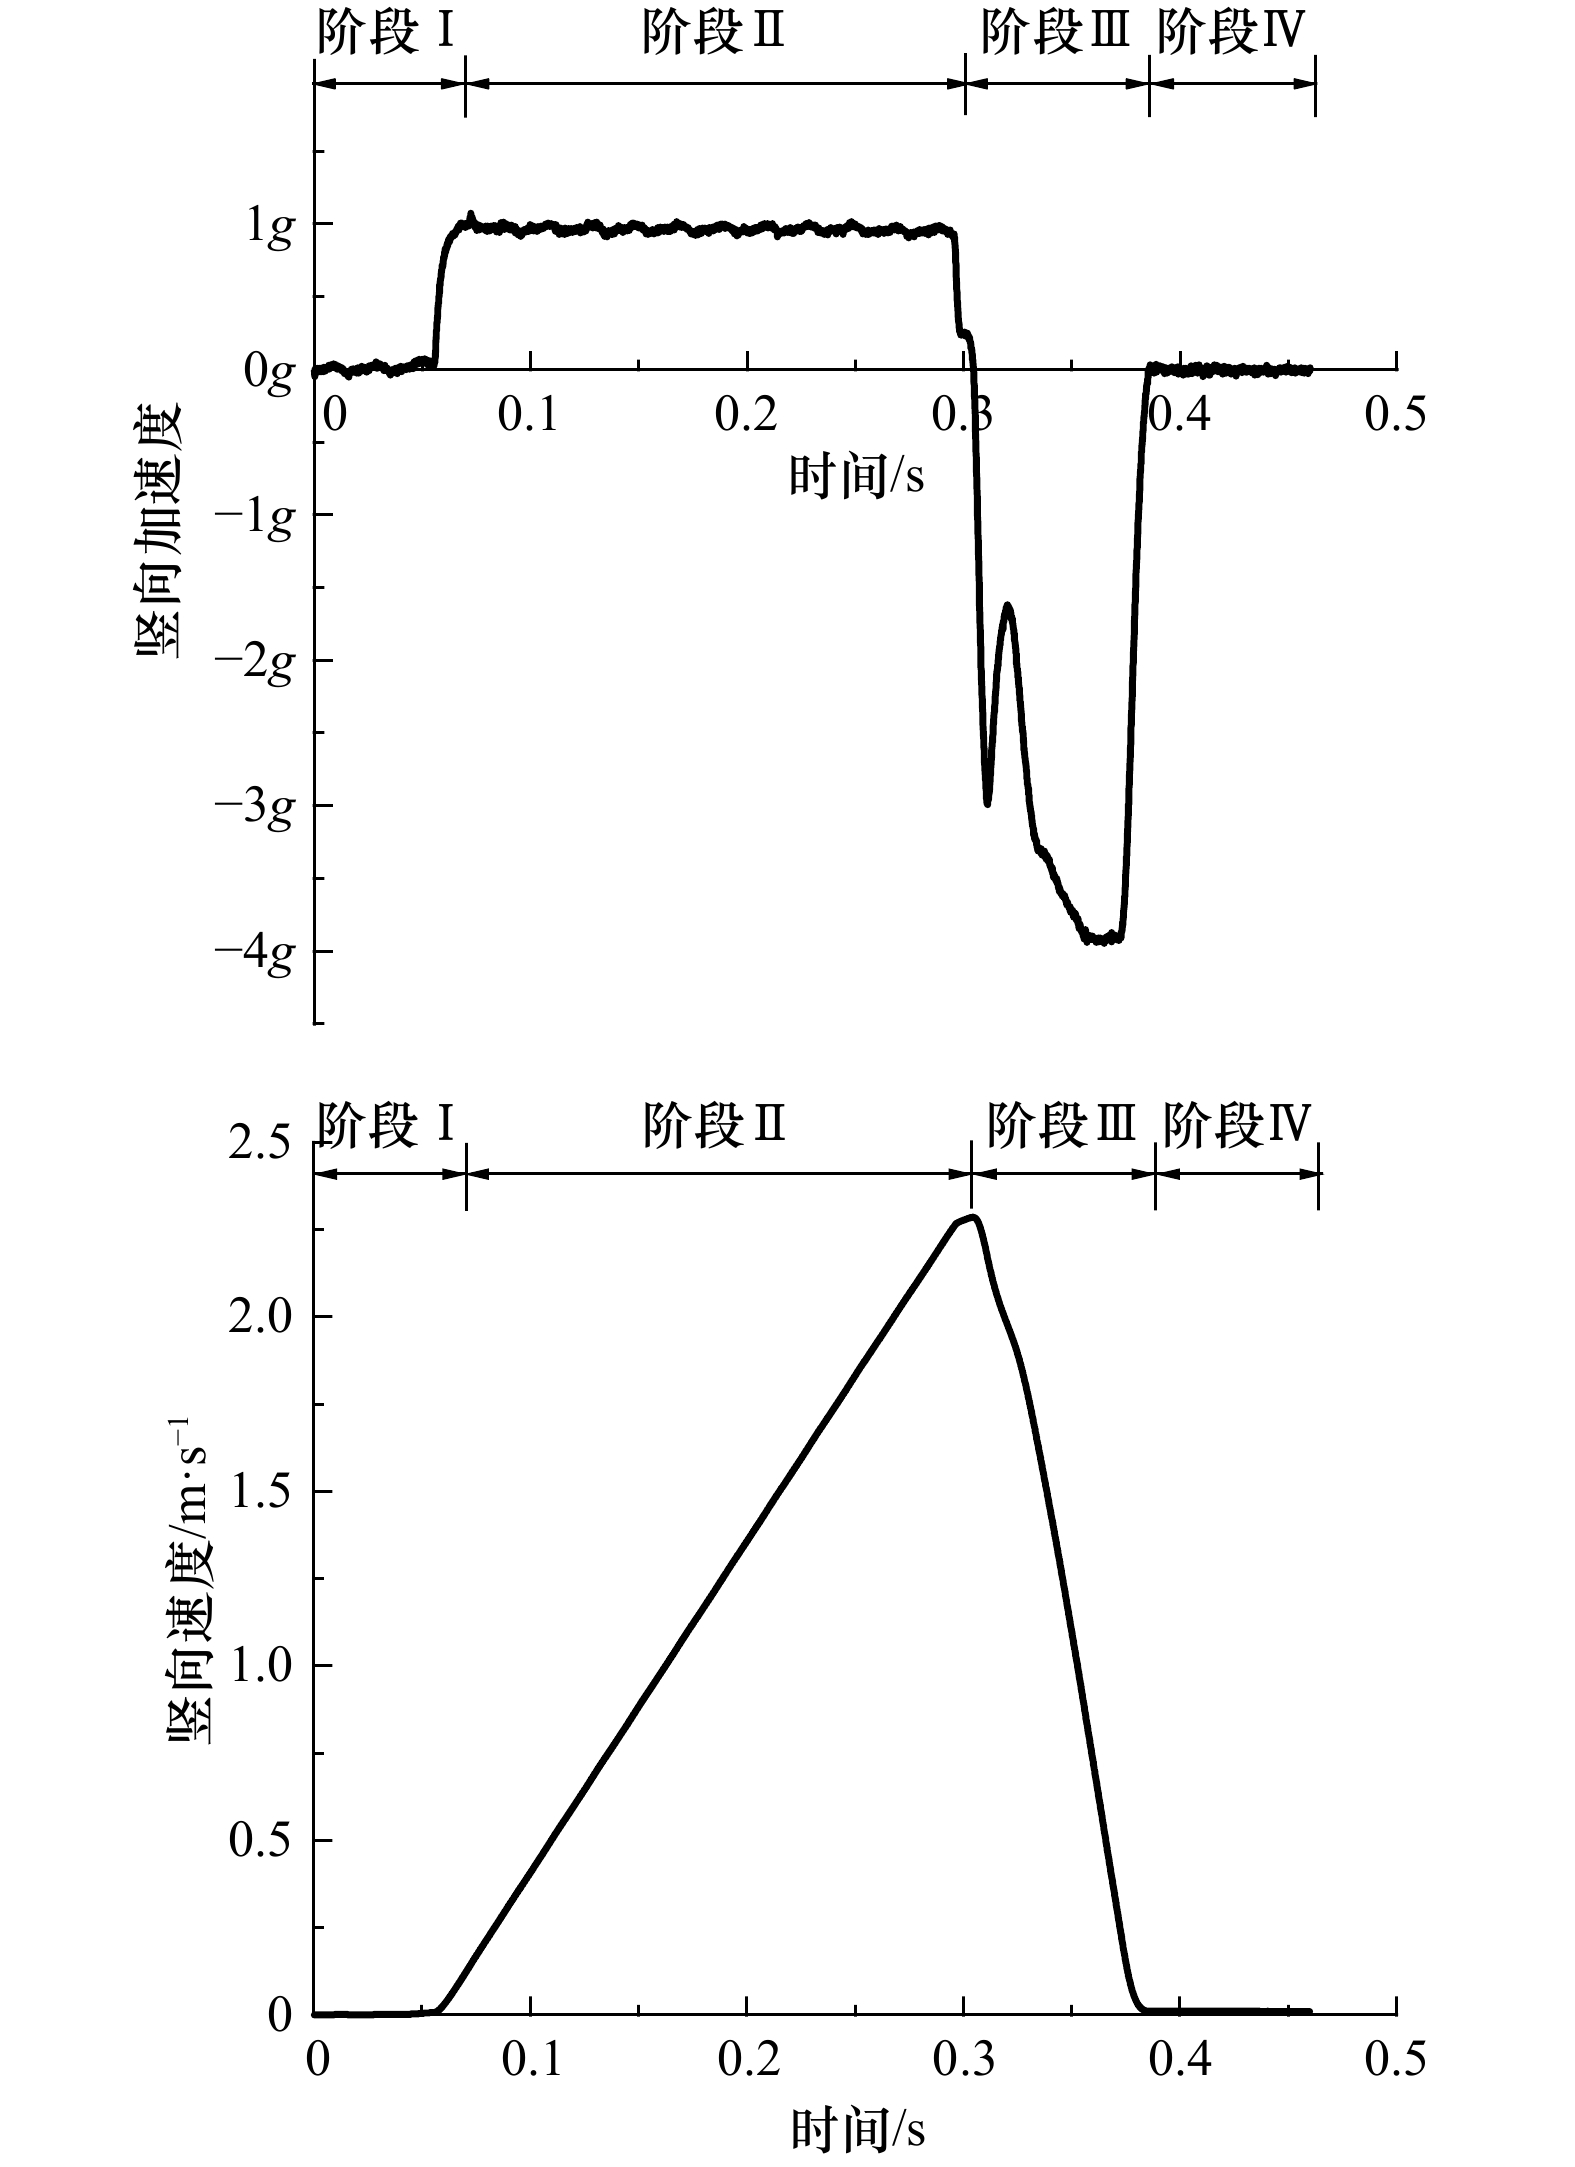
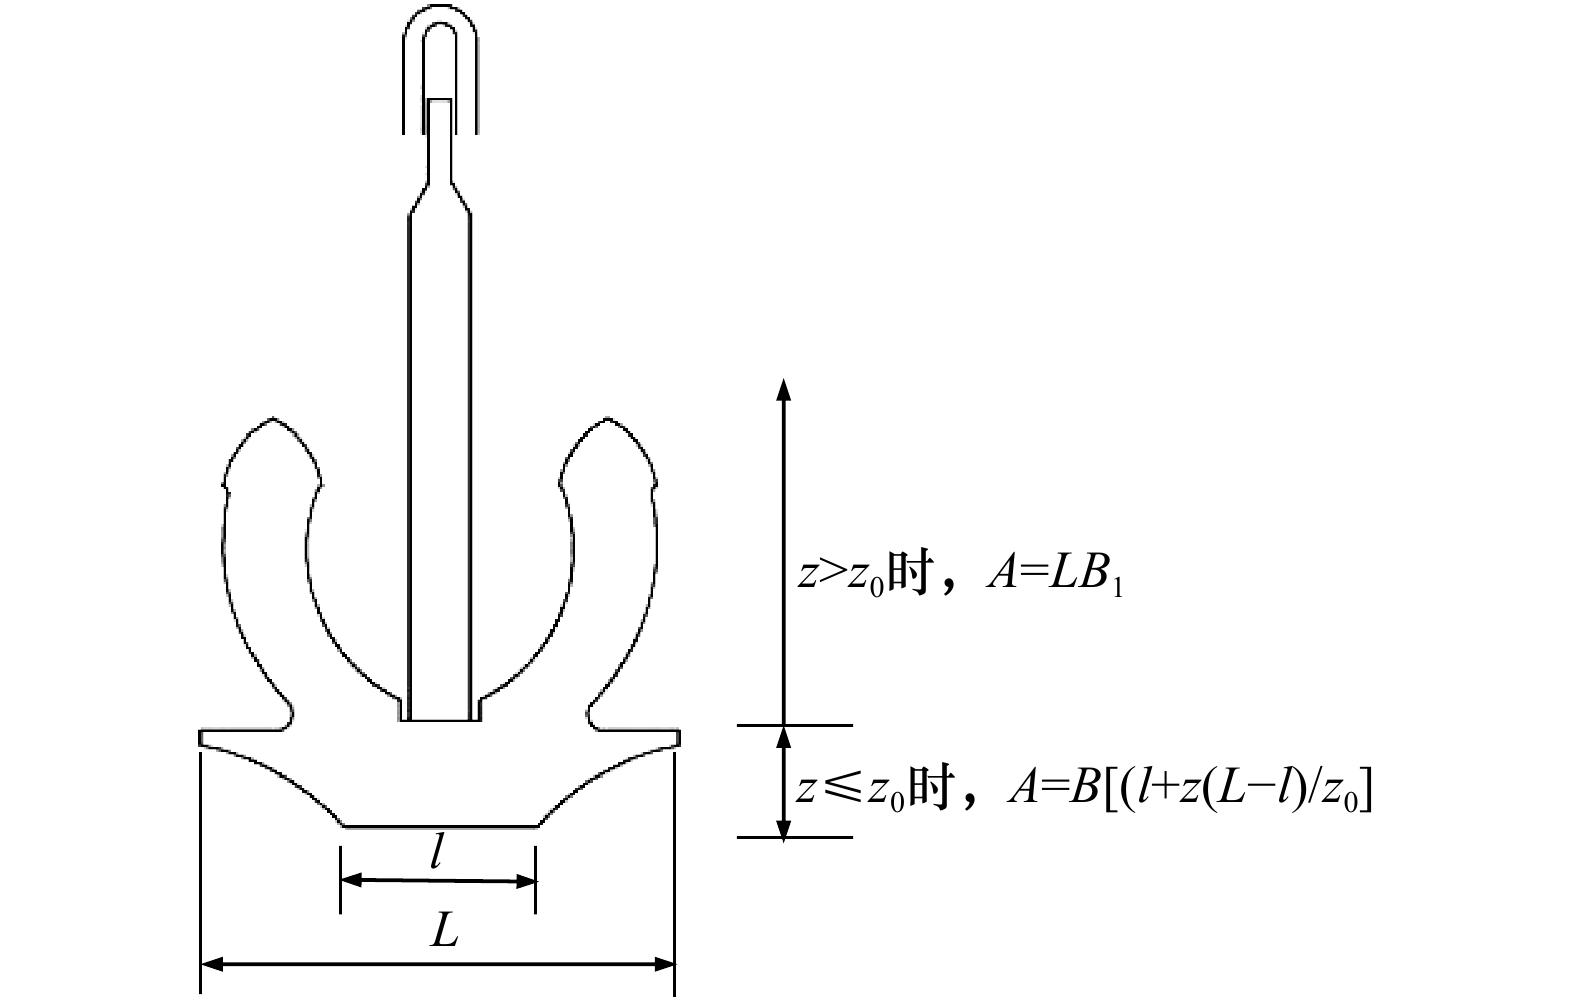
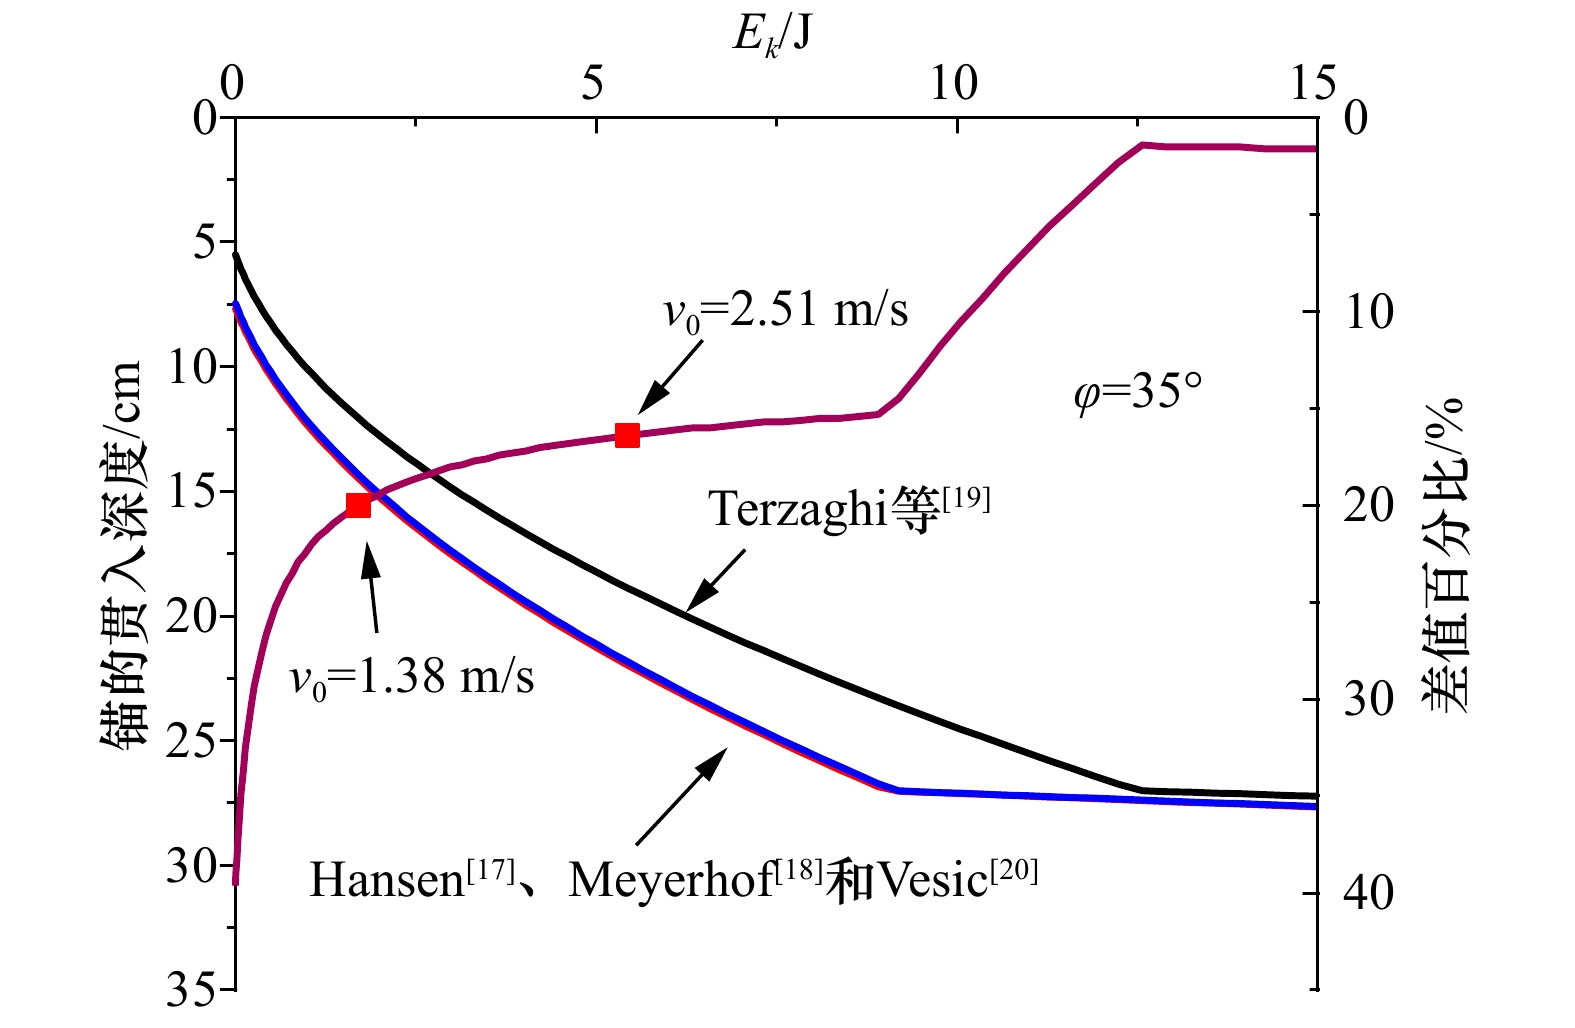
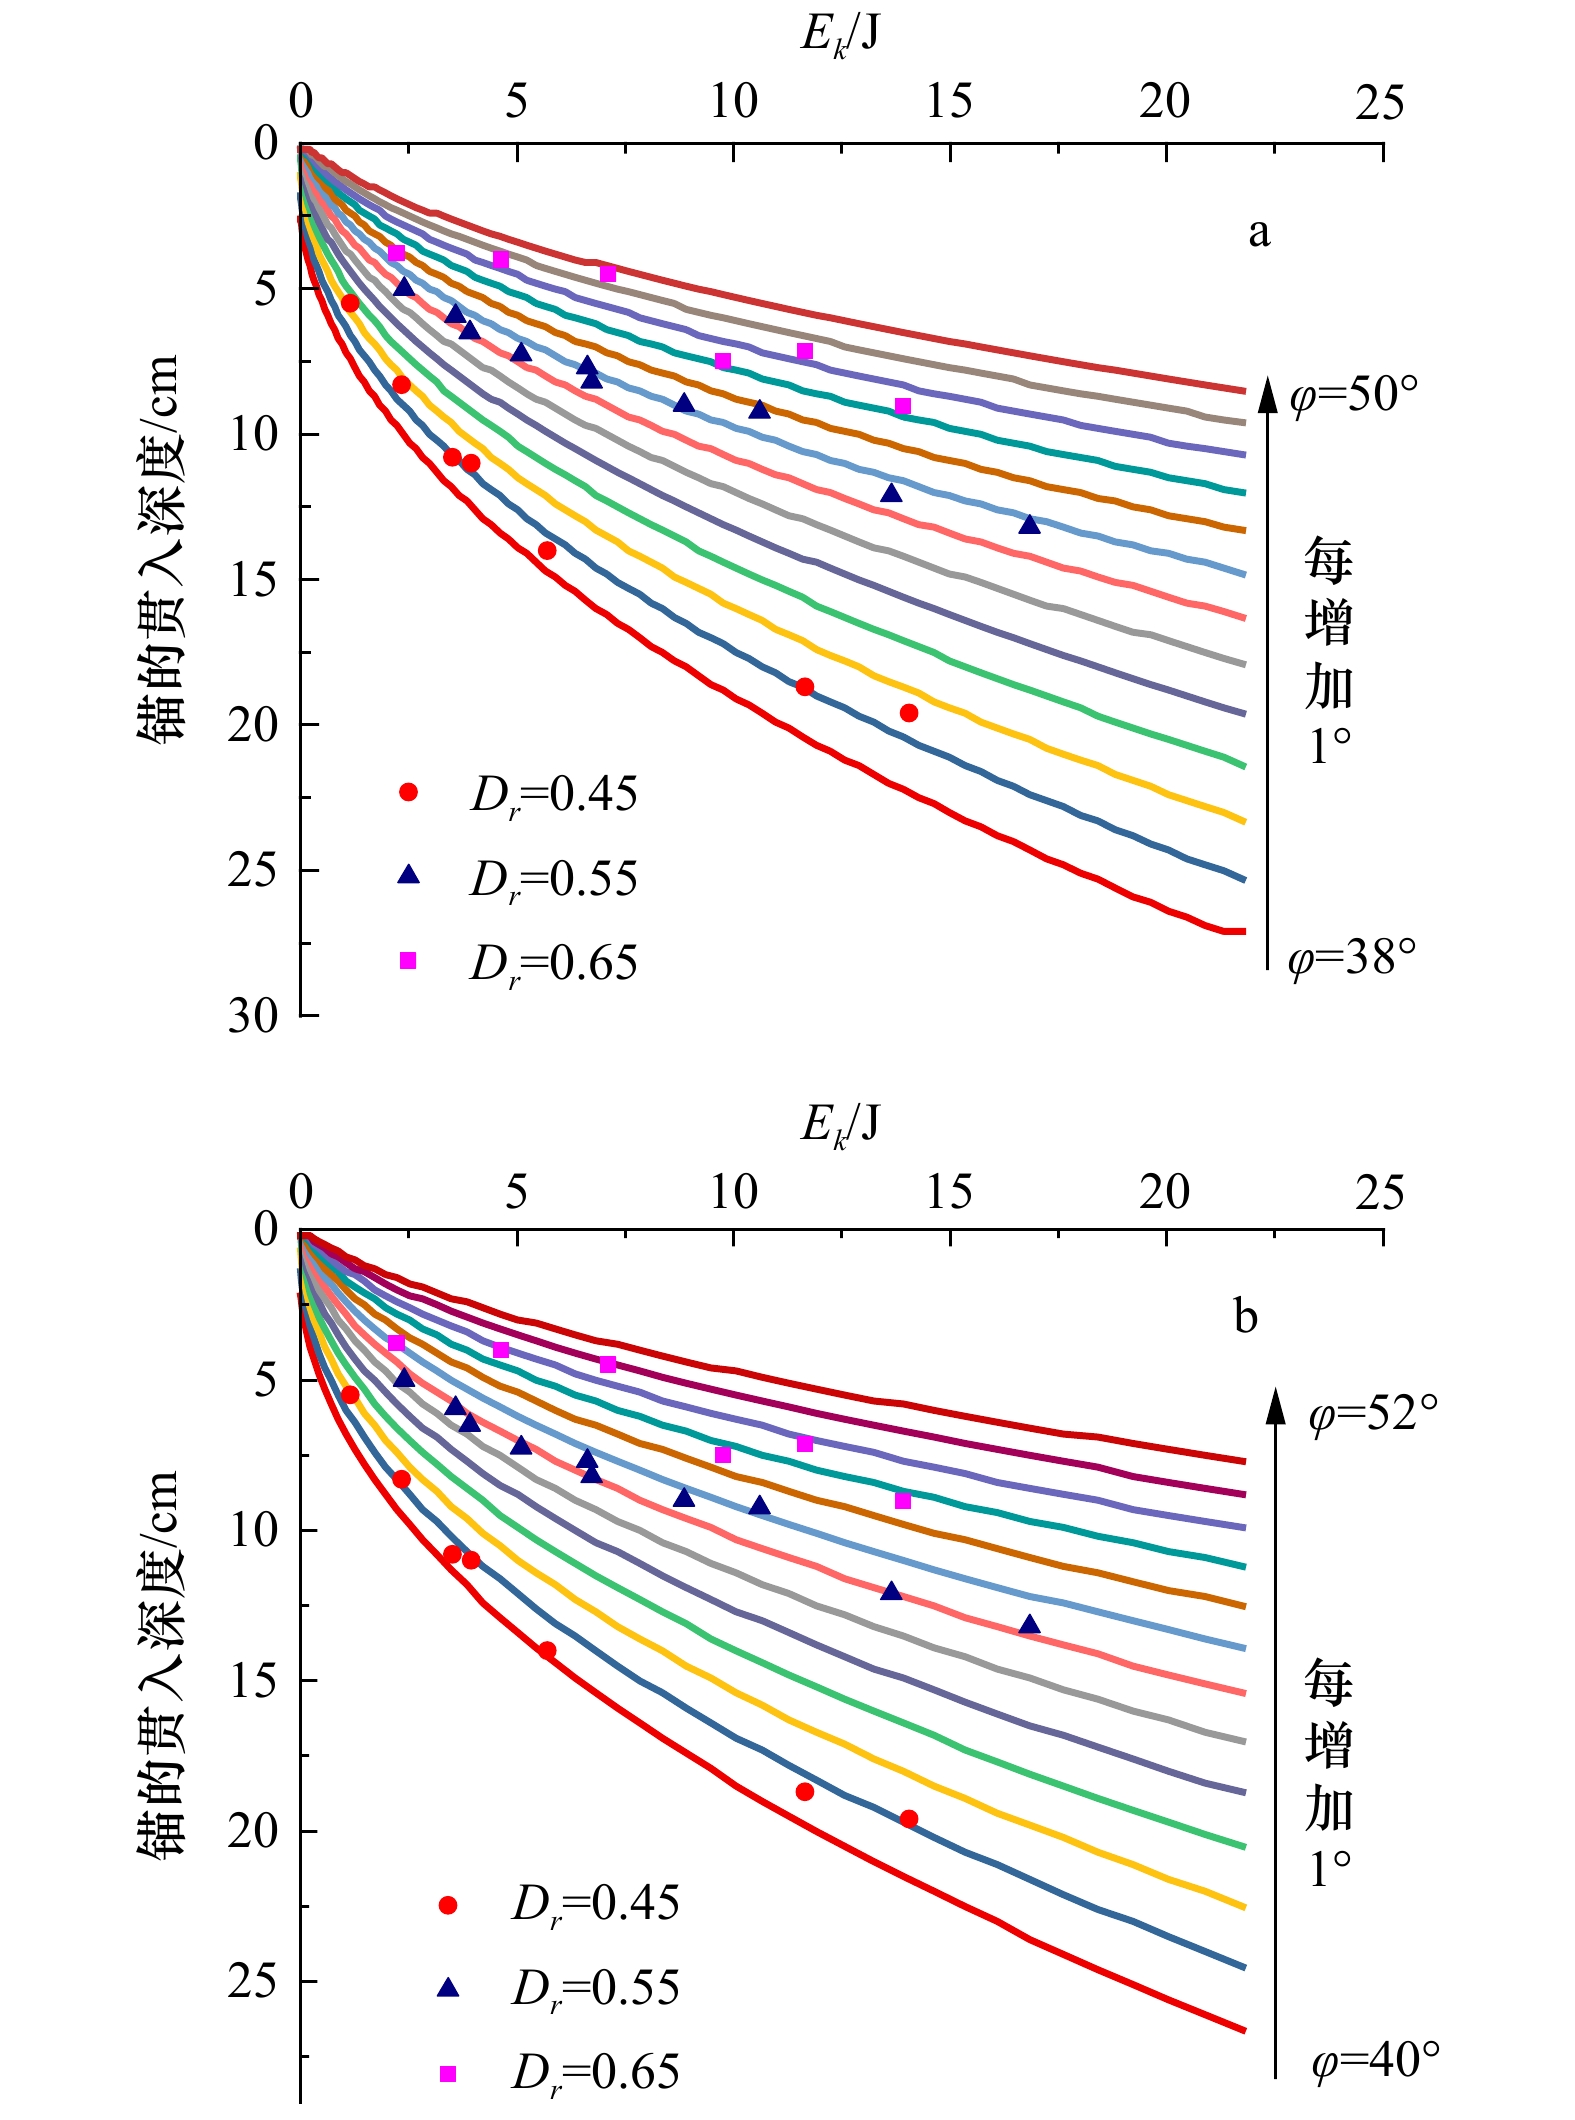
The structures in the riverbed or seabed may be affected or damaged by emergency anchoring. In the channel with frequent navigation, the emergency anchoring penetration depth need to be fully considered during the design of the buried depth of structures in riverbed. In this paper, small scale model tests are carried out to simulate the process of anchoring penetration of hall anchor in silty sand, and the influences of different impact velocities (1.15−4.4 m/s) and relative density of silty sand (0.45−0.65) on anchoring penetration depth are investigated. Based on the Terzaghi ultimate bearing capacity theory and the energy conservation law, the expression of penetration depth of the hall anchor in silty sand is deduced, and the theoretical calculation results are conservative compared with experimental results, the revised results of the theoretical calculation results are in good agreement with experimental data. The research results can provide a reference for the design of buried depth of structures in silty sand riverbed or seabed.
The structures in the riverbed or seabed may be affected or damaged by emergency anchoring. In the channel with frequent navigation, the emergency anchoring penetration depth need to be fully considered during the design of the buried depth of structures in riverbed. In this paper, small scale model tests are carried out to simulate the process of anchoring penetration of hall anchor in silty sand, and the influences of different impact velocities (1.15−4.4 m/s) and relative density of silty sand (0.45−0.65) on anchoring penetration depth are investigated. Based on the Terzaghi ultimate bearing capacity theory and the energy conservation law, the expression of penetration depth of the hall anchor in silty sand is deduced, and the theoretical calculation results are conservative compared with experimental results, the revised results of the theoretical calculation results are in good agreement with experimental data. The research results can provide a reference for the design of buried depth of structures in silty sand riverbed or seabed.


2020, 42(11): 131-141.
doi: 10.3969/j.issn.0253-4193.2020.11.013
Abstract:
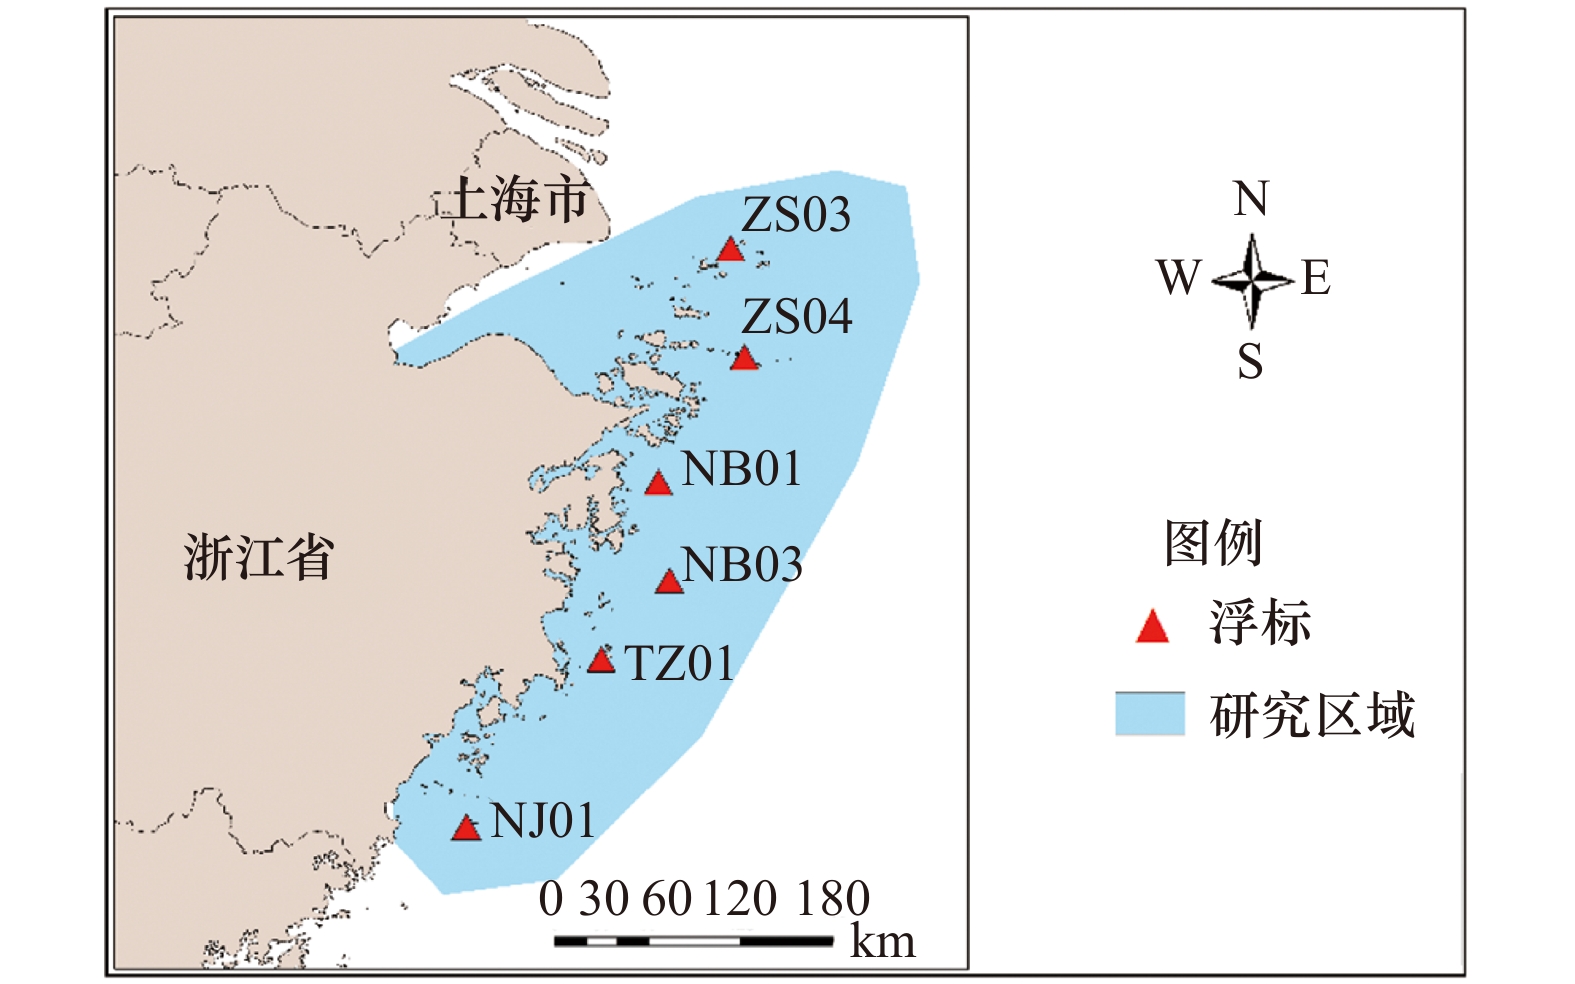
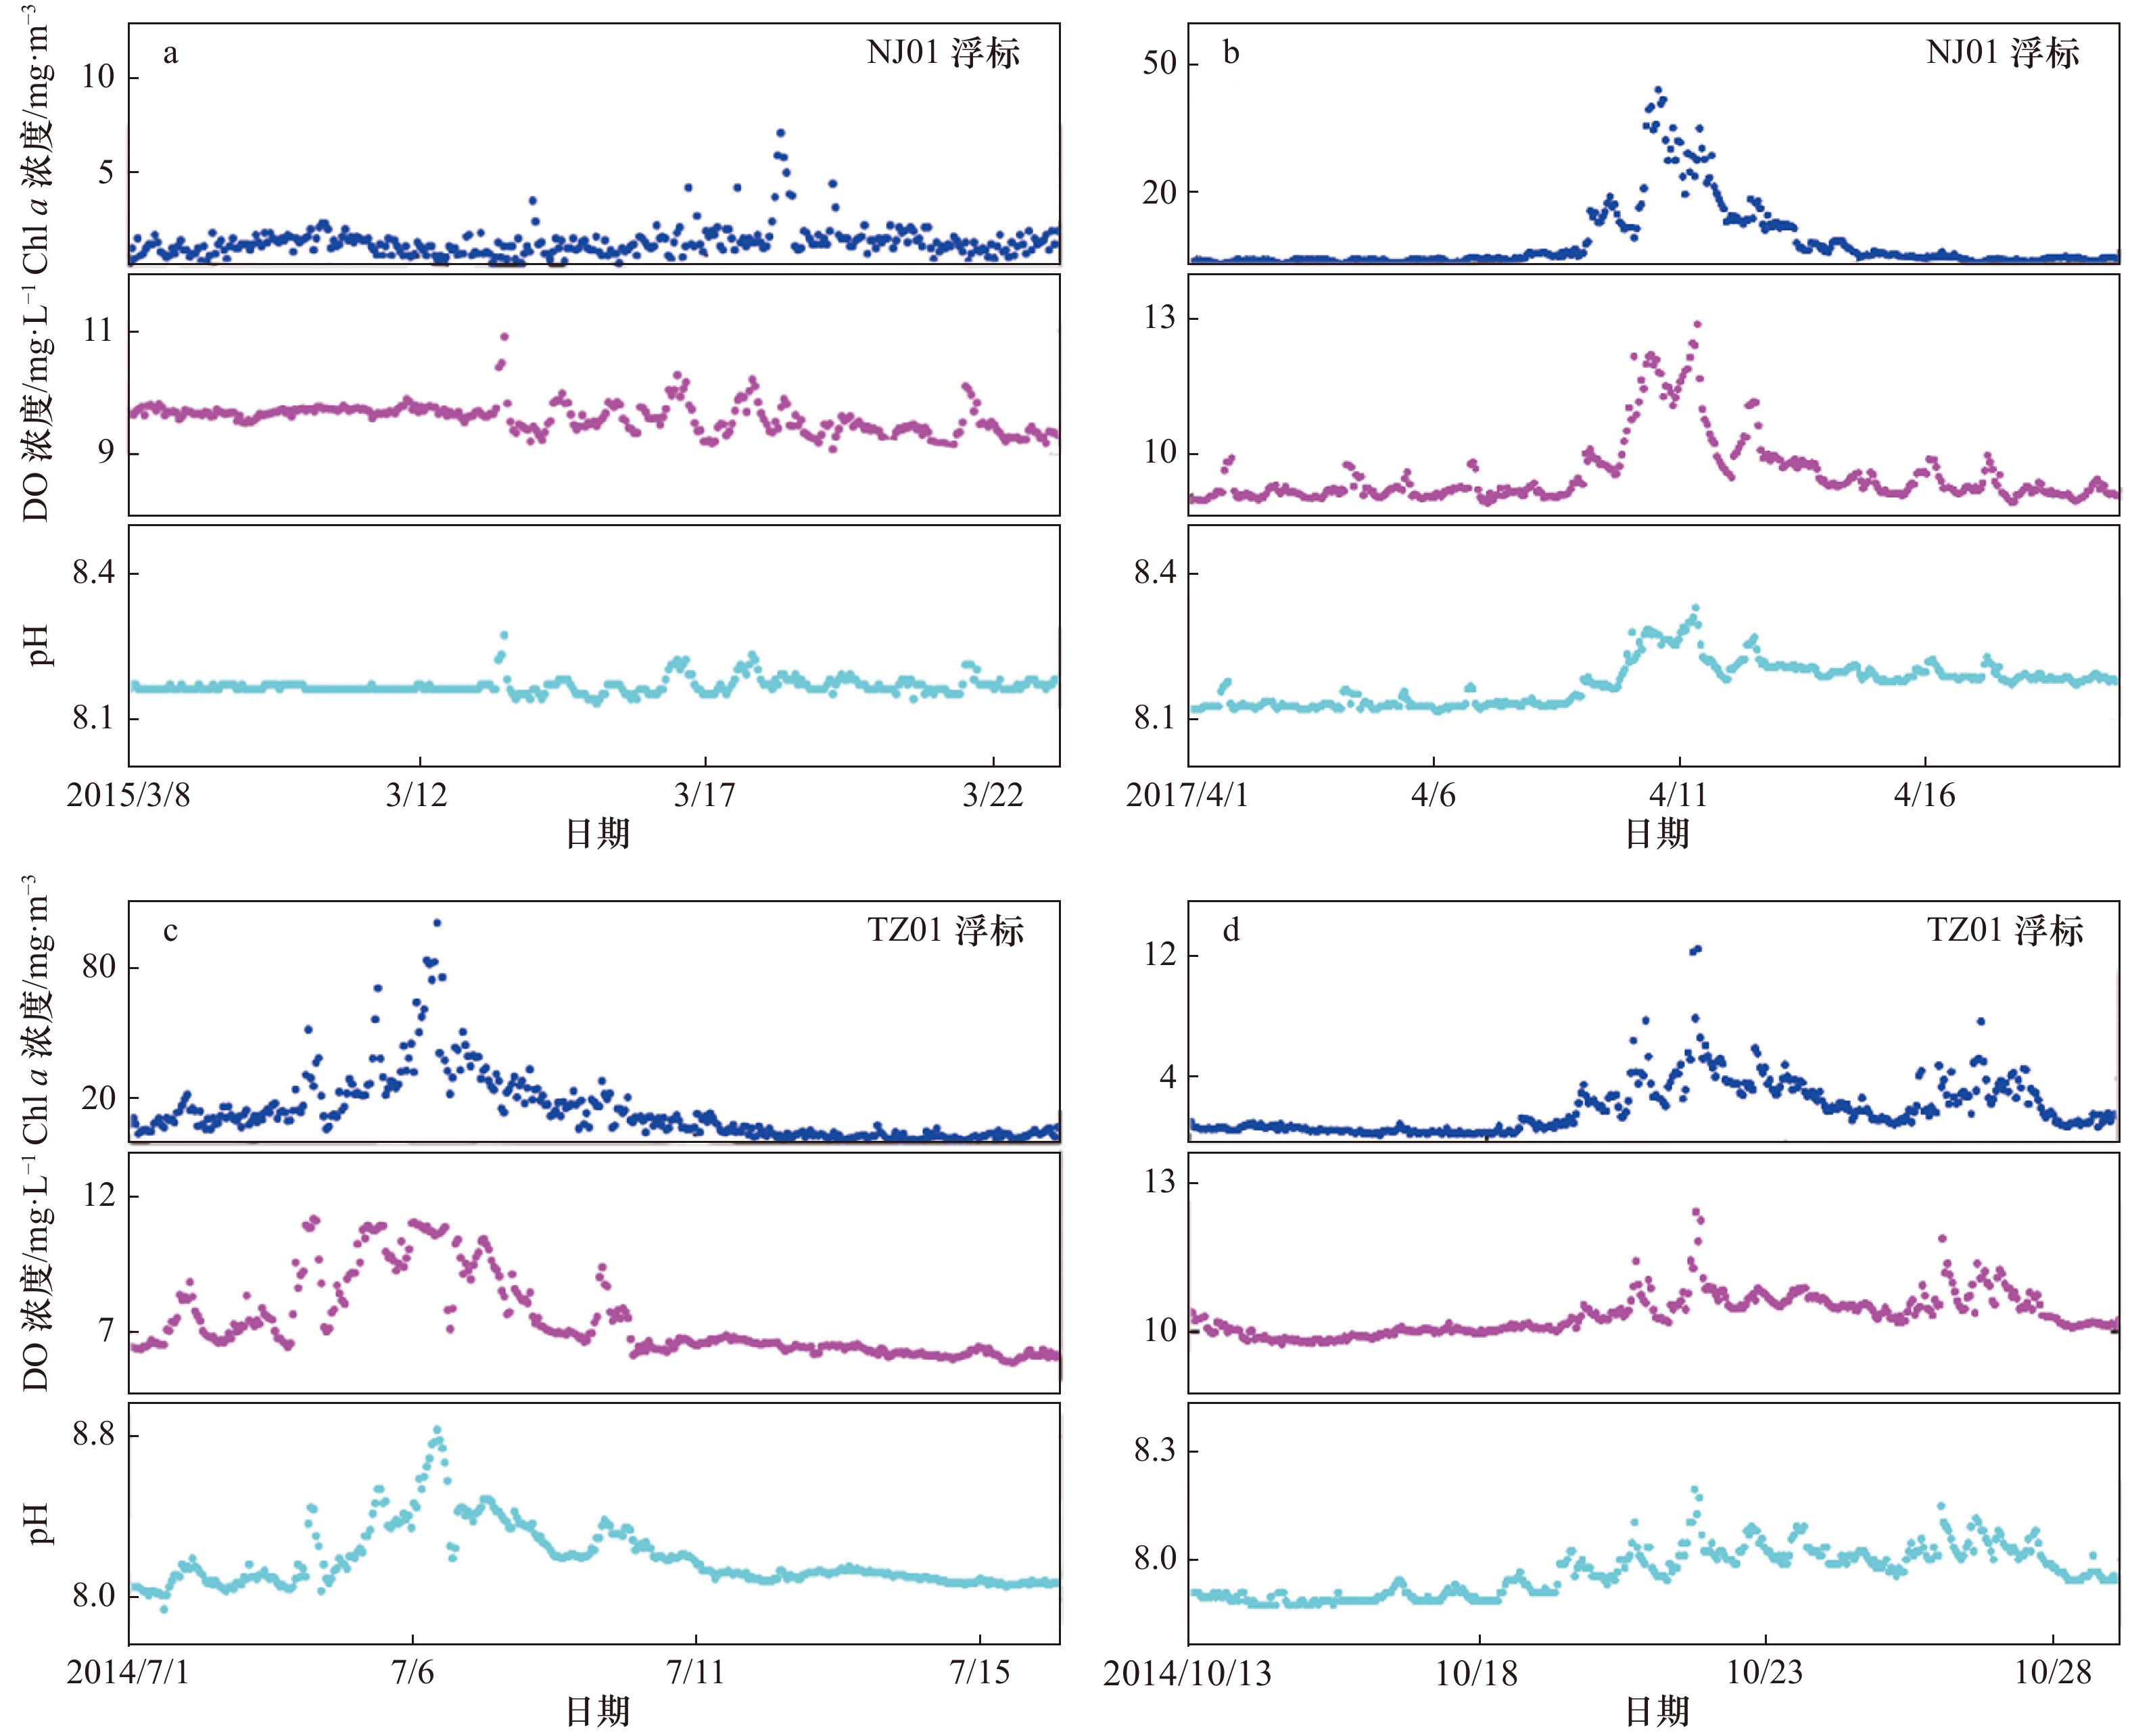
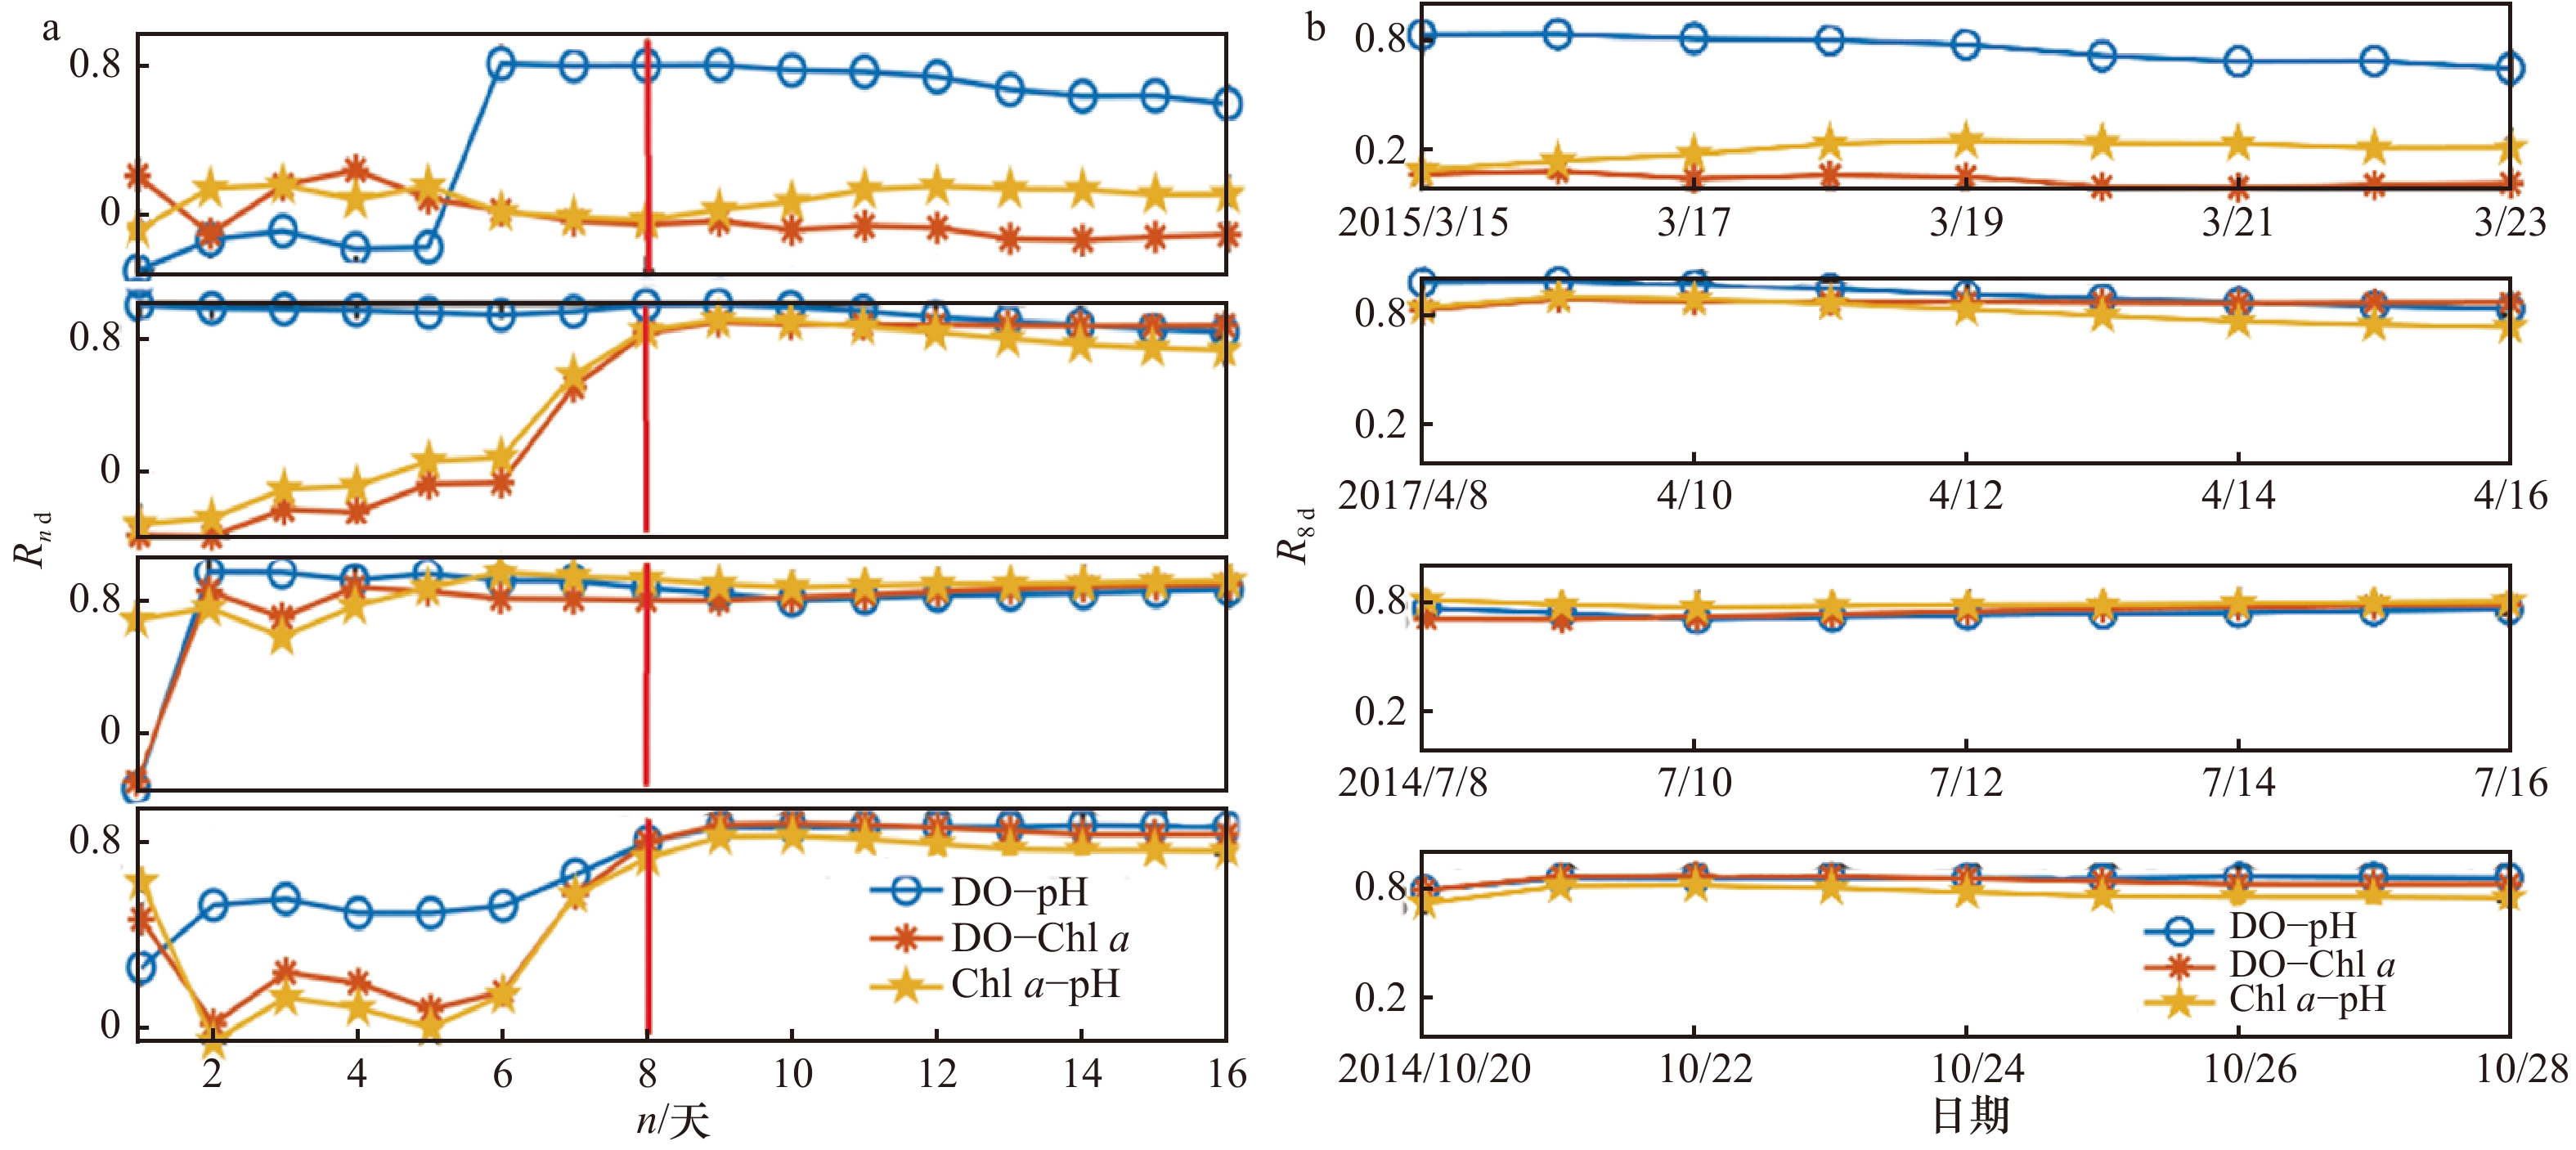
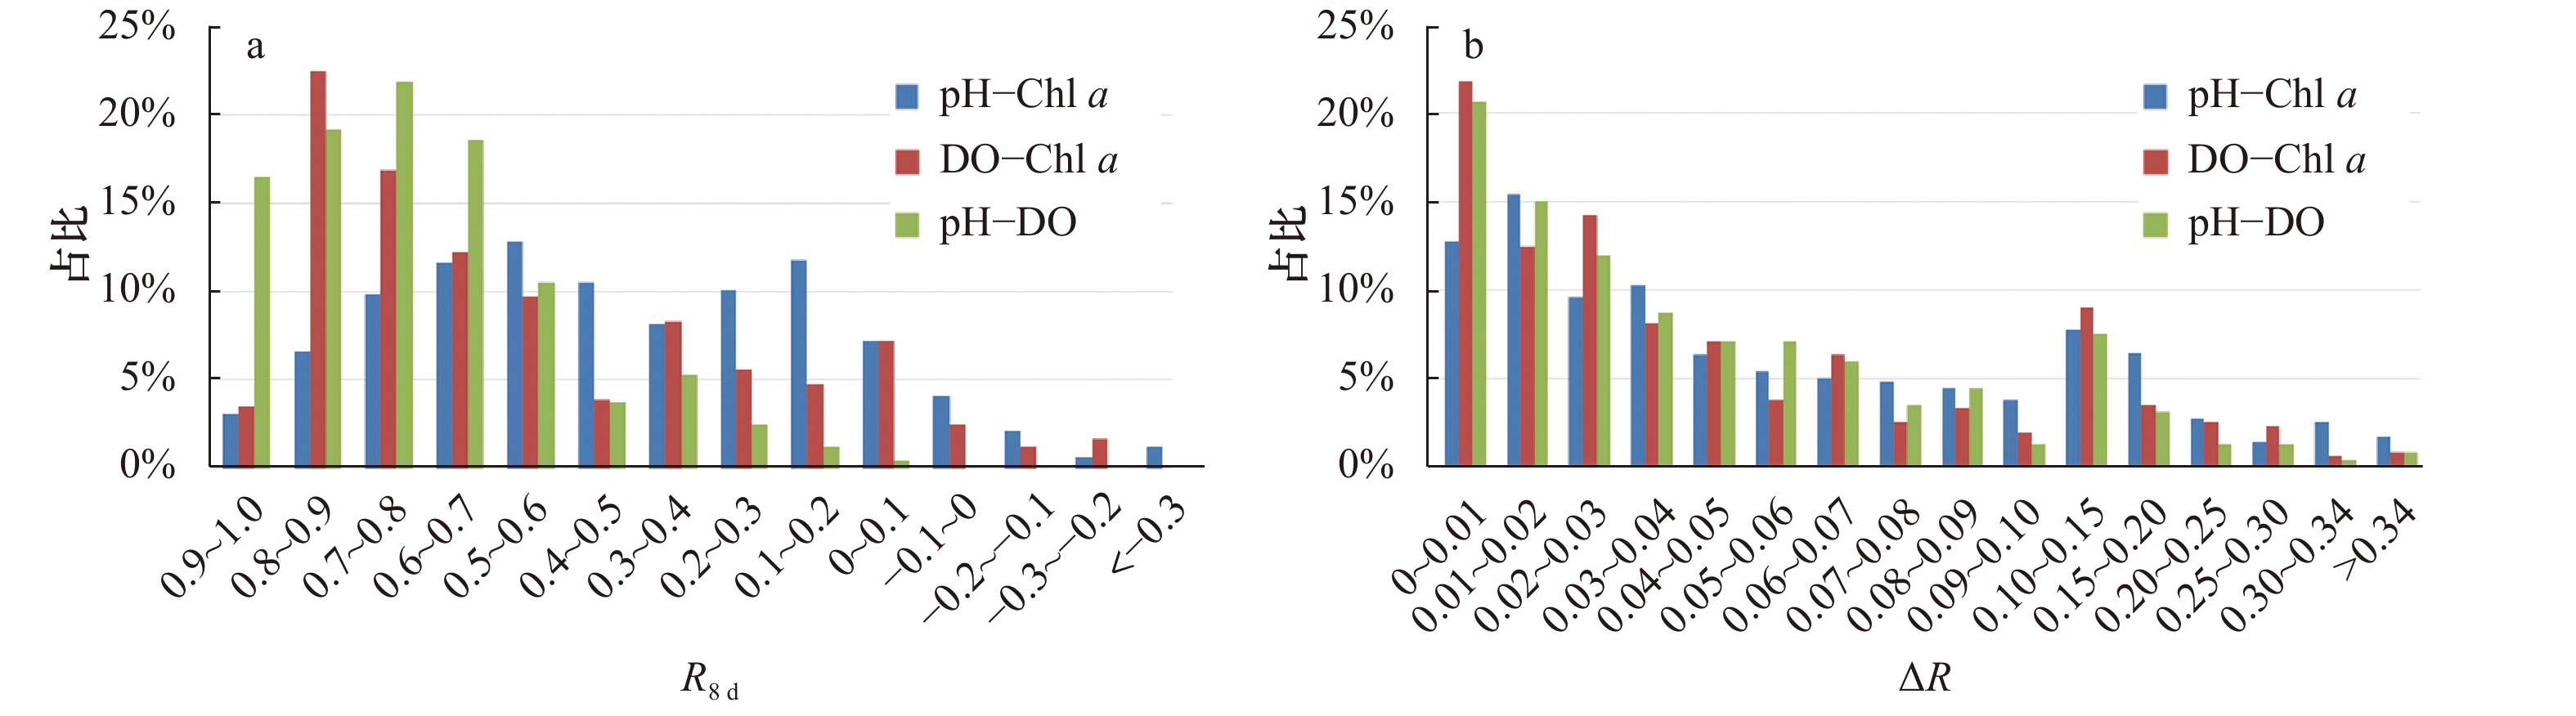
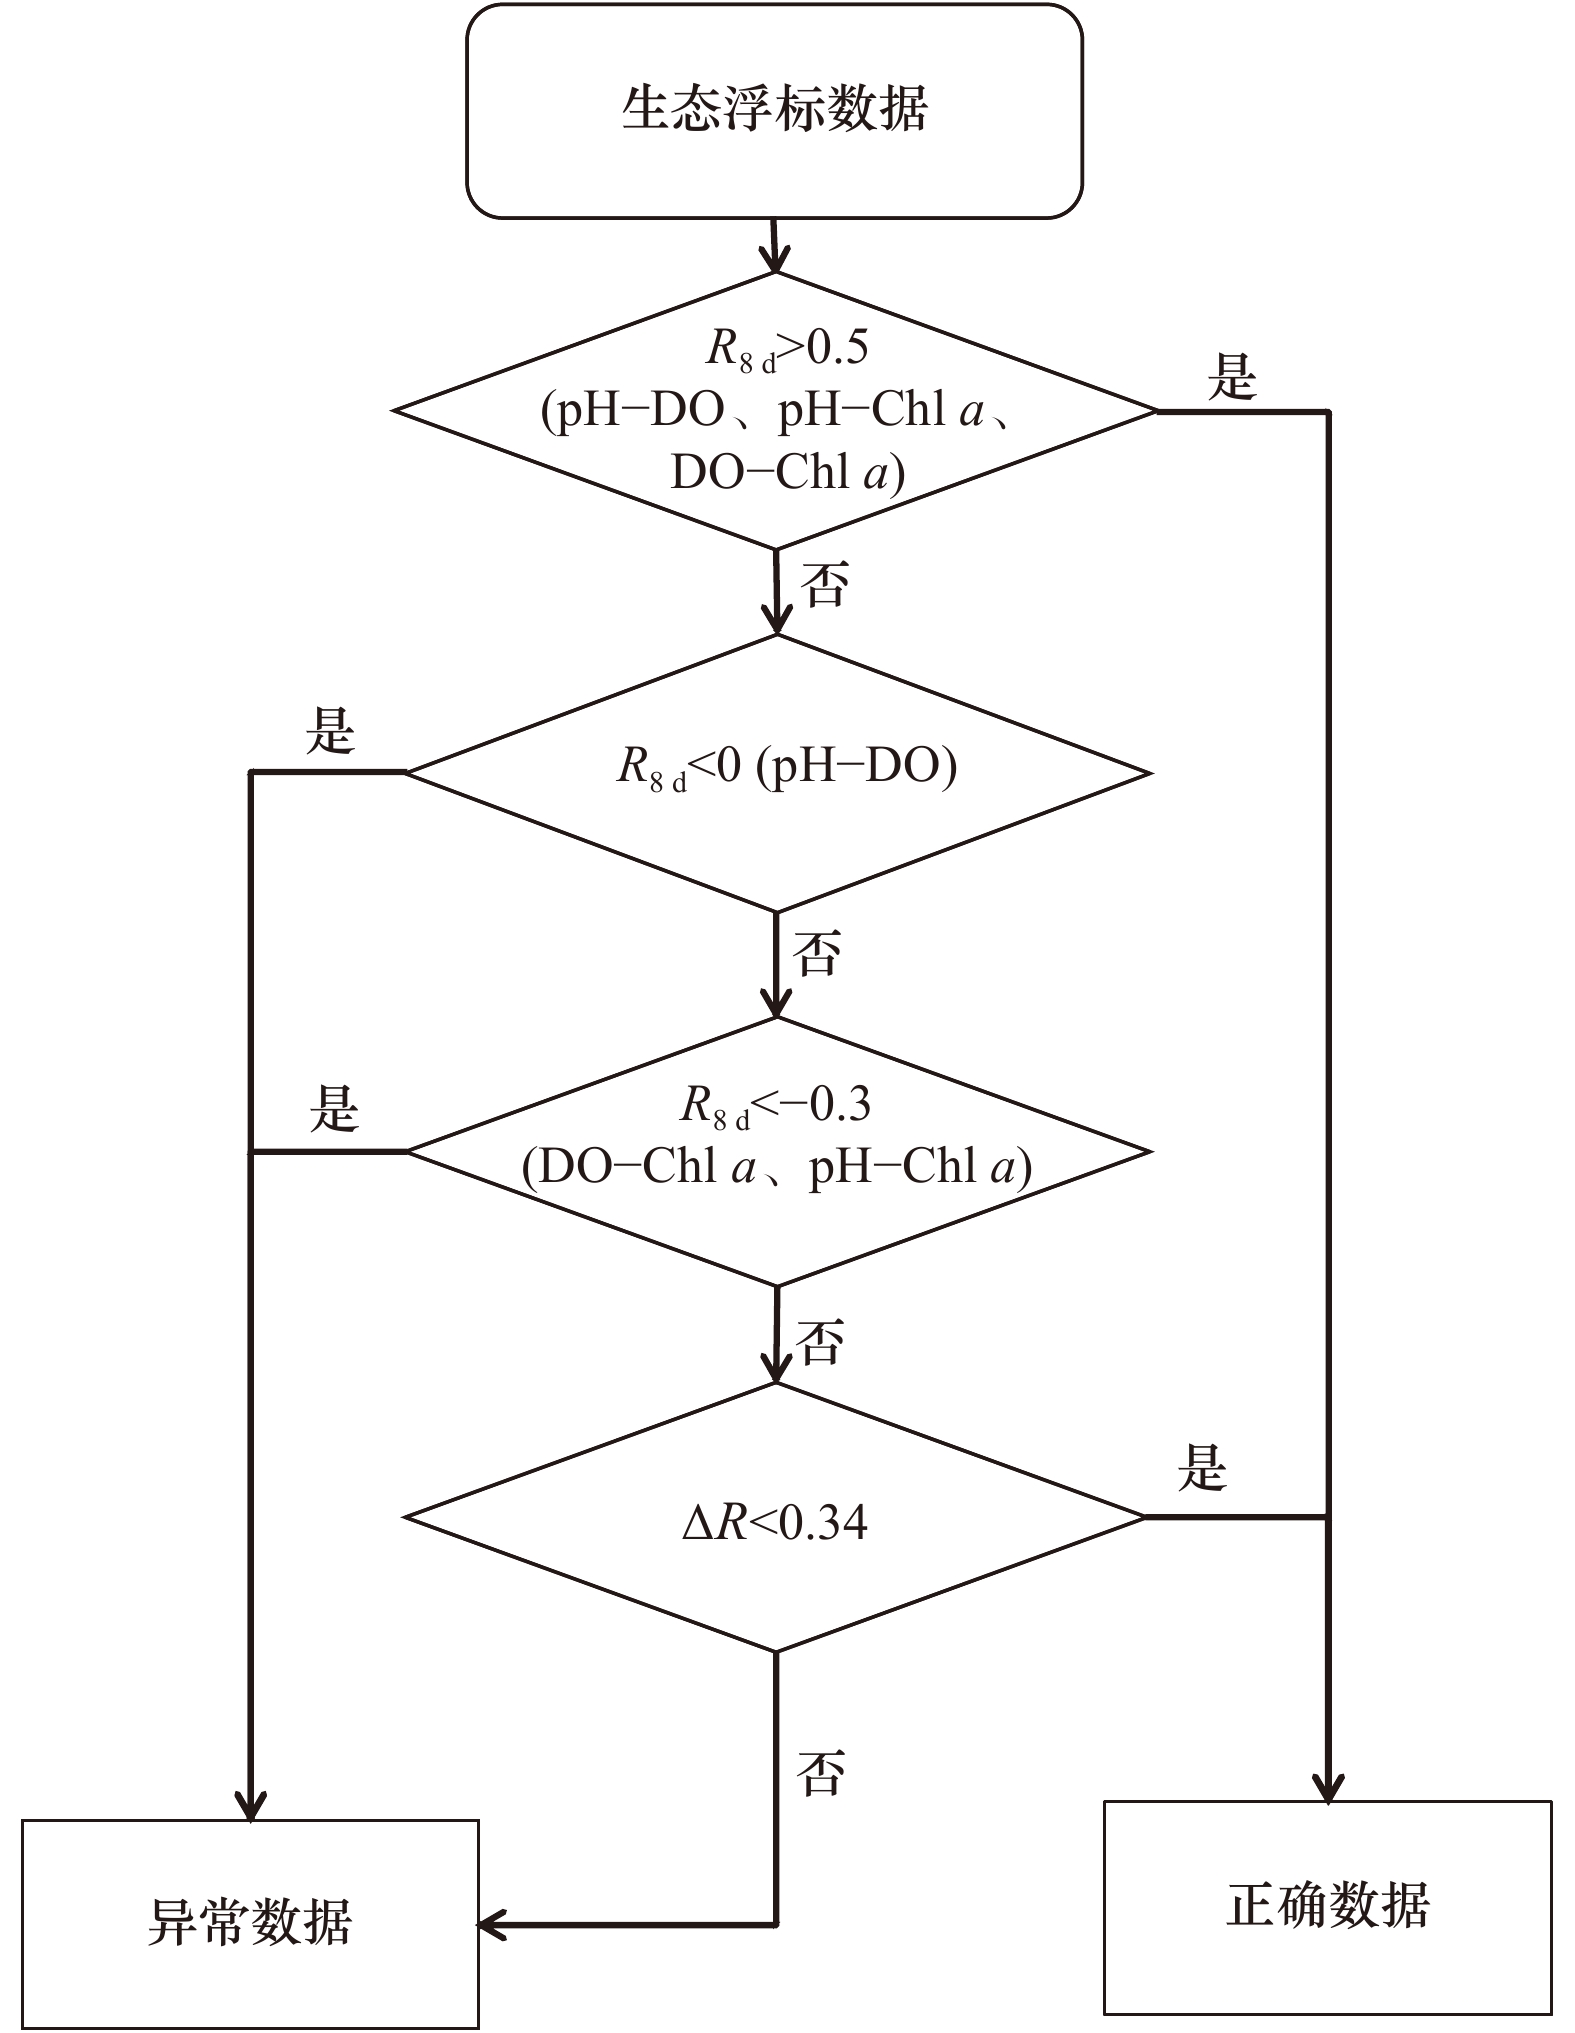
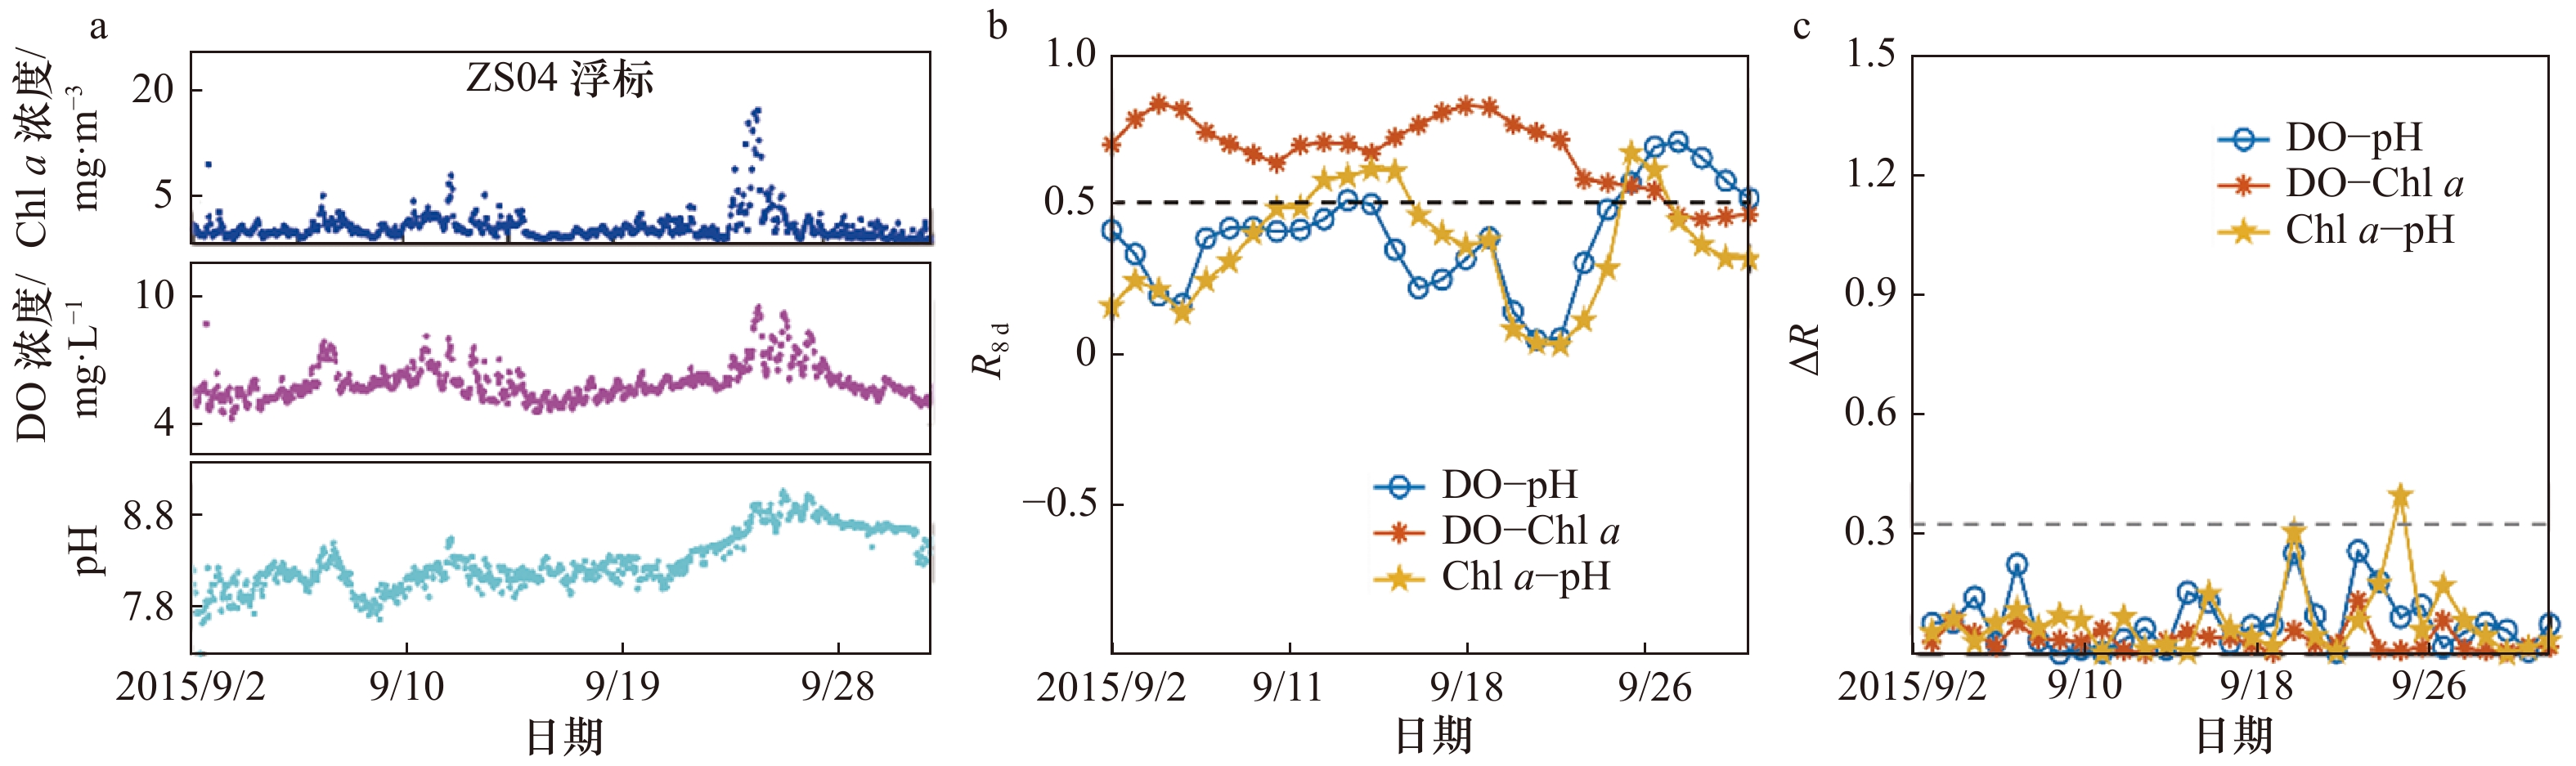
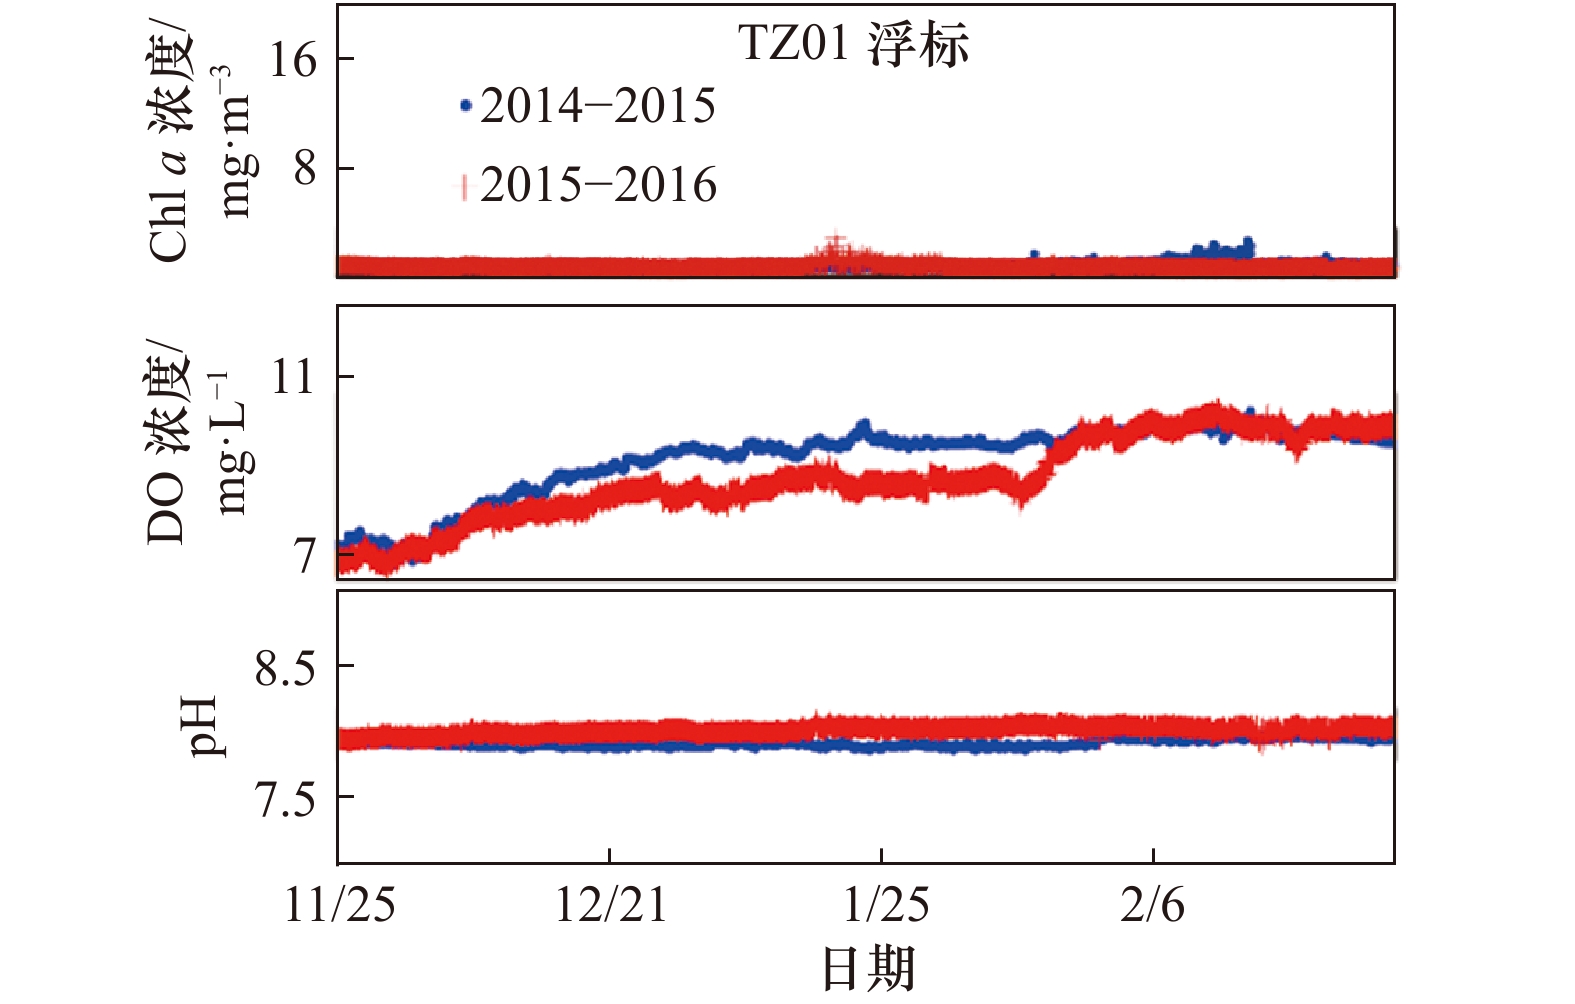
The identification of abnormal marine ecological buoy data is the key to ensure the quality of buoy data. In this study, we found that the gradual abnormal data type is different from the traditional jump abnormal data through analysis of the coastal buoy data in Zhejiang for many years. With a single parameter analysis method, it is difficult to work out accurately the new gradual abnormal data type of stable and gradual deviation from the normal data. Therefore, multiple parameters correlation coefficient method is proposed based on the relationships between pH, dissolved oxygen and chlorophyll a on the condition of that the correlation between two parameters is stable or even consistent at a certain time series. There are two simple statistical parameters of the cross-correlation coefficient of 8-day time window (R8 d) and the difference of R8 d (ΔR) in this method. Those could be used to automatically detect the gradual abnormal buoy data and do very well. The multiple parameters correlation coefficient method provides a new idea for the gradual abnormal data identification, and also improves the automatic monitoring capability of marine ecological buoy abnormal data.
The identification of abnormal marine ecological buoy data is the key to ensure the quality of buoy data. In this study, we found that the gradual abnormal data type is different from the traditional jump abnormal data through analysis of the coastal buoy data in Zhejiang for many years. With a single parameter analysis method, it is difficult to work out accurately the new gradual abnormal data type of stable and gradual deviation from the normal data. Therefore, multiple parameters correlation coefficient method is proposed based on the relationships between pH, dissolved oxygen and chlorophyll a on the condition of that the correlation between two parameters is stable or even consistent at a certain time series. There are two simple statistical parameters of the cross-correlation coefficient of 8-day time window (R8 d) and the difference of R8 d (ΔR) in this method. Those could be used to automatically detect the gradual abnormal buoy data and do very well. The multiple parameters correlation coefficient method provides a new idea for the gradual abnormal data identification, and also improves the automatic monitoring capability of marine ecological buoy abnormal data.


Evolution analysis of land use pattern in the Changjiang River Delta coastal zone in recent 39 years
2020, 42(11): 142-154.
doi: 10.3969/j.issn.0253-4193.2020.11.014
Abstract:
The Changjiang River Delta coastal zone is a typical region where global change and human activities interact violently. Under the background of deepening coastal development and policy boosting, land use changes in this region has intensified, and it has become a conflict hotspot between economic development and ecological protection. The evolution analysis of land use pattern is of great significance to promote the coastal development zone of the Changjiang River Delta. The article is based on 5 issues of land use vector data during 1980 to 2018, by using Sankey diagram, annual change rate, dynamic degree and nuclear density analysis method to reveals the evolution characteristics of land use in the Changjiang River Delta coastal zone in the past 39 years in terms of quantitative structure, spatial agglomeration of key land types, and the rule of sea-land gradient variation. The results are as follows: (1) The basement landscape of the Changjiang River Delta coastal zone in 2018 is composed by cultivated land, forest land and construction land, which occupies 89.86% of the total study area. In spatial pattern, it presents cultivated land in the north and woodland in the south and construction land is scattered and embedded in it. (2) In the past 39 years, the land use system in the study area has varied in quantitative structure and spatial pattern. Among them, in the overall presentation of quantity structure, the cultivated land continued to decline steadily, construction land continues to increase rapidly, forest land fluctuates slightly, and grasslands and waters fluctuate slightly, and the total area which experienced reclamation development reached to 2161.01 square kilometer; In spatial pattern, it mainly shows that construction land patches blooming everywhere and accompanied by local explosive expansion, farmland patches shrink gradually and tend to fragment, and form a distinct wetland landscape in reclamation areas in Jiangsu and eastern Shanghai and Hangzhou Bay. (3) The article focus on the spatial agglomeration analysis on construction land and wetland. Among them, the expansion scale of construction land is small and scattered, and the expansion concentration degree continues to increase, which forms a spatial clustering pattern from "single center" to "multiple center"; The tidal flat resources are characterized by a small number, small patches and scattered distribution, and generally show a decreasing trend. The expand and reduce hotspots in different periods behaves differently in different regions. (4) Within a distance of 20 kilometers from the coastline, the land use dynamics in the study area showed obvious changes of construction land goes to sea and ocean land goes to land, in addition, the dynamics of sea-land gradients of different types in the coastal areas of Jiangsu, Shanghai and Zhejiang are different.
The Changjiang River Delta coastal zone is a typical region where global change and human activities interact violently. Under the background of deepening coastal development and policy boosting, land use changes in this region has intensified, and it has become a conflict hotspot between economic development and ecological protection. The evolution analysis of land use pattern is of great significance to promote the coastal development zone of the Changjiang River Delta. The article is based on 5 issues of land use vector data during 1980 to 2018, by using Sankey diagram, annual change rate, dynamic degree and nuclear density analysis method to reveals the evolution characteristics of land use in the Changjiang River Delta coastal zone in the past 39 years in terms of quantitative structure, spatial agglomeration of key land types, and the rule of sea-land gradient variation. The results are as follows: (1) The basement landscape of the Changjiang River Delta coastal zone in 2018 is composed by cultivated land, forest land and construction land, which occupies 89.86% of the total study area. In spatial pattern, it presents cultivated land in the north and woodland in the south and construction land is scattered and embedded in it. (2) In the past 39 years, the land use system in the study area has varied in quantitative structure and spatial pattern. Among them, in the overall presentation of quantity structure, the cultivated land continued to decline steadily, construction land continues to increase rapidly, forest land fluctuates slightly, and grasslands and waters fluctuate slightly, and the total area which experienced reclamation development reached to 2161.01 square kilometer; In spatial pattern, it mainly shows that construction land patches blooming everywhere and accompanied by local explosive expansion, farmland patches shrink gradually and tend to fragment, and form a distinct wetland landscape in reclamation areas in Jiangsu and eastern Shanghai and Hangzhou Bay. (3) The article focus on the spatial agglomeration analysis on construction land and wetland. Among them, the expansion scale of construction land is small and scattered, and the expansion concentration degree continues to increase, which forms a spatial clustering pattern from "single center" to "multiple center"; The tidal flat resources are characterized by a small number, small patches and scattered distribution, and generally show a decreasing trend. The expand and reduce hotspots in different periods behaves differently in different regions. (4) Within a distance of 20 kilometers from the coastline, the land use dynamics in the study area showed obvious changes of construction land goes to sea and ocean land goes to land, in addition, the dynamics of sea-land gradients of different types in the coastal areas of Jiangsu, Shanghai and Zhejiang are different.


 Email alert
 RSS
RSS