

Variations in temperature and salinity along the MOSAiC drift trajectory and their influencing factors
-
摘要: 随着北极环境快速变化,北冰洋水团的分布特征也在发生改变,潜在地影响了海洋内部的物理和生物地球化学过程。本文使用最新的持续近一年的MOSAiC海洋观测数据和高分辨率GLORYS12V1再分析数据分析了MOSAiC跨欧亚海盆漂流路径上水团温度和盐度的变化特征,并探究了大西洋水入流对路径水团温盐变化的影响。结果表明:(1)沿漂流路径海洋上100 m层的温盐自阿蒙森海盆至南森海盆呈现先升高后降低的变化特征,其中盐度在0–20 m层的空间差异最大,在南森海盆出现盐度大于34的高盐水;温度在100 m层空间差异最大,0℃等温线深度在南森海盆部分海区达到100 m以浅;虽然GLORYS12V1在南森海盆对上层温度模拟偏高,但其整体上抓住了漂流路径上温盐水平和垂向的主要变化特征,模拟水平较好。(2)高温高盐的大西洋水在欧亚海盆总体呈现为逆时针的流环,且输运过程中其深度逐渐加深,决定了中上层海洋温盐水平和垂向分布的整体差异;南森海盆表层20 m的高盐特征是由于漂流路径进入斯瓦尔巴群岛北部冬季深对流的势力范围,而大风事件对漂流路径上层温盐分布差异的作用有限。(3)在南森海盆西部100 m层,GLORYS12V1模拟的大西洋水水平扩展范围偏北,造成了该处模拟温度偏高的现象,分析认为改进边界大西洋入流通量的设置或可提升再分析数据精度。Abstract: Rapid changes in the Arctic environment significantly impact the characteristics of water masses in the Arctic Ocean, potentially affecting the ocean’s physical and biogeochemical processes. This study utilizes the latest MOSAiC observation data (from October 2019 to August 2020) and high-resolution reanalysis data (GLORYS12V1) to analyze the variations in temperature and salinity of water masses across the Eurasian Basin along the MOSAiC drift trajectory, and to explore the influence of the Atlantic inflow on these variations. The results show that: (1) Both temperature and salinity within the upper 100 m layer along the drift trajectory exhibit an overall pattern of initially increasing and then decreasing from the Amundsen Basin to the Nansen Basin. The spatial variation in salinity is greatest within the 0-20 m layer, with highly saline surface water (S >34) present in Nansen Basin. In contrast, the variation in temperature is greatest at the 100 m layer, with the depth of 0℃ isothermal less than 100 m in parts of the Nansen Basin. Although GLORYS12V1 simulates the higher temperature in the upper Nansen Basin, it reasonably captures the main features of horizontal and vertical variations in temperature and salinity along the drift trajectory. (2) The warm and saline Atlantic water generally flows anticlockwise in the Eurasian Basin, with its depth gradually deepening during transport, which predominantly determines the overall variations in temperature and salinity in intermedia and upper layers in the Eurasian Basin. The high salinity of surface water in the Nansen Basin is due to the drift trajectory involved into the regions influenced by deep winter convection in northern Svalbard. Strong wind events play a limited role in the distributional differences of temperature and salinity along the drift trajectory. (3) In the western Nansen Basin, GLORYS12V1 indicates a northward extension of Atlantic Water beyond what is observed, with its northern boundary nearing the Gakkel Ridge. This discrepancy results in an overestimation of temperature compared to in-situ observations. To improve the accuracy of the GLORYS12V1 simulated results, refining the setting of Atlantic inflow flux at the open boundary is suggested.
-
Key words:
- water mass /
- MOSAiC /
- model /
- Atlantic Water /
- the Arctic Ocean
-
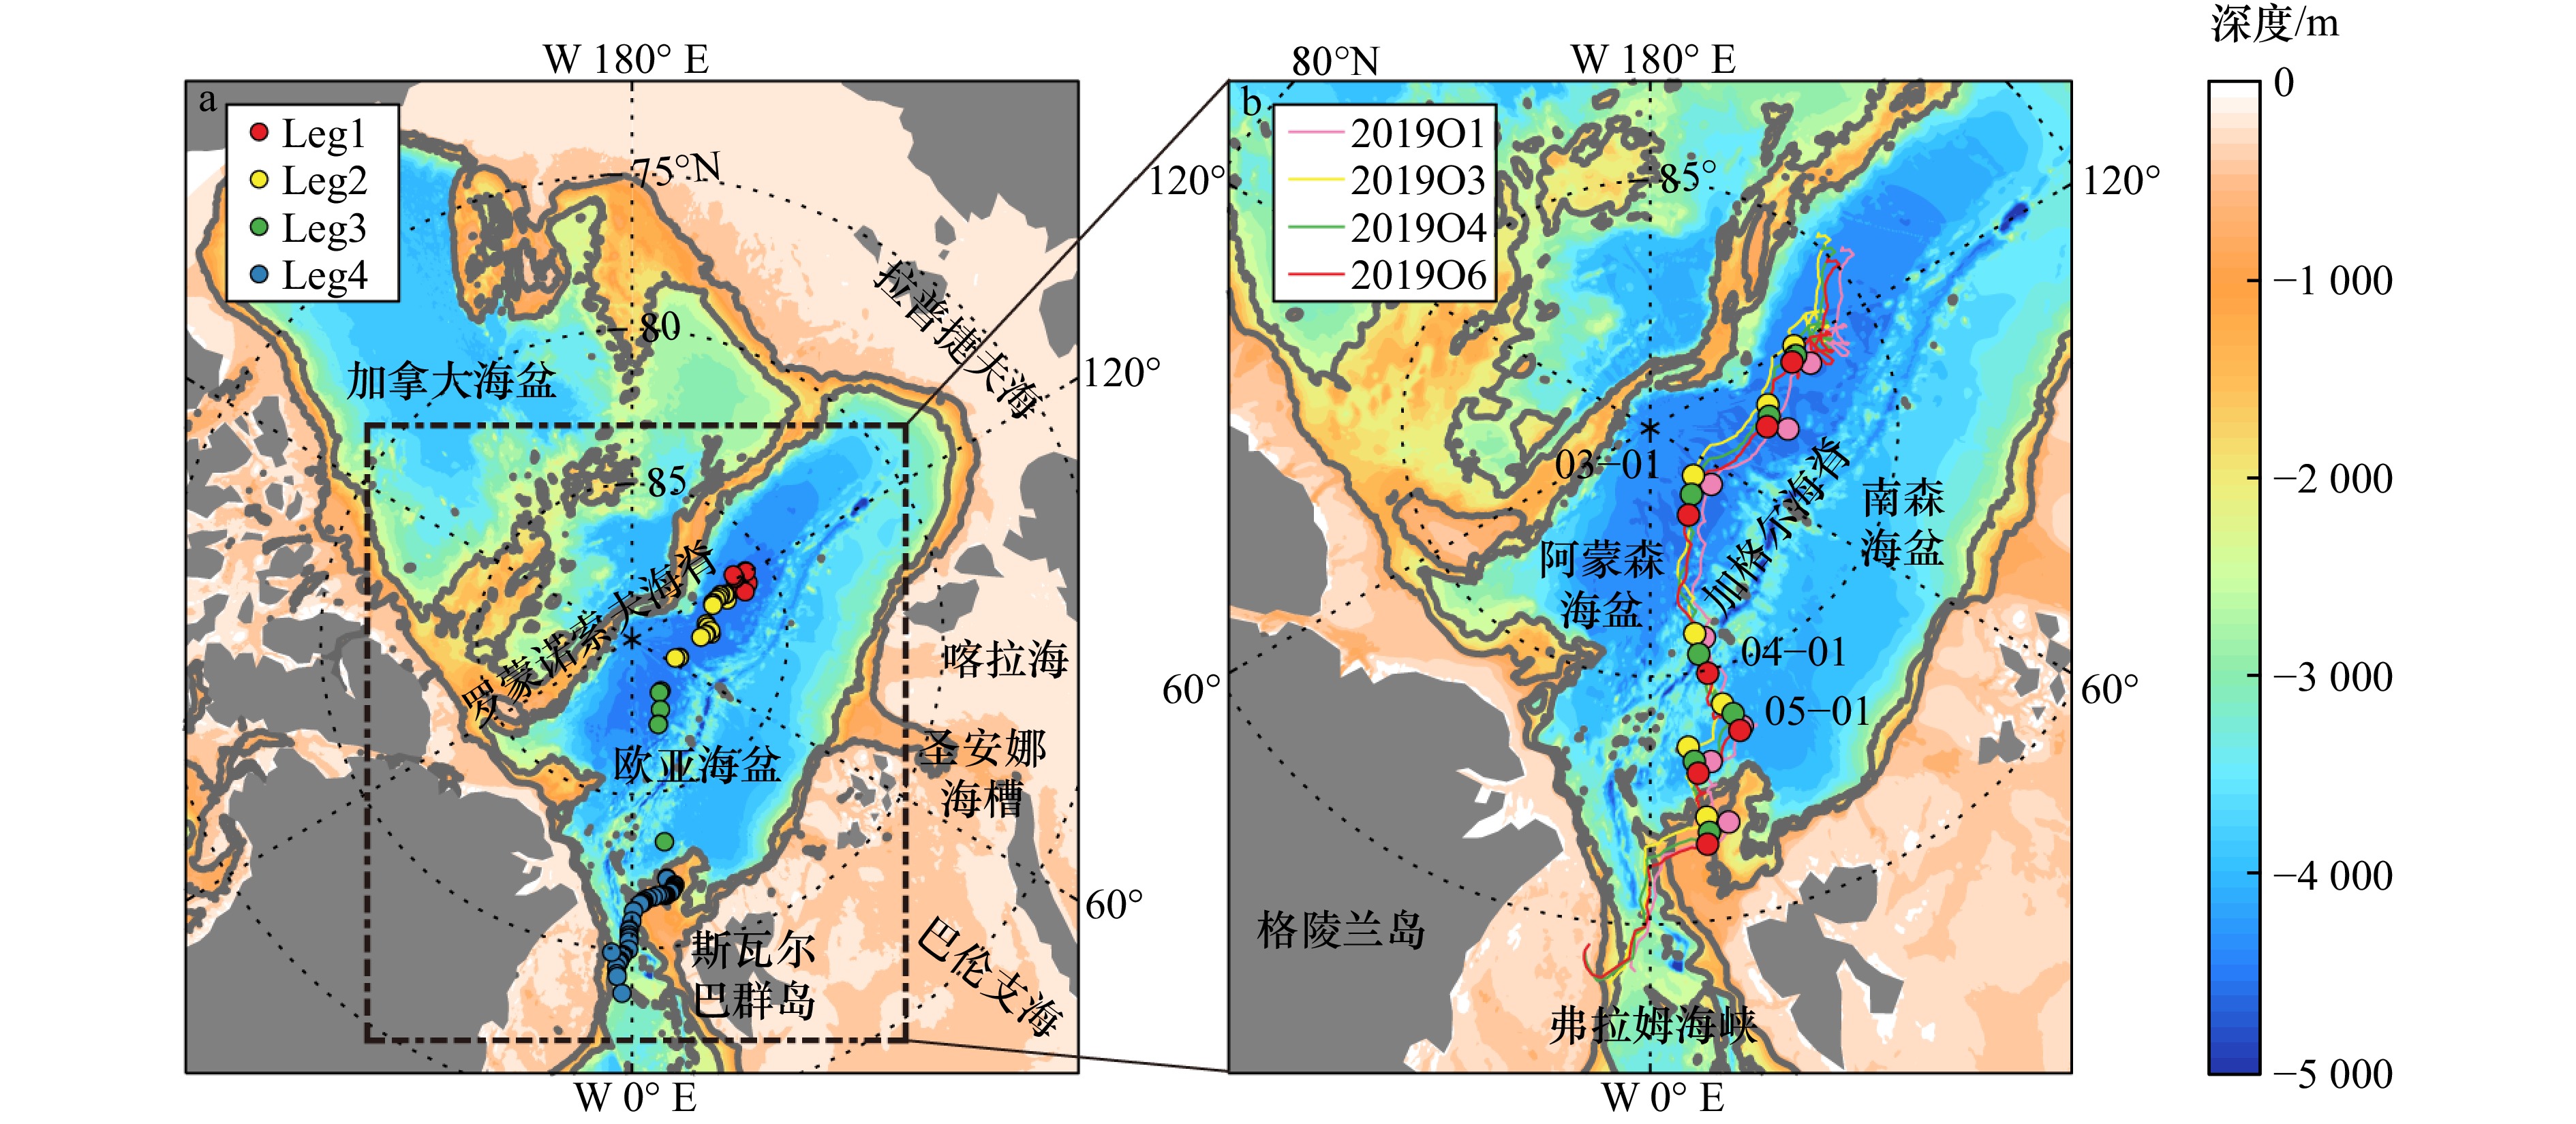
图 1 北冰洋地形图(a)和MOSAiC浮标漂流路径(b)
(a)中彩色圆点为MOSAiC Leg1–4全水深CTD观测站位。(b)中彩色圆点为2020年1至7月初始漂流位置,其中3至5月已标出。灰色实线表示500 m、2 000 m等深线。
Fig. 1 Bathymetry of the Arctic Ocean (a) and the drift trajectory of MOSAiC buoys (b)
Solid colored circles in (a) denote the locations of the full-depth casts with the Polarstern-hydrohole-CTD during the MOSAiC Leg1–4. Solid colored circles in (b) indicate buoys locations on the first day from January to July 2020, with March 1st to May 1st marked. Solid gray lines are 500 m and 2 000 m isobath.
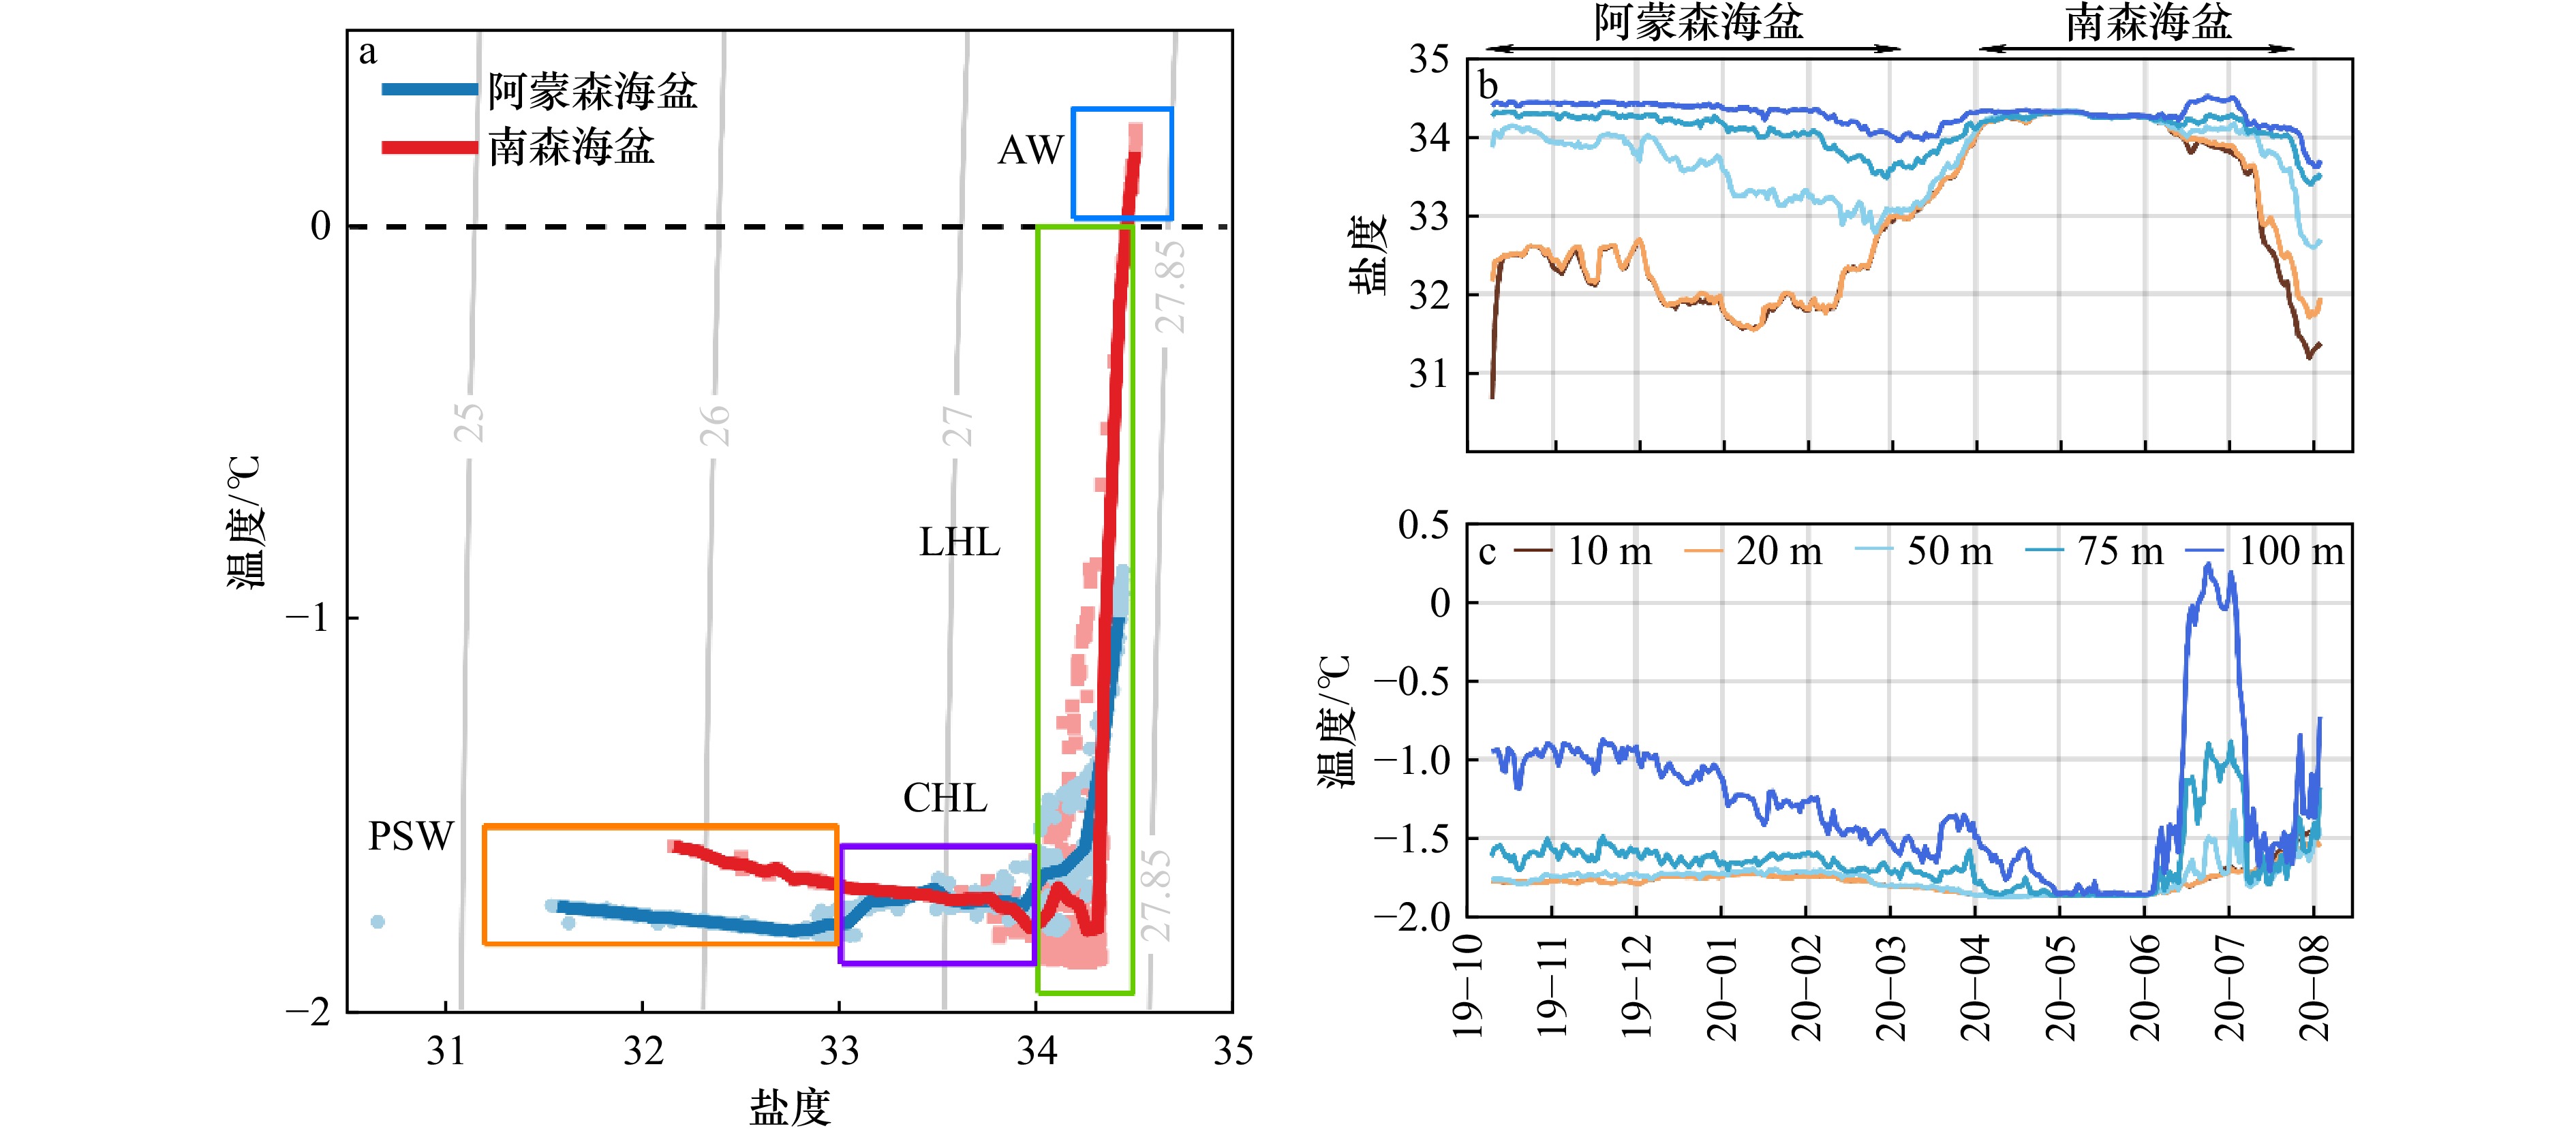
图 2 MOSAiC漂流路径上100 m层的温盐点聚图(a)和浮标在10 m、20 m、50 m、75 m和100 m层观测的盐度(b)和温度(c)变化
(a)中散点为观测数据,实线为拟合后曲线,彩色框将不同水团区分
Fig. 2 Temperature-salinity diagram within the upper 100 m layer along the MOSAiC drift trajectory (a) and time series of the observed salinity (b) and temperature (c) at the water depth of 10 m, 20 m, 50 m, 75 m, and 100 m
Scatters in (a) denote the observations with their fitting curves. Colored enclosing-squares divide observations into four distinct water masses
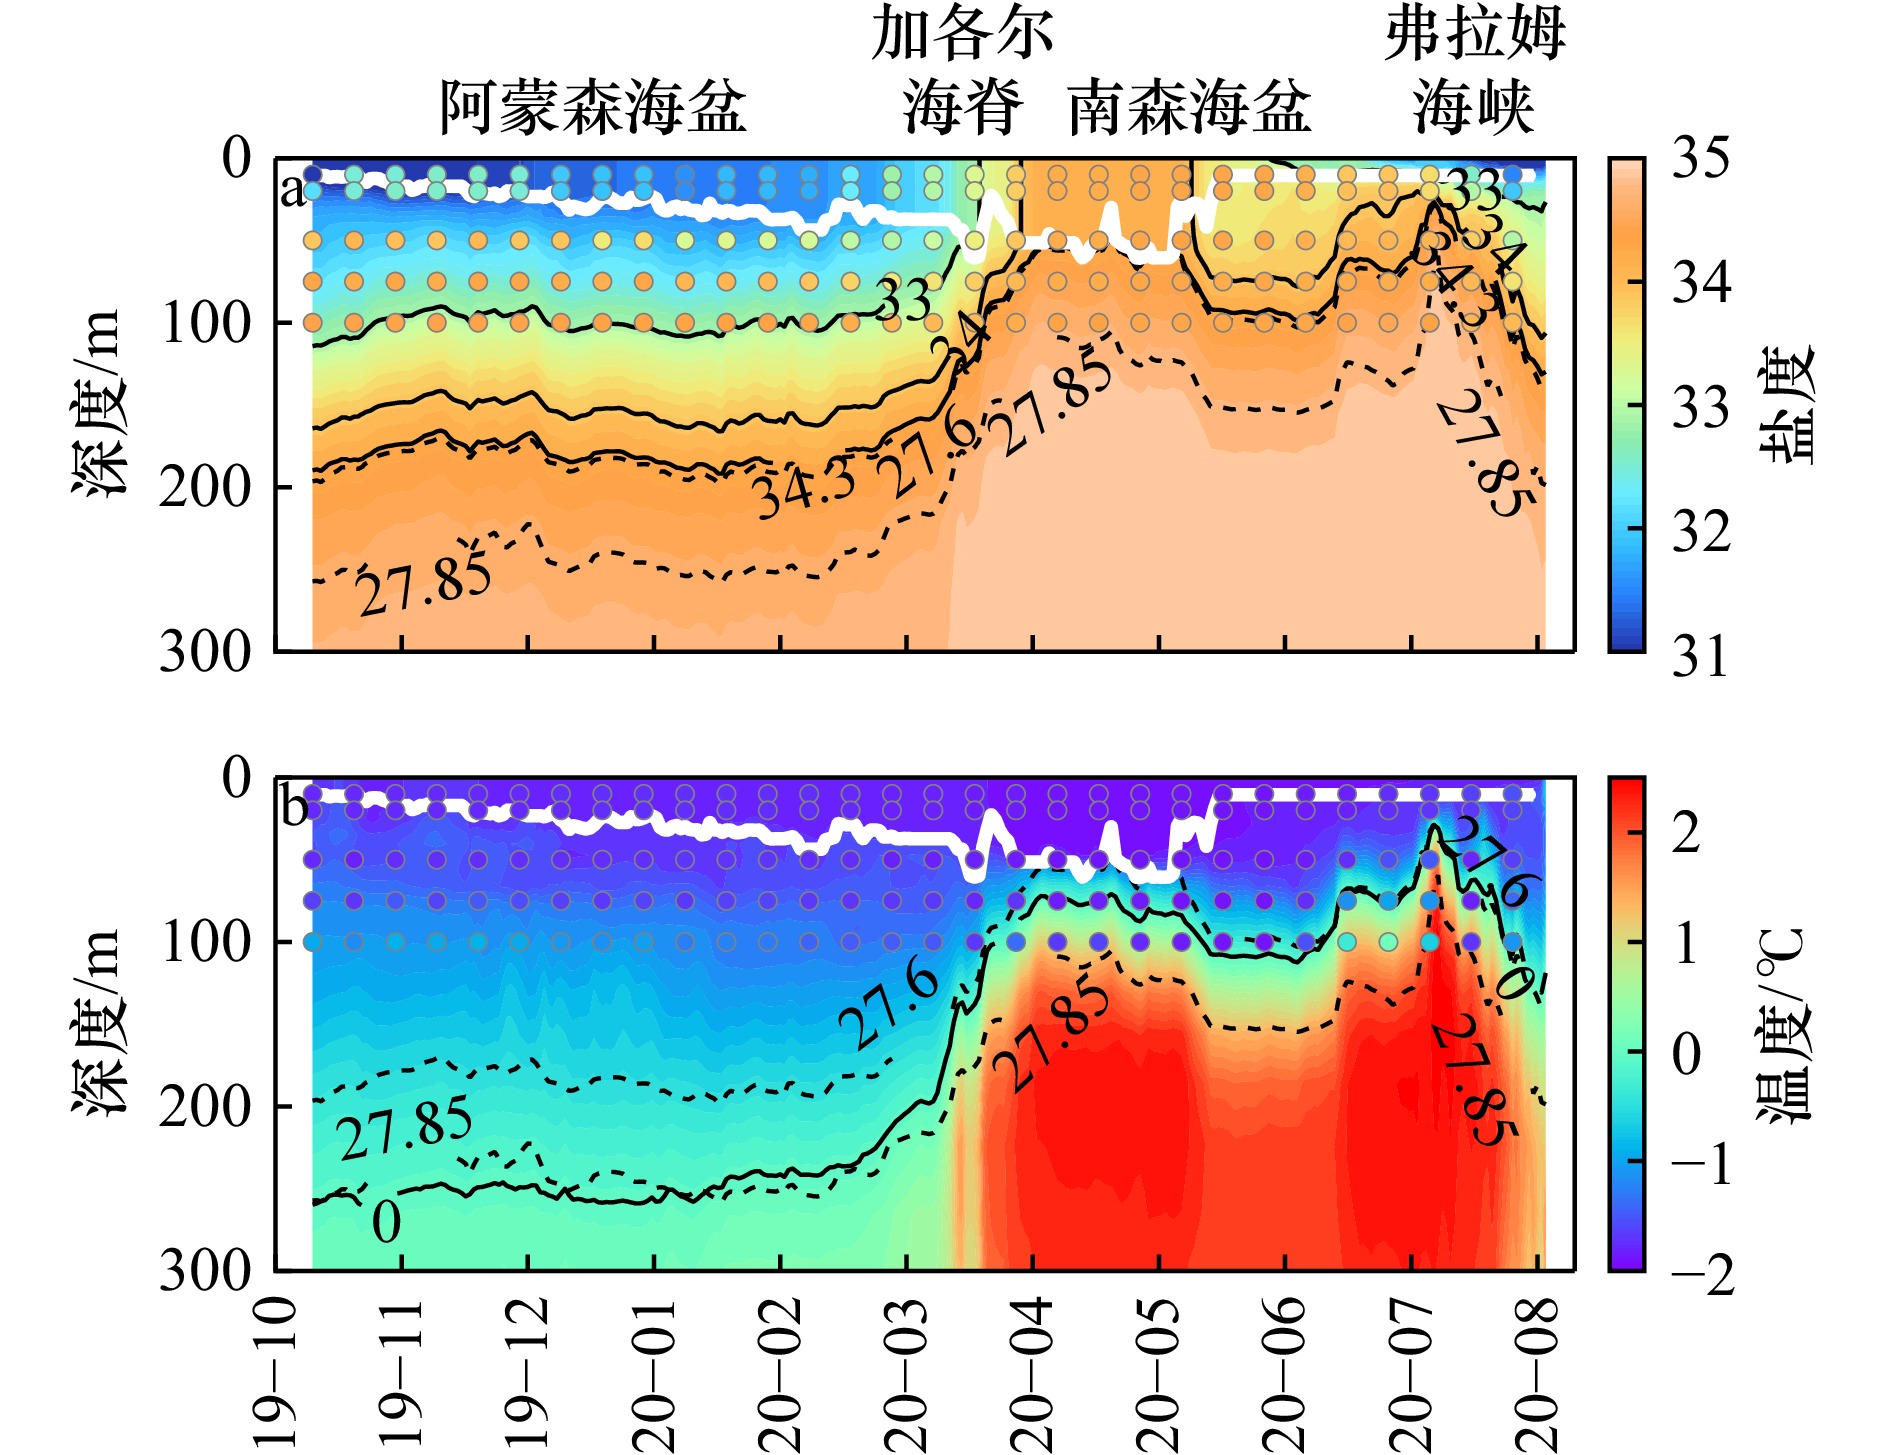
图 3 MOSAiC漂流路径上GLORYS12V1再分析盐度(a)和温度(b)的垂向分布
底色代表GLORYS12V1再分析结果,散点为浮标观测结果,每两个观测点间间隔五天。白色实线指混合层深度。(a)中黑色实线指33、34、34.3等盐线,(b)中为0℃等温线。黑色虚线为27.6和27.85 kg/m3等密线。
Fig. 3 Vertical distributions of the salinity (a) and temperature (b) from GLORYS12V1 reanalysis along MOSAiC drift trajectory
Color shading denotes the salinity and temperature from GLORYS12V1 reanalysis, while scatters denote observations depicting at an interval of 5 days. Solid white lines indicate the mixed layer depth. Solid black lines are the 33, 34, 34.3 isohaline in (a) and the 0℃ isotherm in (b). Dashed black lines are density isolines of 27.6 and 27.85 kg/m3
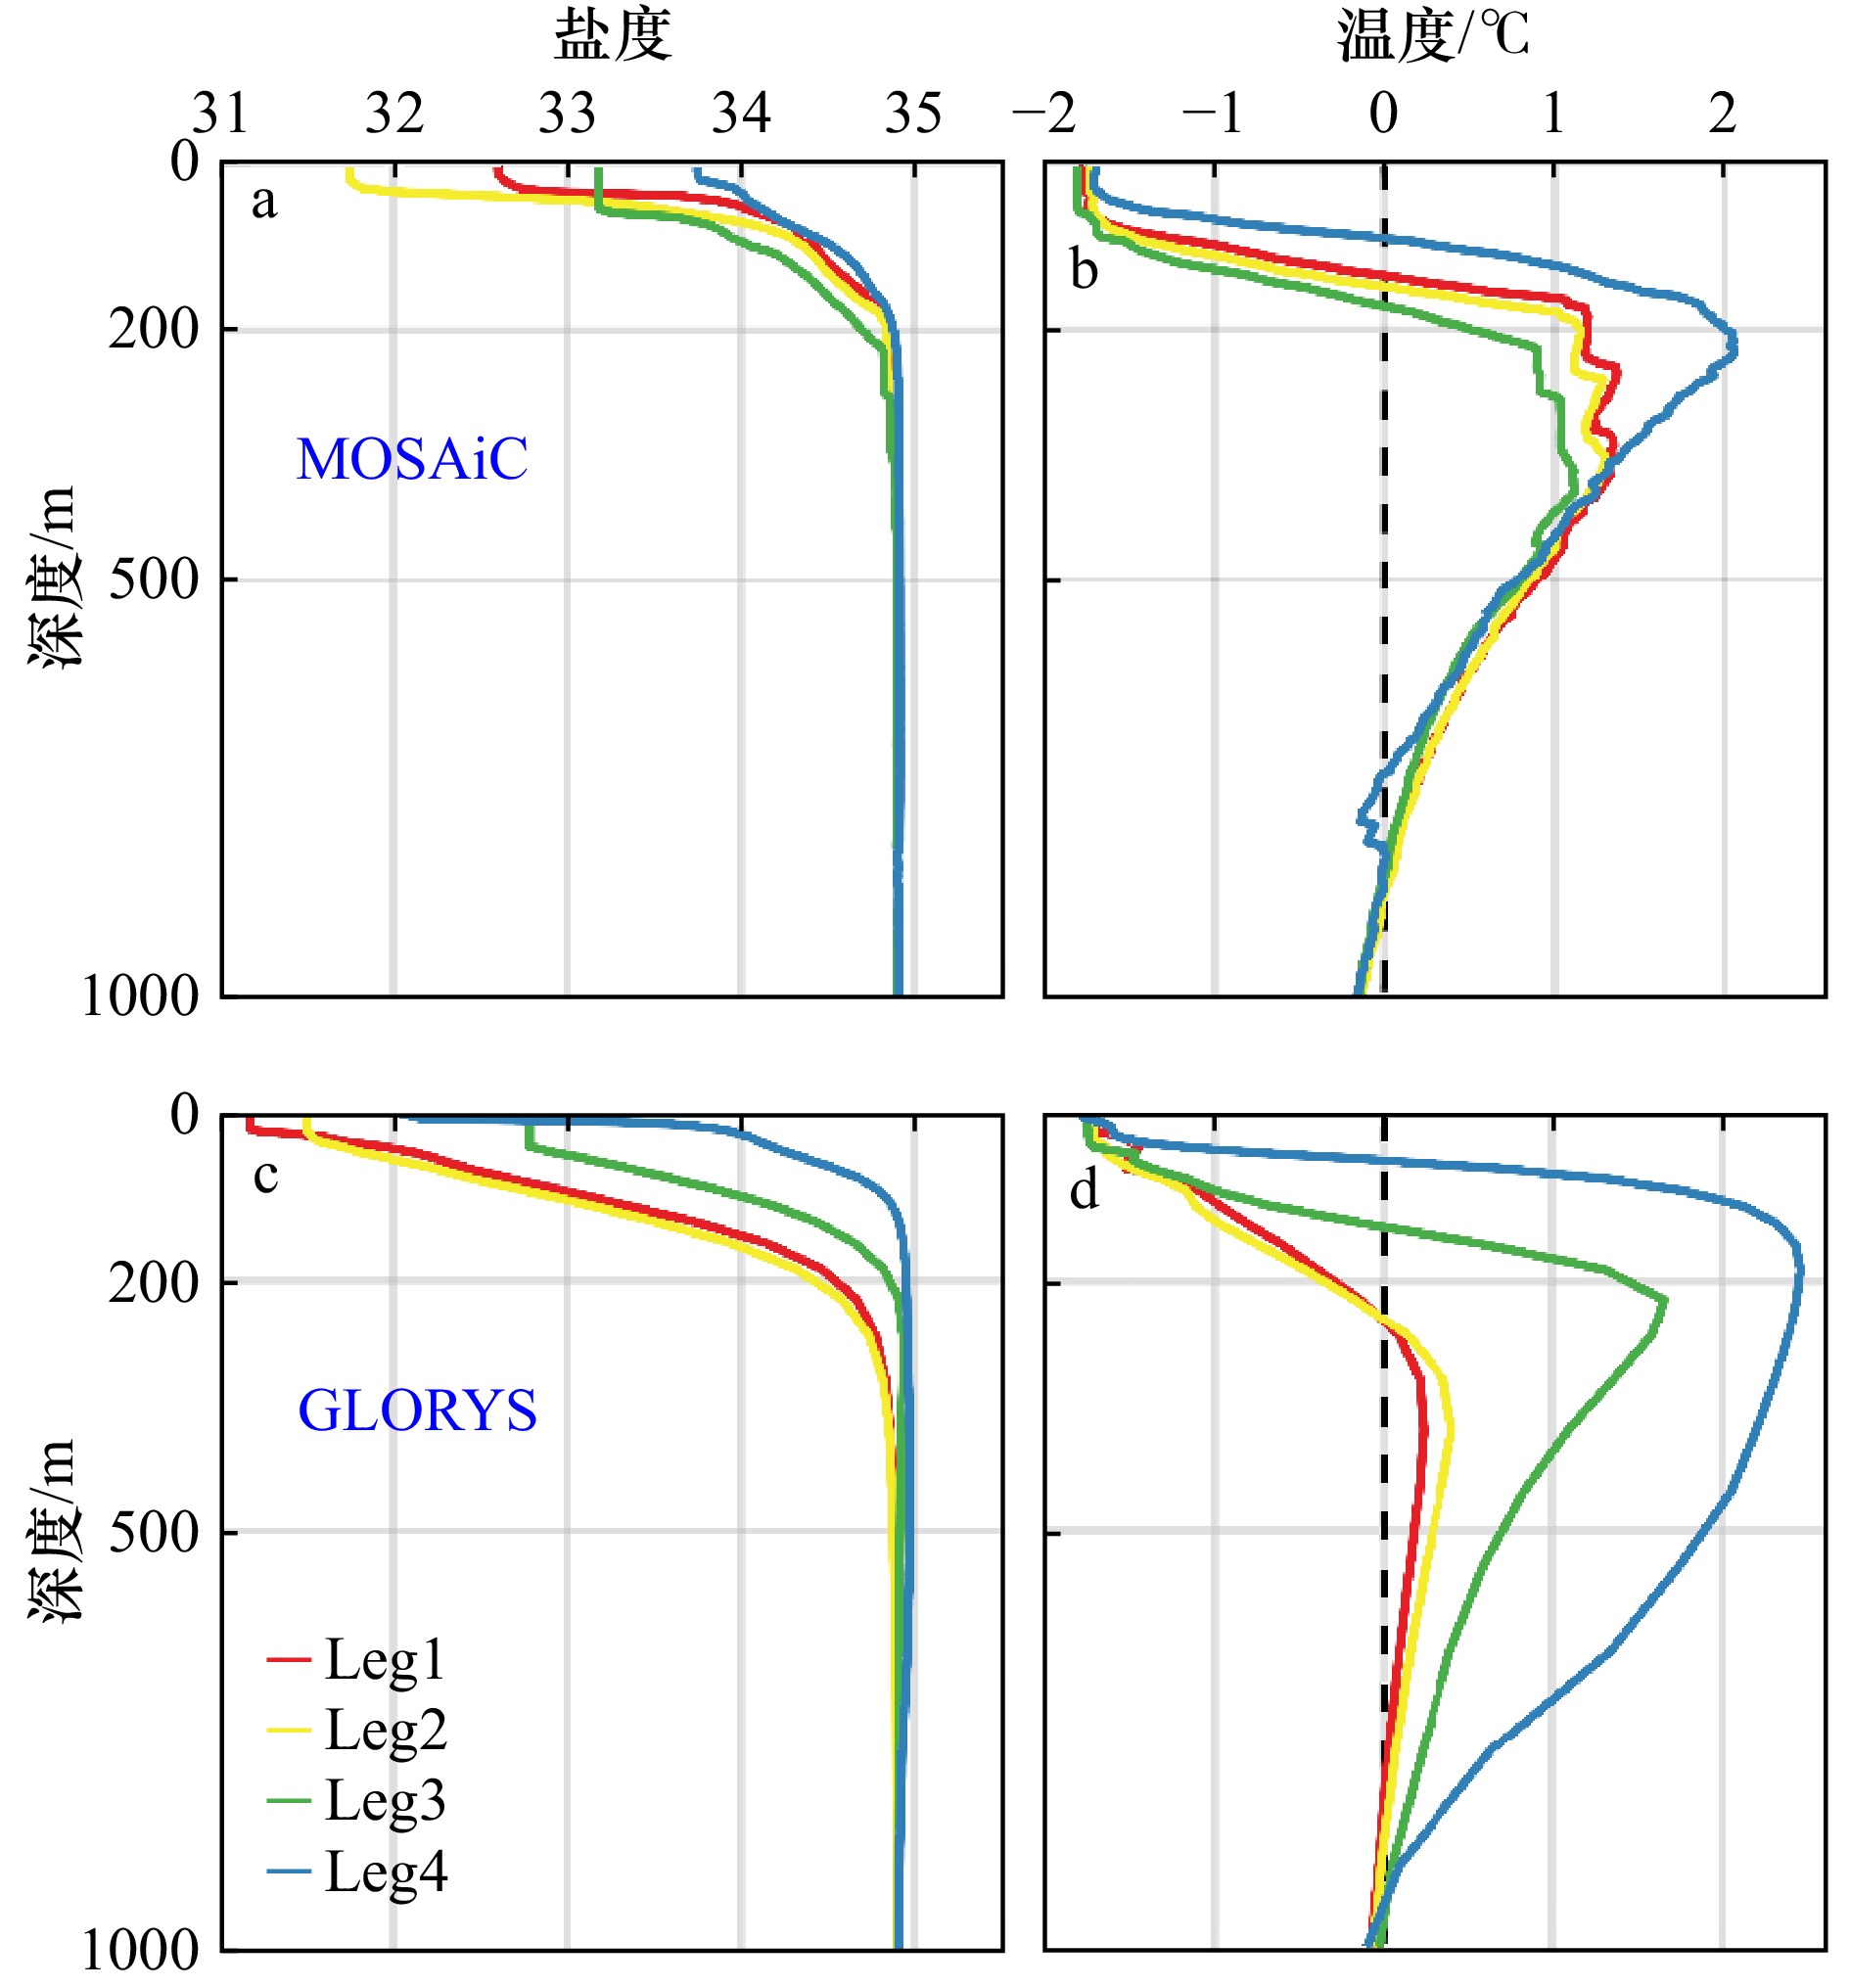
图 4 MOSAiC和GLORYS12V1在Leg1–4上1 000 m层盐度(a、c)和温度(b、d)垂向分布,结果为每个航段数据的中值
Fig. 4 Profiles of salinity (a, c) and temperature (b, d) based on median values from MOSAiC and GLORYS12V1 reanalysis during Leg1–4
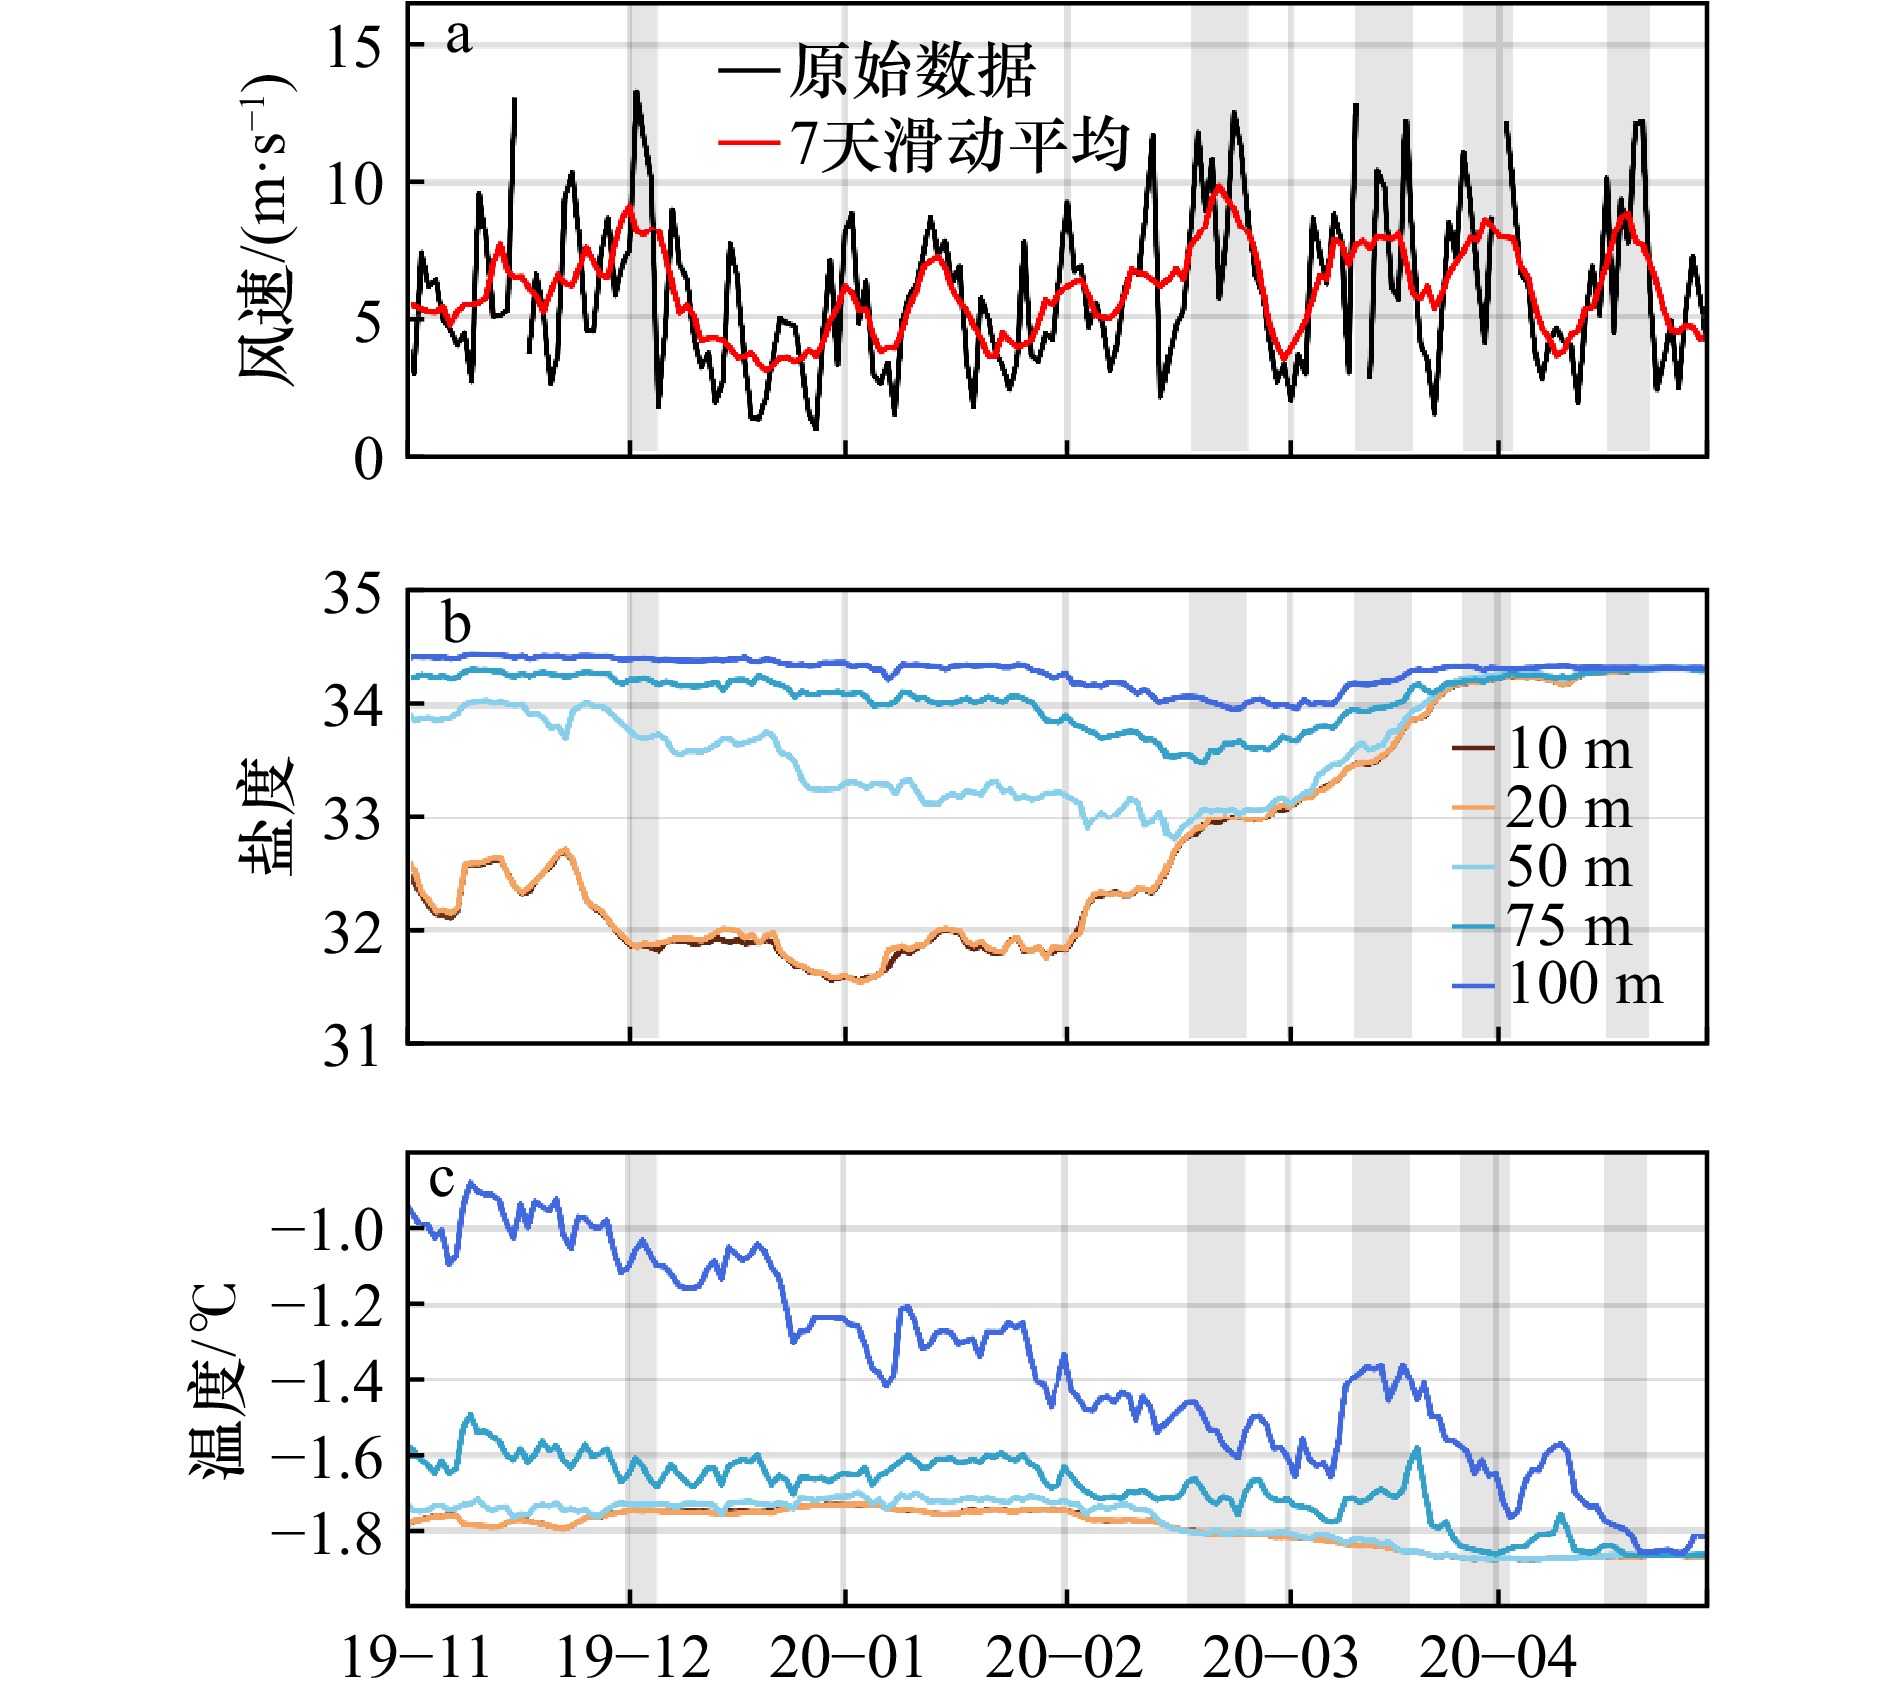
图 5 MOSAiC在2019年11月‒2020年4月观测的海表10 m风速(a)、上100 m层盐度(b)和温度(c)
图中阴影部分为主要大风事件发生的时间段,(a)中红色实线为7天滑动平均值
Fig. 5 Observed near-surface 10 m wind speed (a), and salinity (b) and temperature (c) within the upper 100 m layer from November 2019 to April 2020 during MOSAiC
Grey shadings indicate strong wind event. Solid red line in (a) is 7-day running average of wind speed
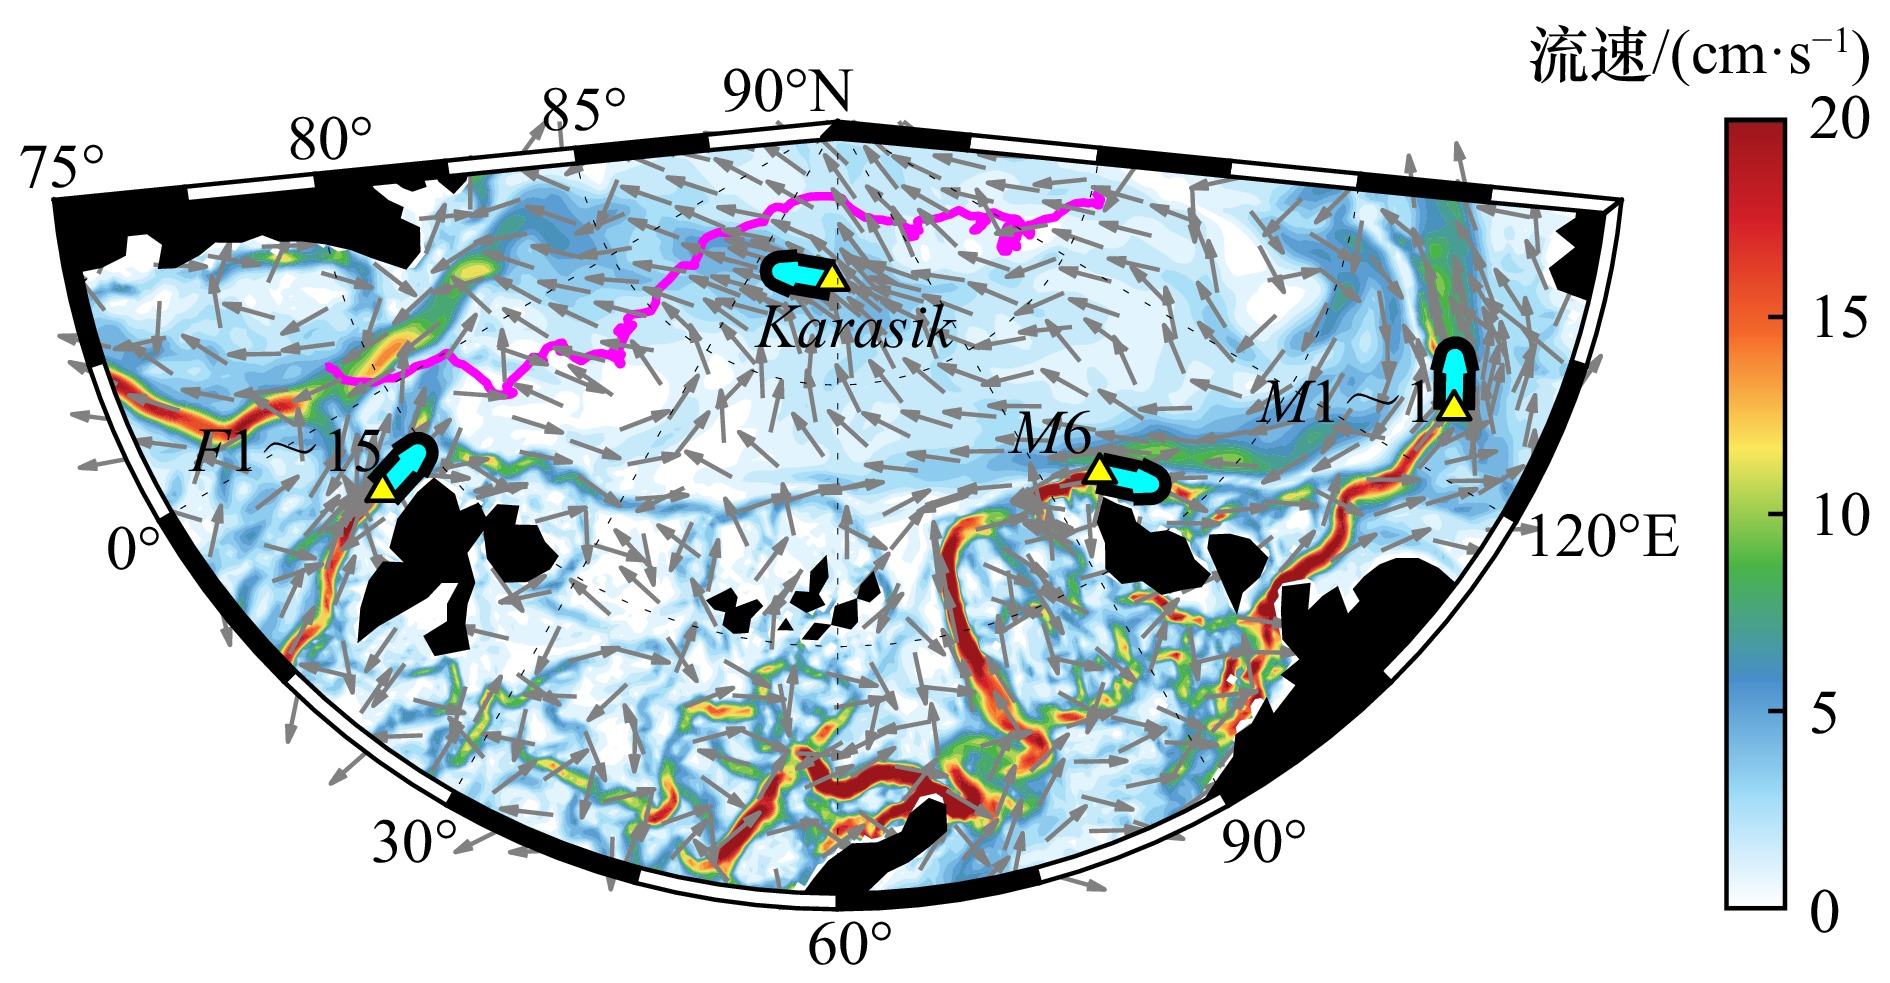
图 6 GLORYS12V1再分析海流与浮标观测海流流向示意图
背景色为GLORYS12V1在2014年9月‒2016年8月0‒300 m层的平均流速,灰色箭头为再分析海流流向。黄色三角形代表锚系浮标的位置,青色箭头为浮标观测期间的平均流向。洋红色实线为MOSAiC漂流路径
Fig. 6 Ocean circulation structure derived from GLORYS12V1 reanalysis and moorings
Color shading indicates the mean current velocity within the 0-300 m layer averaged from September 2014 to August 2016 from GLORYS12V1 reanalysis with gray arrows denoting the current direction. Yellow triangles represent locations of moorings with cyan arrows showing their mean current direction. Magenta line denotes the MOSAiC drift trajectory

图 7 GLORYS12V1北冰洋大西洋扇区50–200 m平均流场(a)和大西洋水上边界深度(b)的再分析结果
(a)中黑色箭头代表流向,粉色箭头为大西洋水入流概念图。(b)中洋红色实线为MOSAiC漂流路径,黄色阴影为冬季深对流区(参考Rudels等[28]),黑色实线为1 000 m、2 000 m和4 100 m等深线
Fig. 7 Ocean current averaged within 50–200 m in the Atlantic Arctic sector (a) and the depth of the upper boundary of Atlantic Water (b) derived from GLORYS12V1 reanalysis
Black arrows in (a) indicate the current direction, and pink arrows indicate the schematic diagram of Atlantic Water pathway. Solid magenta line in (b) denotes the MOSAiC drift trajectory, and yellow shading denotes the northern Svalbard where experiences a deep winter convection (refer from Rudels et al.[28]). Solid black lines are 1 000 m, 2 000 m, 4 000 m isobath.

图 8 MOSAiC 2020年3–5月100 m层的观测温度和GLORYS12V1 3–5月平均的100 m层温度(a)、SSH和100 m以上平均流场(b)。IAOOS 23平台在南森海盆西侧100 m层观测的温度(c)。2017年9月卫星观测SSH(d)。GLORYS12V1 2017年9月100 m层温度(e)、SSH和100 m以上平均流场(f)
(a)中洋红色空心圆代表3至5月1日的漂流位置。(c)中黑色空心圆代表2017年8至10月1日的观测位置。蓝色实线为0℃等温线。灰色实线为1 000 m、2 000 m和4 100 m等深线。
Fig. 8 Observed temperature at the 100 m layer from March to May 2020 during MOSAiC and temperature at 100 m layer (a), SSH and ocean current within the upper 100 m layer (b) averaged over March to May 2020 based on GLORYS12V1 reanalysis. Temperature at 100 m layer observed by IAOOS 23 platform in western Nansen Basin (c). Satellite-based SSH in September 2017 (d). Panels (e) and (f) are respectively same as (a) and (b) but for September 2017
Magenta hollow circles in (a) indicate locations of the first day from March to May. Black hollow circles in (c) denote the observed sampling locations of the first day from August to October 2017. Solid blue lines indicate 0℃ isotherm. Grey lines are 1 000 m, 2 000 m, 4 000 m isobath
表 1 浮标布放和回收信息
Tab. 1 Buoy deployment and recovery metadata.
编号 起始时间 经度(°E) 纬度(°N) 终止时间 经度(°E) 纬度(°N) 持续时间(天) 2019O1 2019.10.05 131.27 84.92 2020.08.05 −1.54 78.59 305 2019O2 2019.10.07 135.76 84.87 2019.11.13 120.14 85.95 40 2019O3 2019.10.07 137.83 85.05 2020.08.03 −4.35 78.63 301 2019O4 2019.10.08 136.28 85.11 2020.08.14 −8.53 80.13 311 2019O5 2019.10.09 139.05 85.05 2020.07.12 −1.69 81.32 278 2019O6 2019.10.10 133.23 85.14 2020.08.13 −7.49 80.25 308 2019O7 2019.10.11 135.84 84.74 2019.10.25 128.36 85.32 15 2019O8 2019.10.11 134.50 84.99 2019.10.25 126.32 85.55 15  下载: 导出CSV
表 2 水团划分标准
Tab. 2 Classification of water masses
水团 上边界 下边界 极地表层水(PSW) 海表 上盐跃层或冷盐跃层上界 冷盐跃层(CHL) S = 33 S = 34 下盐跃层(LHL) S = 34 σ = 27.85 kg/m3 大西洋水(AW) θ = 0 ℃ θ = 0 ℃
下载: 导出CSV
表 3 GLORYS12V1再分析温盐结果的评估
Tab. 3 Evaluation of the GLORYS12V1 reanalysis temperature and salinity
STD Bias RMSE r CF 盐度 1.16 0.63 0.99 0.76 0.88 温度 0.82 0.46 0.86 0.48 1.55
下载: 导出CSV
表 4 GLORYS12V1再分析海流结果的评估
Tab. 4 Evaluation of the GLORYS12V1 reanalysis ocean current
浮标 U/cm·s−1 V/cm·s−1 流速/cm·s−1 流向/° 观测 −2.28 14.98 15.46 296.7 F1-15 GLORYS −3.54 9.74 11.15 308.6 CF 1.22 1.17 1.12 0.64 观测 0.41 −0.47 2.96 167.6 M6 GLORYS 3.38 −1.72 6.00 173.8 CF 1.94 1.22 1.90 1.01 观测 7.77 3.48 10.61 89.9 M1-1 GLORYS 10.61 2.53 11.18 79.8 CF 0.71 0.74 0.72 0.57 观测 −0.44 0.06 2.01 209.8 Karasik GLORYS −2.90 2.09 3.82 305.6 CF 1.35 1.75 1.55 1.01 所有站位
集合CF 0.70 0.59 0.63 0.69 r 0.64 0.59 0.57 0.50
下载: 导出CSV
-
[1] Rantanen M, Karpechko A Y, Lipponen A, et al. The Arctic has warmed nearly four times faster than the globe since 1979[J]. Communications Earth & Environment, 2022, 3(1): 168. [2] Parkinson C L. Arctic sea ice coverage from 43 years of satellite passive-microwave observations[J]. Frontiers in Remote Sensing, 2022, 3: 1021781. doi: 10.3389/frsen.2022.1021781 [3] Korhonen M, Rudels B, Marnela M, et al. Time and space variability of freshwater content, heat content and seasonal ice melt in the Arctic Ocean from 1991 to 2011[J]. Ocean Science, 2013, 9(6): 1015−1055. doi: 10.5194/os-9-1015-2013 [4] Polyakov I V, Pnyushkov A V, Alkire M B, et al. Greater role for Atlantic inflows on sea-ice loss in the Eurasian Basin of the Arctic Ocean[J]. Science, 2017, 356(6335): 285−291. doi: 10.1126/science.aai8204 [5] Li Hui, Fedorov A V. Persistent freshening of the Arctic Ocean and changes in the North Atlantic salinity caused by Arctic sea ice decline[J]. Climate Dynamics, 2021, 57(11/12): 2995−3013. [6] Polyakov I V, Beszczynska A, Carmack E C, et al. One more step toward a warmer Arctic[J]. Geophysical Research Letters, 2005, 32(17): L17605. [7] Polyakov I V, Pnyushkov A V, Timokhov L A. Warming of the intermediate Atlantic water of the Arctic Ocean in the 2000s[J]. Journal of Climate, 2012, 25(23): 8362−8370. doi: 10.1175/JCLI-D-12-00266.1 [8] Muilwijk M, Smedsrud L H, Ilicak M, et al. Atlantic water heat transport variability in the 20th century Arctic Ocean from a global ocean model and observations[J]. Journal of Geophysical Research: Oceans, 2018, 123(11): 8159−8179. doi: 10.1029/2018JC014327 [9] Pnyushkov A V, Alekseev G V, Smirnov A V. On the Interplay between freshwater content and hydrographic conditions in the Arctic Ocean in the 1990s–2010s[J]. Journal of Marine Science and Engineering, 2022, 10(3): 401. doi: 10.3390/jmse10030401 [10] Polyakov I V, Pnyushkov A V, Carmack E C. Stability of the arctic halocline: a new indicator of arctic climate change[J]. Environmental Research Letters, 2018, 13(12): 125008. doi: 10.1088/1748-9326/aaec1e [11] Rabe B, Heuzé C, Regnery J, et al. Overview of the MOSAiC expedition: physical oceanography[J]. Elementa: Science of the Anthropocene, 2022, 10(1): 00062. doi: 10.1525/elementa.2021.00062 [12] Hoppmann M, Kuznetsov I, Fang Y C, et al. Mesoscale observations of temperature and salinity in the Arctic Transpolar Drift: a high-resolution dataset from the MOSAiC Distributed Network[J]. Earth System Science Data, 2022, 14(11): 4901−4921. doi: 10.5194/essd-14-4901-2022 [13] Mellat M, Brunello C F, Werner M, et al. Isotopic signatures of snow, sea ice, and surface seawater in the central Arctic Ocean during the MOSAiC expedition[J]. Elementa: Science of the Anthropocene, 2024, 12(1): 00078. doi: 10.1525/elementa.2023.00078 [14] Schulz K, Koenig Z, Muilwijk M, et al. The Eurasian Arctic Ocean along the MOSAiC drift in 2019–2020: an interdisciplinary perspective on physical properties and processes[J]. Elementa: Science of the Anthropocene, 2024, 12(1): 00114. doi: 10.1525/elementa.2023.00114 [15] Tippenhauer S, Karam S, Heuzé C, et al. Overview of physical oceanography measurements during POLARSTERN cruise PS122-MOSAiC[R]. PANGAEA, 2021. (查阅网上资料, 未找到本条文献出版地信息, 请确认) [16] Jozef G C, Klingel R, Cassano J J, et al. Derivation and compilation of lower-atmospheric properties relating to temperature, wind, stability, moisture, and surface radiation budget over the central Arctic sea ice during MOSAiC[J]. Earth System Science Data, 2023, 15(11): 4983−4995. doi: 10.5194/essd-15-4983-2023 [17] Athanase M, Sennéchael N, Garric G, et al. New Hydrographic measurements of the Upper Arctic Western Eurasian Basin in 2017 reveal fresher mixed layer and shallower warm layer than 2005–2012 climatology[J]. Journal of Geophysical Research: Oceans, 2019, 124(2): 1091−1114. doi: 10.1029/2018JC014701 [18] Jean-Michel L, Eric G, Romain B B, et al. The copernicus global 1/12° oceanic and sea ice GLORYS12 reanalysis[J]. Frontiers in Earth Science, 2021, 9: 698876. doi: 10.3389/feart.2021.698876 [19] Cabanes C, Grouazel A, von Schuckmann K, et al. The CORA dataset: validation and diagnostics of in-situ ocean temperature and salinity measurements[J]. Ocean Science, 2013, 9(1): 1−18. doi: 10.5194/os-9-1-2013 [20] Radach G, Moll A. Review of three-dimensional ecological modeling related to the North Sea shelf system. Part II: model validation and data needs[M]//Gibson R N, Atkinson R J A, Gordon J D M. Oceanography and Marine Biology: An Annual Review. Boca Raton: CRC Press, 2006. [21] Coachman L K, Barnes C A. Surface water in the Eurasian Basin of the Arctic Ocean[J]. Archives, 1962, 15(4): 245−333. [22] 袁延茂, 李磊, 郝秀敏, 等. 基于PHC3.0数据集的北冰洋水团分析[J]. 海洋测绘, 2011, 31(4): 67−69.YUAN Yanmao, LI Lei, HAO Xiumin, et al. Analysis on the water masses in the Arctic Ocean based on the PHC3.0 data sets[J]. Hydrographic Surveying and Charting, 2011, 31(4): 67−69. [23] Rudels B. Arctic Ocean circulation, processes and water masses: a description of observations and ideas with focus on the period prior to the International Polar Year 2007–2009[J]. Progress in Oceanography, 2015, 132: 22−67. doi: 10.1016/j.pocean.2013.11.006 [24] Timmermans M L, Marshall J. Understanding Arctic Ocean circulation: a review of ocean dynamics in a changing climate[J]. Journal of Geophysical Research: Oceans, 2020, 125(4): e2018JC014378. doi: 10.1029/2018JC014378 [25] Anderson L G, Andersson P S, Björk G, et al. Source and formation of the upper halocline of the Arctic Ocean[J]. Journal of Geophysical Research: Oceans, 2013, 118(1): 410−421. doi: 10.1029/2012JC008291 [26] Alkire M B, Rember R, Polyakov I. Discrepancy in the Identification of the Atlantic/Pacific front in the Central Arctic Ocean: NO versus nutrient relationships[J]. Geophysical Research Letters, 2019, 46(7): 3843−3852. doi: 10.1029/2018GL081837 [27] Steele M, Boyd T. Retreat of the cold halocline layer in the Arctic Ocean[J]. Journal of Geophysical Research: Oceans, 1998, 103(C5): 10419−10435. doi: 10.1029/98JC00580 [28] Rudels B, Jones E P, Schauer U, et al. Arctic sources of the Arctic Ocean surface and halocline waters[J]. Polar Research, 2004, 23(2): 181−208. doi: 10.1111/j.1751-8369.2004.tb00007.x [29] Alkire M B, Polyakov I, Rember R, et al. Combining physical and geochemical methods to investigate lower halocline water formation and modification along the Siberian continental slope[J]. Ocean Science, 2017, 13(6): 983−995. doi: 10.5194/os-13-983-2017 [30] Rudels B, Anderson L G, Jones E P. Formation and evolution of the surface mixed layer and halocline of the Arctic Ocean[J]. Journal of Geophysical Research: Oceans, 1996, 101(C4): 8807−8821. doi: 10.1029/96JC00143 [31] Bertosio C, Provost C, Sennéchael N, et al. The Western Eurasian Basin halocline in 2017: insights from autonomous no measurements and the Mercator physical system[J]. Journal of Geophysical Research: Oceans, 2020, 125(7): e2020JC016204. doi: 10.1029/2020JC016204 [32] Thomas D N, Dieckmann G S. Sea Ice[M]. 2ne ed. Oxford: Blackwell Publishing, 2010. [33] Peralta-Ferriz C, Woodgate R A. Seasonal and interannual variability of pan-Arctic surface mixed layer properties from 1979 to 2012 from hydrographic data, and the dominance of stratification for multiyear mixed layer depth shoaling[J]. Progress in Oceanography, 2015, 134: 19−53. doi: 10.1016/j.pocean.2014.12.005 [34] Smith M, Stammerjohn S, Persson O, et al. Episodic reversal of autumn ice advance caused by release of ocean heat in the Beaufort sea[J]. Journal of Geophysical Research: Oceans, 2018, 123(5): 3164−3185. doi: 10.1002/2018JC013764 [35] Rinke A, Cassano J J, Cassano E N, et al. Meteorological conditions during the MOSAiC expedition[J]. Elementa: Science of the Anthropocene, 2021, 9(1): 00023. doi: 10.1525/elementa.2021.00023 [36] Rudels B, Jones E P, Anderson L G, et al. On the intermediate depth waters of the Arctic Ocean[M]//Johannessen O M, Muench R D, Overland J E. The Polar Oceans and Their Role in Shaping the Global Environment. Washington, D C, USA: the American Geophysical Union, 1994: 33-46. [37] Rudels B, Muench R D, Gunn J, et al. Evolution of the Arctic Ocean boundary current north of the Siberian shelves[J]. Journal of Marine Systems, 2000, 25(1): 77−99. doi: 10.1016/S0924-7963(00)00009-9 [38] Schauer U, Rudels B, Jones E P, et al. Confluence and redistribution of Atlantic water in the Nansen, Amundsen and Makarov basins[J]. Annales Geophysicae, 2002, 20(2): 257−273. doi: 10.5194/angeo-20-257-2002 [39] 吴延俊, 赵进平. 欧亚海盆大西洋水输运过程及热释放研究进展[J]. 地球科学进展, 2020, 35(3): 231−245. doi: 10.11867/j.issn.1001-8166.2020.014Wu Yanjun, Zhao Jinping. Thermosteresis and transportation of Atlantic water along Eurasian Basin of the Arctic Ocean[J]. Advances in Earth Science, 2020, 35(3): 231−245. doi: 10.11867/j.issn.1001-8166.2020.014 [40] Richards A E, Johnson H L, Lique C. Spatial and temporal variability of Atlantic water in the Arctic from 40 years of observations[J]. Journal of Geophysical Research: Oceans, 2022, 127(9): e2021JC018358. doi: 10.1029/2021JC018358 [41] Polyakov I V, Alkire M B, Bluhm B A, et al. Borealization of the Arctic Ocean in response to anomalous advection from sub-Arctic seas[J]. Frontiers in Marine Science, 2020, 7: 491. doi: 10.3389/fmars.2020.00491 -

计量
- 文章访问数: 68
- HTML全文浏览量: 32
- PDF下载量: 26
- 被引次数: 0
