

Application of eSQG method in vertical velocity diagnosis in the South China Sea
-
摘要: 本文利用OFES模式0.1°×0.1°高分辨率温盐、流速和海面高度(SSH)数据,分析eSQG方法在南海垂向流速诊断中的适用性和南海垂向流速的时空变化特征。结果表明,基于SSH和eSQG的诊断垂向流速ωeSQG与OFES模拟“真值”垂向流速ωOFES整体量级基本相当,为O(10−5 m/s),空间上呈现北强南弱。深海盆(水深大于1 000 m)ωeSQG与ωOFES的水平空间分布的相关系数rs在次表层150 m左右达到最大,高于南海全海域的空间相关系数,表明eSQG在远离边界的深水区更有效。季节上,ωeSQG总体夏强冬弱,与ωOFES的相关系数rs冬季大、夏季小,表明eSQG更适用于冬季南海垂向流速的诊断。eSQG诊断垂向流速在台湾西南部和越南以东适用性更高,与ωOFES的时间相关系数rt超过0.6;海盆南部和西北部陆架区诊断效果较差,时间相关系数rt多小于0.2。同一区域ωeSQG和ωOFES空间相关系数存在18~55 d的周期变化。分析显示,海面高度与海面密度同相位分布时,ωeSQG与“真值”ωOFES更接近。时间分辨率对eSQG诊断效果几乎无影响,空间分辨率降低到0.25°时rs整体增大,说明eSQG在中尺度诊断效果更好。Abstract: Using 0.1°×0.1° high-resolution temperature, salinity, velocity and sea surface height (SSH) data from the ocean general circulation model for the earth simulator (OFES) model, this study analyzes the capability and applicability of the eSQG (effective Surface Quasi-Geostrophy) method in vertical velocity diagnosis in the South China Sea (SCS), as well as the spatiotemporal variation of vertical velocities. The diagnosed vertical velocities ωeSQG from SSH with the eSQG method are of the same order of 10−5 m/s as the “true” vertical velocities ωOFES from the OFES model. ωeSQG shows spatial variations with higher values in northern basin. The correlation coefficients of the horizontal distribution of ωeSQG and ωOFES (rs) are greater in deep basin than that in the whole SCS, suggesting that the eSQG method is more efficient in vertical velocity diagnosis in deep water far from boundaries. Vertically, the correlation coefficient has maximum values occurring in the subsurface layer at about 150 m. ωeSQG is stronger in summer and rs show seasonal variation with higher values in winter, indicating more efficient in eSQG diagnosis in winter. ωeSQG is reliable in the regions southwest of Taiwan and east of Vietnam, where the temporal correlation coefficients of ωeSQG and ωOFES (rt) exceed 0.6, while ωeSQG is poorly correlated to ωOFES in the shelf regions in the southern and northwestern SCS with rt mostly under 0.2. rs in the same region is varying at periods of about 18−55 d. ωeSQG performs better as the distributions of the SSH and the sea surface density are in same phase. ωeSQG varies little as the temporal resolution of SSH varies, while rs increases as spatial resolution reduced to 0.25° in mesoscales.
-
Key words:
- vertical velocity /
- eSQG /
- spatio-temporal variation /
- South China Sea /
- OFES
-

图 1 2012年3月29日黑潮延伸体400 m深度ωeSQG(a)和ωOFES(b)的水平分布,ωeSQG和ωOFES的空间相关系数rs的垂向时间序列(c)以及年平均结果(d)
图c中黑色线表示平均混合层深度,图d中红色线表示年平均混合层深度,阴影表示标准差
Fig. 1 Horizontal distribution of vertical velocity ωeSQG (a) and ωOFES (b) at 400 m in the Kuroshio Extension area on 29 March 2012, time series (c) and yearly average (d) of vertical profiles of spatial correlation coefficient rs between ωeSQG and ωOFES in the area
The black line in panel c denotes the area-averaged mixed layer depth,the red line in panel d represents the yearly-mean mixed layer depth, and the cyan shading denotes the standard deviations

图 2 单日(2012年5月16日,a−c)、年平均(d−f)、夏季(g−i)、冬季(j−l)南海100 m深度ωeSQG、ωOFES和二者差值的水平分布
黑色线表示100 m和1 000 m等深线
Fig. 2 Horizontal distribution of ωeSQG, ωOFES and their difference at 100 m in the South China Sea on 16 May 2012 (a−c), in the whole year (d−f), summer (g−i) and winter (j−l)
Black lines denote the 100 m and 1 000 m isobath

图 3 南海全域和深水区ωeSQG和ωOFES的空间相关系数
$r^s_{{\rm{total}}} $ (a−b)和$r^s_{{\rm{deep}}} $ (c−d)的垂向时间序列及其年平均黑色虚线表示平均混合层深度,阴影表示标准差
Fig. 3 Time series and yearly average of vertical profiles of correlation coefficient
$r^s_{{\rm{total}}} $ and$r^s_{{\rm{deep}}} $ between ωeSQG and ωOFES in the whole South China Sea (a−b) and the deep basin (c−d)Black dashed lines denote the area-averaged mixed layer depth, cyan shadings denote the standard deviations

图 4 南海50 m(a)和100 m(b)层各网格点上2012年3月至2013年2月ωeSQG和ωOFES的时间相关系数rt的水平分布
黑色线表示100 m和1 000 m等深线
Fig. 4 Horizontal distribution of temporal correlation rt between ωeSQG and ωOFES at 50 m (a) and 100 m (b) in the South China Sea from March 2012 to February 2013
Black lines denote the 100 m and 1000 m isobath
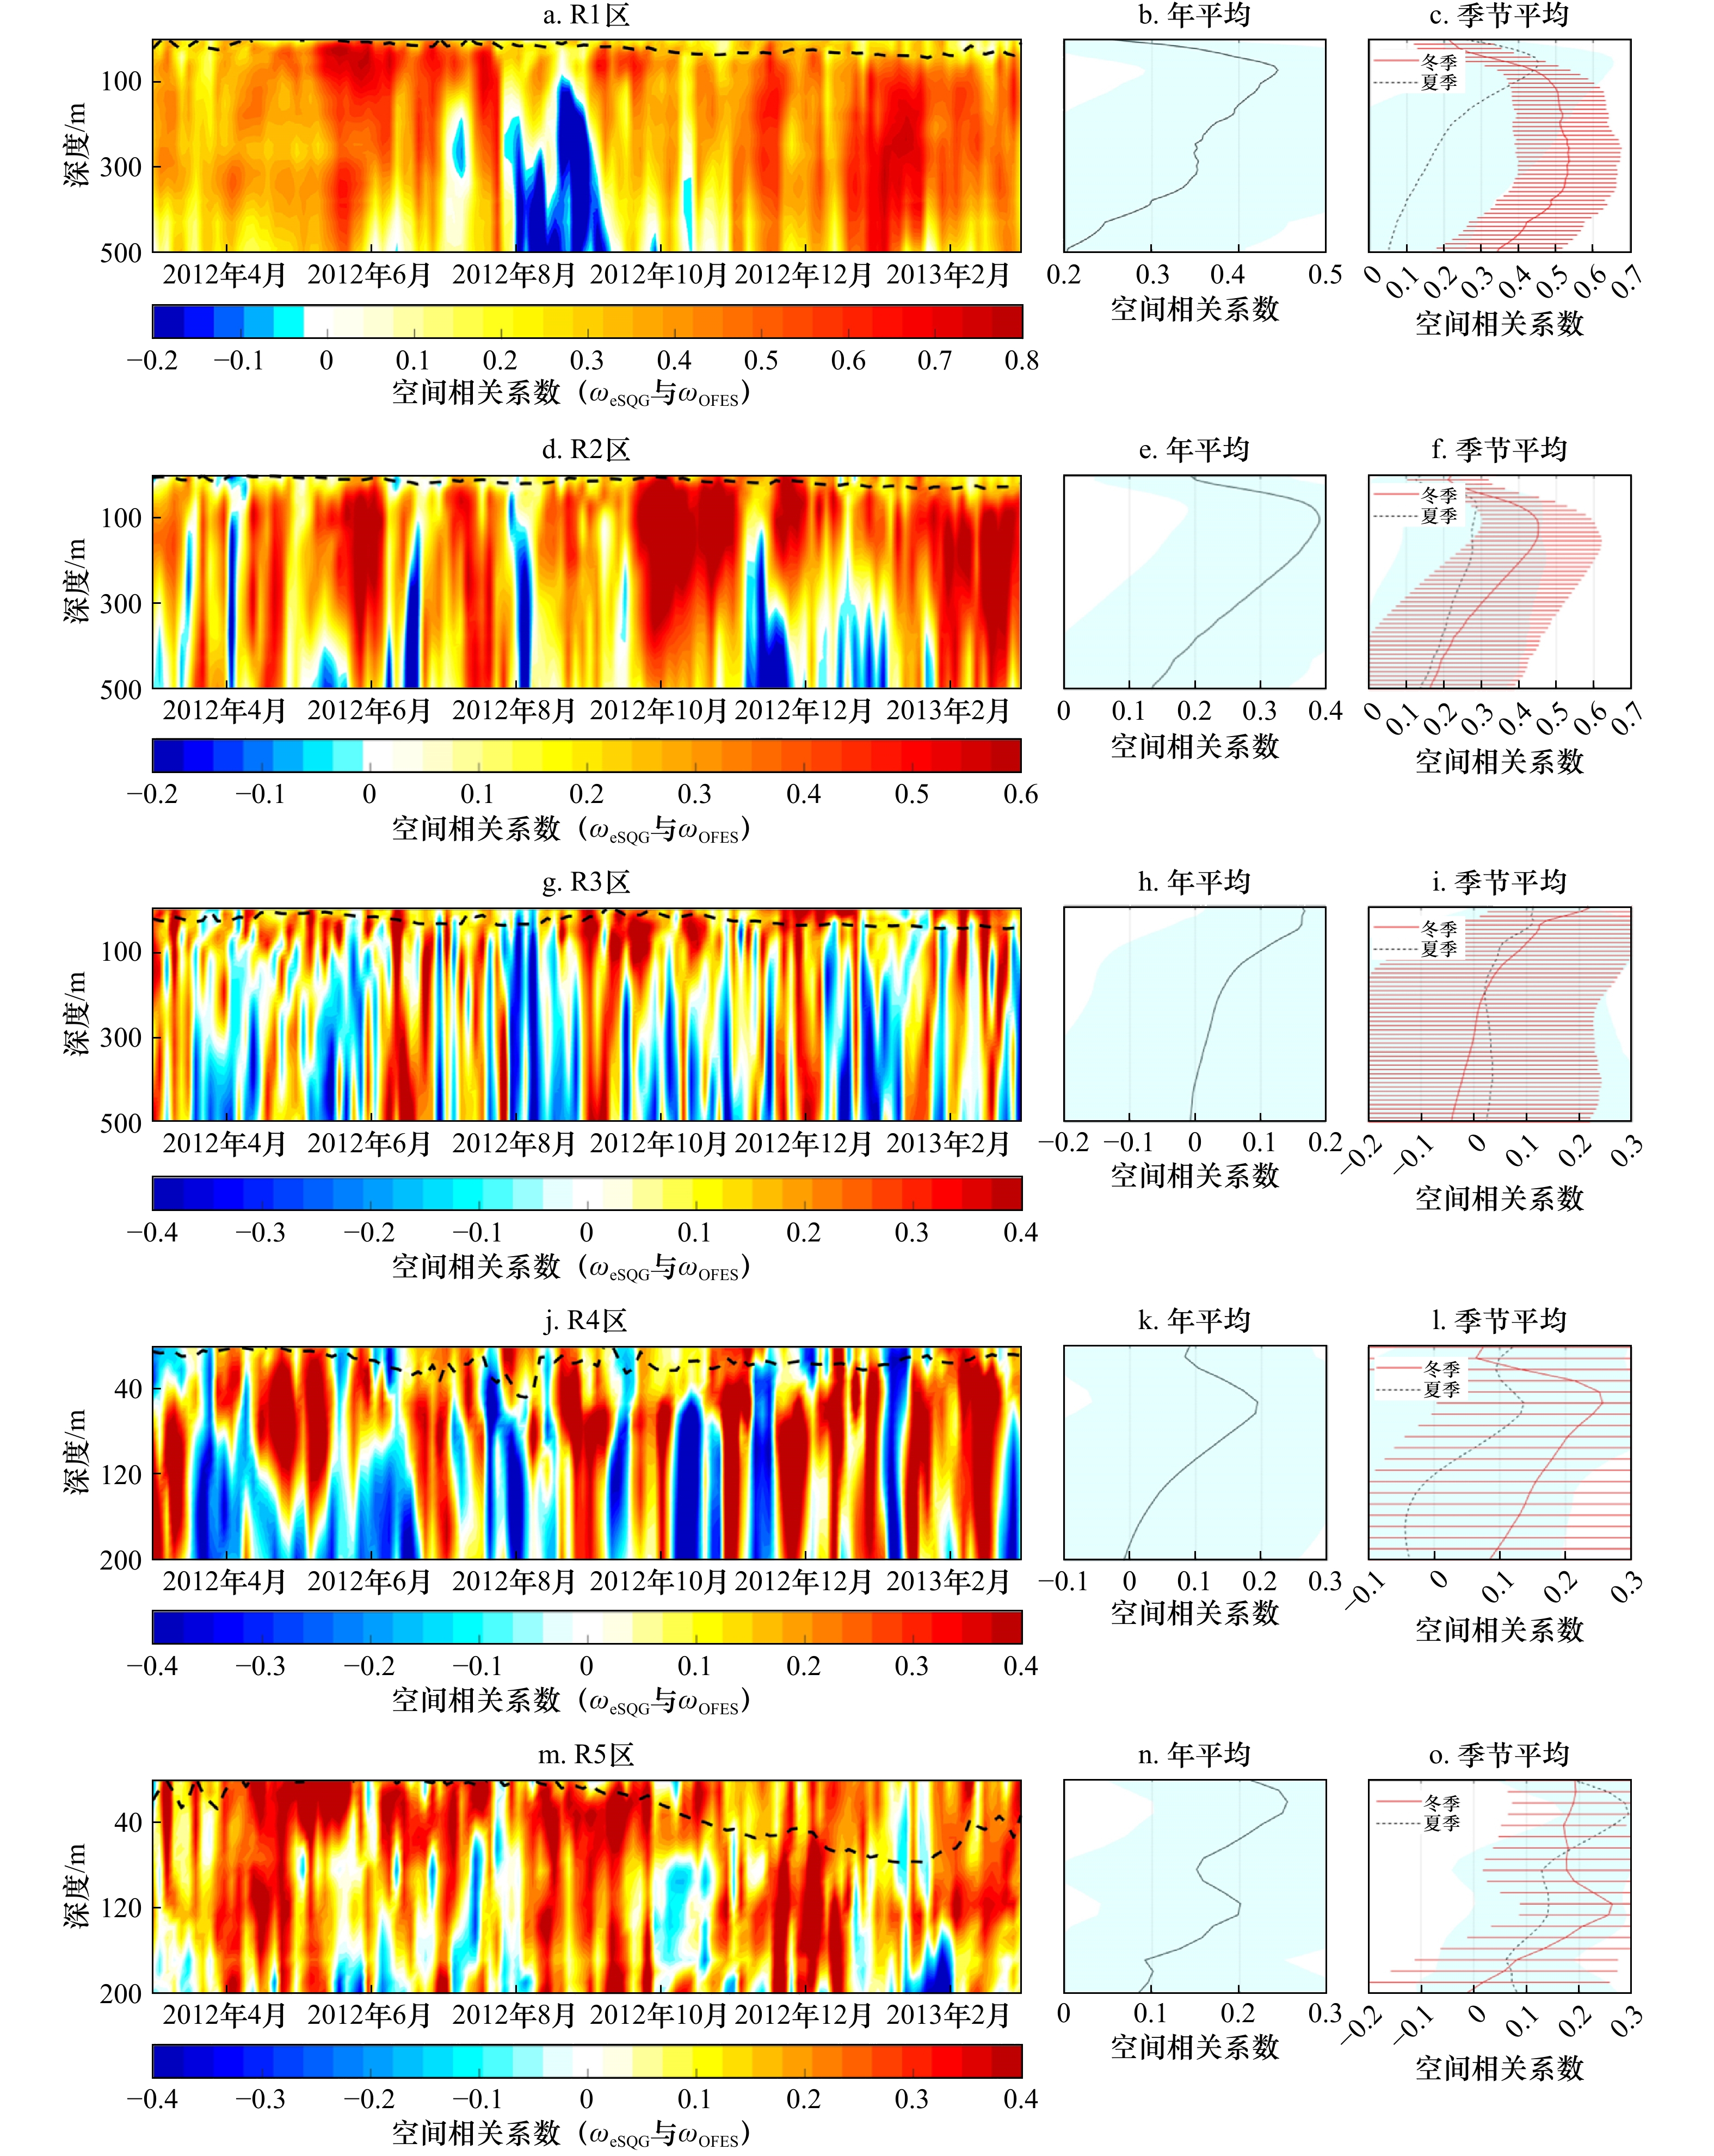
图 5 R1–R5区ωeSQG和ωOFES空间相关系数rs的垂向时间序列及其年平均和季节平均结果
黑色虚线表示平均混合层深度,横杠和阴影表示标准差
Fig. 5 Time series, yearly average and seasonal average of correlation rs between ωeSQG and ωOFES in regions from R1 to R5
Black lines denote the box-averaged mixed layer depth, horizontal bars and cyan shadings denote the standard deviations

图 6 R1–R5区ωeSQG和ωOFES空间相关系数rs的概率分布及其功率谱
Fig. 6 Probability distribution and power spectra of correlation rs between ωeSQG and ωOFES in regions R1 to R5
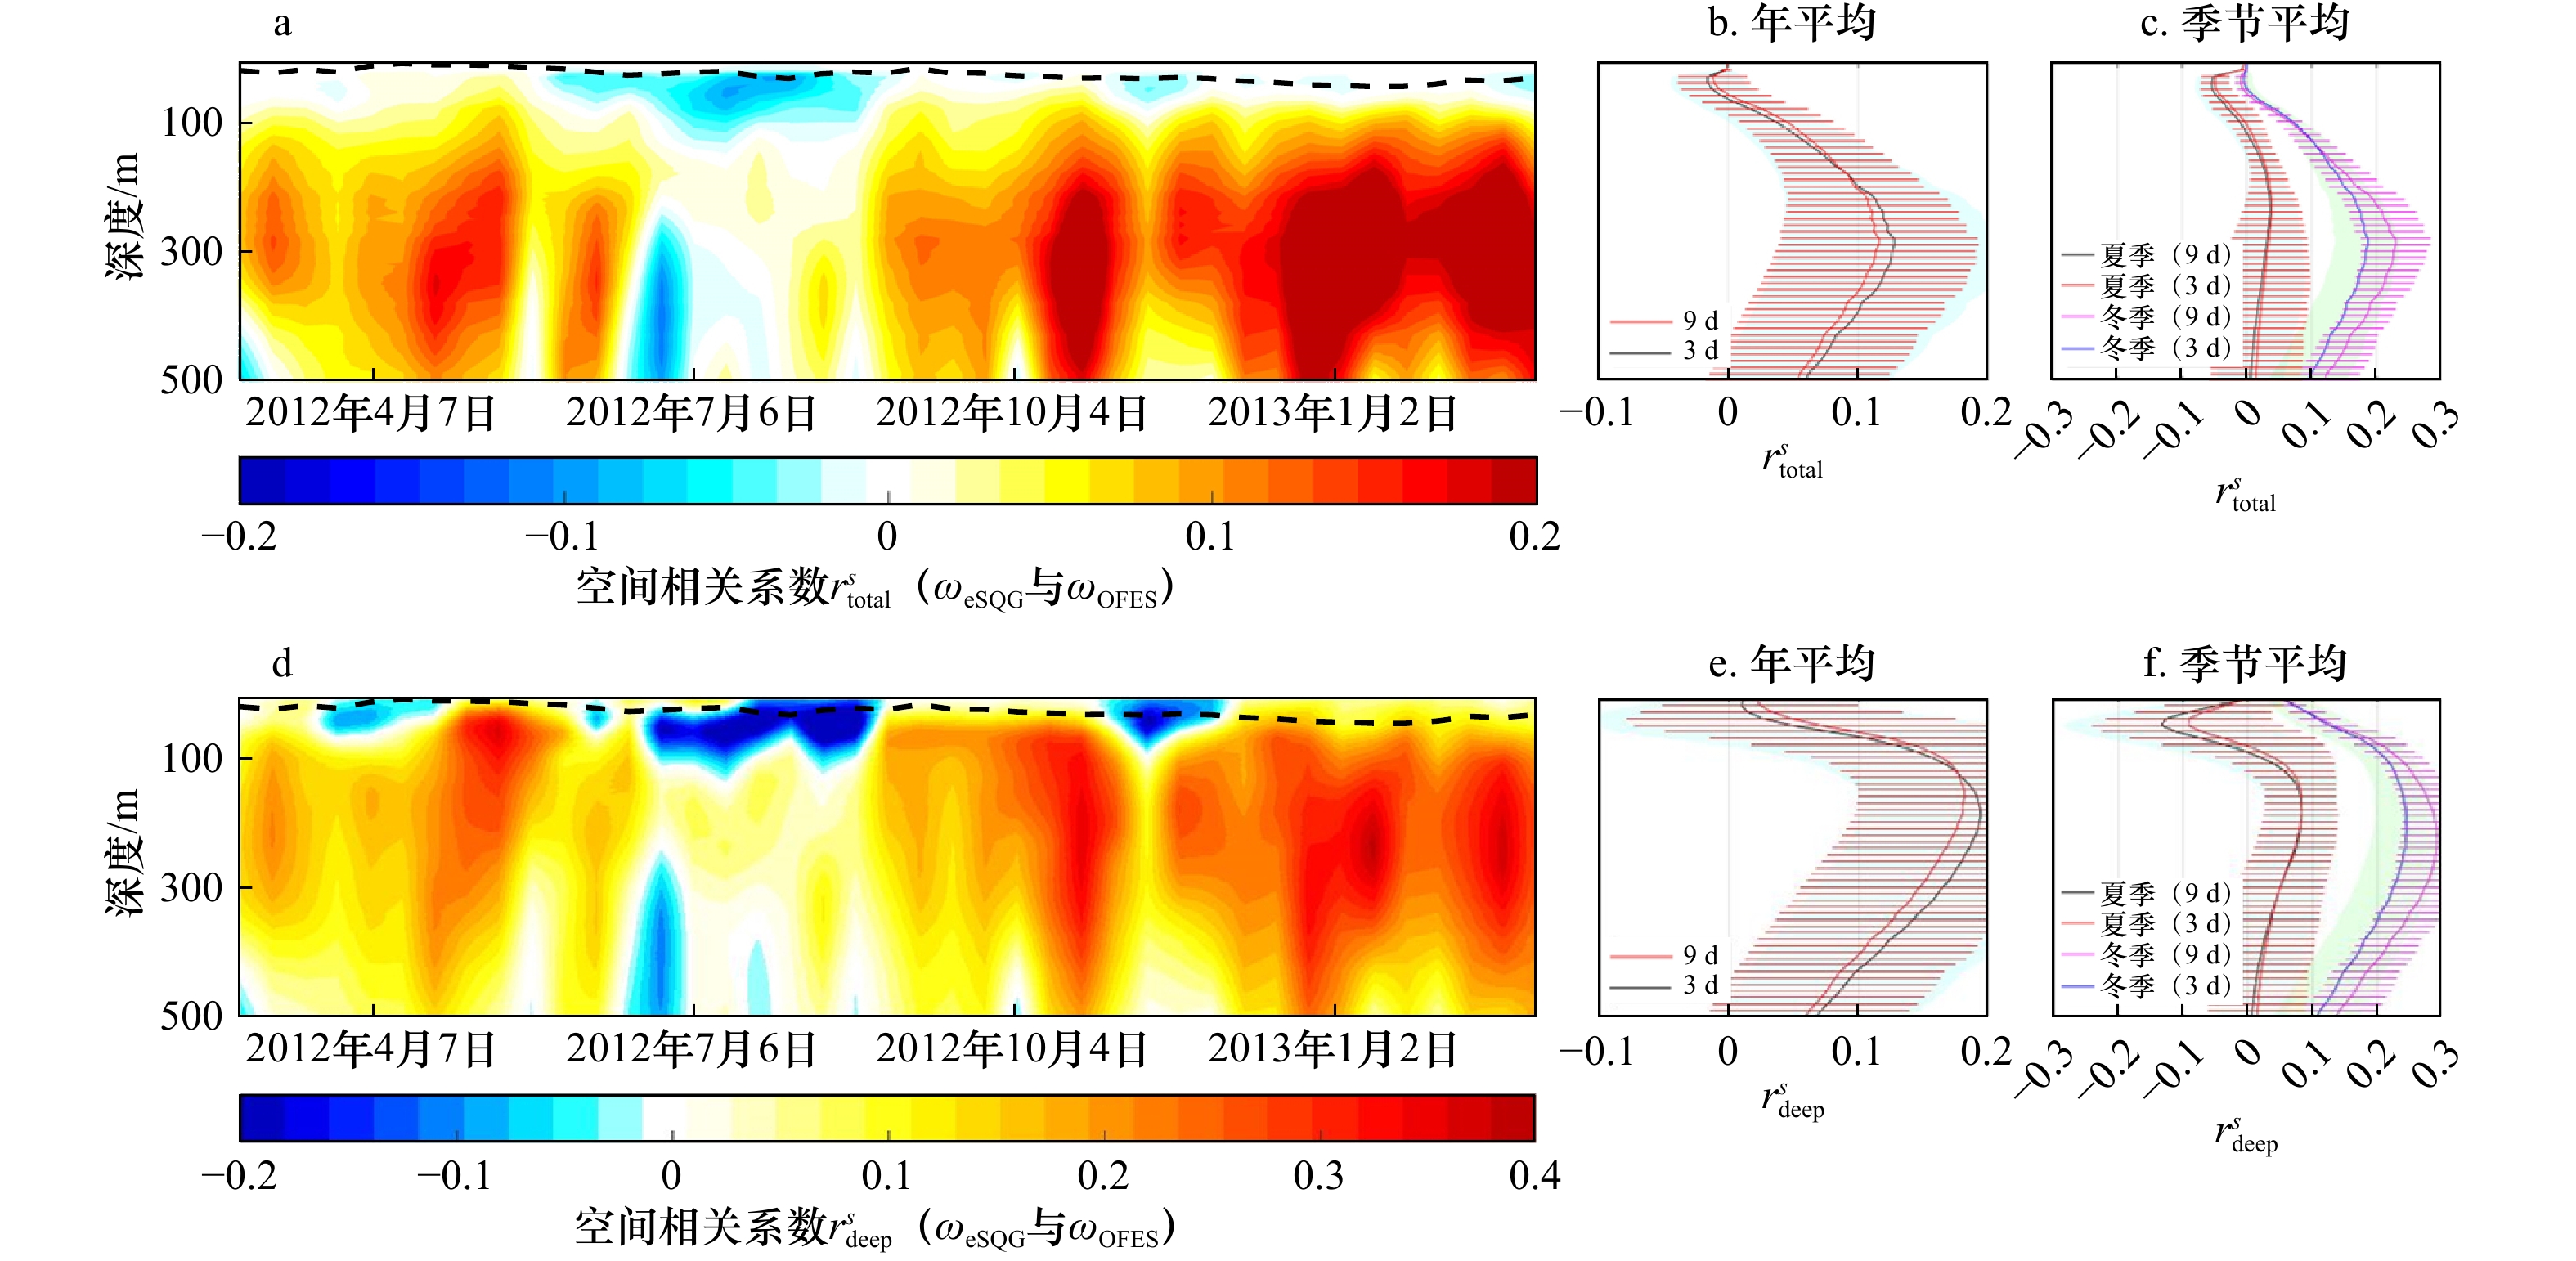
图 7 9 d时间分辨率南海ωeSQG和ωOFES的空间相关系数
$r^s_{{\rm{total}}} $ 和$r^s_{{\rm{deep}}} $ 的垂向时间序列(a, d)及其年平均(b, e)和季节平均(c, f)黑色虚线表示平均混合层深度(a, d),横杠和阴影表示标准差(b–c, e–f)
Fig. 7 Time series (a, d), yearly average (b, e) and seasonal average (c, f) of correlation
$r^s_{{\rm{total}}} $ and$r^s_{{\rm{deep}}} $ between ωeSQG and ωOFES in the South China Sea derived from data with temporal resolution of 9 daysBlack dashed lines denote the area-averaged mixed layer depth (a, d), horizontal bars and color shadings denote the standard deviations (b–c, e–f)

图 8 0.25o空间分辨率南海ωeSQG和ωOFES的空间相关系数
$r^s_{{\rm{total}}} $ 和$r^s_{{\rm{deep}}} $ 的垂向时间序列(a, d)及其年平均(b, e)和季节平均(c, f)黑色虚线表示平均混合层深度(a, d),横杠和阴影表示标准差(b–c, e–f)
Fig. 8 Time series (a, d), yearly average (b, e) and seasonal average (c, f) of correlation
$r^s_{{\rm{total}}} $ and$r^s_{{\rm{deep}}} $ between ωeSQG and ωOFES in the South China Sea derived from data with horizontal resolution of 0.25oBlack dashed lines denote the area-averaged mixed layer depth (a, d), horizontal bars and color shadings denote the standard deviations (b–c, e–f)

图 9 年平均、夏季和冬季南海100 m深度相对涡度的水平分布
黑色线表示100 m等深线
Fig. 9 Horizontal distribution of relative vorticity at 100 m in the South China Sea in the whole year, summer and winter
Black line denotes 100 m isobath

图 10 R1区海面高度(SSH)(a)、ωeSQG(b)和ωOFES(c)谱分析结果
Fig. 10 Power spectra of sea surface height (SSH) (a), ωeSQG (b), and ωOFES (c) in the Region R1
-
[1] Freilich M A, Mahadevan A. Decomposition of vertical velocity for nutrient transport in the upper ocean[J]. Journal of Physical Oceanography, 2019, 49(6): 1561−1575. doi: 10.1175/JPO-D-19-0002.1 [2] Boyd P W, Claustre H, Levy M, et al. Multi-faceted particle pumps drive carbon sequestration in the ocean[J]. Nature, 2019, 568(7752): 327−335. doi: 10.1038/s41586-019-1098-2 [3] 谢玲玲, 张书文, 赵辉. 琼东上升流研究概述[J]. 热带海洋学报, 2012, 31(4): 35−41. doi: 10.3969/j.issn.1009-5470.2012.04.007Xie Lingling, Zhang Shuwen, Zhao Hui. Overview of studies on Qiongdong upwelling[J]. Journal of Tropical Oceanography, 2012, 31(4): 35−41. doi: 10.3969/j.issn.1009-5470.2012.04.007 [4] 计超, 徐利强, 张一辉, 等. 南海琼东上升流区过去1 900年海洋生产力记录[J]. 海洋地质与第四纪地质, 2020, 40(5): 97−106. doi: 10.16562/j.cnki.0256-1492.2019092502Ji Chao, Xu Liqiang, Zhang Yihui, et al. A 1 900-year record of marine productivity in the upwelling area of east continental shelf of Hainan Island, South China Sea[J]. Marine Geology & Quaternary Geology, 2020, 40(5): 97−106. doi: 10.16562/j.cnki.0256-1492.2019092502 [5] Pascual A, Ruiz S, Nardelli B B, et al. Net primary production in the Gulf Stream sustained by quasi-geostrophic vertical exchanges[J]. Geophysical Research Letters, 2015, 42(2): 441−449. doi: 10.1002/2014GL062569 [6] Mahadevan A, Pascual A, Rudnick D L, et al. Coherent pathways for vertical transport from the surface ocean to interior[J]. Bulletin of the American Meteorological Society, 2020, 101(11): E1996−E2004. doi: 10.1175/BAMS-D-19-0305.1 [7] Portela E, Kolodziejczyk N, Vic C, et al. Physical mechanisms driving oxygen subduction in the global ocean[J]. Geophysical Research Letters, 2020, 47(17): e2020GL089040. [8] Liang Xinfeng, Spall M, Wunsch C. Global ocean vertical velocity from a dynamically consistent ocean state estimate[J]. Journal of Geophysical Research: Oceans, 2017, 122(10): 8208−8224. doi: 10.1002/2017JC012985 [9] Xie Lingling, Pallàs-Sanz E, Zheng Quanan, et al. Diagnosis of 3D vertical circulation in the upwelling and frontal zones east of Hainan Island, China[J]. Journal of Physical Oceanography, 2017, 47(4): 755−774. doi: 10.1175/JPO-D-16-0192.1 [10] Chen Ke, Gaube P, Pallàs-Sanz E. On the vertical velocity and nutrient delivery in warm core rings[J]. Journal of Physical Oceanography, 2020, 50(6): 1557−1582. doi: 10.1175/JPO-D-19-0239.1 [11] 沈萌, 缪明芳, 王舒瑜, 等. 2018年夏季舟山海域上升流特征及形成机制分析[J]. 厦门大学学报(自然科学版), 2020, 59(S1): 18−23.Shen Meng, Miao Mingfang, Wang Shuyu, et al. Analysis of upwelling characteristics and formation mechanism in the Zhoushan coastal region in the summer of 2018[J]. Journal of Xiamen University (Natural Science), 2020, 59(S1): 18−23. [12] Wang Liju, Xie Lingling, Zheng Quanan, et al. Tropical cyclone enhanced vertical transport in the northwestern South China Sea I: mooring observation analysis for Washi (2005)[J]. Estuarine, Coastal and Shelf Science, 2020, 235: 106599. doi: 10.1016/j.ecss.2020.106599 [13] Legal C, Klein P, Treguier A M, et al. Diagnosis of the vertical motions in a mesoscale stirring region[J]. Journal of Physical Oceanography, 2007, 37(5): 1413−1424. doi: 10.1175/JPO3053.1 [14] Pietri A, Capet X, D’Ovidio F, et al. Skills and limitations of the adiabatic omega equation: how effective is it to retrieve oceanic vertical circulation at mesoscale and submesoscale?[J]. Journal of Physical Oceanography, 2021, 51(3): 931−954. doi: 10.1175/JPO-D-20-0052.1 [15] 孙春健, 张晓爽, 张寅权, 等. 卫星遥感重构海洋次表层研究进展[J]. 海洋信息, 2018, 33(4): 21−28. doi: 10.19661/j.cnki.mi.2018.04.004Sun Chunjian, Zhang Xiaoshuang, Zhang Yinquan, et al. Progress in reconstruction of ocean subsurface by satellite remote sensing data[J]. Marine Information, 2018, 33(4): 21−28. doi: 10.19661/j.cnki.mi.2018.04.004 [16] Klein P, Isern-Fontanet J, Lapeyre G, et al. Diagnosis of vertical velocities in the upper ocean from high resolution sea surface height[J]. Geophysical Research Letters, 2009, 36(12): L12603. doi: 10.1029/2009GL038359 [17] Lapeyre G, Klein P. Dynamics of the upper oceanic layers in terms of surface quasigeostrophy theory[J]. Journal of Physical Oceanography, 2006, 36(2): 165−176. doi: 10.1175/JPO2840.1 [18] Qiu Bo, Chen Shuiming, Klein P, et al. Reconstructability of three-dimensional upper-ocean circulation from SWOT sea surface height measurements[J]. Journal of Physical Oceanography, 2016, 46(3): 947−963. doi: 10.1175/JPO-D-15-0188.1 [19] Qiu Bo, Chen Shuiming, Klein P, et al. Reconstructing upper-ocean vertical velocity field from sea surface height in the presence of unbalanced motion[J]. Journal of Physical Oceanography, 2020, 50(1): 55−79. doi: 10.1175/JPO-D-19-0172.1 [20] Liu Lei, Xue Huijie, Sasaki H. Diagnosing subsurface vertical velocities from high-resolution sea surface fields[J]. Journal of Physical Oceanography, 2021, 51(5): 1353−1373. doi: 10.1175/JPO-D-20-0152.1 [21] Isern-Fontanet J, Chapron B, Lapeyre G, et al. Potential use of microwave sea surface temperatures for the estimation of ocean currents[J]. Geophysical Research Letters, 2006, 33(24): L24608. doi: 10.1029/2006GL027801 [22] Ponte A L, Klein P, Capet X, et al. Diagnosing surface mixed layer dynamics from high-resolution satellite observations: numerical insights[J]. Journal of Physical Oceanography, 2013, 43(7): 1345−1355. doi: 10.1175/JPO-D-12-0136.1 [23] Chavanne C P, Klein P. Quasigeostrophic diagnosis of mixed layer dynamics embedded in a mesoscale turbulent field[J]. Journal of Physical Oceanography, 2016, 46(1): 275−287. doi: 10.1175/JPO-D-14-0178.1 [24] 郑全安, 谢玲玲, 郑志文, 等. 南海中尺度涡研究进展[J]. 海洋科学进展, 2017, 35(2): 131−158. doi: 10.3969/j.issn.1671-6647.2017.02.001Zheng Quanan, Xie Lingling, Zheng Zhiwen, et al. Progress in research of mesoscale eddies in the South China Sea[J]. Advances in Marine Science, 2017, 35(2): 131−158. doi: 10.3969/j.issn.1671-6647.2017.02.001 [25] Zheng Quanan, Xie Lingling, Xiong Xuejun, et al. Progress in research of submesoscale processes in the South China Sea[J]. Acta Oceanologica Sinica, 2020, 39(1): 1−13. doi: 10.1007/s13131-019-1521-4 [26] 杨潇霄, 曹海锦, 经志友. 南海上层海洋次中尺度过程空间差异和季节变化特征[J]. 热带海洋学报, 2021, 40(5): 10−24. doi: 10.11978/2020116Yang Xiaoxiao, Cao Haijin, Jing Zhiyou. Spatial and seasonal differences of the upper-ocean submesoscale processes in the South China Sea[J]. Journal of Tropical Oceanography, 2021, 40(5): 10−24. doi: 10.11978/2020116 [27] 张雨辰, 张新城, 张金超, 等. 南海亚中尺度过程的时空特征与垂向热量输运研究[J]. 中国海洋大学学报(自然科学版), 2020, 50(12): 1−11.Zhang Yuchen, Zhang Xincheng, Zhang Jinchao, et al. Spatiotemporal characteristics and vertical heat transport of submesoscale processes in the South China Sea[J]. Periodical of Ocean University of China, 2020, 50(12): 1−11. [28] Jing Zhiyou, Qi Yiquan, Du Yan, et al. Summer upwelling and thermal fronts in the northwestern South China Sea: observational analysis of two mesoscale mapping surveys[J]. Journal of Geophysical Research: Oceans, 2015, 120(3): 1993−2006. doi: 10.1002/2014JC010601 [29] 黄小龙, 经志友, 郑瑞玺, 等. 南海西部夏季上升流锋面的次中尺度特征分析[J]. 热带海洋学报, 2020, 39(3): 1−9.Huang Xiaolong, Jing Zhiyou, Zheng Ruixi, et al. Analysis of submesoscale characteristics of summer upwelling fronts in the western South China Sea[J]. Journal of Tropical Oceanography, 2020, 39(3): 1−9. [30] Hu Jianyu, Gan Jianping, Sun Zhenyu, et al. Observed three-dimensional structure of a cold eddy in the southwestern South China Sea[J]. Journal of Geophysical Research: Oceans, 2011, 116(C5): C05016. [31] Lu Wenfang, Yan Xiaohai, Han Lu, et al. One-dimensional ocean model with three types of vertical velocities: a case study in the South China Sea[J]. Ocean Dynamics, 2017, 67(2): 253−262. doi: 10.1007/s10236-016-1029-9 [32] Isern-Fontanet J, Lapeyre G, Klein P, et al. Three-dimensional reconstruction of oceanic mesoscale currents from surface information[J]. Journal of Geophysical Research: Oceans, 2008, 113(C9): C09005. [33] He Zhigang, Wang Dongxiao, Hu Jianyu. Features of eddy kinetic energy and variations of upper circulation in the South China Sea[J]. Acta Oceanologica Sinica, 2002, 21(2): 305−314. [34] Cheng Xuhua, Qi Yiquan. Variations of eddy kinetic energy in the South China Sea[J]. Journal of Oceanography, 2010, 66(1): 85−94. doi: 10.1007/s10872-010-0007-y [35] Xie Lingling, Zheng Quanan. New insight into the South China Sea: Rossby normal modes[J]. Acta Oceanologica Sinica, 2017, 36(7): 1−3. doi: 10.1007/s13131-017-1077-0 [36] Shu Yeqiang, Xue Huijie, Wang Dongxiao, et al. Persistent and energetic bottom-trapped topographic Rossby waves observed in the southern South China Sea[J]. Scientific Reports, 2016, 6(1): 24338. doi: 10.1038/srep24338 [37] Zhu Yaohua, Wang Dingqi, Wang Yonggang, et al. Vertical velocity and transport in the South China Sea[J]. Acta Oceanologica Sinica, 2022, 41(7): 13−25. doi: 10.1007/s13131-021-1954-4 -

 下载:
下载:


计量
- 文章访问数: 782
- HTML全文浏览量: 252
- PDF下载量: 126
- 被引次数: 0
