

Export pathway of Vincennes Bay Bottom Water and its contribution rate in the Antarctic Bottom Water layer
-
摘要: 基于2013‒2015年间每年南半球夏季在东南极洲文森湾外开展的加密观测资料,采用最优多参数分析法评估了文森湾底层水(VBBW)的输出路径及其在南极底层水(AABW)中的贡献率。结果显示,在文森湾西北部海脊上方分布着最淡、最冷和溶解氧含量最高的AABW。局地高密度陆架水(DSW)在该海脊上的底层具有最高占比,最高达(28.58 ± 1.75)%,超出了文森湾正北方大陆坡外侧其他所有站点的占比。DSW与变性绕极深层水(mCDW)的混合物——VBBW的含量同样在该西北部海脊上的AABW所在层达到最大。该结果显示地形对局地DSW乃至VBBW的输出具有重要引导作用,VBBW的输出可能主要沿着该西北部海脊。在垂向上,大部分站点的DSW占比随着深度变浅而减小,但是在次底层普遍存在着斑块状的DSW贡献层,即在某些深度范围内DSW占比增大。对照等密度面的海水特性距平分布可知,在次底层DSW会沿着等密度面往外输出,表现为向外海的温盐入侵层。这些温盐入侵层具有显著低温、低盐和富氧的特点,可能对最新发现的次底层通风增强具有贡献作用。另外,VBBW能够到达澳大利亚−南极海盆
4000 m以深的底部,但是其贡献率相对有限,不超过17%,且主要由mCDW贡献。本文研究有助于理解中等海湾底层水的输出路径及其对澳大利亚−南极海盆底层水的贡献,对进一步研究该海盆深底层水的生成和变性提供有效参考。Abstract: Based on the hydrographic observations carried out in the austral summer during 2013 and 2015 from the continental shelf to the front regions of Vincennes Bay, East Antarctica, this study utilizes an optimum multiparameter analysis method to evaluate the export pathway of Vincennes Bay Bottom Water (VBBW) and its contribution rate to Antarctic bottom water (AABW). The results show that the freshest, coldest, and most oxygen-rich bottom water is distributed above the northwestern ridge of Vincennes Bay. The highest proportion of local Dense Shelf Water (DSW) on the bottom over this ridge was (28.58 ± 1.75)%, which exceeded the proportion observed at all other stations on the offshore side of the continental slope. The VBBW, a mixture of local DSW and modified Circumpolar Deep Water, was also maximized in the AABW layer on this northwestern ridge. The results suggest that topography plays an important role in guiding the outflow of local DSW and even VBBW, and the northwestern ridge could be the main pathway for VBBW export. In the vertical direction, the proportion of DSW decreases with the shallower depth at most stations, but patchy DSW contribution layers were commonly observed in the sub-bottom layers, which means that the proportion of DSW increases in some depth ranges. According to the anomaly distribution of seawater characteristics on the density surfaces, the DSW in the sub-bottom layers can also be exported along the isopycnals, manifested as thermohaline intrusion patches. These thermohaline intrusion patches have significantly colder, fresher, and oxygen-rich characteristics, which may contribute to the enhancement of sub-bottom ventilation. In addition, VBBW can reach the bottom of the Australia-Antarctic basin at depths deeper than4000 m but with a limited contribution rate, no more than 17%, and is mainly contributed by mCDW. This study helps understand the export pathway and contribution of bottom water from the medium bay to the bottom layer of the Australia-Antarctic Basin. It provides a reference for further study on the formation and modification of the AABW in this basin. -


图 2 基于2015年1月获得数据的A断面(上图)和C断面(下图)的θ、S 和CDO分布图。次表层−1.6°C的等温线用白色虚线表示。白色等值线表示大于 γ′′ = 28.27 kg/m3的等密度面
Fig. 2 Sectional distributions of θ, S and CDO for the sections A (upper panels) and C (lower panels) based on the data obtained in Jan. 2015. Subsurface −1.6℃ isotherms are highlighted by white dashed lines. White contours denote isopycnals larger than γ′′ = 28.27 kg/m3

图 3 相对于2015年在(60°S,110°E)站点观测到的等中性密度面上θ、S 和CDO距平断面图,分别表示为aS(上层分图),aθ(中间层分图)和aDO(下层分图)。左分图为A断面,中间分图为B断面,右分图为C断面。各断面方向由右上角的箭头及字母表示,N代表北向,E代表东向
Fig. 3 Anomalies of salinity (aS), temperature (aθ), and CDO (aDO) on the isopycnals relative to the properties at (60°S, 110°E) observed in 2015. The left panels are for Section A, the middle panels for Section B, and the right panels for Section C, respectively. The directions of these sections are indicated on top right, with N denoting northward and E eastward

图 4 AABW沿A断面(a‒c)、D断面(d‒f)和C断面(g‒i)的站点每50 m间隔的源自VB的DSW(PDSW,%)、局部mCDW(PmCDW,%)和AABW-E(PAABW-E,%)的贡献率。误差棒表示一个标准差
Fig. 4 Contribution ratios of VB-origin DSW (PDSW, %), local mCDW (PmCDW, %) and AABW-E (PAABW-E, %) in every 50 m intervals in the AABW layer at the stations along the north-south sections of A (a−c), D (d−f) and C (g−i), respectively. Error bars indicate one standard deviations

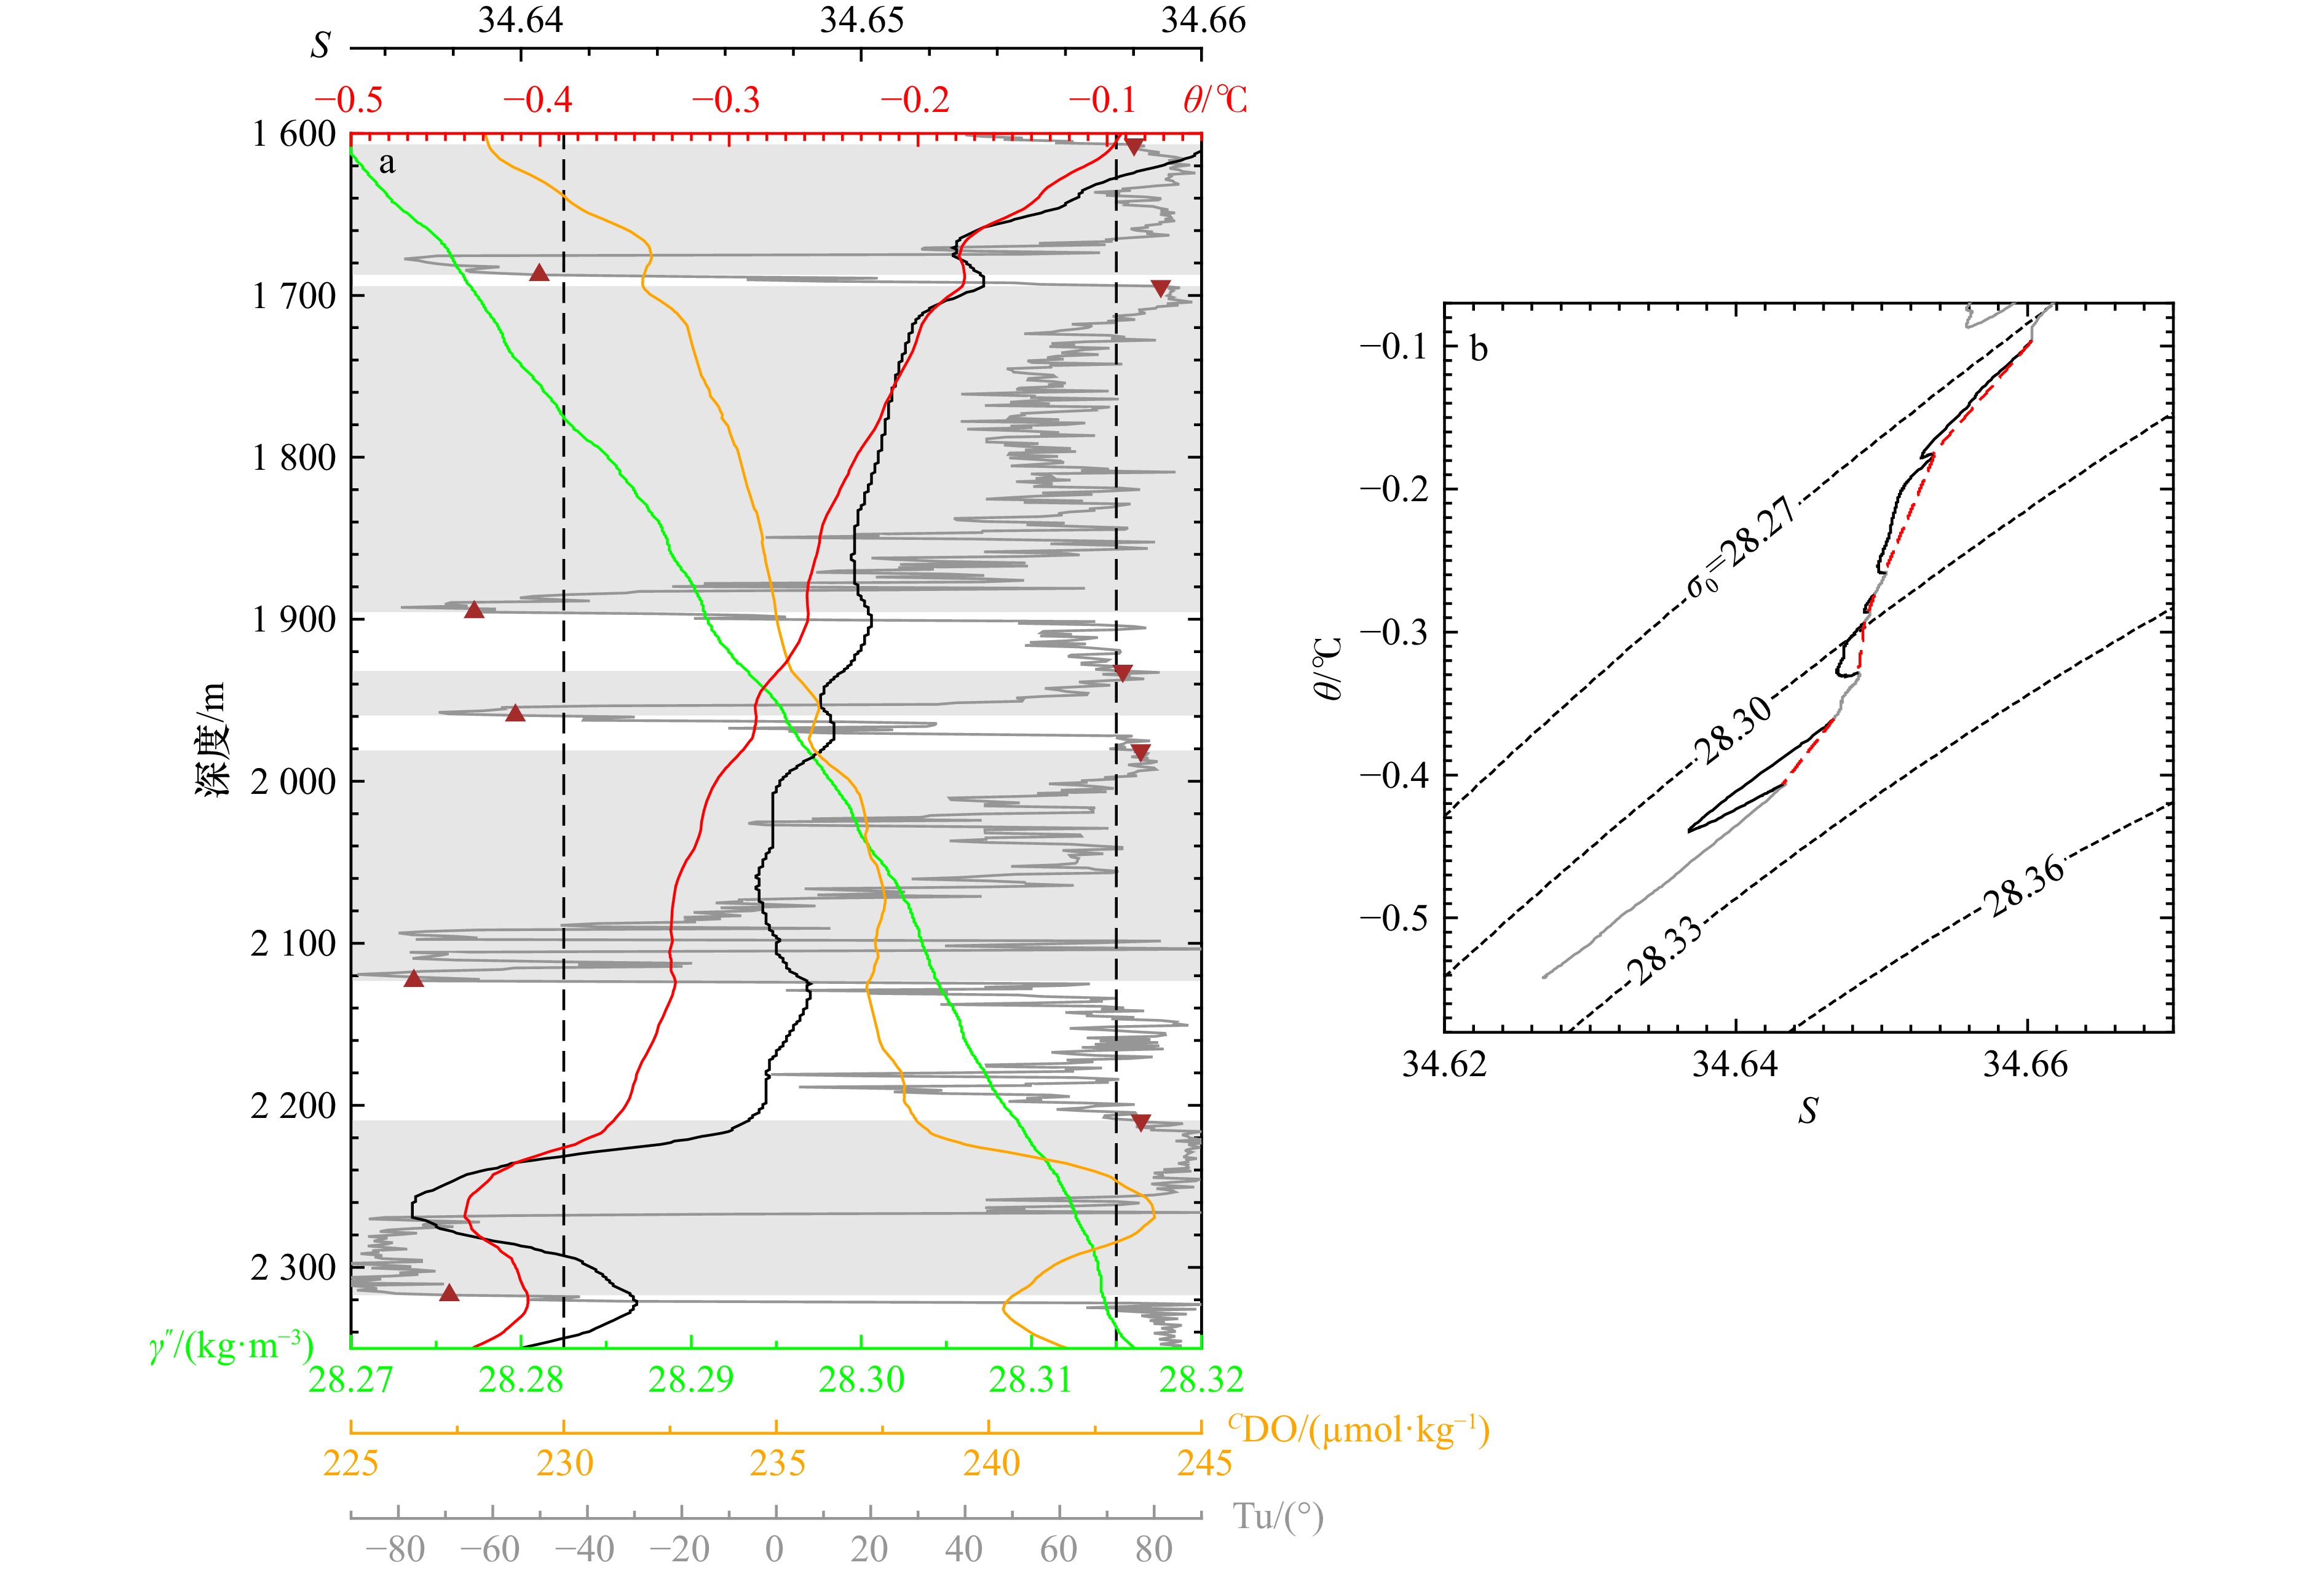
图 6 A02站点斑块状DSW输出实例
a. AABW层入侵层。灰色区域指代入侵层,其上界用倒三角表示,下界用三角表示。θ、S、CDO、γn和Tu的垂向剖面用不同颜色表示。两条虚线分别表示Tu=−45°和72°。b. θ‒S图中入侵层的分布(黑色部分)。红色部分指示入侵层线性差值后的θ‒S分布。灰色线段表示非入侵层
Fig. 6 An example of the DSW intrusion patches at Station A02
a. Intrusion patches detected in the AABW layer. The upper boundary of each patch is indicated by inverted triangle, whereas the lower boundary is by triangle. Vertical profiles of θ, S, CDO, γn, Tu are shown by different colors respectively. The gray backgrounds indicate the vertical spans of the patches. The two dotted lines indicate Tu=−45° and 72°, respectively. b. Intrusion patches in θ-S diagram (black parts). Red dashed line shows the linearly interpolated values within each patch. Gray line shows the layers without any intrusion

图 7 距海底200 m范围内VBBW的贡献率的空间分布。A、B和C断面之间的结果具有可比性,但由于年份观测不同,与M和 沿64°S断面的结果不具有可比性。箭头示意了VBBW的输出路径
Fig. 7 Spatial contributions of VBBW within 200 m above the bottoms. Results between sections of A, B and C are comparable, but not with sections of M and along 64°S due to different year observations. The arrows schematically indicate the outflow pathway of VBBW
表 1 用于表征源自VB的DSW、局地mCDW和AABW-E的特征要素位温(θ)、盐度(S)和溶解氧浓度(CDO)
Tab. 1 Potential temperature (θ), salinity (S) and dissolved oxygen concentration (CDO) to characterize the VB-originated DSW, local mCDW and AABW-E, respectively
水团特性 DSW mCDW AABW-E θ / oC −1.9 1.0 −0.46 S 34.495 34.70 34.645 CDC/(μmol·kg−1) 317.3 200.0 235.0  下载: 导出CSV
-
[1] Speer K, Rintoul S R, Sloyan B. The diabatic deacon cell[J]. Journal of Physical Oceanography, 2000, 30(12): 3212−3222. doi: 10.1175/1520-0485(2000)030<3212:TDDC>2.0.CO;2 [2] Foldvik A, Gammelsrød T, Østerhus S, et al. Ice shelf water overflow and bottom water formation in the southern Weddell Sea[J]. Journal of Geophysical Research: Oceans, 2004, 109(C2): C02015. [3] Gill A E. Circulation and bottom water production in the Weddell Sea[J]. Deep Sea Research and Oceanographic Abstracts, 1973, 20(2): 111−140. doi: 10.1016/0011-7471(73)90048-X [4] Jacobs S S, Amos A F, Bruchhausen P M. Ross sea oceanography and Antarctic bottom water formation[J]. Deep Sea Research and Oceanographic Abstracts, 1970, 17(6): 935−962. doi: 10.1016/0011-7471(70)90046-X [5] Carmack E C. Water characteristics of the Southern Ocean south of the polar front[M]//Angel M. A Vouage of Discovery, Deacon 70th Anniversary Volume. Oxford: Pergam on Press, 1977. [6] Gordon A L, Tchernia P L. Waters of the continental margin off Adélie coast, Antarctica[M]//Hayes D E. Antarctica Oceanology II: The Australian-New Zealand Sector. Washington: American Geophysical Union, 1978: 59−69. [7] Rintoul S R. On the origin and influence of Adélie Land Bottom Water[M]//Jacobs S S, Weiss R F. Ocean, Ice, and Atmosphere: Interactions at the Antarctic Continental Margin 75. Washington: American Geophysical Union, 1985: 151−171. [8] Williams G D, Aoki S, Jacobs S S, et al. Antarctic bottom water from the Adélie and George V Land coast, East Antarctica (140°−149°E)[J]. Journal of Geophysical Research: Oceans, 2010, 115(C4): C04027. [9] Ohshima K I, Fukamachi Y, Williams G D, et al. Antarctic Bottom Water production by intense sea-ice formation in the Cape Darnley polynya[J]. Nature Geoscience, 2013, 6(3): 235−240. doi: 10.1038/ngeo1738 [10] Orsi A H, Jacobs S S, Gordon A L, et al. Cooling and ventilating the abyssal ocean[J]. Geophysical Research Letters, 2001, 28(15): 2923−2926. doi: 10.1029/2001GL012830 [11] Williams G D, Bindoff N L, Marsland S J, et al. Formation and export of dense shelf water from the Adélie Depression, East Antarctica[J]. Journal of Geophysical Research: Oceans, 2008, 113(C4): C04039. [12] Williams G D, Hindell M, Houssais M N, et al. Upper ocean stratification and sea ice growth rates during the summer-fall transition, as revealed by Elephant seal foraging in the Adélie Depression, East Antarctica[J]. Ocean Science, 2011, 7(2): 185−202. doi: 10.5194/os-7-185-2011 [13] Bindoff N L, Rosenberg M A, Warner M J. On the circulation and water masses over the Antarctic continental slope and rise between 80 and 150°E[J]. Deep Sea Research Part II: Topical Studies in Oceanography, 2000, 47(12/13): 2299−2326. [14] Budillon G, Spezie G. Thermohaline structure and variability in the Terra Nova Bay polynya, Ross Sea[J]. Antarctic Science, 2000, 12(4): 493−508. doi: 10.1017/S0954102000000572 [15] Kitade Y, Shimada K, Tamura T, et al. Antarctic bottom water production from the Vincennes bay Polynya, East Antarctica[J]. Geophysical Research Letters, 2014, 41(10): 3528−3534. doi: 10.1002/2014GL059971 [16] Tamura T, Ohshima K I, Fraser A D, et al. Sea ice production variability in Antarctic coastal polynyas[J]. Journal of Geophysical Research: Oceans, 2016, 121(5): 2967−2979. doi: 10.1002/2015JC011537 [17] Ye Wenjun, Cheng Lingqiao, Kitade Y, et al. Distribution of modified circumpolar deep water and its threat in Vincennes Bay, East Antarctica[J]. Journal of Oceanology and Limnology, 2024, 42(5): 1399−1414. doi: 10.1007/s00343-024-3164-3 [18] Orsi A H, Johnson G C, Bullister J L. Circulation, mixing, and production of Antarctic Bottom Water[J]. Progress in Oceanography, 1999, 43(1): 55−109. doi: 10.1016/S0079-6611(99)00004-X [19] Aoki S, Rintoul S R, Ushio S, et al. Freshening of the Adélie Land Bottom Water near 140°E[J]. Geophysical Research Letters, 2005, 32(23): L23601. [20] Aoki S, Kitade Y, Shimada K, et al. Widespread freshening in the Seasonal Ice Zone near 140°E off the Adélie Land Coast, Antarctica, from 1994 to 2012[J]. Journal of Geophysical Research: Oceans, 2013, 118(11): 6046−6063. doi: 10.1002/2013JC009009 [21] Rintoul S R. Rapid freshening of Antarctic Bottom Water formed in the Indian and Pacific oceans[J]. Geophysical Research Letters, 2007, 34(6): L06606. [22] Purkey S G, Johnson G C. Global contraction of Antarctic bottom water between the 1980s and 2000s[J]. Journal of Climate, 2012, 25(17): 5830−5844. doi: 10.1175/JCLI-D-11-00612.1 [23] van Wijk E M, Rintoul S R. Freshening drives contraction of Antarctic bottom water in the Australian Antarctic Basin[J]. Geophysical Research Letters, 2014, 41(5): 1657−1664. doi: 10.1002/2013GL058921 [24] Menezes V V, Macdonald A M, Schatzman C. Accelerated freshening of Antarctic Bottom Water over the last decade in the Southern Indian Ocean[J]. Science Advances, 2017, 3(1): e1601426. doi: 10.1126/sciadv.1601426 [25] Shimada K, Kitade Y, Aoki S, et al. Shoaling of abyssal ventilation in the Eastern Indian Sector of the Southern Ocean[J]. Communications Earth & Environment, 2022, 3(1): 120. [26] Shimada K, Aoki S, Ohshima K I, et al. Influence of Ross Sea Bottom Water changes on the warming and freshening of the Antarctic Bottom Water in the Australian-Antarctic Basin[J]. Ocean Science, 2012, 8(4): 419−432. doi: 10.5194/os-8-419-2012 [27] Katsumata K, Nakano H, Kumamoto Y. Dissolved oxygen change and freshening of Antarctic Bottom water along 62°S in the Australian-Antarctic Basin between 1995/1996 and 2012/2013[J]. Deep Sea Research Part II: Topical Studies in Oceanography, 2015, 114: 27−38. doi: 10.1016/j.dsr2.2014.05.016 [28] Mizobata K, Shimada K, Aoki S, et al. The cyclonic eddy train in the Indian Ocean sector of the Southern Ocean as revealed by satellite radar altimeters and in situ measurements[J]. Journal of Geophysical Research: Oceans, 2020, 125(6): e2019JC015994. doi: 10.1029/2019JC015994 [29] Nihashi S, Ohshima K I. Circumpolar mapping of Antarctic coastal polynyas and landfast sea ice: relationship and variability[J]. Journal of Climate, 2015, 28(9): 3650−3670. doi: 10.1175/JCLI-D-14-00369.1 [30] Joyce T M. Introduction to the collection of expert reports compiled for the WHP programme[R]. WHP, 1991. (查阅网上资料, 未找到对应的出版地信息, 请确认) [31] Shimada K, Makabe R, Takao S, et al. Physical and chemical oceanographic data during Umitaka-maru cruise of the 58th Japanese Antarctic Research Expedition in January 2017[J]. Polar Data Journal, 2020, 4: 1−29. [32] Hood E M, Sabine C L, Sloyan B M. The GO-SHIP repeat hydrography manual: a collection of expert reports and guidelines[R]. IOCCP Report, 2010. (查阅网上资料, 未找到对应的出版地信息, 请确认) [33] Amante C, Eakins B W. ETOPO1 arc-minute global relief model: procedures, data sources and analysis[R]. Boulder: National Oceanic and Atmospheric Administration, 2009. [34] Thompson R O R Y, Edwards R J. Mixing and water-mass formation in the Australian Subantarctic[J]. Journal of Physical Oceanography, 1981, 11(10): 1399−1406. doi: 10.1175/1520-0485(1981)011<1399:MAWMFI>2.0.CO;2 [35] Jackett D R, McDougall T J. A neutral density variable for the world’s oceans[J]. Journal of Physical Oceanography, 1997, 27(2): 237−263. doi: 10.1175/1520-0485(1997)027<0237:ANDVFT>2.0.CO;2 [36] Tomczak M, Large D G B. Optimum multiparameter analysis of mixing in the thermocline of the eastern Indian Ocean[J]. Journal of Geophysical Research: Oceans, 1989, 94(C11): 16141−16149. doi: 10.1029/JC094iC11p16141 [37] Yamazaki K, Katsumata K, Hirano D, et al. Revisiting circulation and water masses over the East Antarctic margin (80–150°E)[J]. Progress in Oceanography, 2024, 225: 103285. doi: 10.1016/j.pocean.2024.103285 [38] Mizuta G, Ohshima K I, Takatsuka T, et al. Circulation and production of Cape Darnley Bottom Water on the continental slope off the Cape Darnley polynya, East Antarctica[J]. Deep Sea Research Part I: Oceanographic Research Papers, 2024, 211: 104362. doi: 10.1016/j.dsr.2024.104362 [39] Shimada K, Aoki S, Ohshima K I. Creation of a gridded dataset for the Southern Ocean with a topographic constraint scheme[J]. Journal of Atmospheric and Oceanic Technology, 2017, 34(3): 511−532. doi: 10.1175/JTECH-D-16-0075.1 [40] Woods J D, Onken R, Fischer J. Thermohaline intrusions created isopycnically at oceanic fronts are inclined to isopycnals[J]. Nature, 1986, 322(6078): 446−449. doi: 10.1038/322446a0 [41] Ruddick B, Richards K. Oceanic thermohaline intrusions: observations[J]. Progress in Oceanography, 2003, 56(3/4): 499−527. [42] Ruddick B. A practical indicator of the stability of the water column to double-diffusive activity[J]. Deep Sea Research Part A. Oceanographic Research Papers, 1983, 30(10): 1105−1107. doi: 10.1016/0198-0149(83)90063-8 [43] Shcherbina A Y, Gregg M C, Alford M H, et al. Characterizing thermohaline intrusions in the North Pacific subtropical frontal zone[J]. Journal of Physical Oceanography, 2009, 39(11): 2735−2756. doi: 10.1175/2009JPO4190.1 -

计量
- 文章访问数: 27
- HTML全文浏览量: 9
- PDF下载量: 16
- 被引次数: 0
