

Combined effects of ocean acidification and phosphorus limitation on physiological characteristics of the coccolithophores Emiliania huxleyi
-
摘要: 颗石藻既通过光合作用合成颗粒有机碳(POC),又通过钙化作用产生颗粒无机碳(PIC),对海洋碳循环有重要贡献。虽然已有一些研究报道海洋酸化通常可增加颗石藻细胞POC含量,减少细胞PIC含量,但是这些实验结果大部分是在营养盐浓度充足条件下获得,且较少研究关注营养盐浓度限制和海洋酸化对颗石藻的耦合作用。本文研究了在无机磷浓度限制条件下,赫氏颗石藻(Emiliania huxleyi)的主要生理指标对海洋酸化的响应特征。结果显示,海洋酸化和无机磷浓度限制协同降低了颗石藻的生长速率、相对电子传递速率和光能利用效率。无机磷浓度限制主导增加颗石藻的光合固碳量,并抵消了海洋酸化对细胞PIC含量及PIC/POC比率的负面效应。研究结果表明,无机磷浓度限制改变了颗石藻的两种固碳作用对海洋酸化的响应趋势,暗示在无机磷浓度不同的海域,颗石藻对海洋碳循环的贡献不同。Abstract: Coccolithophores can produce particulate organic carbon (POC) via photosynthesis and synthesize particulate inorganic carbon (PIC) via calcification; they also make an important contribution to marine carbon cycle. Some studies have reported that ocean acidification generally increases POC content and decreases PIC content of coccolithophores, however, most of the studies show these results under nutrient replete conditions, and a few studies focus on the combined effects of nutrient limitation and ocean acidification on coccolithophores. In this study, we investigated the physiological responses of the coccolithophore Emiliania huxleyi to ocean acidification under dissolved inorganic phosphorus (DIP) limitation. Our data show that ocean acidification and DIP limitation act synergistically to reduce growth rate, relative photosynthetic electron transport rate and light use efficiency of photosynthetic system II of E. huxleyi. Dissolved inorganic phosphorus limitation dominantly increases cellular POC content and offsets the negative effect of ocean acidification on cellular PIC content and the ratio of PIC : POC. Our results suggest that DIP limitation changed the response trends of POC and PIC contents to ocean acidification, which indicates that the contributions of coccolithophores to marine carbon cycle are different in these ocean areas with different DIP concentrations.
-
Key words:
- coccolithophore /
- Emiliania huxleyi /
- ocean acidification /
- phosphorus limitation /
- growth rate /
- calcification /
- photosynthesis
-
1. 引言
大气二氧化碳(CO2)分压从工业革命前280 µatm(1 atm = 101 325 Pa)增加到2022年420 µatm,并且到2100年,CO2分压可能上升到700~1 000 µatm[1]。人类排放的CO2约有1/3被海洋吸收[2],海水与CO2发生化学反应,产生氢离子(H+)和碳酸氢根离子(
${{\rm {HCO}_3^-}} $ )。随着大气CO2浓度升高,海水氢离子浓度([H+])增加且pH下降,引起海洋酸化。另一方面,大气CO2浓度升高造成全球变暖,加剧海水层化,使海洋上部混合层变浅,减少深层海水向表层海水输送营养盐速度,导致海洋表层浮游植物的生长更易受到营养盐浓度限制[3]。在很多海域,例如地中海东部[4]、大西洋中部[5]等混合层中溶解无机磷(Dissolved Inorganic Phosphorus, DIP)浓度通常限制海洋初级生产力[6-7]。鉴于海洋酸化与DIP浓度限制同时发生,在未来海洋酸化条件下,进一步研究DIP浓度限制对浮游植物的影响很有必要。颗石藻既能吸收海水中CO2进行光合固碳,又能利用
${\rm{HCO}}_3^- $ 进行钙化作用并释放CO2到海水中,对海洋生物碳泵有重要贡献,并且成为海洋生理生态学领域的一个重要研究对象[8-9]。赫氏颗石藻(Emiliania huxleyi)是分布于全球海洋的最重要钙化颗石藻种之一,并能形成藻华,对海洋生态系统有重要影响[10]。一些研究显示,海洋酸化通常增加E. huxleyi单位细胞的叶绿素a(Chl a)含量和颗粒有机碳(Particulate Organic Carbon, POC)含量,通常减少E. huxleyi的钙化作用(即颗粒无机碳(Particulate Inorganic Carbon, PIC)含量)[11-12]。但是这些研究结果大部分是在无机氮和无机磷浓度充足条件下获得的,很少有关于海洋酸化与营养盐浓度限制对颗石藻生理特征耦合作用的报道[13]。磷元素是构成三磷酸腺苷(ATP)和核糖核酸(RNA)的必需元素,主要存在于细胞的核酸和蛋白质中,对维持细胞生命活动和海洋初级生产力有重要作用。在无机磷浓度充足条件下,藻细胞在胞内存储大量多聚磷酸盐;在无机磷浓度限制条件下,藻细胞合成碱性磷酸酶用于水解胞内存储的多聚磷酸盐,进而维持细胞的代谢和生长[14-15]。一些研究提出:颗石藻藻华通常发生在硅藻藻华之后的一个重要原因是颗石藻更能耐受无机磷浓度的限制[16]。室内实验结果也显示,赫氏颗石藻对无机磷具有很高的亲和力,其生长速率受DIP浓度限制的影响较小[17-18],同时无机磷浓度限制通常增加颗石藻单位细胞的POC和PIC含量[18]。鉴于无机磷浓度限制与海洋酸化对颗石藻PIC含量产生相反的实验结果,有必要研究两者的耦合作用。
本文选取赫氏颗石藻株系RCC1266为研究对象,在实验室内进行半连续培养实验,研究了两个CO2浓度和两个无机磷浓度对该藻的生长速率、色素含量、相对电子传递速率(rETR)、单位细胞PIC和POC含量及其比率的交互作用,旨在深入了解海洋酸化与无机磷浓度变化对颗石藻生理特征的交互影响及其引起的生物地球化学效应。
2. 材料与方法
2.1 实验设计
实验所用颗石藻藻株,Emiliania huxleyi RCC1266,从法国罗斯科夫藻种保藏中心(Roscoff culture collection)获得,该藻株在2007年分离于爱尔兰附近的陆架水域(49°30′N,10°30′W)。根据Berges等[19]报道的方法配制富集的人工海水(Enriched Artificial Seawater, EASW),人工海水盐度为33。细胞在人工海水中进行半连续培养,光强为140 μmol/(m2·s)(LI-190SA光量子传感器,北京力高泰科技有限公司,中国),培养温度为20℃(GXZ培养箱,东南仪器公司,中国),光暗周期为12 h∶12 h(光照时间:8:00−20:00)。培养基初始无机氮浓度为64 μmol/L,无机磷浓度为4 μmol/L。向培养基添加2 350 μmol/L NaHCO3,使初始总碱度(Total Alkalinity, TA)达到2 350 μmol/L。根据Guillard和Ryther[20]的配方将痕量金属和维生素母液添加到海水中,使其最终浓度为f/8配方(f/2配方稀释4倍)。对于磷限制条件下的培养基,初始无机磷浓度为0.4 μmol/L。本研究无机磷浓度和海洋酸化的培养实验共设置了4个处理组,每个处理组3个重复。4个处理组分别为:(1)对照组:无机磷浓度为4 μmol/L,pCO2为400 µatm;(2)海洋酸化组:无机磷浓度为4 μmol/L,pCO2为1 000 µatm;(3)磷限制组:无机磷浓度为0.4 μmol/L,pCO2为400 µatm;(4)磷限制和海洋酸化组:无机磷浓度为0.4 μmol/L,pCO2为1 000 µatm。
将海水分装到4个2 L玻璃瓶中,向两瓶海水中添加4 μmol/L无机磷(NaH2PO4),放入20℃培养箱中,向这两瓶海水中通正常空气(pCO2约为400 µatm,pHT(总标度)大约为8.05)24 h。取其中一瓶海水,按照1 L海水中加入6 mL饱和CO2海水的比例,用饱和CO2海水下调2 L玻璃瓶内海水pH到7.75,进而获得酸化的海水。向另外两瓶海水加入0.4 μmol/L无机磷,同样用上述方法调节海水pH为8.05和7.75。气体在通入海水前用微孔滤膜(PTFE,0.22 μm孔径,南通)过滤。在每个实验条件下,用囊式过滤器(0.22 μm孔径,Polycap 75 AS)过滤海水,并小心泵入已经高压灭菌的125 mL和500 mL聚碳酸酯(PC)瓶中。用海水充满PC瓶以最大限度地减少气体交换(125 mL和500 mL PC瓶分别能装满150 mL 和610 mL海水)。125 mL瓶子用于适应培养实验(3个重复),500 mL PC瓶用于主培养实验(3个重复)。
细胞的初始转接浓度约为5 000 cell/mL,并在每个实验条件下培养2 d,然后再次将细胞稀释到初始浓度(图1M至图1P)。此操作在每个处理条件下重复3次,细胞在指数生长期至少分裂9代。在正式培养时,将藻细胞从125 mL PC瓶转移到500 mL PC瓶。在主实验培养的第2天(细胞浓度不超过5.5 ×10⁴ cell/mL)进行最终采样。测定参数为TA(50 mL)、pH(20 mL)、细胞浓度(20 mL)、荧光参数(10 mL)、总颗粒碳含量(TPC, 200 mL)、POC含量(200 mL)和色素含量(100 mL)。
 图 1 不同处理下,在培养开始和结束时,培养基中溶解无机磷(DIP)浓度(A−D)、CO2分压(E−H)、pH(I−L)和细胞浓度(单位:cell/mL)的自然对数(M−P)Figure 1. Dissolved inorganic phosphorus (DIP) concentration (A−D), pCO2 level (E−H), pH (I−L) and logarithm of cell concentration (unit: cell/mL) (M−P) at the beginning and end of the cultures under different treatments
2.2 溶解无机磷浓度和碳酸盐体系参数的测定
在培养前和培养的第2天,用针式注射器(0.22 μm孔径,海宁)抽滤20 mL样品,并根据Hansen和Koroleff[21]的方法用紫外可见分光光度计(P5,上海美谱达仪器有限公司,中国)测定DIP浓度。
分别将20 mL和50 mL样品用微孔滤膜过滤,用于测定pHT值和TA。将海水从瓶子底部向上逐步充满瓶子,并立即封住瓶子。在20℃下立即测定pH。pH计用pH为4.01、7.00和10.00的标准缓冲液(Tris-HCl,Hanna)校准。TA样品在4℃下最多储存7 d[22],根据Dickson等[23]的方法,在20°C时通过电位滴定法(AS-ALK1+,Apollo SciTech)测定TA。在本实验中,用Microsoft Excel软件中的 CO2SYS[24],根据TA、pH、无机磷浓度(4 μmol/L或 0.4 μmol/L)、温度和盐度计算出碳酸盐体系参数,并根据Roy等[25]的方法取碳酸平衡常数K1和K2。
2.3 生长速率和色素的测定
细胞浓度用颗粒计数仪测定(Z2, Beckman Coulter)。生长速率根据48 h内细胞浓度的变化,用公式μ =(lnN1 – lnN0)/d计算,其中N0和N1分别代表在实验开始时(第0天)和第2天的细胞浓度,d为生长周期(单位:d)。对于色素的测定,在培养实验最后一天,将藻细胞抽滤到GF/F(25 mm直径,Whatman)膜上,放入10 mL离心管,添加 5 mL体积分数为90%的丙酮,在4℃下避光提取24 h。提取液在4 300 g的离心力下离心10 min,去除玻璃纤维。使用分光光度计(SP-722,上海光谱仪器有限公司,中国)测定上清液在波长为750 nm、664 nm、647 nm和480 nm处的吸光度(A),Chl a浓度[Chl a][26]计算公式为
$$ [{\rm{Chl}}\;a]({\text{µ}} {\rm{g/mL}})=-1.93\times (A_{647}-A_{750})+11.93\times (A_{664}-A_{750})\text{,} $$ (1) 类胡萝卜素(Carotenoid)浓度[27]计算公式为
$$ [{\rm{Carotenoid}}]({\text{µ}}{\rm{g/mL}})=4\times (A_{480}-A_{750}). $$ (2) 2.4 叶绿素荧光参数的测定
用调制叶绿素荧光仪(WATER-PAM, Walz, Effeltrich, Germany)测定光合荧光参数。藻细胞先在20℃的黑暗条件下适应15 min,饱和脉冲设定为3 000 μmol/(m2·s),持续0.8 s。在光响应曲线的测定中,检测光强梯度设置为:0 μmol/(m2·s)、63 μmol/(m2·s)、116 μmol/(m2·s)、162 μmol/(m2·s)、260 μmol/(m2·s)、420 μmol/(m2·s)、610 μmol/(m2·s)、850 μmol/(m2·s)和 1 120 μmol/(m2·s),分9步施加,每步45 s。在每个检测光(A-PAR)和饱和光脉冲结束时,分别测定瞬时最小荧光(
$F_0' $ )和瞬时最大荧光($F_m' $ )。有效光化学效率(Yield)[28]计算公式为$$ {\rm{Yield}} =(F_m'-F_0')/F_m'. $$ (3) rETR[29]计算公式为
$$ {\rm {rETR}} = {\rm{Yield}} \times {{{\rm{A}}}}{\text-}{\rm{PAR}}\text{,}$$ (4) rETR对检测光强的响应曲线(P–I曲线)的参数采用如下公式[30]拟合:
$$ {\rm{rETR}}=P_1\times {{{\rm{A}}}}{\text-}{\rm{PAR}}/(P_2+{{{\rm{A}}}}{\text-}{\rm{PAR}})\text{,} $$ (5) 式中,A-PAR为检测光强度;P1为最大相对电子传递速率(即rETRmax);P2为半饱和光强(即Ik)。光能利用效率(α)为快速光响应曲线的初始斜率,依据下式计算:
$$ \alpha={\rm{rETR}}_{\max}/I_k.$$ (6) 2.5 颗粒有机碳、颗粒无机碳的测定
在培养实验最后一天,取两份200 mL藻液分别过滤到预先经马弗炉灼烧(450℃,4 h)过的GF/F膜上,然后在−20℃下避光保存。对于POC含量的测定,样品首先在浓盐酸中酸熏12 h以除去PIC,然后置于60℃烘箱中烘干24 h;另一份样品不进行酸化处理,直接在60℃下烘干,用于测定TPC含量。所有TPC和POC样品用CHNS元素分析仪(Vario EL cube, GmbH, Germany)进行测定。PIC含量由TPC和POC的含量差值计算。
2.6 数据分析
用双因素方差分析(Two-way ANOVA)来分析CO2浓度和无机磷浓度的主要影响及其对每个参数的相互作用,用 Tukey post hoc 检验来分析两个CO2浓度或两个无机磷浓度之间的显著差异,显著性水平设置为p < 0.05。所有数据计算在Excel 2019中进行,用Origin 2021软件作图。
3. 结果
3.1 溶解无机磷浓度和碳酸盐体系参数
在对照组处理下,DIP浓度从实验开始时的4.04 μmol/L降低到培养结束时的(3.26 ± 0.07)μmol/L(图1A);在海洋酸化处理下,DIP浓度从实验开始时4.04 μmol/L降低到培养结束时(3.40 ± 0.08)μmol/L(图1B)。而在磷限制、磷限制和海洋酸化处理下,实验开始时DIP浓度为0.42 μmol/L(图1C,图1D),培养结束时DIP浓度低于检测下限(< 0.04 μmol/L)。这说明在培养结束时(或者取样品测定参数时)低浓度DIP限制了藻细胞的代谢和生长。
在培养过程中,海水CO2分压在两个无机磷浓度和CO2浓度处理下降低了11.03%~20.84%(图1E至图1H)。相应地,在不同的实验处理下,pH增加梯度小于0.07(图1I至图1L)。这说明在整个培养过程中,海水碳酸盐系统没有显著变化。
3.2 生长速率和细胞色素含量
不同处理下E. huxleyi RCC1266的生长速率和细胞色素含量如图2和表1所示。与对照组相比,海洋酸化、磷限制对生长速率无显著影响(p > 0.05,图2A),而在磷限制和海洋酸化的相互作用下,生长速率降低了19.28%(p < 0.05,图2A)。与对照组相比,在海洋酸化、磷限制、磷限制和海洋酸化处理下,Chl a含量都没有显著变化(p > 0.05)。与磷限制相比,在磷限制和海洋酸化处理下,Chl a含量下降了12.86%(p < 0.05,图2B)。与对照组相比,在海洋酸化、磷限制和海洋酸化处理下,类胡萝卜素含量均没有显著差异(p > 0.05),磷限制使类胡萝卜素含量增加了9.62%(p < 0.05,图2C)。这些结果表明,磷限制和海洋酸化对生长速率产生负向协同效应,同时海洋酸化能削弱磷限制对Chl a和类胡萝卜素含量的促进效果。
 图 2 不同处理下赫氏颗石藻(Emiliania huxleyi)株系RCC1266的生长速率(A)、叶绿素a含量(B)、类胡萝卜素含量(C)及类胡萝卜素与叶绿素a含量的比率(D)不同字母代表显著性差异Figure 2. Growth rate (A), chlorophyll a content (B), carotenoid content (C) and the ratio of carotenoid content to chlorophyll a content (D) of the coccolithophore Emiliania huxleyi RCC1266 under different treatmentsDifferent letters represent significant difference表 1 二元方差分析获得无机磷浓度和CO2浓度及其相互作用对赫氏颗石藻(Emiliania huxleyi)株系RCC1266的生长速率、色素含量、荧光参数、细胞元素含量及其比率影响的统计结果Table 1. Results of two-way ANOVA of the effects of inorganic phosphorus concentration and CO2 concentration and their interactions on growth rate, pigment content, fluorescence parameters, cellular elements content and their ratios of the coccolithophore Emiliania huxleyi RCC1266
无机磷浓度 CO2浓度 无机磷浓度和CO2浓度 F p F p F p 生长速率/d−1 281.76 < 0.001 218.75 < 0.001 196.08 < 0.001 叶绿素a含量/( pg·cell−1) 0.14 0.720 9.60 0.015 12.51 0.008 类胡萝卜素含量/( pg·cell−1) 12.70 0.007 6.48 0.034 17.94 0.003 类胡萝卜素与叶绿素a含量的比率 8.44 0.020 2.70 0.139 1.04 0.338 最大相对电子传递速率 29.99 < 0.001 239.26 < 0.001 157.10 < 0.001 光能利用效率 136.70 < 0.001 229.46 < 0.001 343.01 < 0.001 半饱和光强/(μmol ·m−2 ·s−1) 8.53 0.019 0.01 0.949 7.61 0.025 颗粒无机碳含量/( pg·cell−1) 42.52 < 0.001 18.26 0.003 1.53 0.251 颗粒有机碳含量/( pg·cell−1) 68.46 < 0.001 2.75 0.136 0.10 0.759 颗粒无机碳与颗粒有机碳含量的比率 12.11 0.008 16.94 0.003 1.68 0.231 注:统计学的显著性差异通过p < 0.05来表达,此处的p值是数据整体分析的结果;颗粒无机碳含量和颗粒有机碳含量以碳计。 3.3 叶绿素荧光参数
不同处理下E. huxleyi RCC1266的叶绿素荧光参数如图3和表1所示。在对照组、海洋酸化、磷限制、磷限制和海洋酸化处理下,相对电子传递速率(rETR)随着检测光强的增加而增加,在达到最大值后趋于平稳(图3A)。与对照组相比,海洋酸化对rETRmax无显著影响(p > 0.05),而磷限制使rETRmax增加了3.04%(p < 0.05),磷限制和海洋酸化的耦合效应使rETRmax显著降低了9.32%(图3B)。与对照组相比,在海洋酸化、磷限制处理下,光能利用效率(α)没有显著差异(p > 0.05),但在磷限制和海洋酸化处理下α显著下降了11.73%(p < 0.05;图3C)。与对照组相比,在海洋酸化、磷限制、磷限制和海洋酸化处理下,半饱和光强(Ik)均无显著差异(所有p > 0.05),而在海洋酸化处理下Ik随着DIP浓度的降低而增加(图3D)。这些结果表明,磷限制和海洋酸化的耦合作用降低了颗石藻的ETR和α。
 图 3 不同处理下赫氏颗石藻(Emiliania huxleyi)株系RCC1266相对电子传递速率(rETR)对检测光强的响应曲线(A)、最大相对电子传递速率 (rETRmax)(B)、光能利用效率(α)(C)和半饱和光强 (Ik)(D)不同字母表示显著性差异Figure 3. Relative electron transport rate (rETR) as a function of the assay light intensity (A), maximal relative electron transport rate (rETRmax) (B), light use efficiency (α) (C) and half-saturating light intensity (Ik) (D) of the coccolithophore Emiliania huxleyi RCC1266 under different treatmentsDifferent letters represent significant difference
3.4 细胞PIC含量、POC含量和PIC/POC比率
不同处理下E. huxleyi RCC1266细胞PIC含量、POC含量和PIC/POC比率如图4和表1所示。与对照组相比,海洋酸化使PIC含量降低了20.76%(p < 0.05);磷限制使PIC含量增加了16.61%(p < 0.05,图4A);磷限制和海洋酸化的耦合作用对PIC含量无显著影响(p > 0.05)。与对照组相比,海洋酸化没有显著影响POC含量(p > 0.05);磷限制、磷限制和海洋酸化的耦合作用使POC含量分别增加了9.07%和10.34%(p < 0.05,图4B)。对于PIC/POC比率,与对照组相比,海洋酸化使该比率显著降低了22.63%(p < 0.05,图4C),而磷限制、磷限制和海洋酸化的耦合作用没有显著影响PIC/POC比率(两种处理下,p > 0.05)。实验数据表明,磷限制与海洋酸化对PIC含量和PIC/POC比率产生了拮抗效益,即磷限制抵消了海洋酸化对细胞PIC含量和PIC/POC比率的负向效应。同时,磷限制主导增加了细胞POC含量。
 图 4 不同处理下赫氏颗石藻(Emiliania huxleyi)株系RCC1266细胞颗粒无机碳(PIC)含量(A)、颗粒有机碳(POC)含量(B)和颗粒无机碳与颗粒有机碳(PIC/POC)的比率(C)不同字母代表显著性差异Figure 4. The cellular particulate inorganic carbon (PIC) content (A), particulate organic carbon (POC) content (B) and the ratio of PIC to POC (PIC/POC) (C) of the coccolithophore Emiliania huxleyi RCC1266 under different treatmentsDifferent letters represent significant difference
4. 讨论
颗石藻作为海洋中主要的初级生产者和钙化生物之一,对海洋环境变化的响应可能对海洋碳循环产生重大影响[31]。本文报道:颗石藻的生长、光合活性、POC和PIC含量对海洋酸化的响应受无机磷浓度变化的调节。海洋酸化和无机磷浓度限制协同降低生长速率、Chl a含量、电子传递速率和光能利用效率。同时无机磷浓度限制抵消了海洋酸化对PIC含量产生的负面效应,并主导增加POC含量。这些结果有助于我们理解海洋酸化与无机磷浓度变化对颗石藻生理特征的耦合作用及其带来的生物地球化学效应。
在无机磷浓度限制条件下,赫氏颗石藻(E. huxleyi)进化出一系列适应策略来应对磷限制。例如,细胞合成更多碱性磷酸酶,降解胞内有机磷成无机磷,供其代谢和生长[32]。同时,细胞用含硫或含氮的脂质取代细胞膜上的磷脂[7],并且在长期磷限制条件下,细胞可能启动自噬作用,降解胞内受损伤的细胞器,实现细胞本身的代谢需要[33-34]。这些适应机制可以用于解释磷限制没有降低E. huxleyi的生长速率(图2A)。另一方面,少量研究报道海洋酸化降低了E. huxleyi对DIP 的亲和力,进而引起海洋酸化和磷限制的协同负向效应[35-36]。我们最近的研究结果显示在海洋酸化条件下,低pH上调了E. huxleyi细胞内一系列参与核糖体代谢基因的表达[36],促进细胞分配更多的磷来合成核糖体,这导致更少比例的磷分配到DNA的复制过程[37],进而加剧了磷限制对细胞分裂速率的抑制效应[38]。此外,Beardall等[39]提出磷限制降低浮水小球藻(Chlorella emersonii)的CO2浓缩机制(CO2 Concentrating Mechanism, CCM)效率,Rost和Riebesell[40]提出海洋酸化下调E. huxleyi的CCM效率。基于此类实验结果,我们建议:磷限制和海洋酸化协同降低E. huxleyi的CCM效率,导致细胞用于维持CCM活性的能量被节约下来,这些多余的能量也可能抑制藻细胞的生长[41]。
在磷限制处理下,颗石藻的生长速率没有显著变化,但是POC和PIC含量显著增加(图4),这暗示细胞需要更多能量来进行光合固碳和钙化作用,进而促使细胞加快ETR(图3A)。在磷限制和海洋酸化共同处理下,虽然POC含量增加,但是生长速率和ETR都下降,这暗示细胞用于生长的能量对ETR的影响更大[42]。同时在E. huxleyi其他株系、铜绿微囊藻(Microcystis aeruginosa)和伪鱼腥藻(Pseudanabaena sp.)以及中肋骨条藻(Skeletonema costatum)中也发现细胞的生长速率与rETRmax呈现正相关关系。这表明rETRmax可能对微藻的生长速率具有潜在指示作用,并可能具有预测浮游植物藻华的潜力[11, 42-43]。
在磷限制处理下,我们发现PIC含量增加,这与Zhang等[35]和Wang等[44]的研究结果一致。PIC含量增加的原因可能是磷限制显著减少了胞内RNA含量[45],导致细胞分裂间期延长,而钙化作用发生在细胞间期的G1期,更长的钙化时间导致PIC含量显著增加[46]。尽管本研究没有测定细胞体积,但相关研究表明,在磷限制条件下颗石藻的细胞体积增大[47],这可能也是PIC和POC含量增多的原因之一。然而也有一些其他颗石藻的研究表明,Calcidiscus leptoporus和Coccolithus pelagicus的钙化速率对磷限制不敏感[48-49]。这些研究结果说明不同颗石藻种属对无机磷浓度变化的响应特征不一致。海洋酸化降低PIC含量的分子机制可能与质子(H+)转运蛋白、钙离子信号转导和转运蛋白受损有关[50]。同样,不同颗石藻种属对海洋酸化的响应也有差异,甚至同种颗石藻的不同株系对海洋酸化的响应也存在区别[51]。例如,当CO2分压从400 µatm增加到1 000 µatm时,颗石粒为A型的E. huxleyi RCC1266细胞PIC含量显著下降;然而,颗石粒为R型的E. huxleyi AC472细胞PIC含量略有上升[52]。我们的实验结果显示,低浓度无机磷补偿了海洋酸化对钙化速率的抑制作用,同时也暗示气候变化下,颗石藻钙化速率对海洋酸化的响应特征更加难以预测。
我们的实验结果与Matthiessen等[53]的结果一致,即磷限制主导增加细胞的POC含量,其原因之一可能是磷限制增加了颗石藻细胞体积[7]。在我们的结果中,一个值得关注的现象是在磷限制条件下,藻细胞的生长速率没有显著变化(图2A),此时,体积更大的细胞需要吸收更多的营养物质来维持生长。这暗示在磷限制条件下研究颗石藻对无机氮和无机磷的吸收速率及其机制应该受到关注[38, 53]。此外,无机磷浓度限制很可能诱导颗石藻启动或者增强C4固碳途径[44],进而增加光合固碳量。另一方面,海洋酸化对POC含量没有产生显著正向效应,这暗示不同颗石藻株系的光合固碳作用响应海洋酸化的敏感性不同[51]。
在未来无机磷浓度更加缺乏的大洋,颗石藻钙化作用的增强可能在一定程度上促进POC向深海的有效输送[54]。同时在寡营养盐海域,未来高浓度CO2可能降低颗石藻的生长优势。虽然PIC/POC比率在海洋酸化条件下显著下降,但是在磷限制和海洋酸化的共同作用下没有显著变化,这暗示在气候变化下,颗石藻对海洋生物碳泵的影响变得更加复杂[55]。在未来气候变化条件下,这些研究结果也为预测颗石藻对海洋碳循环的贡献提供理论依据。
-
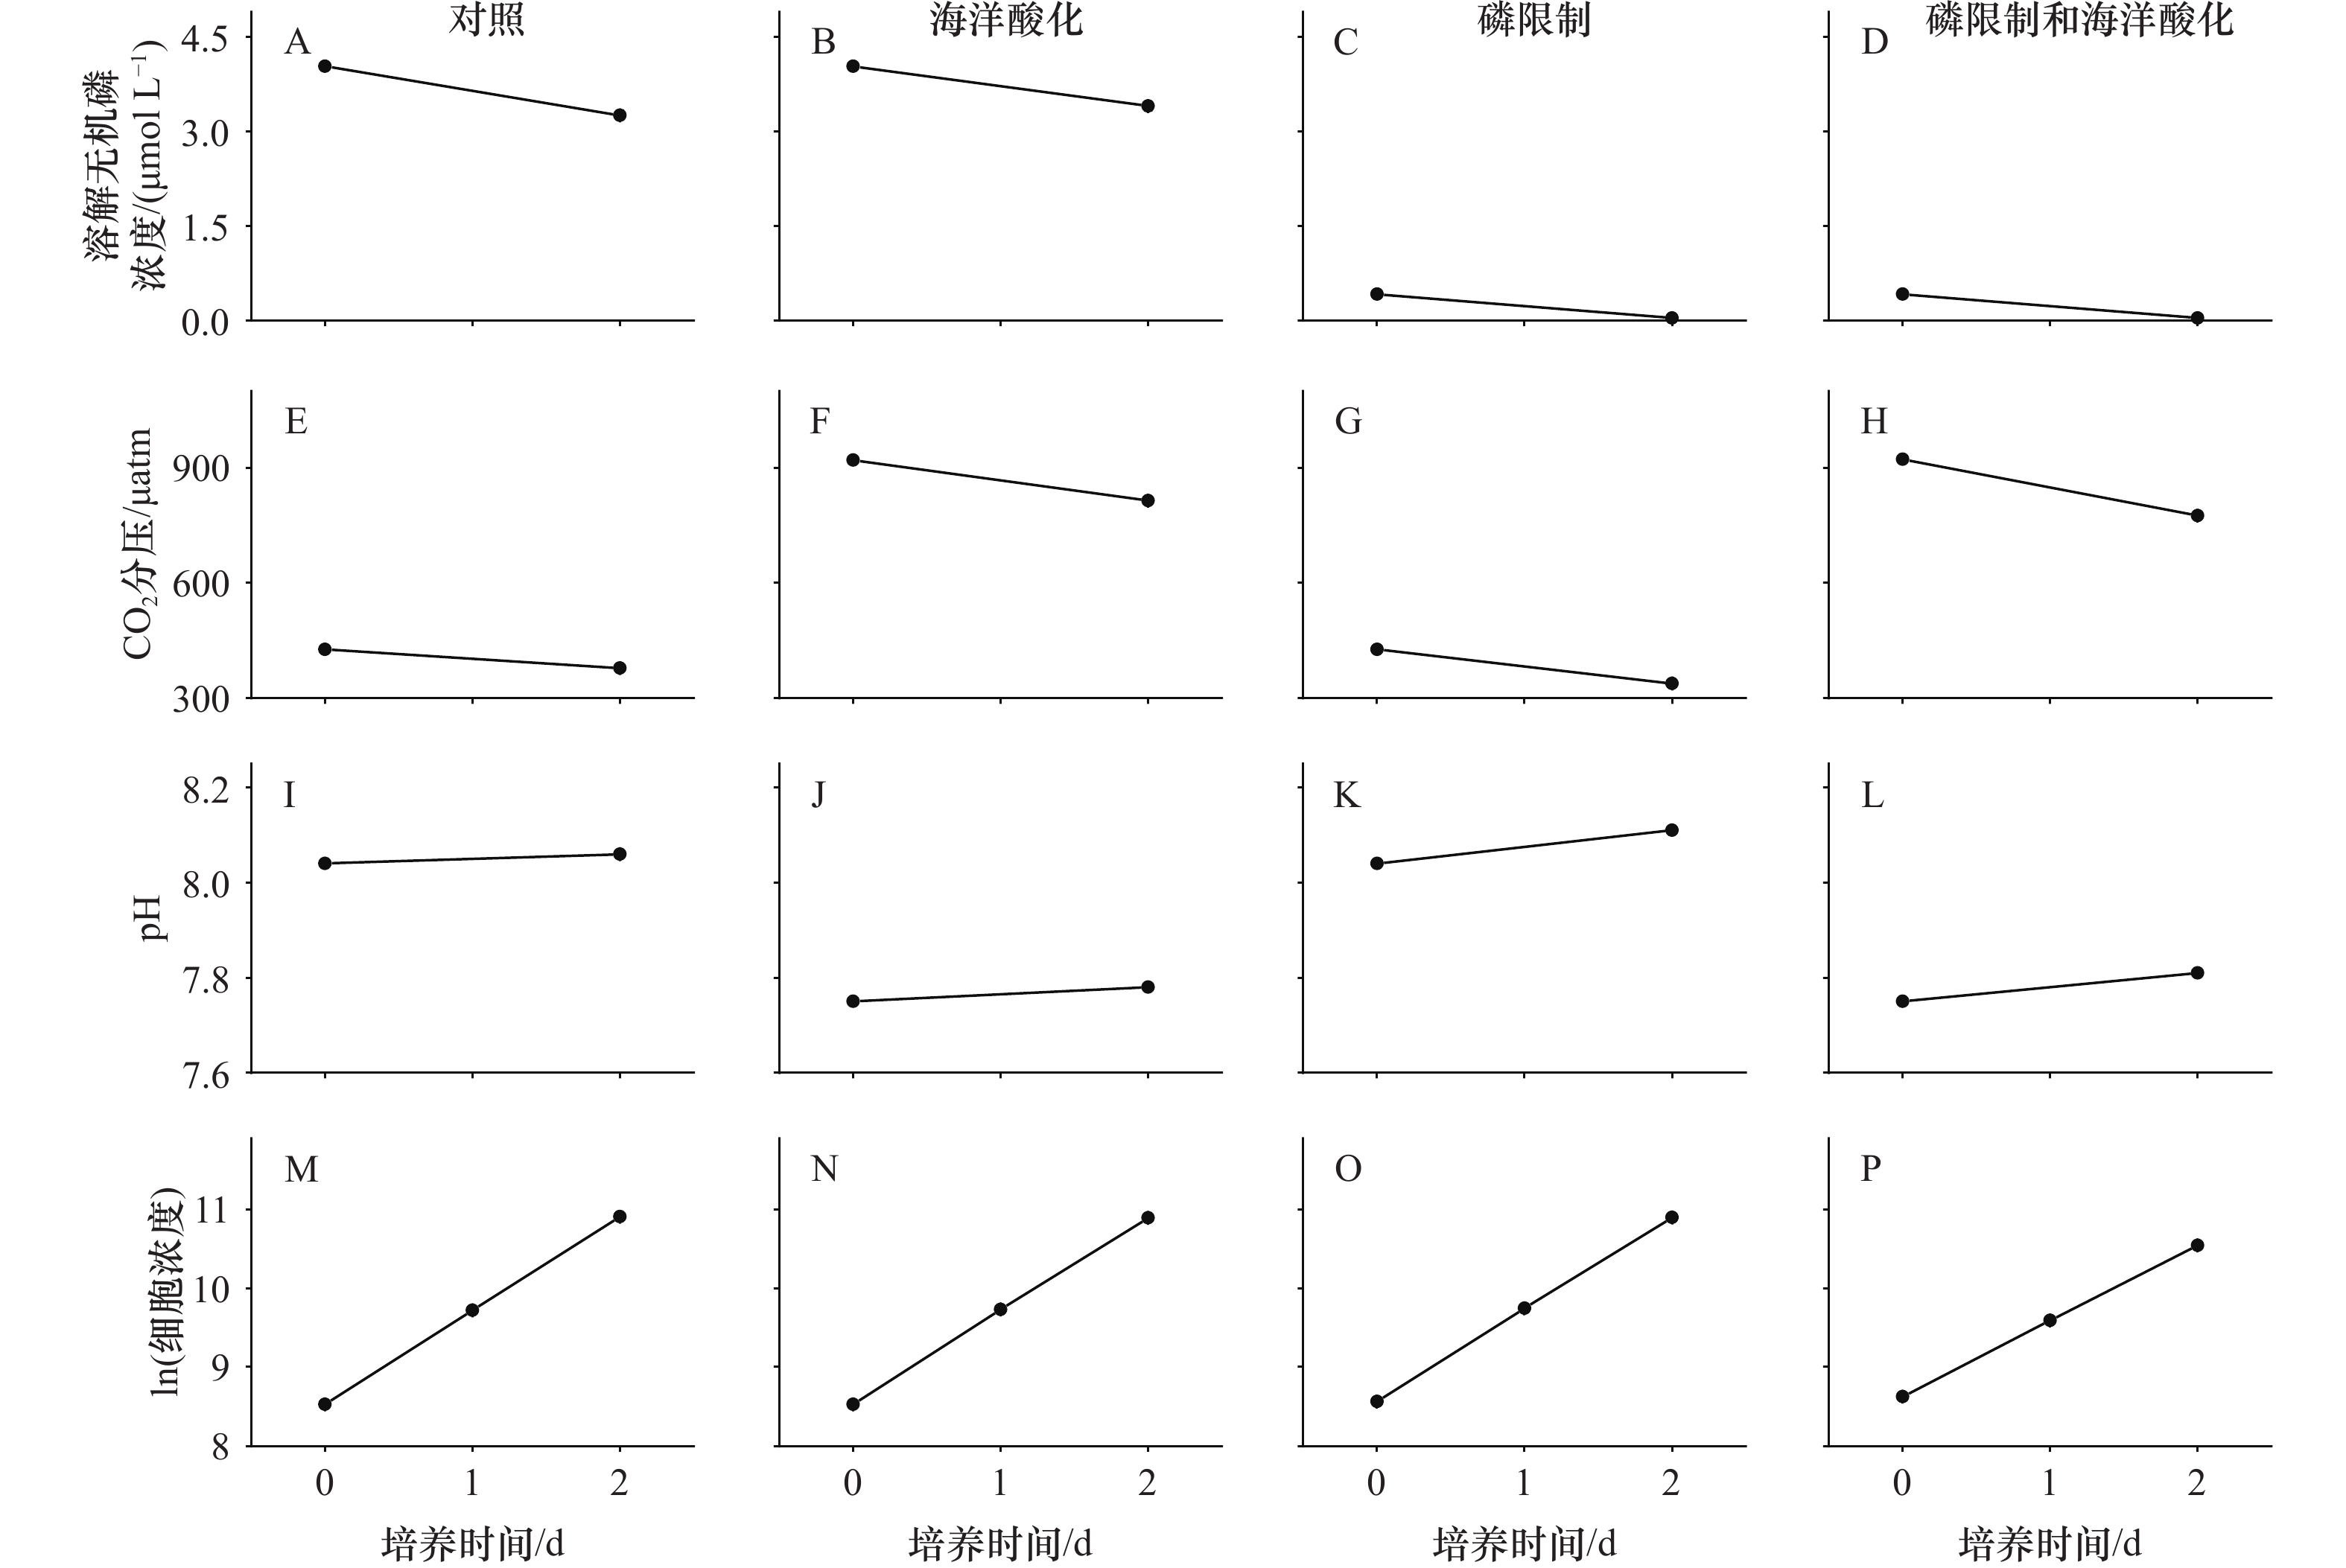
图 1 不同处理下,在培养开始和结束时,培养基中溶解无机磷(DIP)浓度(A−D)、CO2分压(E−H)、pH(I−L)和细胞浓度(单位:cell/mL)的自然对数(M−P)
Fig. 1 Dissolved inorganic phosphorus (DIP) concentration (A−D), pCO2 level (E−H), pH (I−L) and logarithm of cell concentration (unit: cell/mL) (M−P) at the beginning and end of the cultures under different treatments
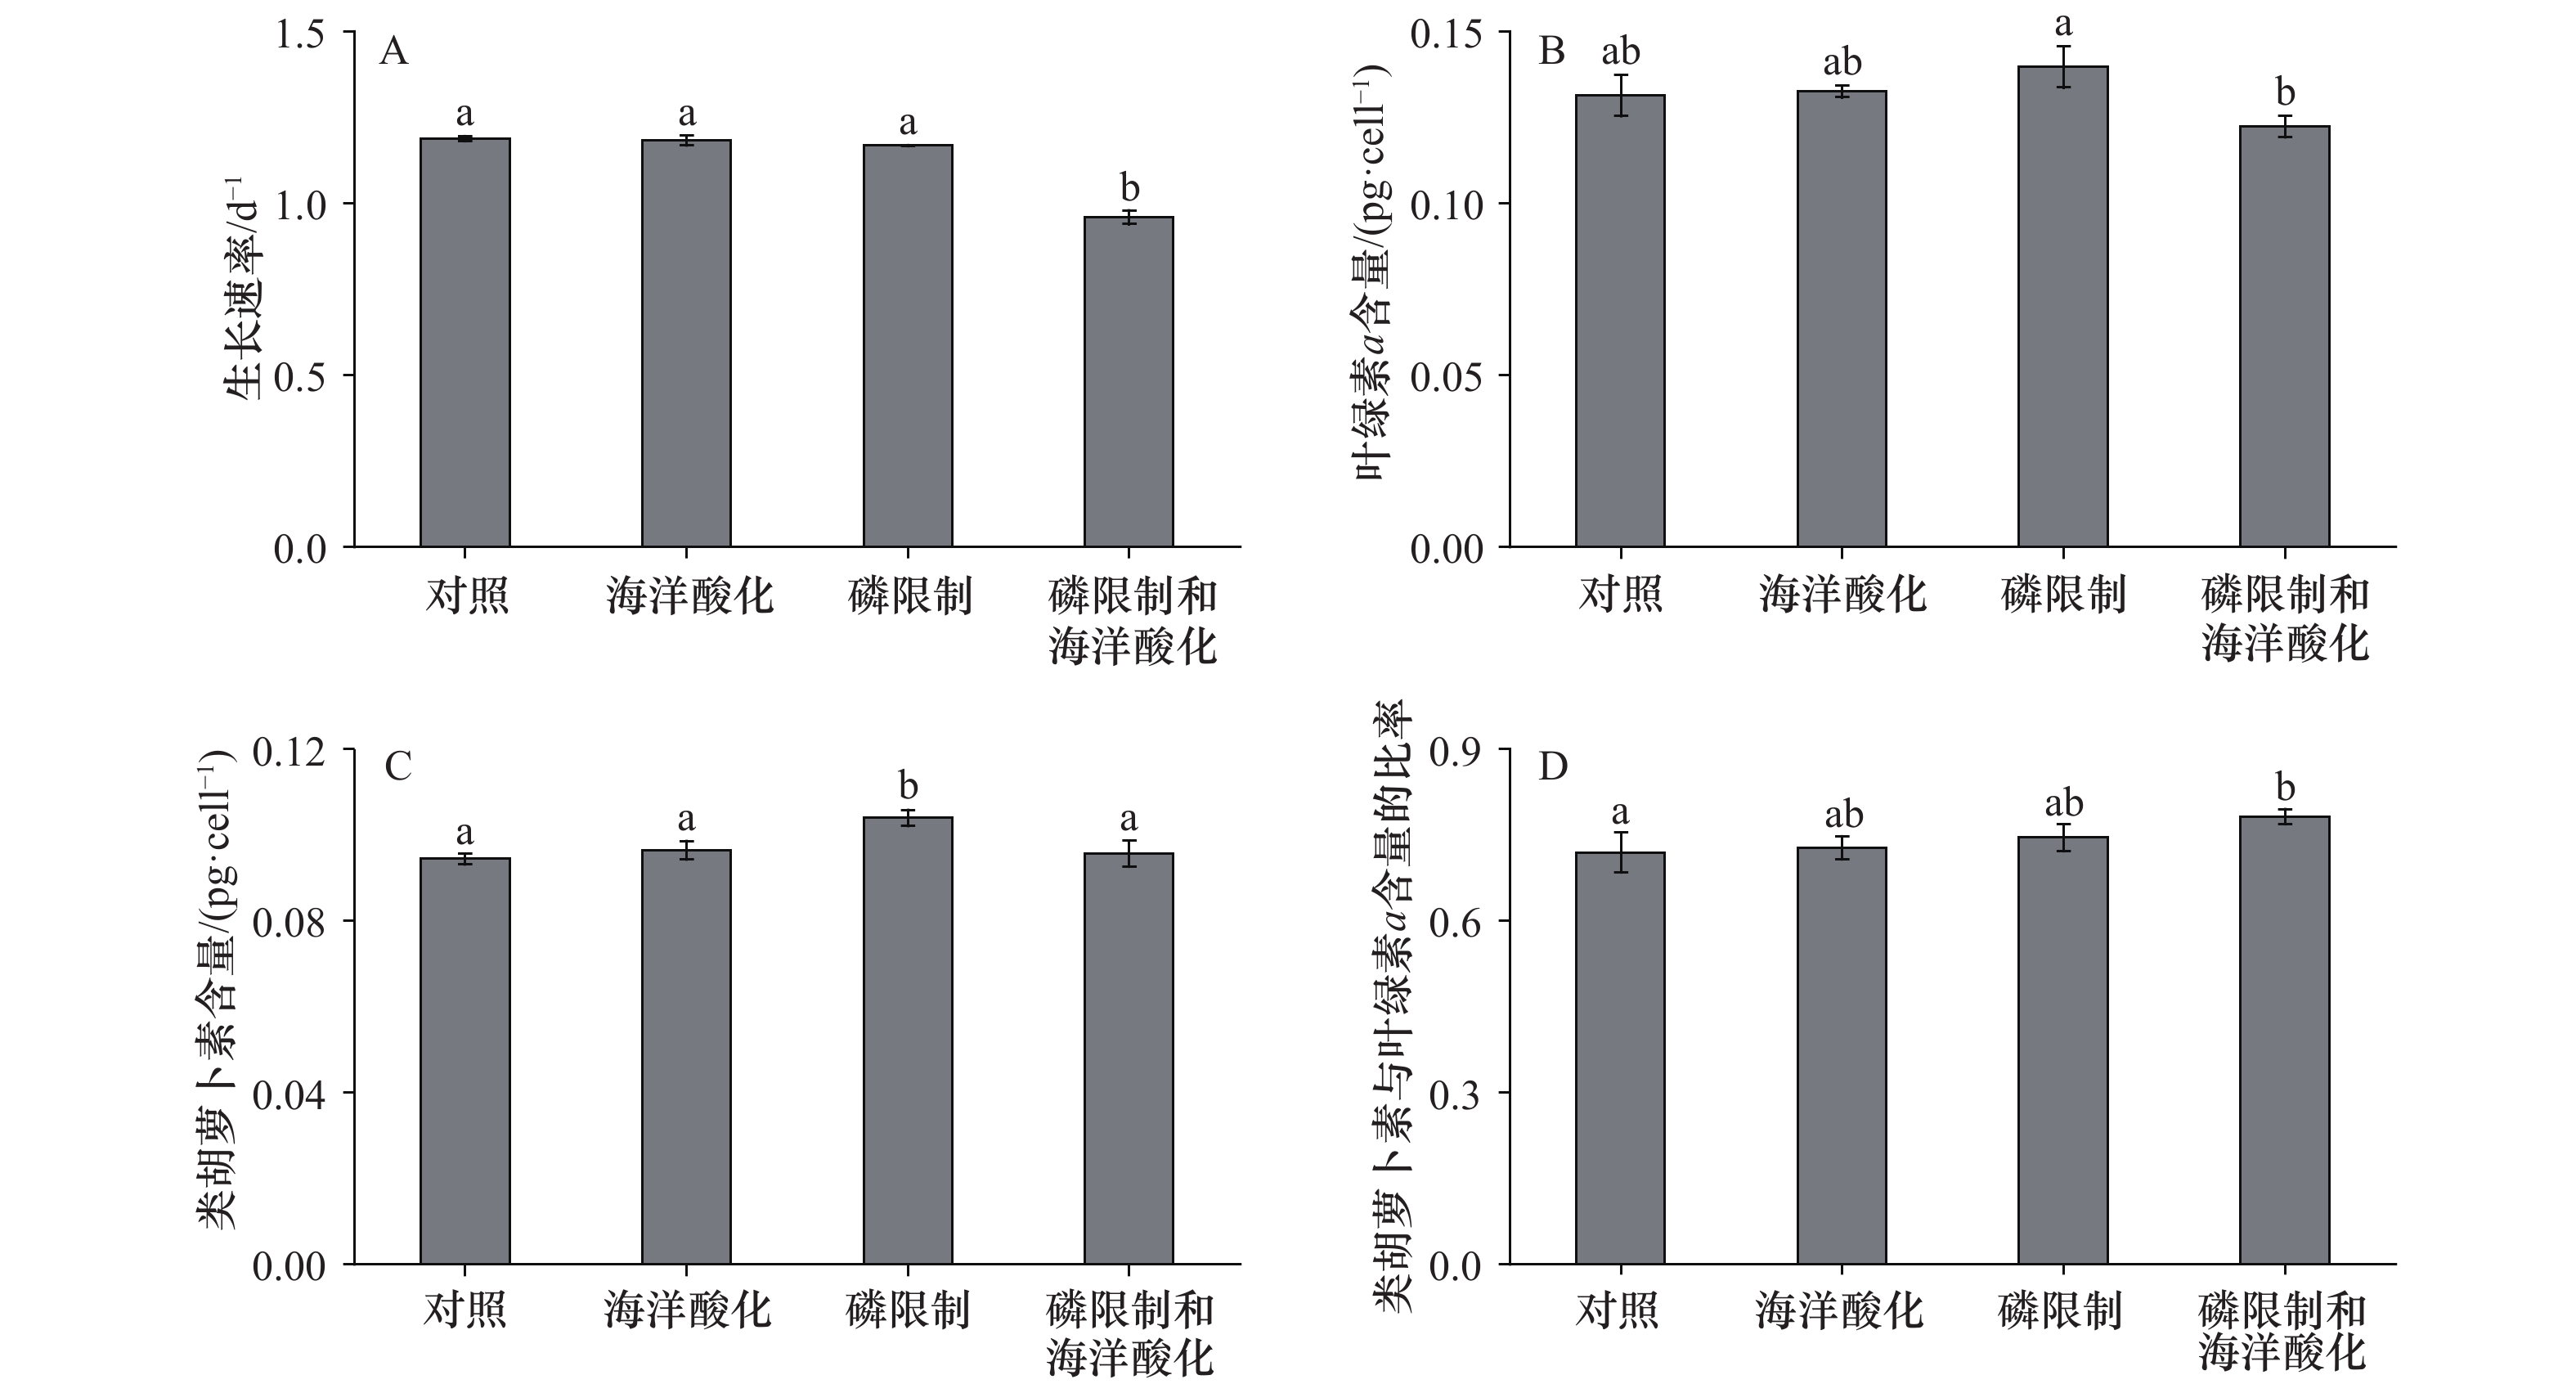
图 2 不同处理下赫氏颗石藻(Emiliania huxleyi)株系RCC1266的生长速率(A)、叶绿素a含量(B)、类胡萝卜素含量(C)及类胡萝卜素与叶绿素a含量的比率(D)
不同字母代表显著性差异
Fig. 2 Growth rate (A), chlorophyll a content (B), carotenoid content (C) and the ratio of carotenoid content to chlorophyll a content (D) of the coccolithophore Emiliania huxleyi RCC1266 under different treatments
Different letters represent significant difference
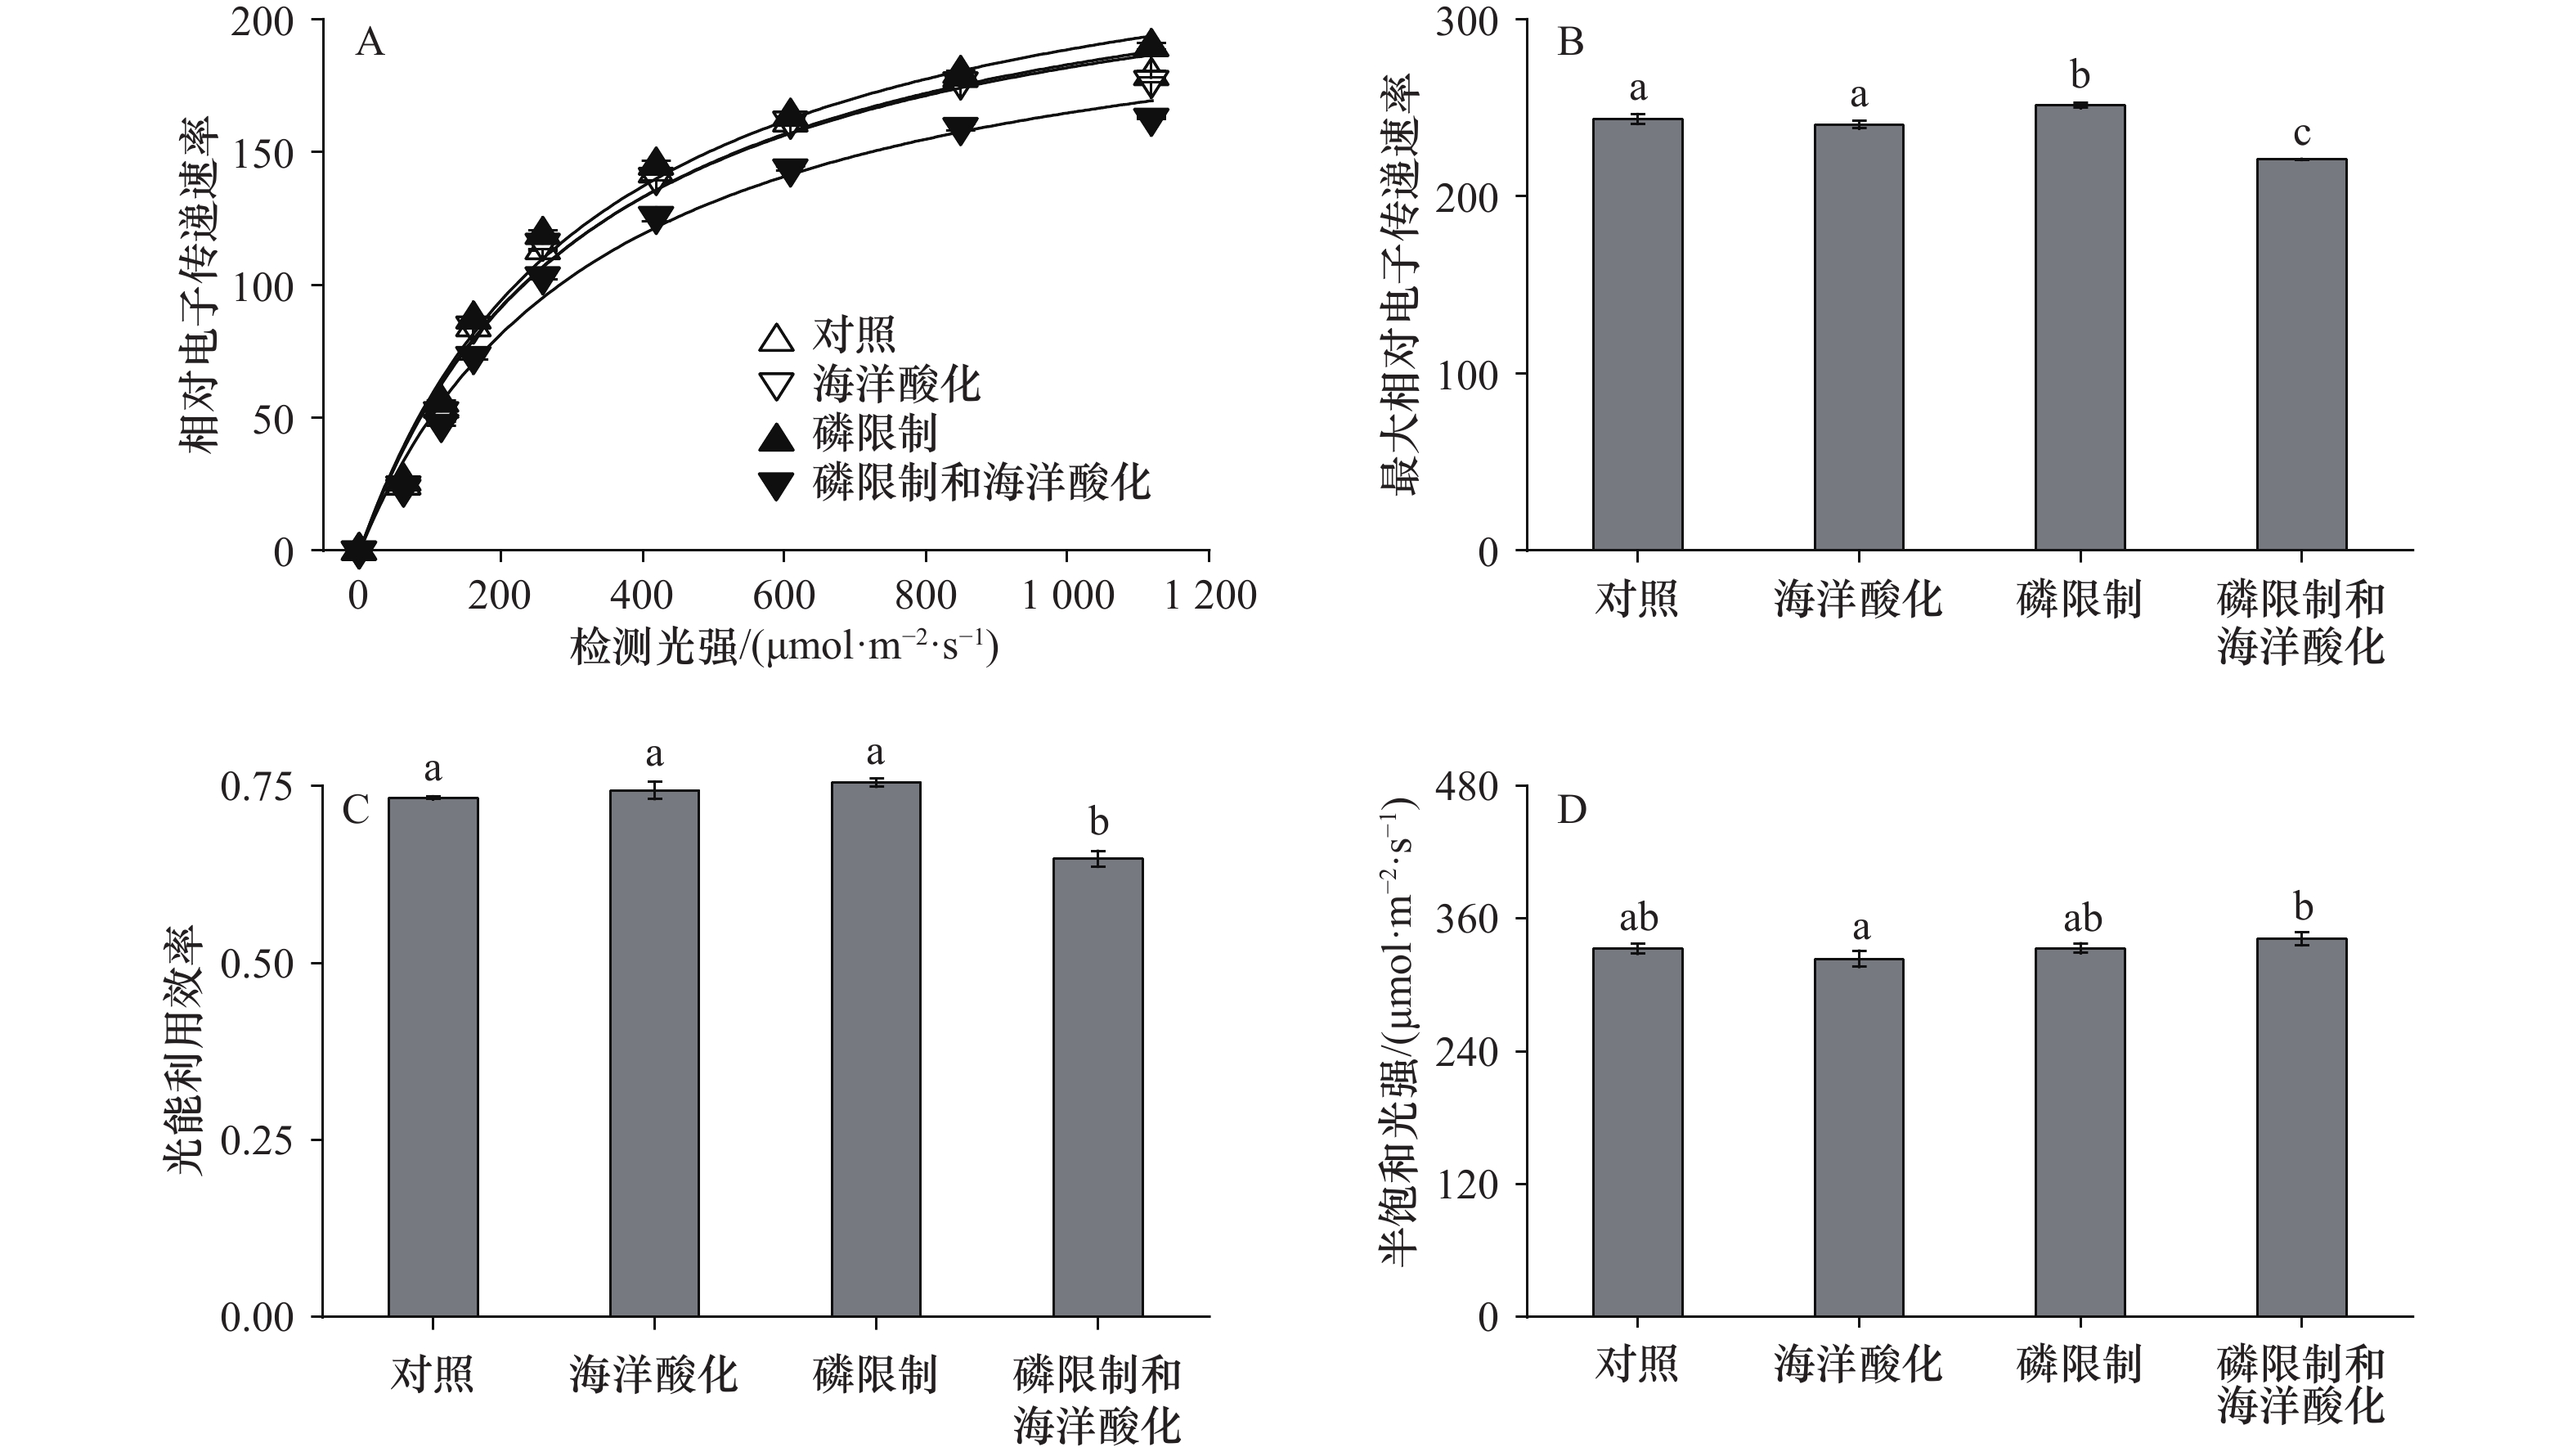
图 3 不同处理下赫氏颗石藻(Emiliania huxleyi)株系RCC1266相对电子传递速率(rETR)对检测光强的响应曲线(A)、最大相对电子传递速率 (rETRmax)(B)、光能利用效率(α)(C)和半饱和光强 (Ik)(D)
不同字母表示显著性差异
Fig. 3 Relative electron transport rate (rETR) as a function of the assay light intensity (A), maximal relative electron transport rate (rETRmax) (B), light use efficiency (α) (C) and half-saturating light intensity (Ik) (D) of the coccolithophore Emiliania huxleyi RCC1266 under different treatments
Different letters represent significant difference
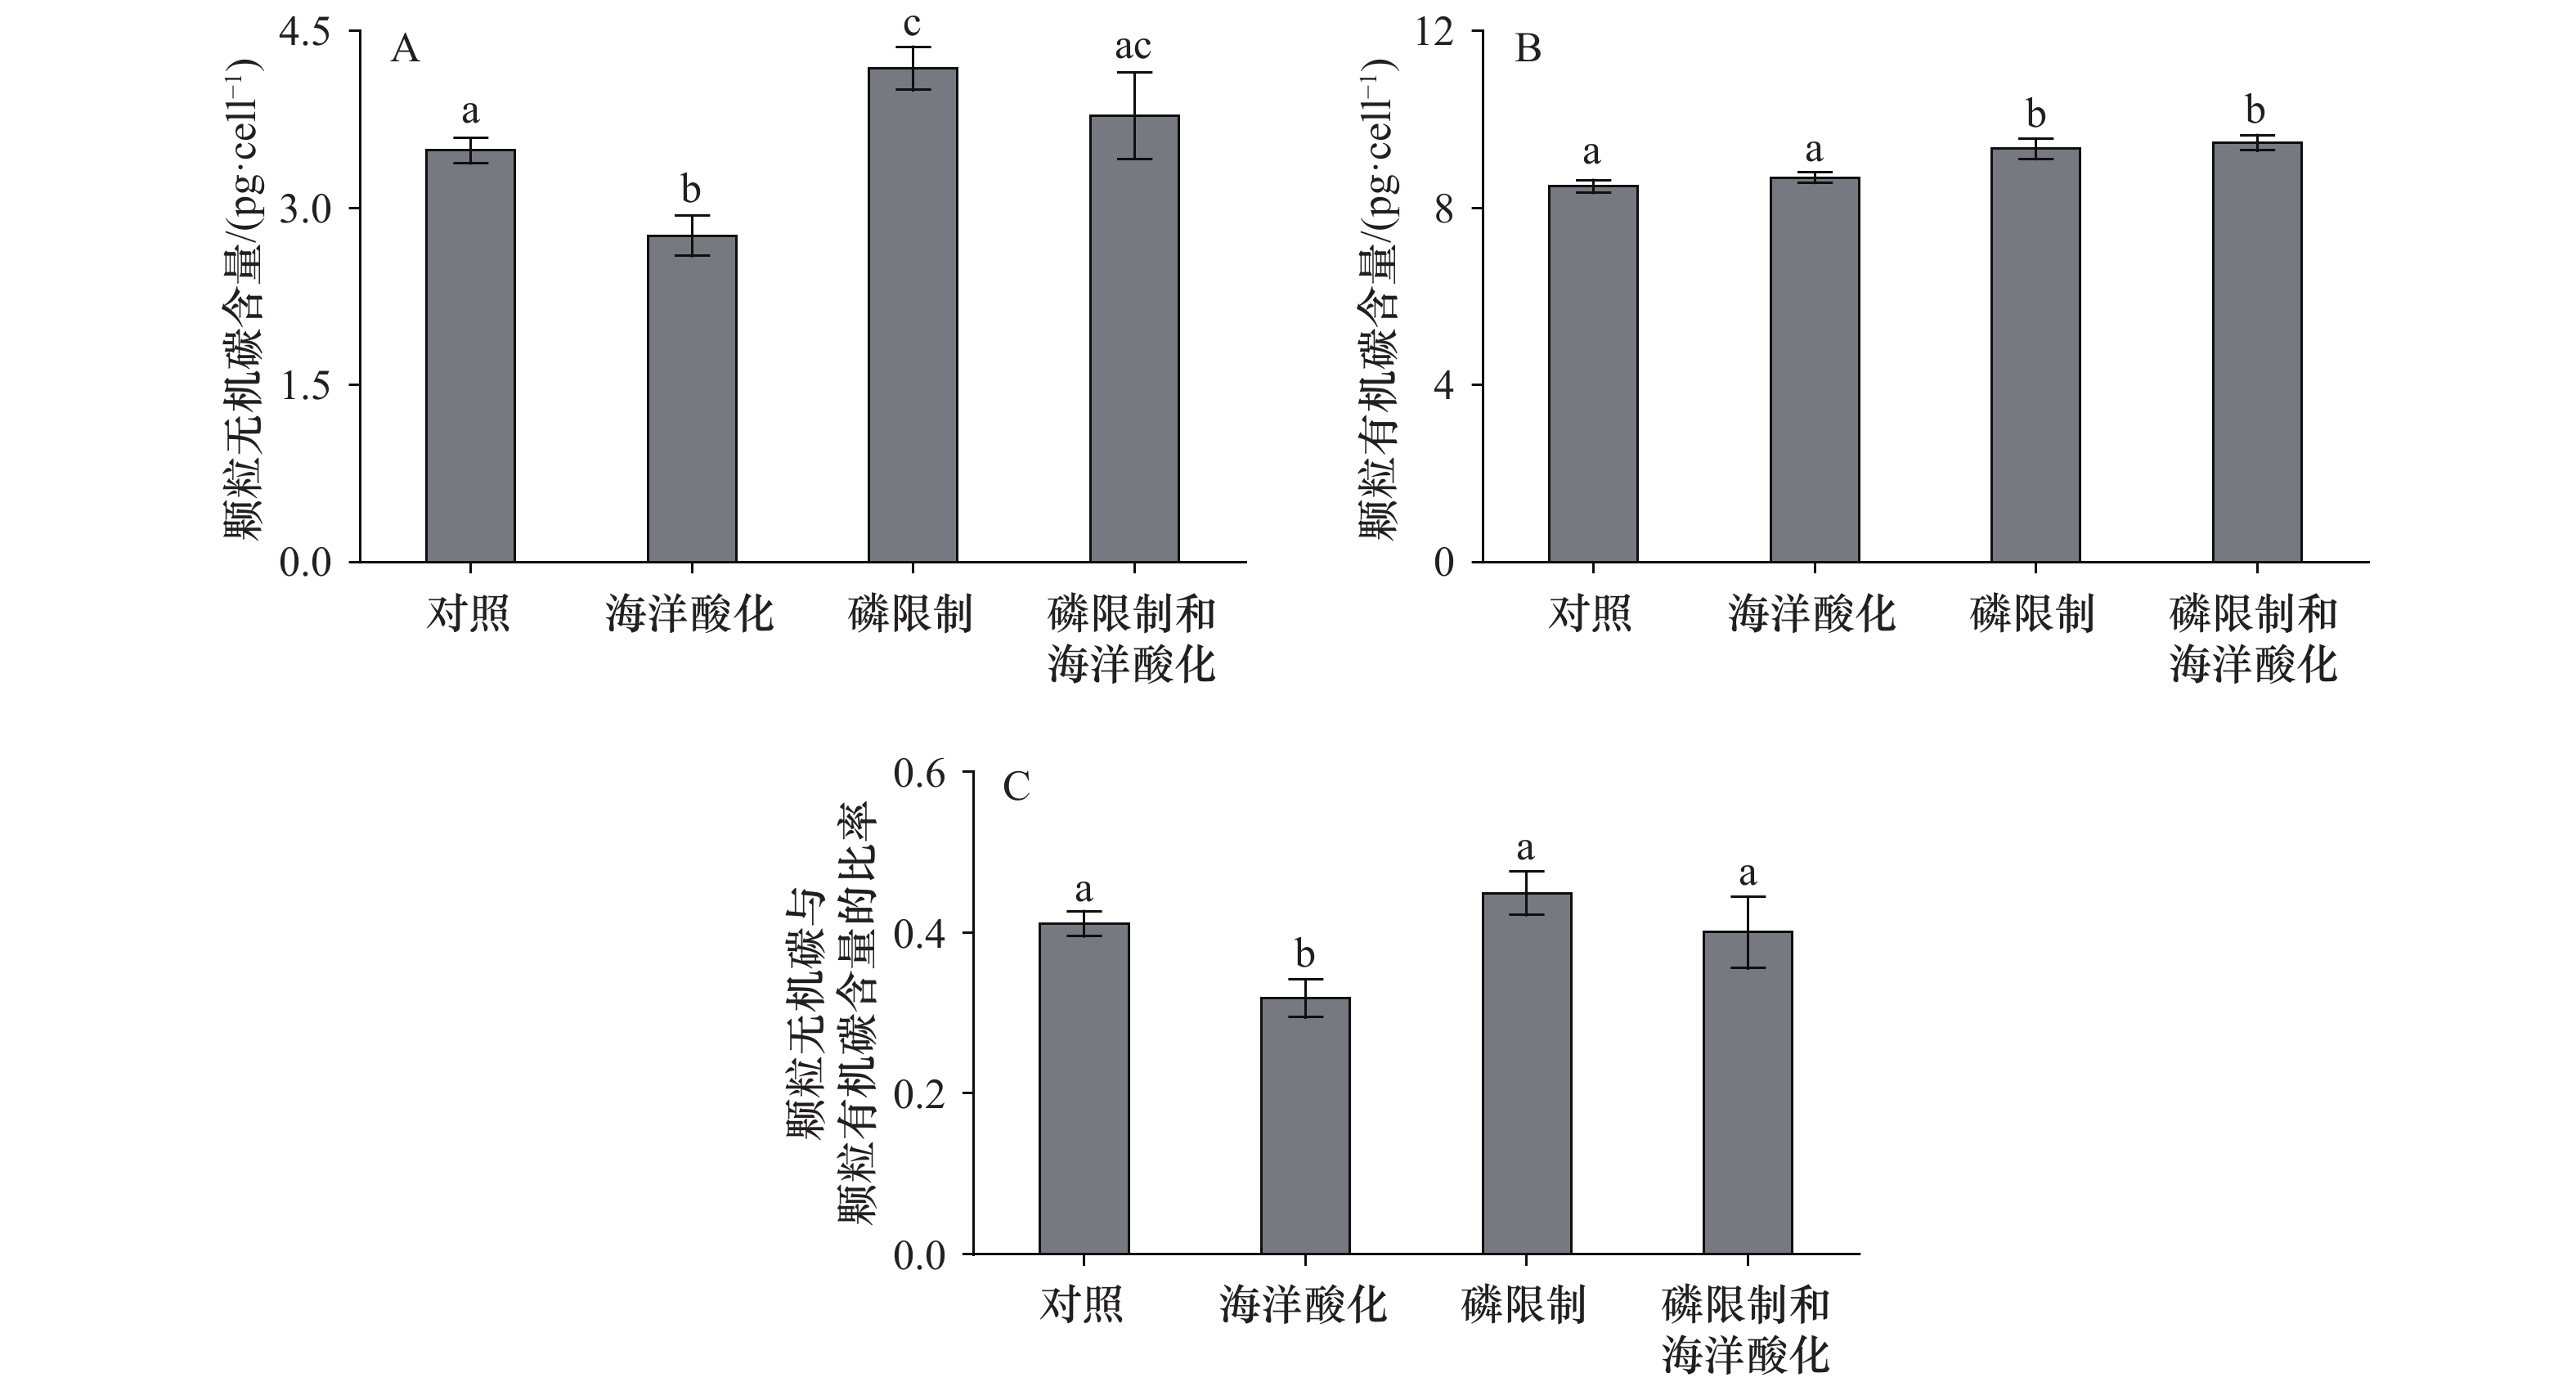
图 4 不同处理下赫氏颗石藻(Emiliania huxleyi)株系RCC1266细胞颗粒无机碳(PIC)含量(A)、颗粒有机碳(POC)含量(B)和颗粒无机碳与颗粒有机碳(PIC/POC)的比率(C)
不同字母代表显著性差异
Fig. 4 The cellular particulate inorganic carbon (PIC) content (A), particulate organic carbon (POC) content (B) and the ratio of PIC to POC (PIC/POC) (C) of the coccolithophore Emiliania huxleyi RCC1266 under different treatments
Different letters represent significant difference
表 1 二元方差分析获得无机磷浓度和CO2浓度及其相互作用对赫氏颗石藻(Emiliania huxleyi)株系RCC1266的生长速率、色素含量、荧光参数、细胞元素含量及其比率影响的统计结果
Tab. 1 Results of two-way ANOVA of the effects of inorganic phosphorus concentration and CO2 concentration and their interactions on growth rate, pigment content, fluorescence parameters, cellular elements content and their ratios of the coccolithophore Emiliania huxleyi RCC1266
无机磷浓度 CO2浓度 无机磷浓度和CO2浓度 F p F p F p 生长速率/d−1 281.76 < 0.001 218.75 < 0.001 196.08 < 0.001 叶绿素a含量/( pg·cell−1) 0.14 0.720 9.60 0.015 12.51 0.008 类胡萝卜素含量/( pg·cell−1) 12.70 0.007 6.48 0.034 17.94 0.003 类胡萝卜素与叶绿素a含量的比率 8.44 0.020 2.70 0.139 1.04 0.338 最大相对电子传递速率 29.99 < 0.001 239.26 < 0.001 157.10 < 0.001 光能利用效率 136.70 < 0.001 229.46 < 0.001 343.01 < 0.001 半饱和光强/(μmol ·m−2 ·s−1) 8.53 0.019 0.01 0.949 7.61 0.025 颗粒无机碳含量/( pg·cell−1) 42.52 < 0.001 18.26 0.003 1.53 0.251 颗粒有机碳含量/( pg·cell−1) 68.46 < 0.001 2.75 0.136 0.10 0.759 颗粒无机碳与颗粒有机碳含量的比率 12.11 0.008 16.94 0.003 1.68 0.231 注:统计学的显著性差异通过p < 0.05来表达,此处的p值是数据整体分析的结果;颗粒无机碳含量和颗粒有机碳含量以碳计。  下载: 导出CSV
-
[1] Friedlingstein P, Cox P, Betts R, et al. Climate-carbon cycle feedback analysis: results from the C4MIP model intercomparison[J]. Journal of Climate, 2006, 19(14): 3337−3353. doi: 10.1175/JCLI3800.1 [2] Sabine C L, Feely R A, Gruber N, et al. The oceanic sink for anthropogenic CO2[J]. Science, 2004, 305(5682): 367−371. doi: 10.1126/science.1097403 [3] Doney S C. Plankton in a warmer world[J]. Nature, 2006, 444(7120): 695−696. doi: 10.1038/444695a [4] Thingstad T F, Krom M D, Mantoura R F C, et al. Nature of phosphorus limitation in the ultraoligotrophic eastern Mediterranean[J]. Science, 2005, 309(5737): 1068−1071. doi: 10.1126/science.1112632 [5] Vidal M, Duarte C M, Agustí S, et al. Alkaline phosphatase activities in the central Atlantic Ocean indicate large areas with phosphorus deficiency[J]. Marine Ecology Progress Series, 2003, 262: 43−53. doi: 10.3354/meps262043 [6] Krom M D, Kress N, Brenner S, et al. Phosphorus limitation of primary productivity in the eastern Mediterranean Sea[J]. Limnology and Oceanography, 1991, 36(3): 424−432. doi: 10.4319/lo.1991.36.3.0424 [7] Shemi A, Schatz D, Fredricks H F, et al. Phosphorus starvation induces membrane remodeling and recycling in Emiliania huxleyi[J]. New Phytologist, 2016, 211(3): 886−898. doi: 10.1111/nph.13940 [8] Meyer J, Riebesell U. Reviews and syntheses: responses of coccolithophores to ocean acidification: a meta-analysis[J]. Biogeosciences, 2015, 12(6): 1671−1682. doi: 10.5194/bg-12-1671-2015 [9] 孙军. 今生颗石藻的有机碳泵和碳酸盐反向泵[J]. 地球科学进展, 2007, 22(12): 1231−1239. doi: 10.3321/j.issn:1001-8166.2007.12.003Sun Jun. Organic carbon pump and carbonate counter pump of living coccolithophorid[J]. Advances in Earth Science, 2007, 22(12): 1231−1239. doi: 10.3321/j.issn:1001-8166.2007.12.003 [10] Balch W M, Holligan P M, Kilpatrick K A. Calcification, photosynthesis and growth of the bloom-forming coccolithophore, Emiliania huxleyi[J]. Continental Shelf Research, 1992, 12(12): 1353−1374. doi: 10.1016/0278-4343(92)90059-S [11] Xie Emei, Xu Kui, Li Zhengke, et al. Disentangling the effects of ocean carbonation and acidification on elemental contents and macromolecules of the coccolithophore Emiliania huxleyi[J]. Frontiers in Microbiology, 2021, 12: 737454. doi: 10.3389/fmicb.2021.737454 [12] Riebesell U, Zondervan I, Rost B, et al. Reduced calcification of marine plankton in response to increased atmospheric CO2[J]. Nature, 2000, 407(6802): 364−367. doi: 10.1038/35030078 [13] 廖晏, 冯媛媛, 刘瑶, 等. 氮限制和海洋酸化对颗石藻Emiliania huxleyi NIWA1108生理指标的交互影响[J]. 天津科技大学学报, 2019, 34(4): 56−62.Liao Yan, Feng Yuanyuan, Liu Yao, et al. Interactive effects of nitrogen limitation and ocean acidification on the physiology of coccolithophore Emiliania huxleyi NIWA1108[J]. Journal of Tianjin University of Science & Technology, 2019, 34(4): 56−62. [14] Duff S M G, Sarath G, Plaxton W C. The role of acid phosphatases in plant phosphorus metabolism[J]. Physiologia Plantarum, 1994, 90(4): 791−800. doi: 10.1111/j.1399-3054.1994.tb02539.x [15] Vagabov V M, Trilisenko L V, Kulaev I S. Dependence of inorganic polyphosphate chain length on the orthophosphate content in the culture medium of the yeast Saccharomyces cerevisiae[J]. Biochemistry, 2000, 65(3): 349−354. [16] Tyrrell T, Taylor A H. A modelling study of Emiliania huxleyi in the NE Atlantic[J]. Journal of Marine Systems, 1996, 9(1/2): 83−112. [17] Riegman R, Stolte W, Noordeloos A A M, et al. Nutrient uptake and alkaline phosphatase (ec 3: 1: 3: 1) activity of Emiliania huxleyi (PRYMNESIOPHYCEAE) during growth under n and p limitation in continuous cultures[J]. Journal of Phycology, 2000, 36(1): 87−96. doi: 10.1046/j.1529-8817.2000.99023.x [18] Oviedo A M, Langer G, Ziveri P. Effect of phosphorus limitation on coccolith morphology and element ratios in Mediterranean strains of the coccolithophore Emiliania huxleyi[J]. Journal of Experimental Marine Biology and Ecology, 2014, 459: 105−113. doi: 10.1016/j.jembe.2014.04.021 [19] Berges J A, Franklin D J, Harrison P J. Evolution of an artificial seawater medium: improvements in enriched seawater, artificial water over the last two decades[J]. Journal of Phycology, 2001, 37(6): 1138−1145. doi: 10.1046/j.1529-8817.2001.01052.x [20] Guillard R R L, Ryther J H. Studies of marine planktonic diatoms: I. Cyclotella nana Hustedt, and Detonula confervacea (Cleve) Gran[J]. Canadian Journal of Microbiology, 1962, 8(2): 229−239. doi: 10.1139/m62-029 [21] Hansen H P, Koroleff F. Determination of nutrients[M]//Grasshoff K, Kremling K, Ehrhardt M. Methods of Seawater Analysis. 3rd ed. New York: Wiley-VCH, 1999: 159−228. [22] Zhang Yong, Li Zhengke, Schulz K G, et al. Growth-dependent changes in elemental stoichiometry and macromolecular allocation in the coccolithophore Emiliania huxleyi under different environmental conditions[J]. Limnology and Oceanography, 2021, 66(8): 2999−3009. doi: 10.1002/lno.11854 [23] Dickson A G, Afghan J D, Anderson G C. Reference materials for oceanic CO2 analysis: a method for the certification of total alkalinity[J]. Marine Chemistry, 2003, 80(2/3): 185−197. [24] Pierrot D E, Lewis E, Wallace D W R. MS Excel program developed for CO2 system calculations[R]. ORNL/CDIAC-105a. Oak Ridge, Tennessee: Carbon Dioxide Information Analysis Center, Oak Ridge National Laboratory, U. S. Department of Energy, 2006. [25] Roy R N, Roy L N, Lawson M, et al. Thermodynamics of the dissociation of boric acid in seawater at S=35 from 0 to 55℃[J]. Marine Chemistry, 1993, 44(2/4): 243−248. [26] Jeffrey S W, Humphrey G F. New spectrophotometric equations for determining chlorophylls a, b, c1 and c2 in higher plants, algae and natural phytoplankton[J]. Biochemie und Physiologie der Pflanzen, 1975, 167(2): 191−194. doi: 10.1016/S0015-3796(17)30778-3 [27] Davies B H. Carotenoids[M]//Goodwin T W. Chemistry and Biochemistry of Plant Pigments. London: Academic Press, 1976: 38−165. [28] Baker N R. Chlorophyll fluorescence: a probe of photosynthesis in vivo[J]. Annual Review of Plant Biology, 2008, 59: 89−113. doi: 10.1146/annurev.arplant.59.032607.092759 [29] Ralph P J, Gademann R. Rapid light curves: a powerful tool to assess photosynthetic activity[J]. Aquatic Botany, 2005, 82(3): 222−237. doi: 10.1016/j.aquabot.2005.02.006 [30] 高坤山. 藻类固碳——理论、进展与方法[M]. 北京: 科学出版社, 2014.Gao Kunshan. Algal Carbon Fixation: Basis, Advances and Methods[M]. Beijing: Science Press, 2014. [31] Smith H E K, Tyrrell T, Charalampopoulou A, et al. Predominance of heavily calcified coccolithophores at low CaCO3 saturation during winter in the Bay of Biscay[J]. Proceedings of the National Academy of Sciences of the United States of America, 2012, 109(23): 8845−8849. [32] Wang Cong, Sun Xueqiong, Wang Jingtian, et al. Physiological and metabolic effects of glyphosate as the sole P source on a cosmopolitan phytoplankter and biogeochemical implications[J]. Science of the Total Environment, 2022, 832: 155094. doi: 10.1016/j.scitotenv.2022.155094 [33] Fader C M, Colombo M I. Autophagy and multivesicular bodies: two closely related partners[J]. Cell Death & Differentiation, 2009, 16(1): 70−78. [34] Müller M, Schmidt O, Angelova M, et al. The coordinated action of the MVB pathway and autophagy ensures cell survival during starvation[J]. eLife, 2015, 4: e07736. doi: 10.7554/eLife.07736 [35] Zhang Yong, Collins S, Gao Kunshan. Reduced growth with increased quotas of particulate organic and inorganic carbon in the coccolithophore Emiliania huxleyi under future ocean climate change conditions[J]. Biogeosciences, 2020, 17(24): 6357−6375. doi: 10.5194/bg-17-6357-2020 [36] Zhang Yong, Zhang Yong, Ma Shuai, et al. Reallocation of elemental content and macromolecules in the coccolithophore Emiliania huxleyi to acclimate to climate change[J]. Biogeosciences, 2023, 20(7): 1299−1312. doi: 10.5194/bg-20-1299-2023 [37] Rokitta S D, de Nooijer L J, Trimborn S, et al. Transcriptome analyses reveal differential gene expression patterns between the life-cycle stages of Emiliania huxleyi (Haptophyta) and reflect specialization to different ecological niches[J]. Journal of Phycology, 2011, 47(4): 829−838. doi: 10.1111/j.1529-8817.2011.01014.x [38] Rouco M, Branson O, Lebrato M, et al. The effect of nitrate and phosphate availability on Emiliania huxleyi (NZEH) physiology under different CO2 scenarios[J]. Frontiers in Microbiology, 2013, 4: 155. [39] Beardall J, Roberts S, Raven J A. Regulation of inorganic carbon acquisition by phosphorus limitation in the green alga Chlorella emersonii[J]. Canadian Journal of Botany, 2005, 83(7): 859−864. doi: 10.1139/b05-070 [40] Rost B, Riebesell U. Coccolithophores and the biological pump: responses to environmental changes[M]//Thierstein H R, Young J R. Coccolithophores: From Molecular Processes to Global Impact. Berlin, Heidelberg: Springer, 2004: 99−125. [41] Jin Peng, Ding Jiancheng, Xing Tao, et al. High levels of solar radiation offset impacts of ocean acidification on calcifying and non-calcifying strains of Emiliania huxleyi[J]. Marine Ecology Progress Series, 2017, 568: 47−58. doi: 10.3354/meps12042 [42] Li Zhengke, Dai Guozheng, Zhang Yong, et al. Photosynthetic adaptation to light availability shapes the ecological success of bloom-forming cyanobacterium Pseudanabaena to iron limitation[J]. Journal of Phycology, 2020, 56(6): 1457−1467. doi: 10.1111/jpy.13040 [43] Li Hangxiao, Xu Tianpeng, Ma Jing, et al. Physiological responses of Skeletonema costatum to the interactions of seawater acidification and the combination of photoperiod and temperature[J]. Biogeosciences, 2021, 18(4): 1439−1449. doi: 10.5194/bg-18-1439-2021 [44] Wang Cong, Wang Jingtian, Li Ling, et al. P-limitation promotes carbon accumulation and sinking of Emiliania huxleyi through transcriptomic reprogramming[J]. Frontiers in Marine Science, 2022, 9: 860222. doi: 10.3389/fmars.2022.860222 [45] Wördenweber R, Rokitta S D, Heidenreich E, et al. Phosphorus and nitrogen starvation reveal life-cycle specific responses in the metabolome of Emiliania huxleyi (Haptophyta)[J]. Limnology and Oceanography, 2018, 63(1): 203−226. doi: 10.1002/lno.10624 [46] Müller M N, Antia A N, LaRoche J. Influence of cell cycle phase on calcification in the coccolithophore Emiliania huxleyi[J]. Limnology and Oceanography, 2008, 53(2): 506−512. doi: 10.4319/lo.2008.53.2.0506 [47] Zhang Yong, Fu Feixue, Hutchins D A, et al. Combined effects of CO2 level, light intensity, and nutrient availability on the coccolithophore Emiliania huxleyi[J]. Hydrobiologia, 2019, 842(1): 127−141. doi: 10.1007/s10750-019-04031-0 [48] Langer G, Oetjen K, Brenneis T. Calcification of Calcidiscus leptoporus under nitrogen and phosphorus limitation[J]. Journal of Experimental Marine Biology and Ecology, 2012, 413: 131−137. doi: 10.1016/j.jembe.2011.11.028 [49] Gerecht A C, Šupraha L, Edvardsen B, et al. High temperature decreases the PIC/POC ratio and increases phosphorus requirements in Coccolithus pelagicus (Haptophyta)[J]. Biogeosciences, 2014, 11(13): 3531−3545. doi: 10.5194/bg-11-3531-2014 [50] Rokitta S D, John U, Rost B. Ocean acidification affects redox-balance and ion-homeostasis in the life-cycle stages of Emiliania huxleyi[J]. PLoS One, 2012, 7(12): e52212. doi: 10.1371/journal.pone.0052212 [51] Langer G, Nehrke G, Probert I, et al. Strain-specific responses of Emiliania huxleyi to changing seawater carbonate chemistry[J]. Biogeosciences, 2009, 6(11): 2637−2646. doi: 10.5194/bg-6-2637-2009 [52] Fiorini S, Middelburg J J, Gattuso J P. Testing the effects of elevated pCO2 on coccolithophores (Prymnesiophyceae): comparison between haploid and diploid life stages[J]. Journal of Phycology, 2011, 47(6): 1281−1291. doi: 10.1111/j.1529-8817.2011.01080.x [53] Matthiessen B, Eggers S L, Krug S A. High nitrate to phosphorus regime attenuates negative effects of rising pCO2 on total population carbon accumulation[J]. Biogeosciences, 2012, 9(3): 1195−1203. doi: 10.5194/bg-9-1195-2012 [54] Hoffmann R, Kirchlechner C, Langer G, et al. Insight into Emiliania huxleyi coccospheres by focused ion beam sectioning[J]. Biogeosciences, 2015, 12(3): 825−834. doi: 10.5194/bg-12-825-2015 [55] Riebesell U, Bach L T, Bellerby R G J, et al. Competitive fitness of a predominant pelagic calcifier impaired by ocean acidification[J]. Nature Geoscience, 2017, 10(1): 19−23. doi: 10.1038/ngeo2854 期刊类型引用(1)
1. 杨祥,王茵蕊,张泳,马帅,张虹,韩永和,张勇. 海洋升温和磷限制对颗石藻(Emiliania huxleyi)生理特征的影响及机制. 福建轻纺. 2024(08): 1-8+19 .  百度学术
百度学术其他类型引用(1)
-


 下载:
下载:


 百度学术
百度学术
计量
- 文章访问数: 376
- HTML全文浏览量: 166
- PDF下载量: 43
- 被引次数: 2
