

Influence of SCSTF on ITF based on numerical sensitivity experiments of salinity relaxation scheme
-
摘要: 观测表明,南海贯穿流(SCSTF)在北半球冬季输送至望加锡海峡南部的巨大淡水输运,能够通过“淡水阻塞”效应影响印尼贯穿流(ITF)。本文开展了一系列数值试验,发现当卡里马塔海峡盐度增大到和望加锡海峡相当之后,通过卡里马塔海峡的体积输运和淡水输运分别为3.52 Sv(1 Sv = 106 m3/s)和184.03 mSv,和控制试验相比分别增加了4.31%和减少了27.27%,而望加锡海峡上50 m的流量为0.11 Sv,和控制试验相比增加了34.69%;当卡里马塔海峡盐度降低0.1~0.6,卡里马塔海峡处的体积输运和淡水输运分别为3.37 Sv和294.44 mSv,和控制试验相比分别减少了1.57%和增加了16.37%,而望加锡海峡上50 m的流量为0.07 Sv,和控制试验相比减少了12.5%,证实了南海贯穿流淡水输运在其中的作用。和地形封闭试验相比,盐度松弛试验可以较大改变通过卡里马塔海峡的淡水通量,而较小改变通过卡里马塔海峡的体积通量,从而分析SCSTF的低盐度表层水对ITF的影响;同时本文还将松弛试验与降水关闭试验进行了对比,进一步验证了南海冬季低盐水通过卡里马塔海峡向爪哇海的输运对印尼贯穿流的重要影响。Abstract: Observations indicate that the substantial freshwater transported to the southern part of the Makassar Strait by the South China Sea Throughflow (SCSTF) can influence the Indonesian Throughflow (ITF) via the “Freshwater Plug” effect. This article has conducted a series of numerical experiments and discovered that when the salinity in the Karimata Strait increased to that in the Makassar Strait, the volume and freshwater transport through the Karimata Strait are 3.52 Sv and 184.03 mSv, with an increase of 4.31% and a decrease of 27.27% compared with the control experiment, respectively. In the meantime, the volume transport in the upper 50m of the Makassar Strait is 0.11 Sv, with an increase of 34.69%. When the salinity in the Karimata Strait decreased by 0.1−0.6, the volume and freshwater transport through the Karimata Strait are 3.37 Sv and 294.44 mSv, with a decrease of 1.57% and an increase of 16.37% compared with the control experiment, respectively. Also, the volume transport in the upper 50m of the Makassar Strait is 0.07 Sv, with a decrease of 12.5%. These have proved the influence of freshwater transported by SCSTF on ITF. Comparing the salinity relaxation experiment with the topography closed experiment, the salinity relaxation experiment allows for significant changes in the freshwater transport through the Karimata Strait while only modestly affecting the volume transport. This enables an analysis of the impact of SCSTF’s surface water with low salinity on ITF. Meanwhile, we have compared the salinity relaxation experiment with the rainfall closed experiment, and the important impact of low salinity water transport in the South China Sea through the Karimata Strait to the Java Sea on the ITF in boreal winter is further verified.
-

图 1 主要研究范围及敏感性试验中的松弛区域
红色实线为ITF的流场,红色虚线为SCSTF的流场。在敏感性试验中,盐度被恢复到指定值。其中,红色框表示卡里马塔海峡(Karimata Strait)松弛试验的区域,蓝色框表示望加锡海峡(Makassar Strait)松弛试验的区域
Fig. 1 The main research domain and relaxation areas in the sensitivity experiments
The red solid line stands for the ITF, while the red dotted line stands for the SCSTF. Salinity is restored to a specified value. The red box indicates Karimata relaxation region and and the blue box indicates Makassar relaxation region
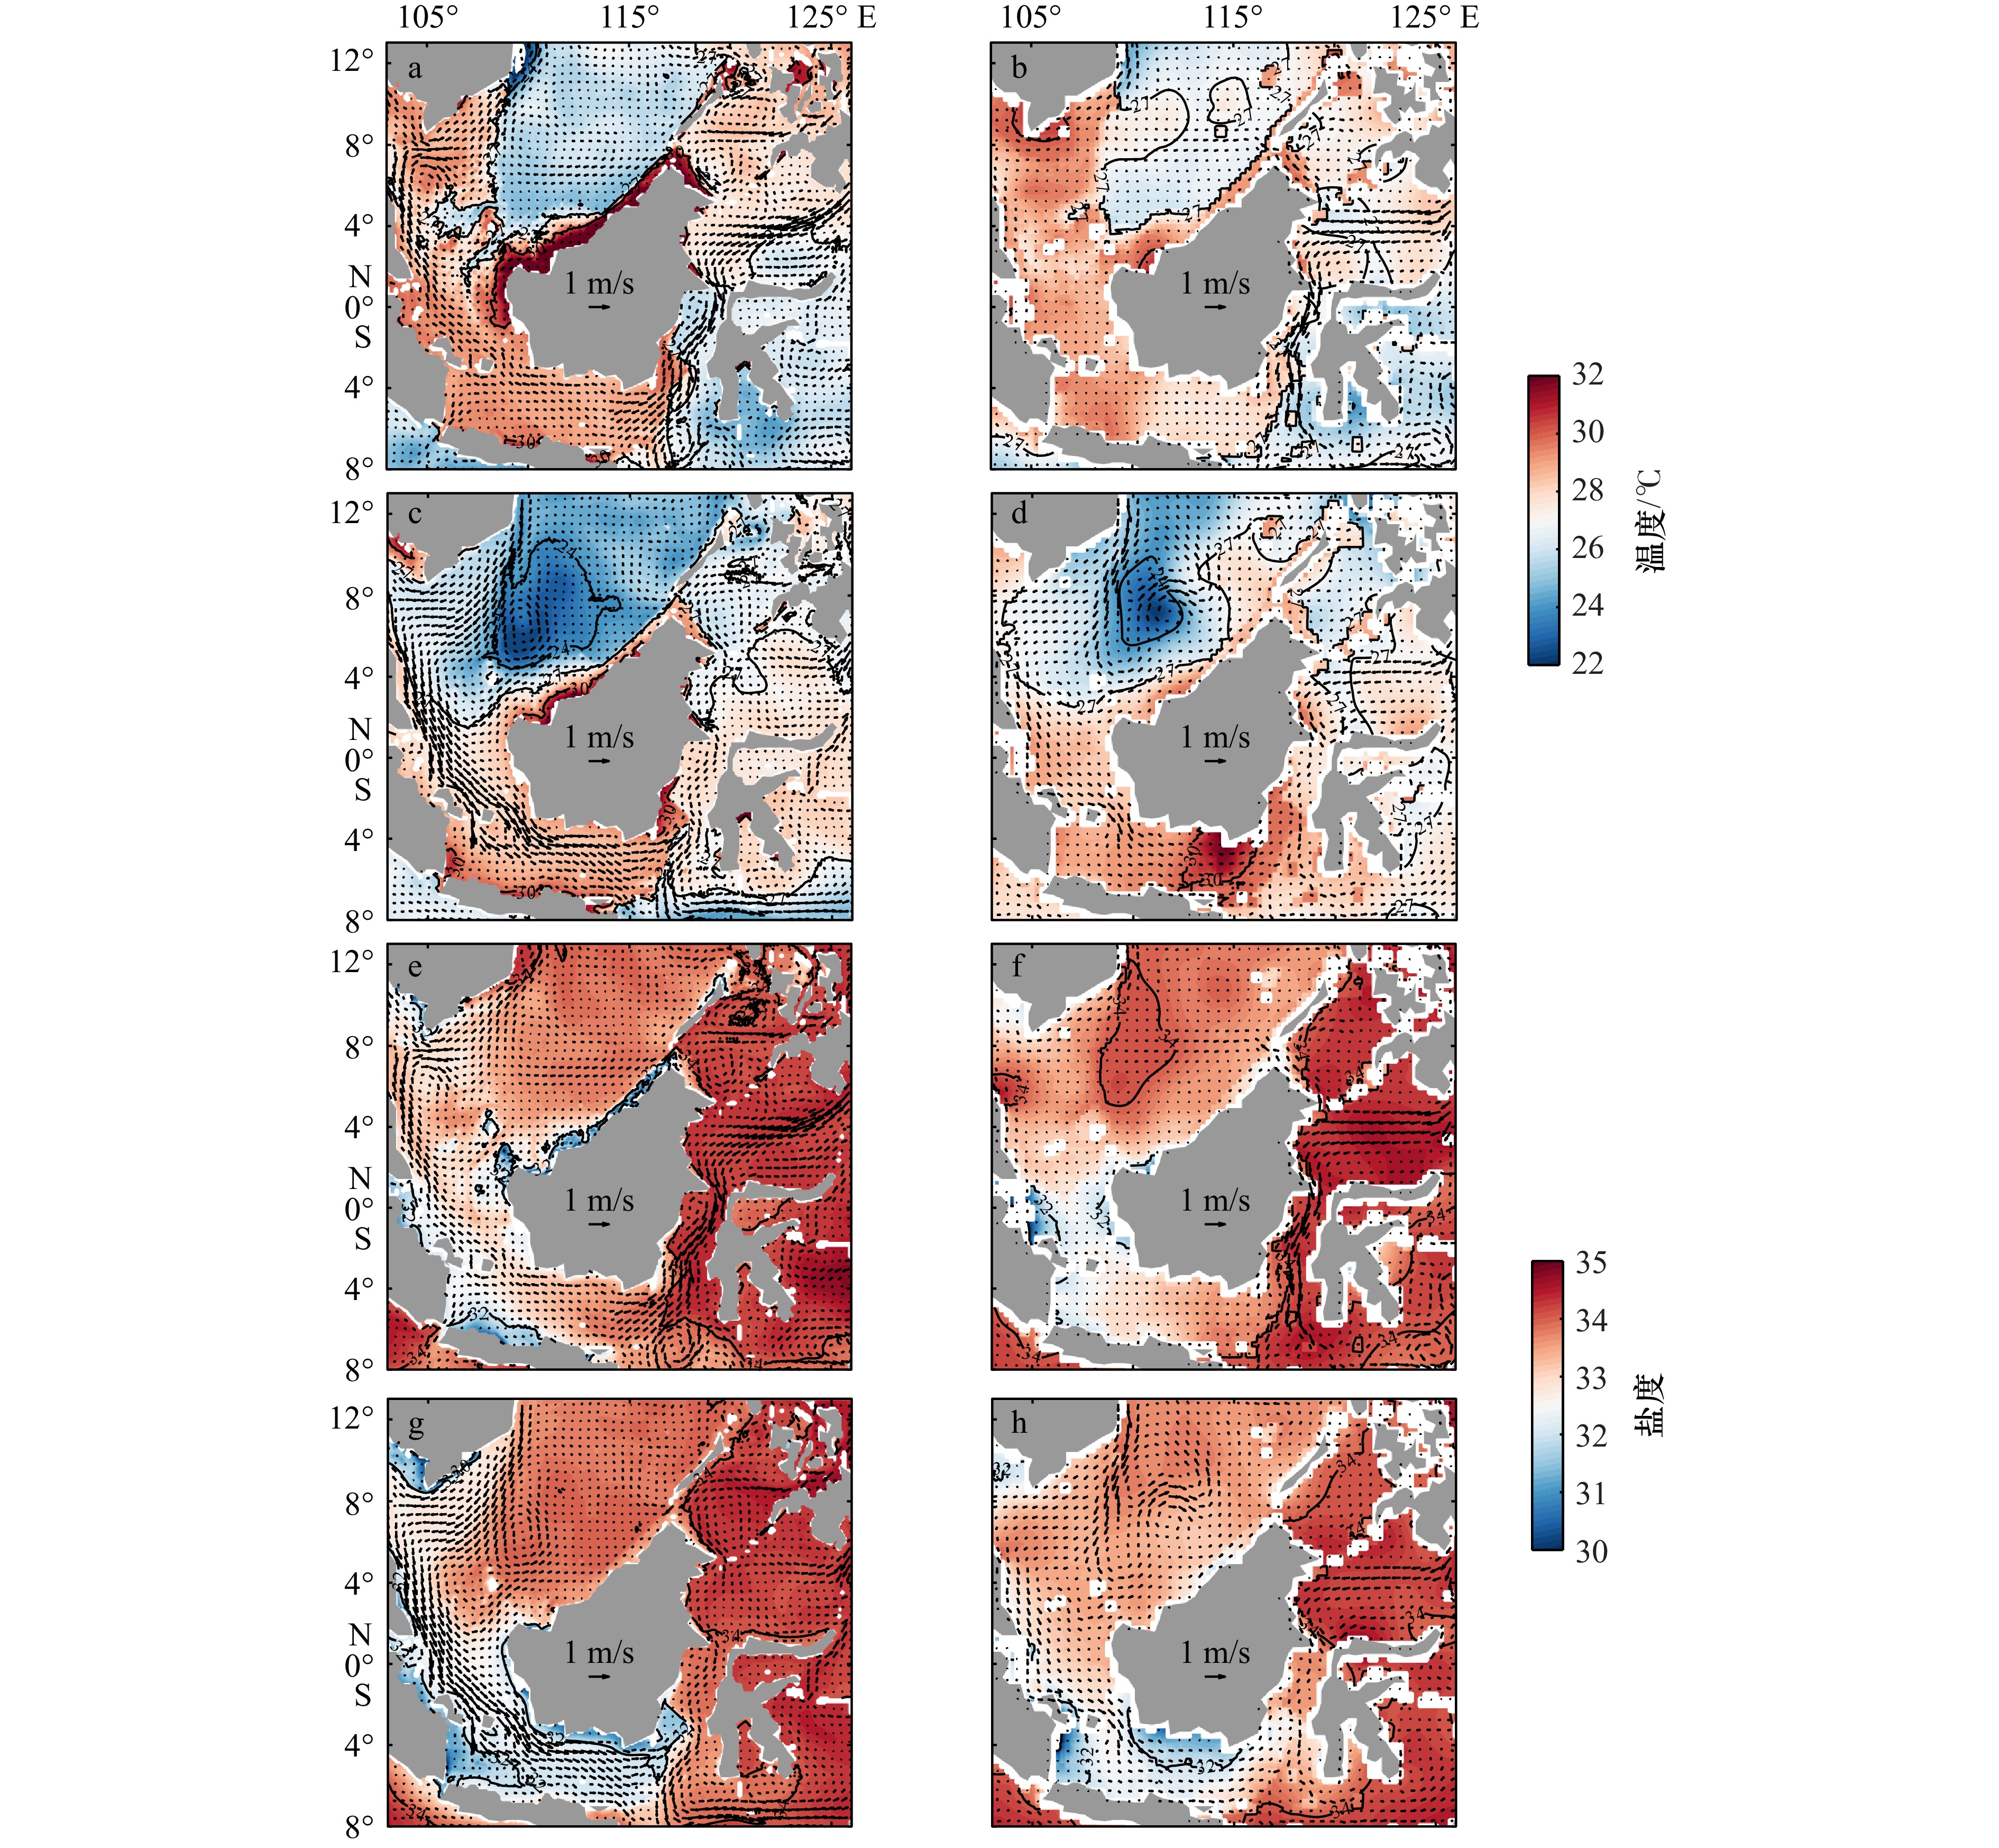
图 2 控制试验模式结果与观测数据对比
a.模式EXP0中北半球夏季混合层温度(阴影)和流速(矢量);b.WOA23数据集中北半球夏季混合层温度(阴影)和SODA再分析数据集中的流速(矢量);c、d与a、b一致,但是为北半球冬季的数据;e–h与a–d一致,但是为盐度数据
Fig. 2 Comparisons between the outputs of the control experiment EXP0 and observational data
a. The mixed layer temperature (shaded) and current velocity (vector) in the control experiment in boreal summer (EXP0); b. The mixed layer temperature (shaded) in WOA23 and current velocity (vector) in SODA in boreal summer; c and d are same as a and b, but for temperature in boreal winter; e–h are the same as a–d, but for salinity
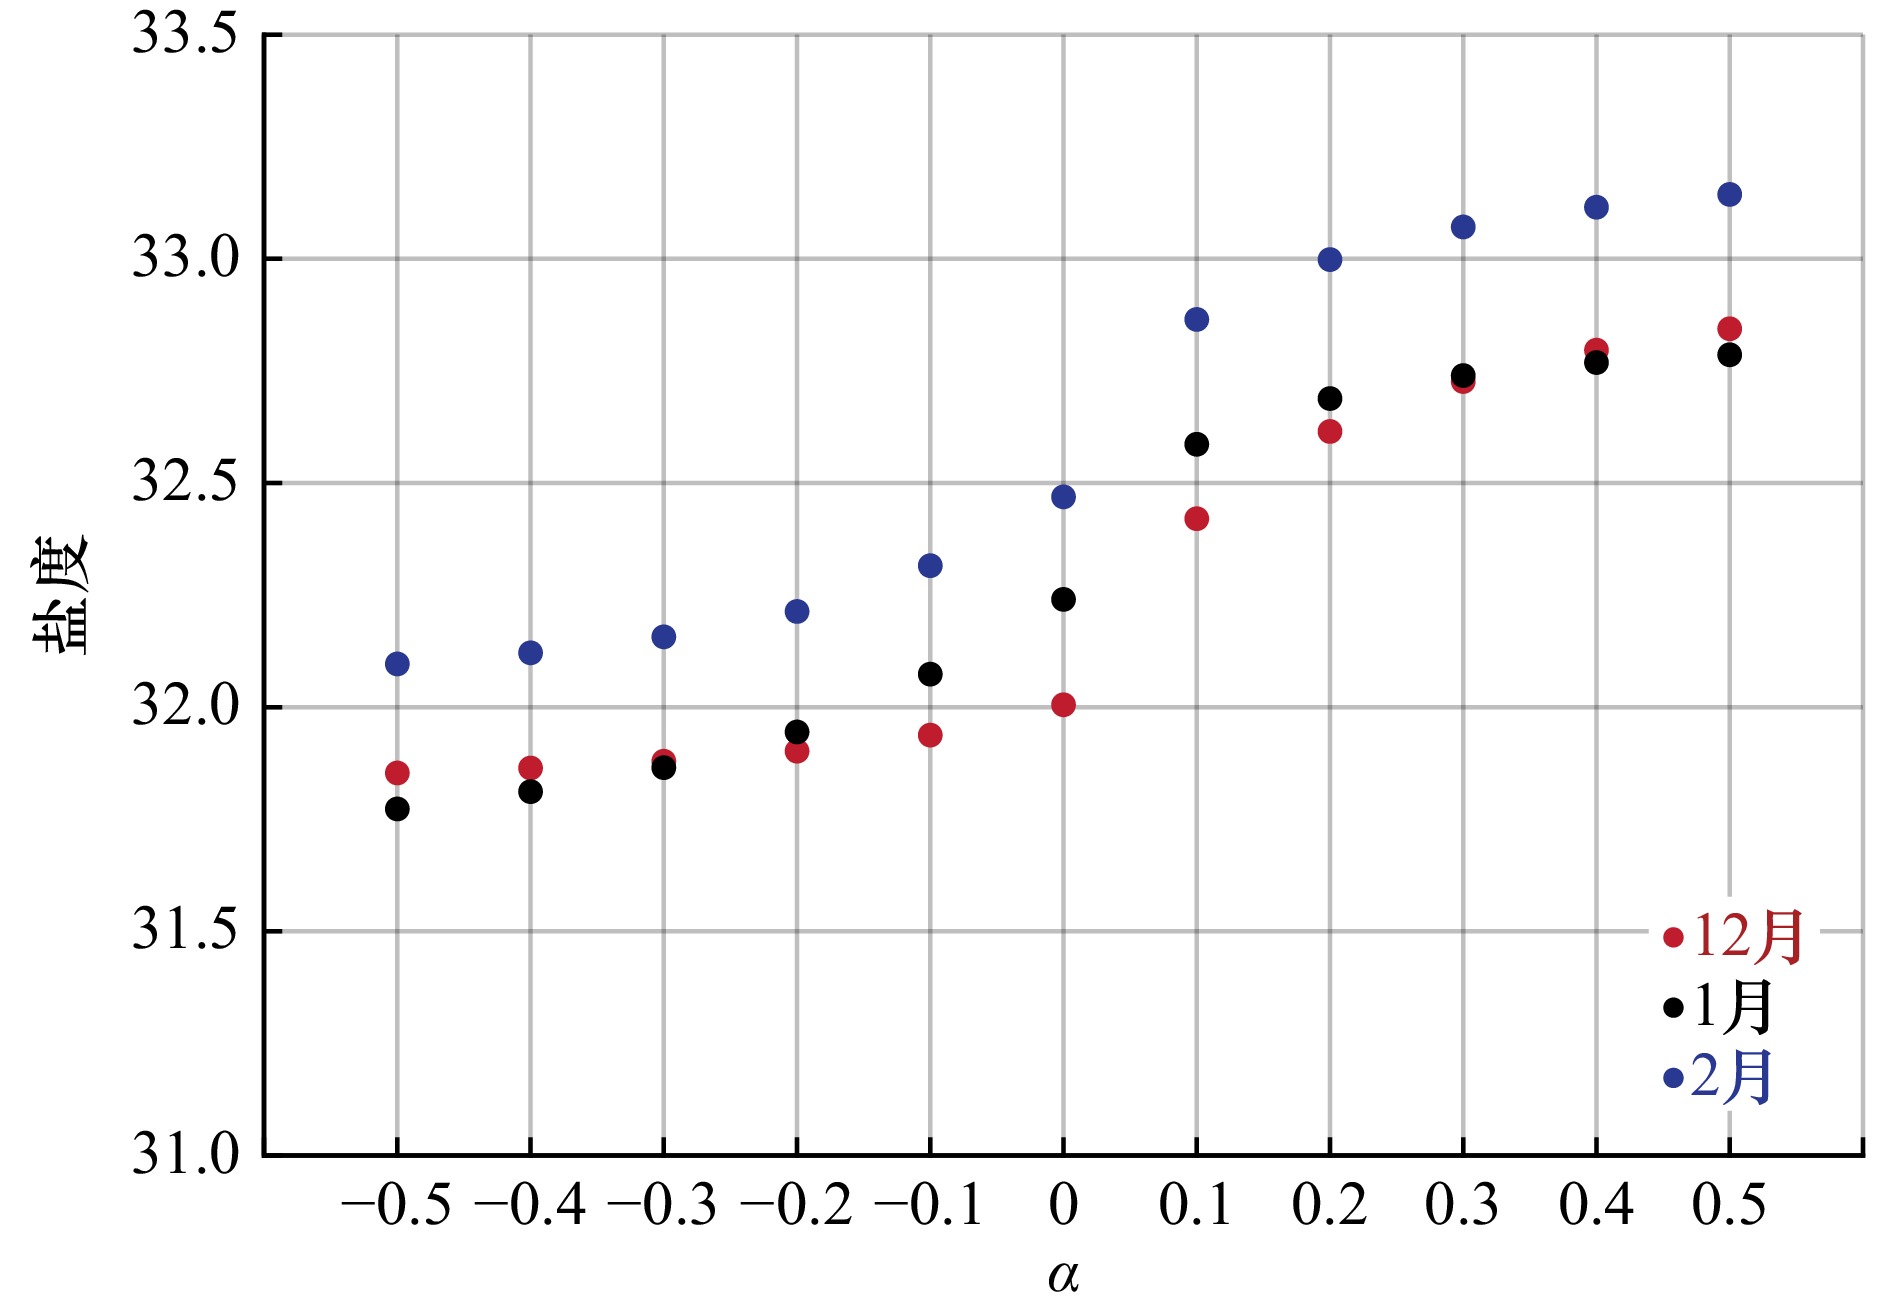
图 3 卡里马塔海峡松弛区域内不同松弛系数 α 下的空间平均混合层盐度
红点、黑点和蓝点分别表示 12月、1月和2月的情况
Fig. 3 Area averaged mixed layer salinities in the Karimata relaxation region with different nudging coefficient
$ \alpha $ Red, black and blue dots represent that in December, January and February, respectively
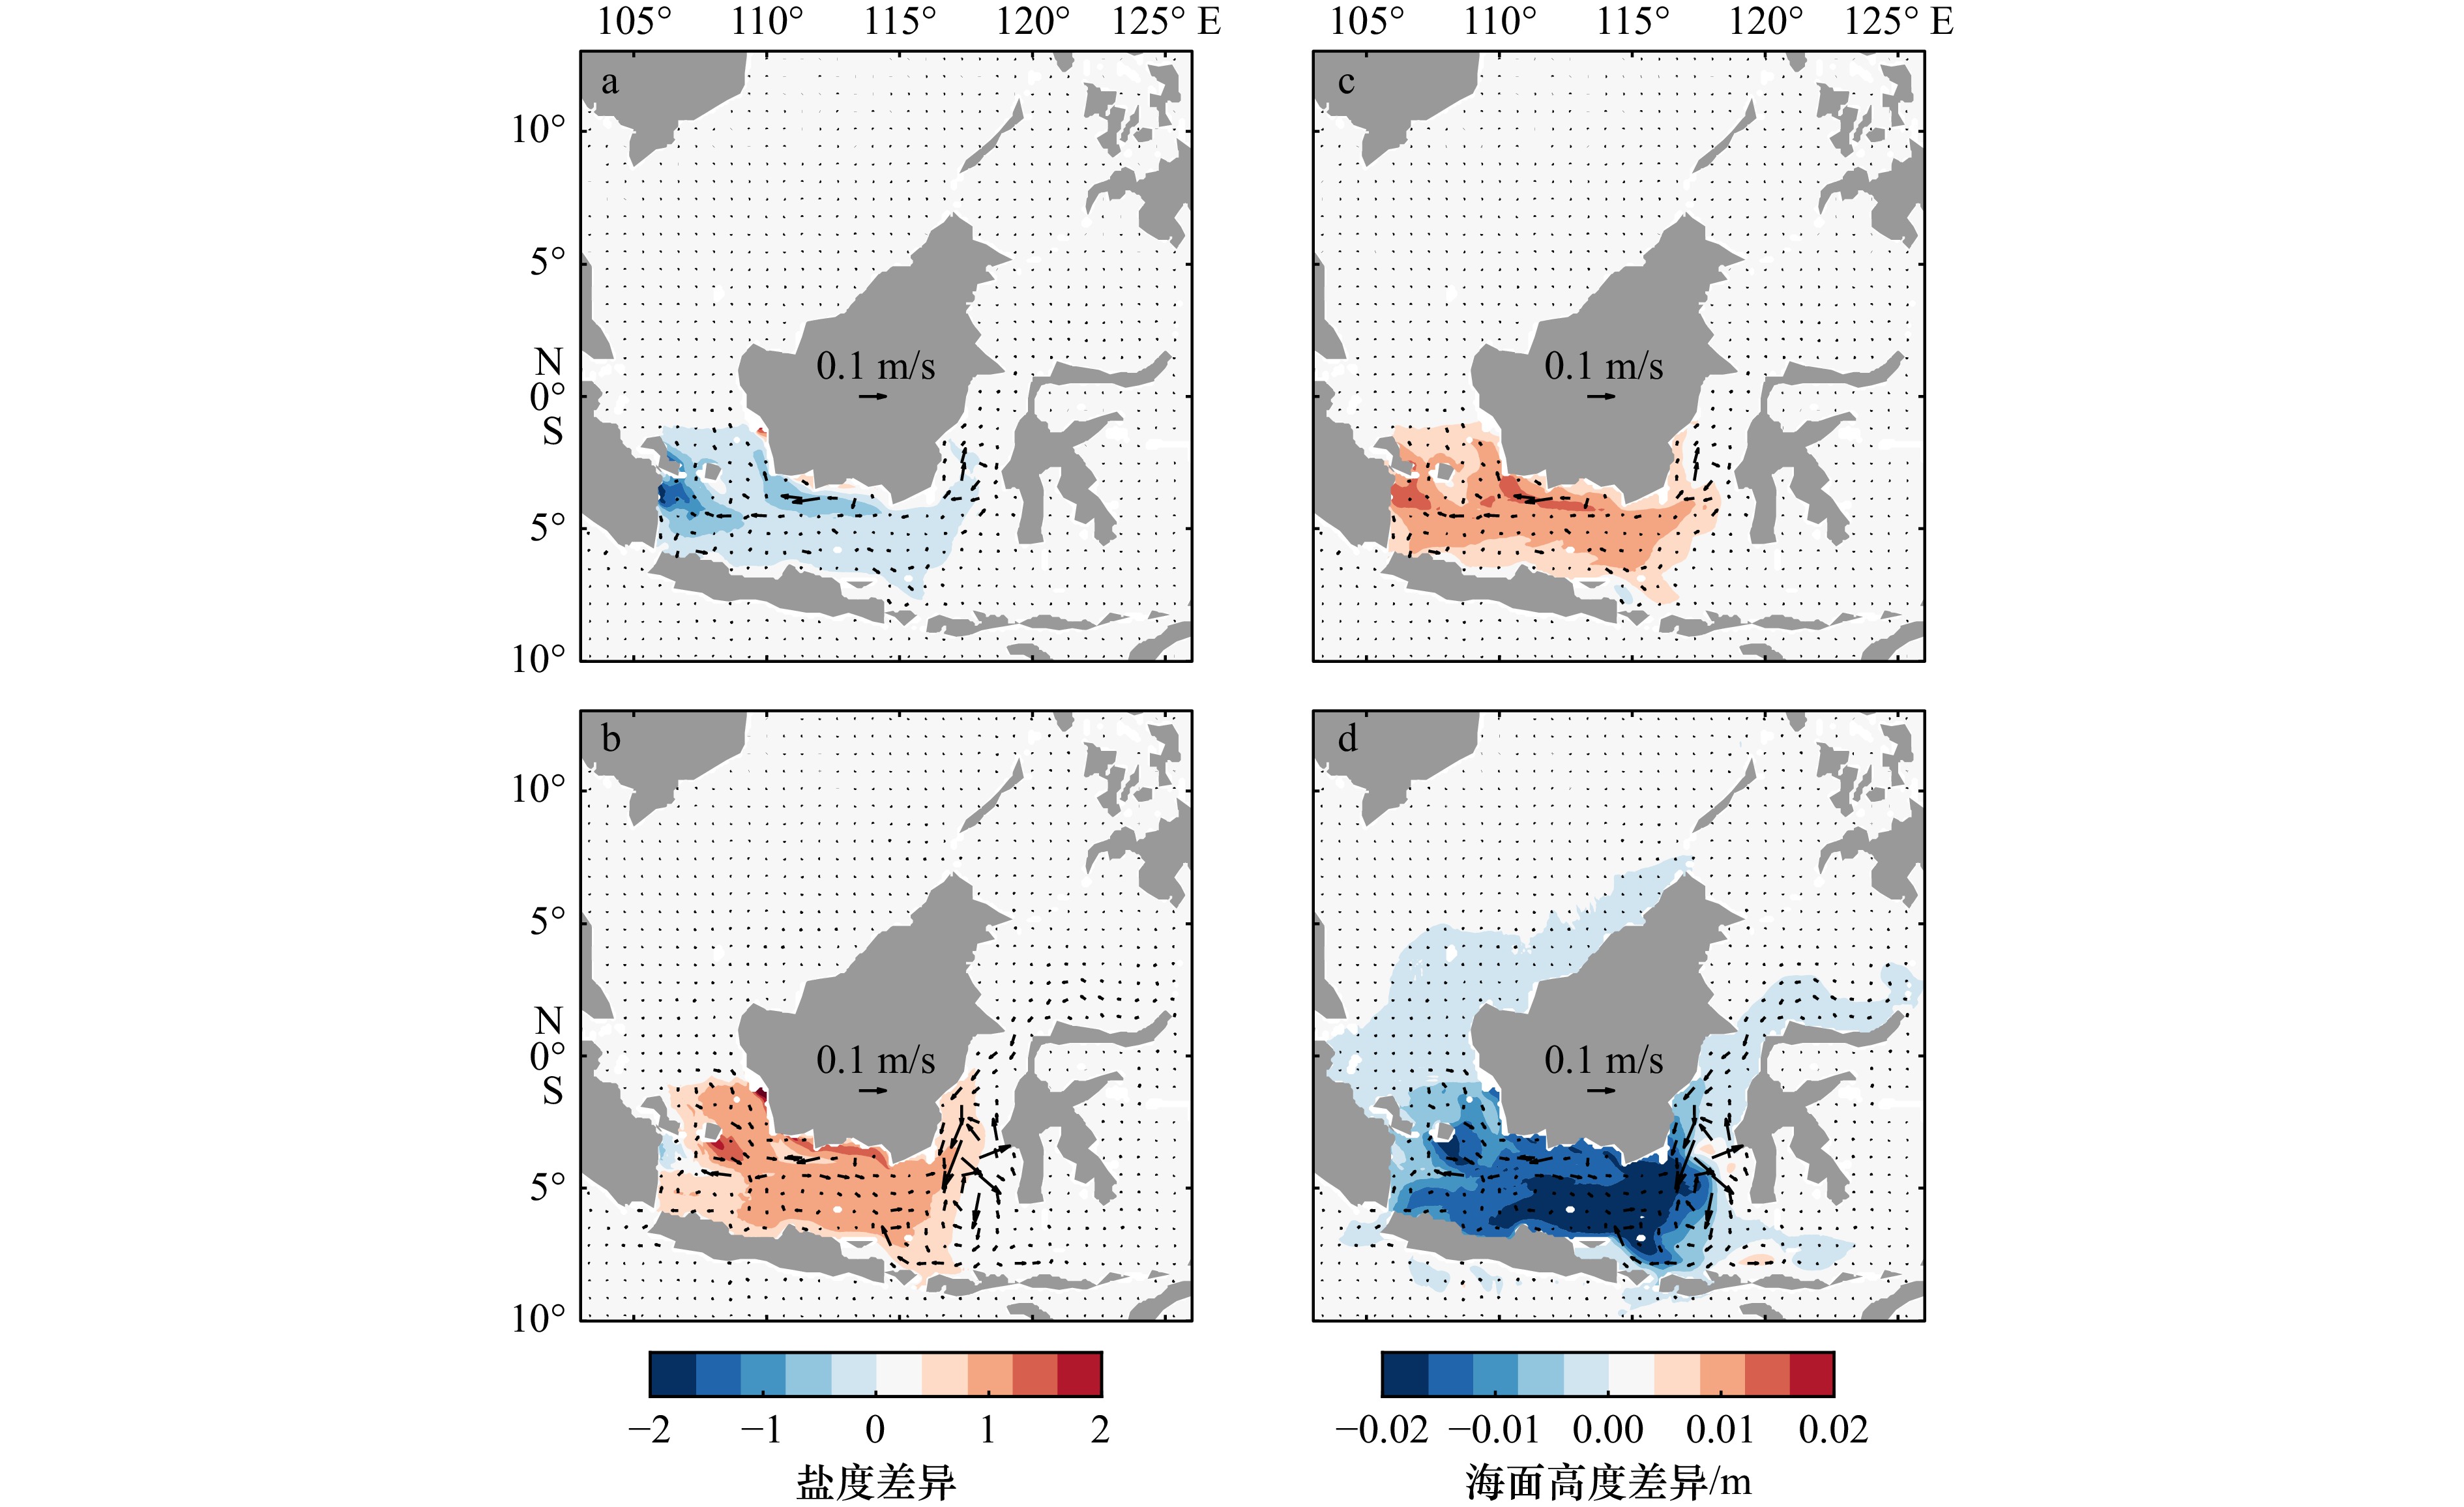
图 4 混合层盐度、海面高度(SSH)和混合层流速在 EXP1A 与 EXP0 之间,以及 EXP1J 与 EXP0 之间的差异
a和 b分别为 EXP1A 和 EXP1J 的混合层盐度(阴影)和流速(箭头);c、 d与 a、b相同,但为 SSH
Fig. 4 Differences of mixed layer salinity, sea surface height (SSH) and mixed layer velocity between EXP1A and EXP0, and between EXP1J and EXP0
a and b are mixed layer salinity (shading) and velocity (vector) for EXP1A and EXP1J, respectively; c and d are the same as a and b, but for SSH
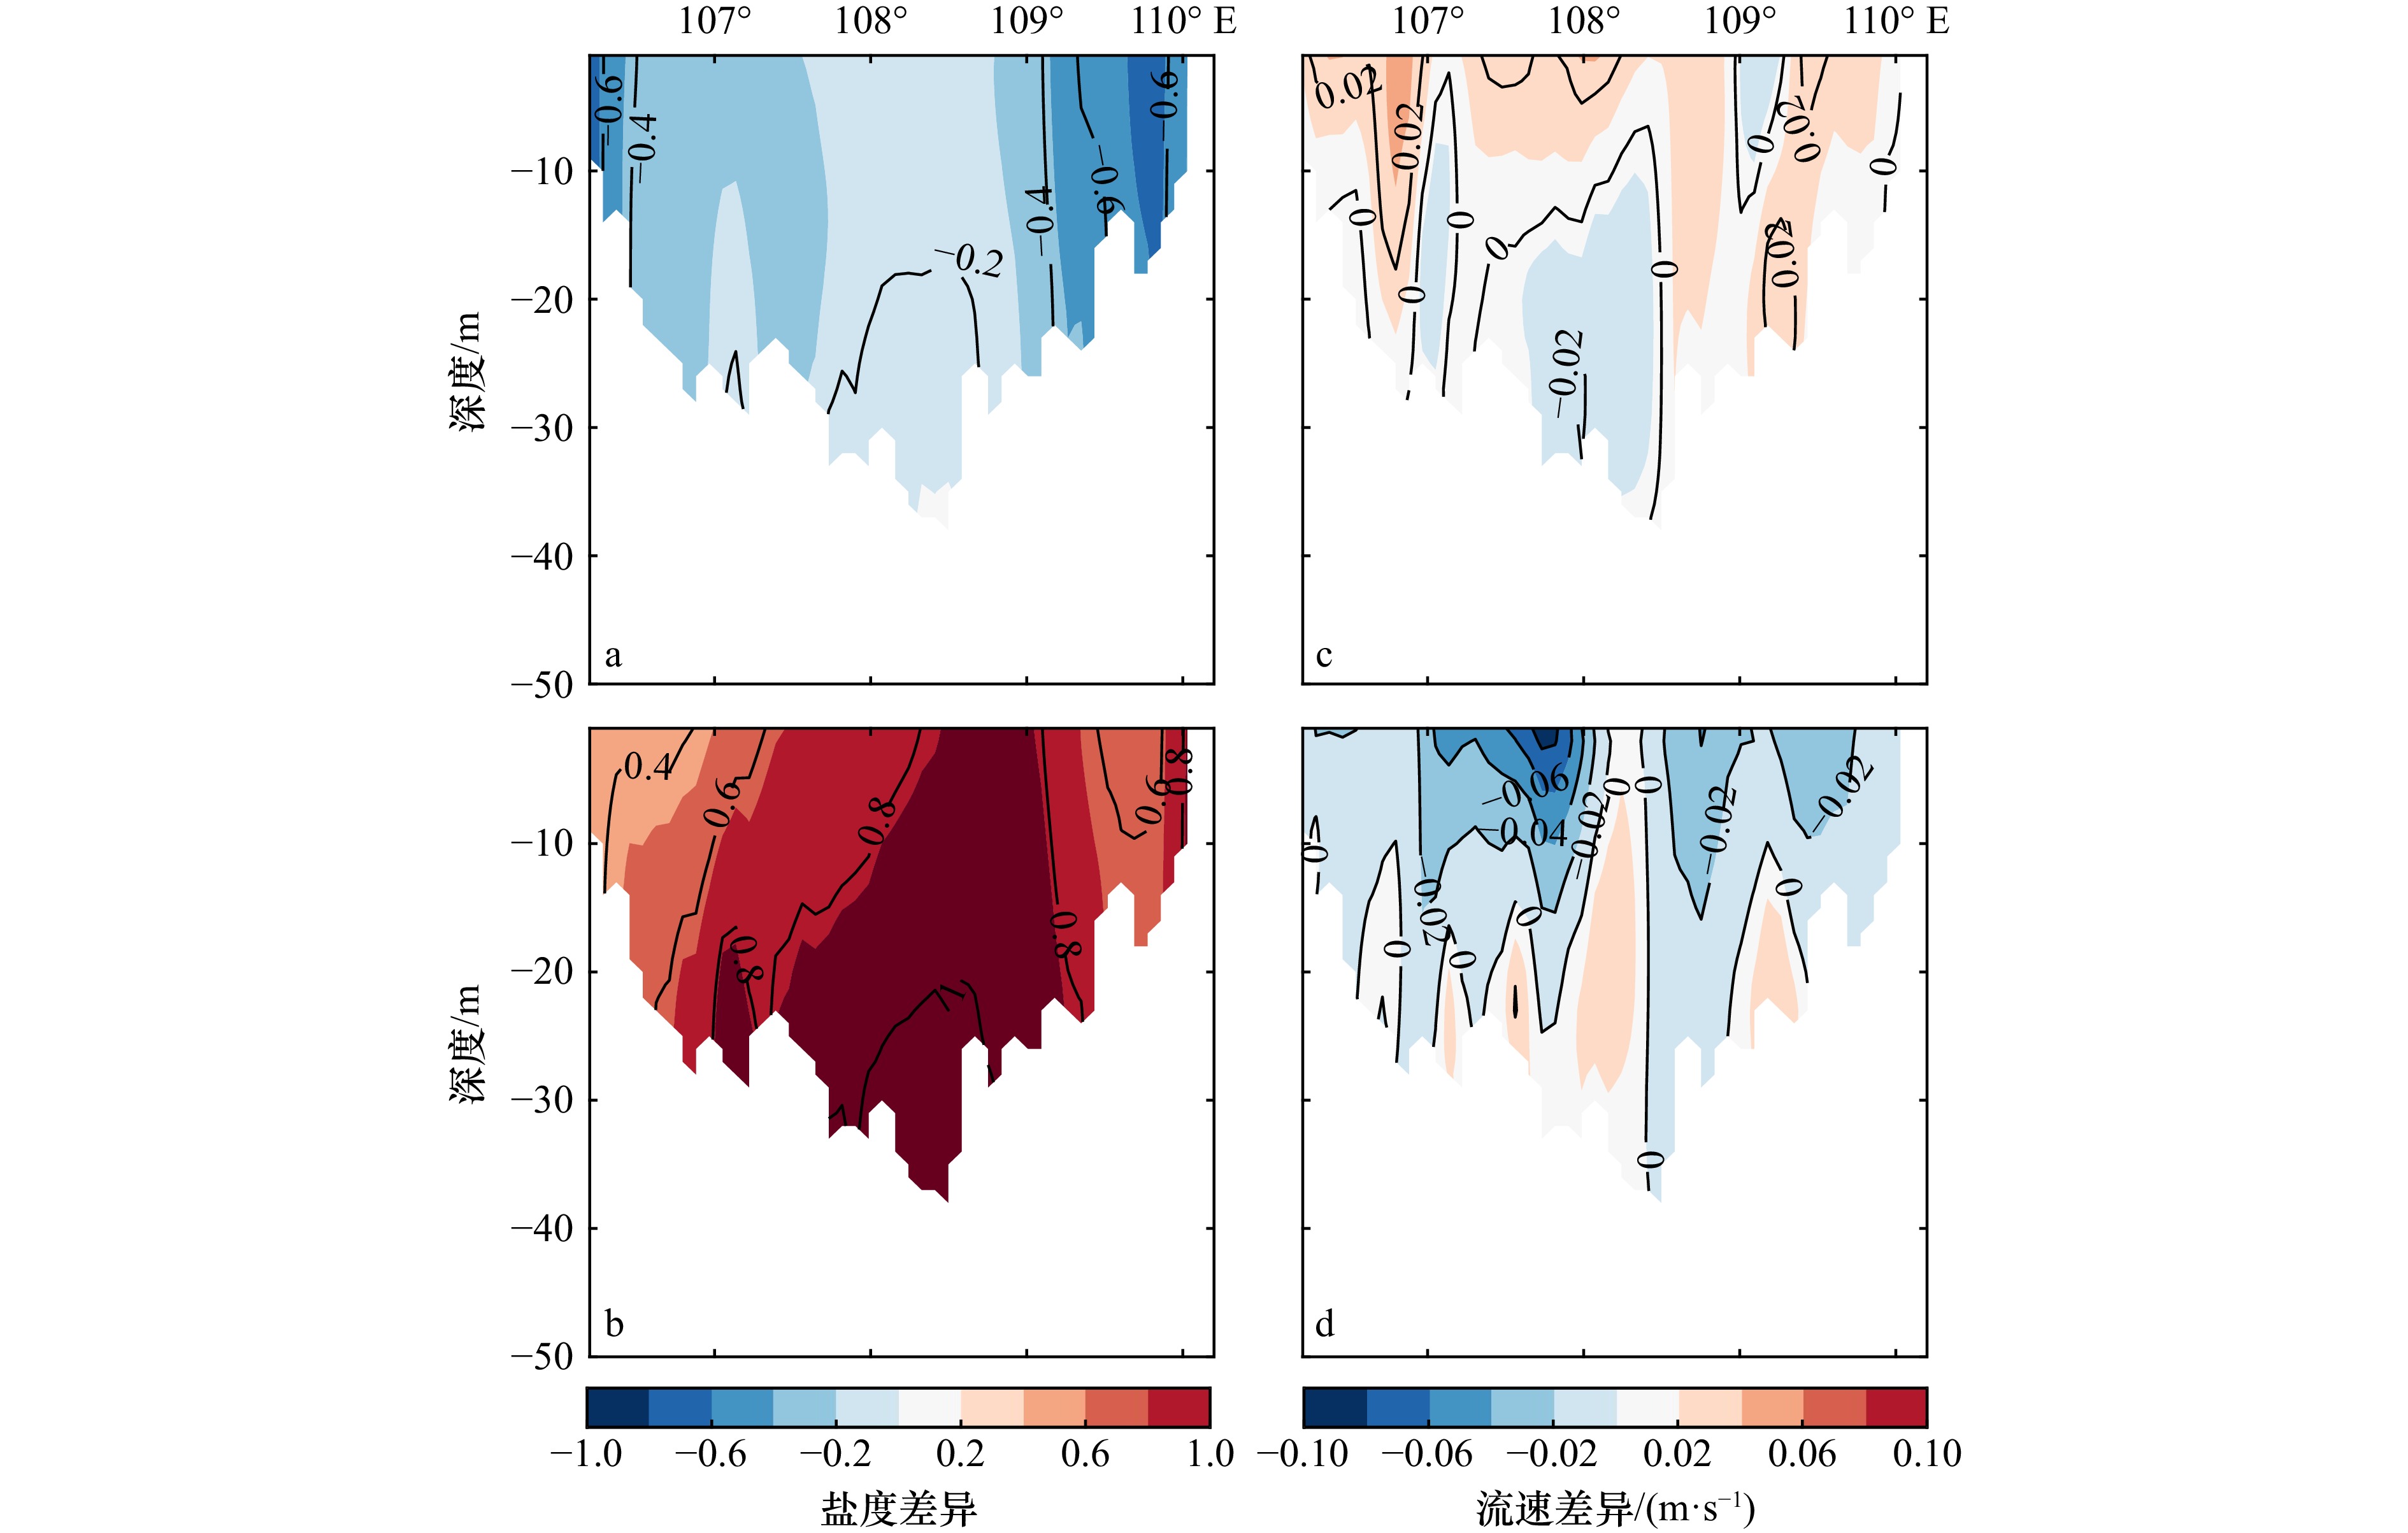
图 5 卡里马塔海峡(2°S, 106.2°~110.2°E)中EXP1A 与 EXP0 之间的盐度差异(a) ,EXP1J 与 EXP0 之间的盐度差异(b) ;EXP1A 与 EXP0 之间的经向流速差异(c),EXP1J 与 EXP0 之间的经向流速差异(d)
Fig. 5 Differences of salinity between EXP1A and EXP0 (a), EXP1J and EXP0 (b), and meridional velocity between EXP1A and EXP0 (c), EXP1J and EXP0 (d) in the Karimata Strait (2°S, 106.2°−110.2°E)
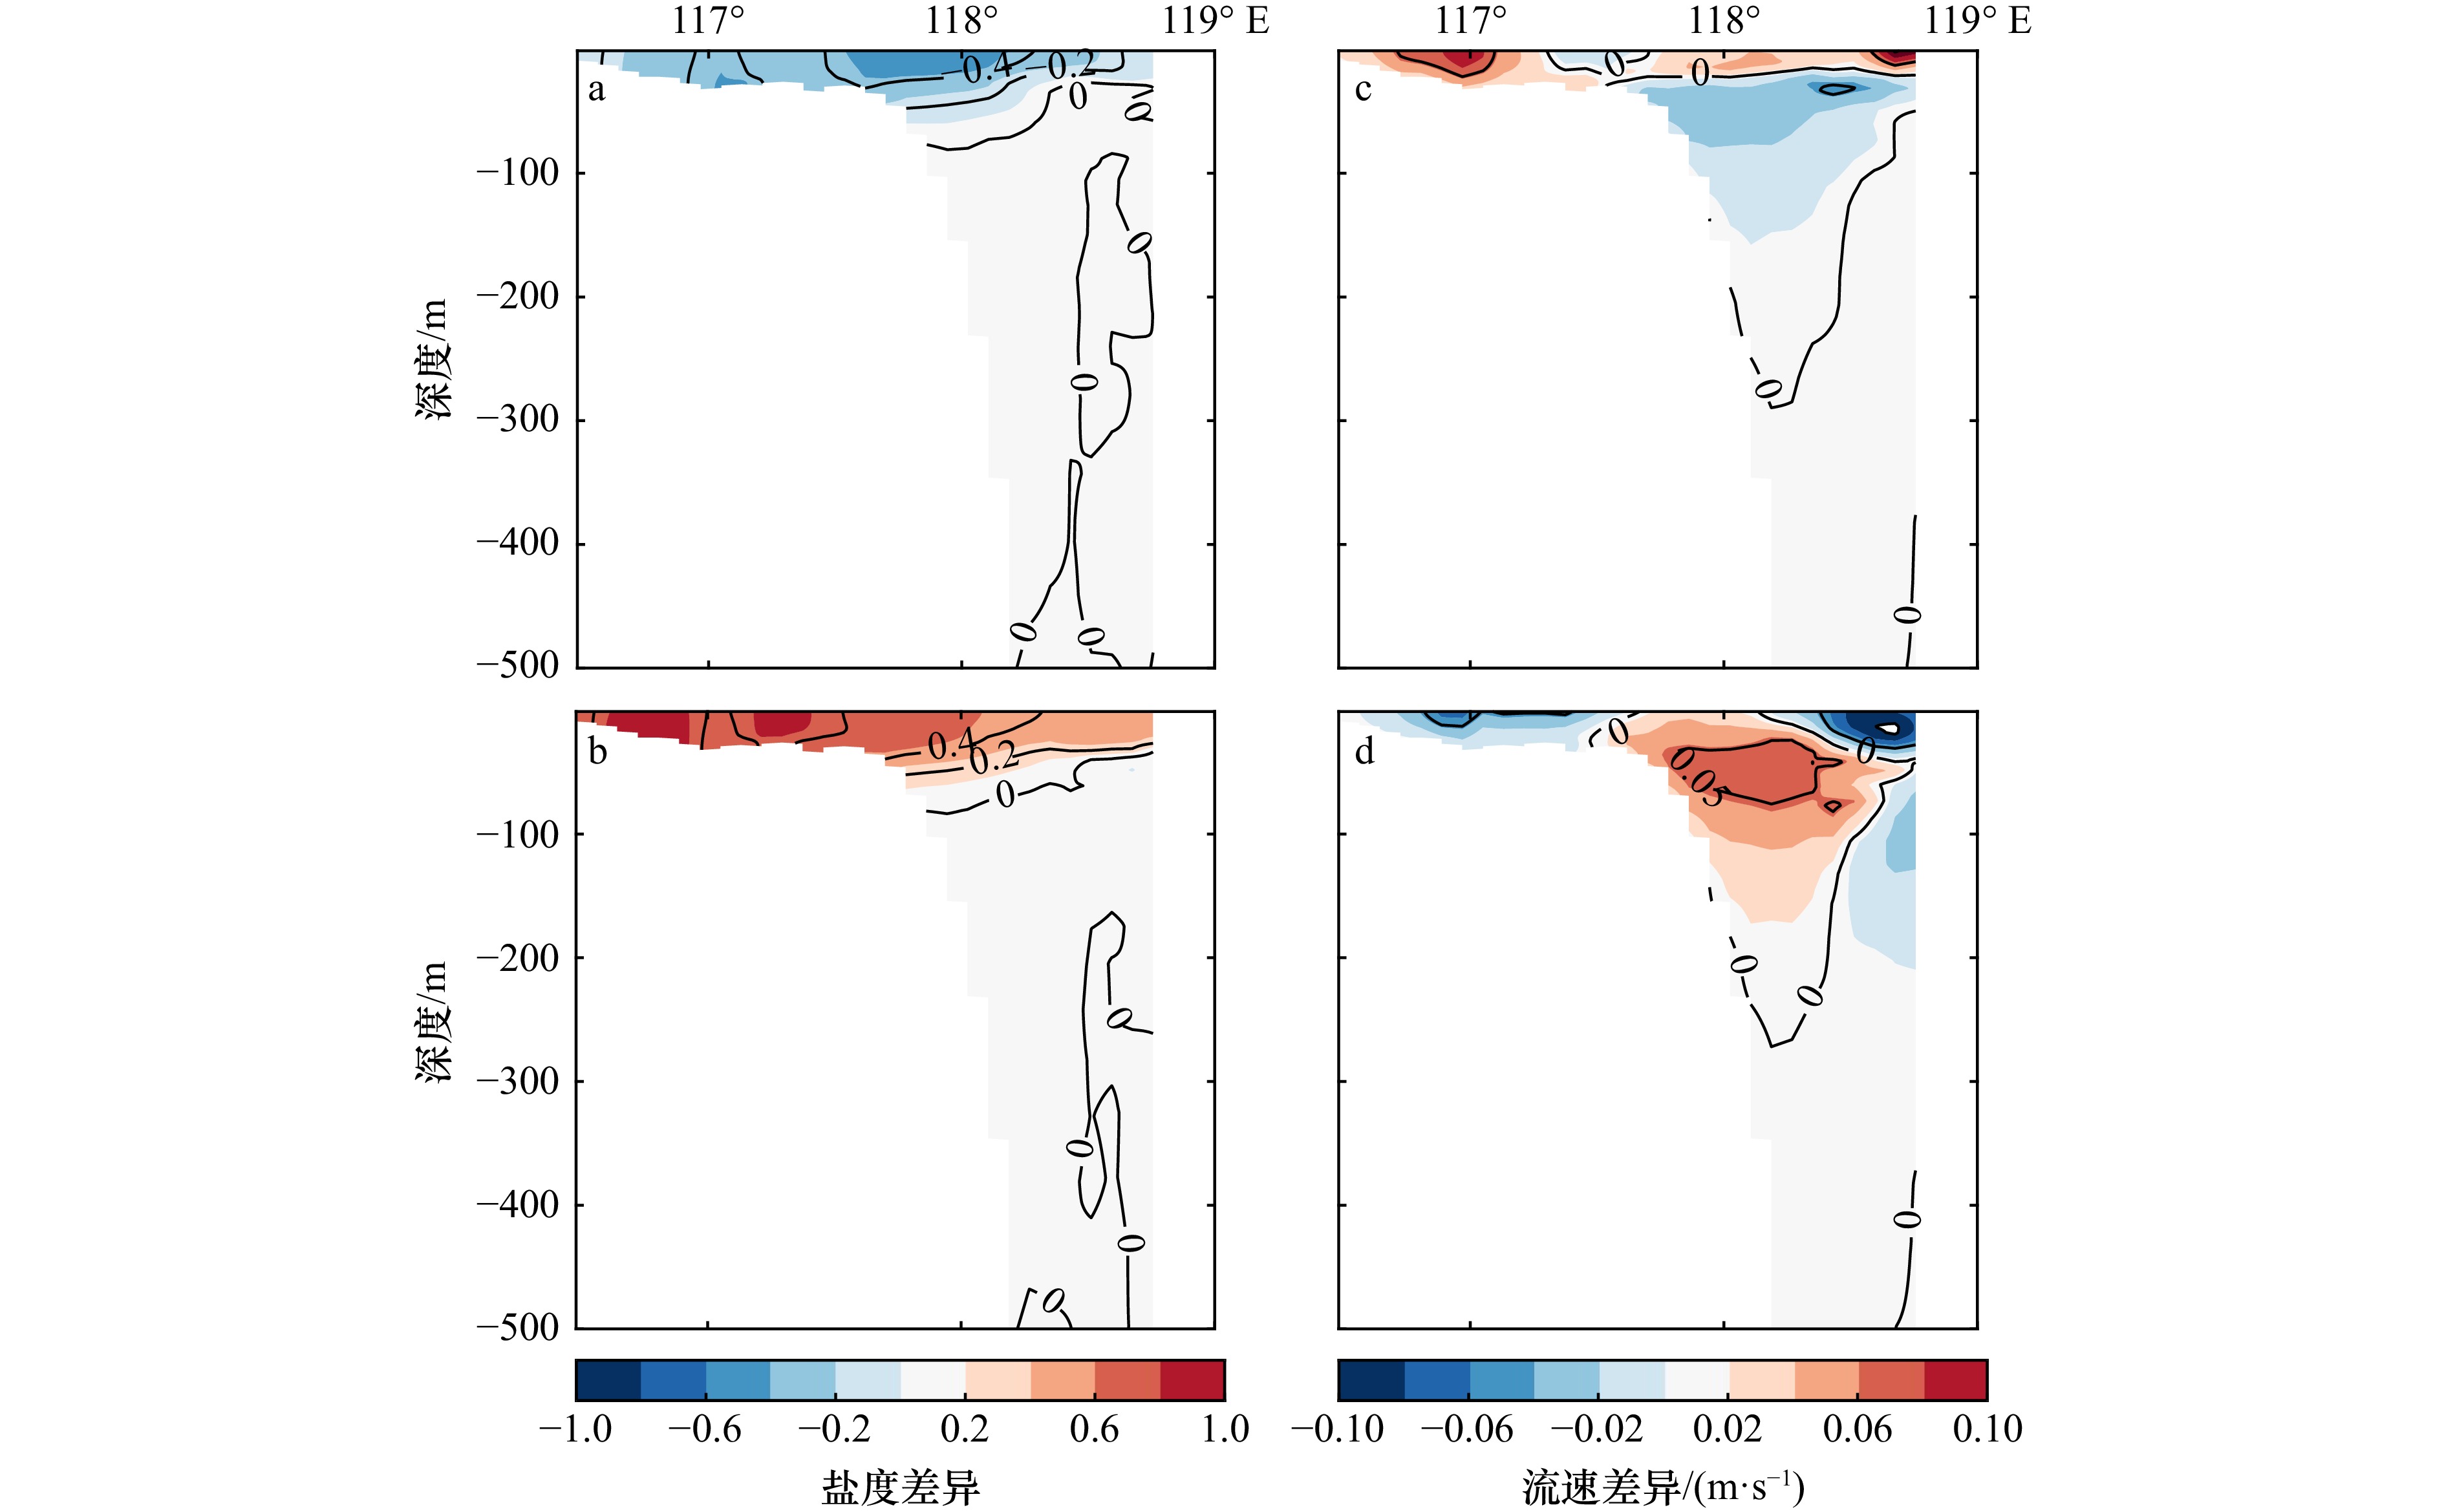
图 6 望加锡海峡(2.7°S, 116.4°~119°E)中EXP1A 与 EXP0 之间的盐度差异 (a) ,EXP1J 与 EXP0 之间的盐度差异(b) ;EXP1A 与 EXP0 之间的沿海峡流速差异(c) ,EXP1J 与 EXP0 之间的沿海峡流速差异(d)
Fig. 6 Differences of salinity between EXP1A and EXP0 (a), EXP1J and EXP0 (b) , and along strait velocity between EXP1A and EXP0 (c), EXP1J and EXP0 (d) in the Makassar Strait (2.7°S, 116.4°−119°E)
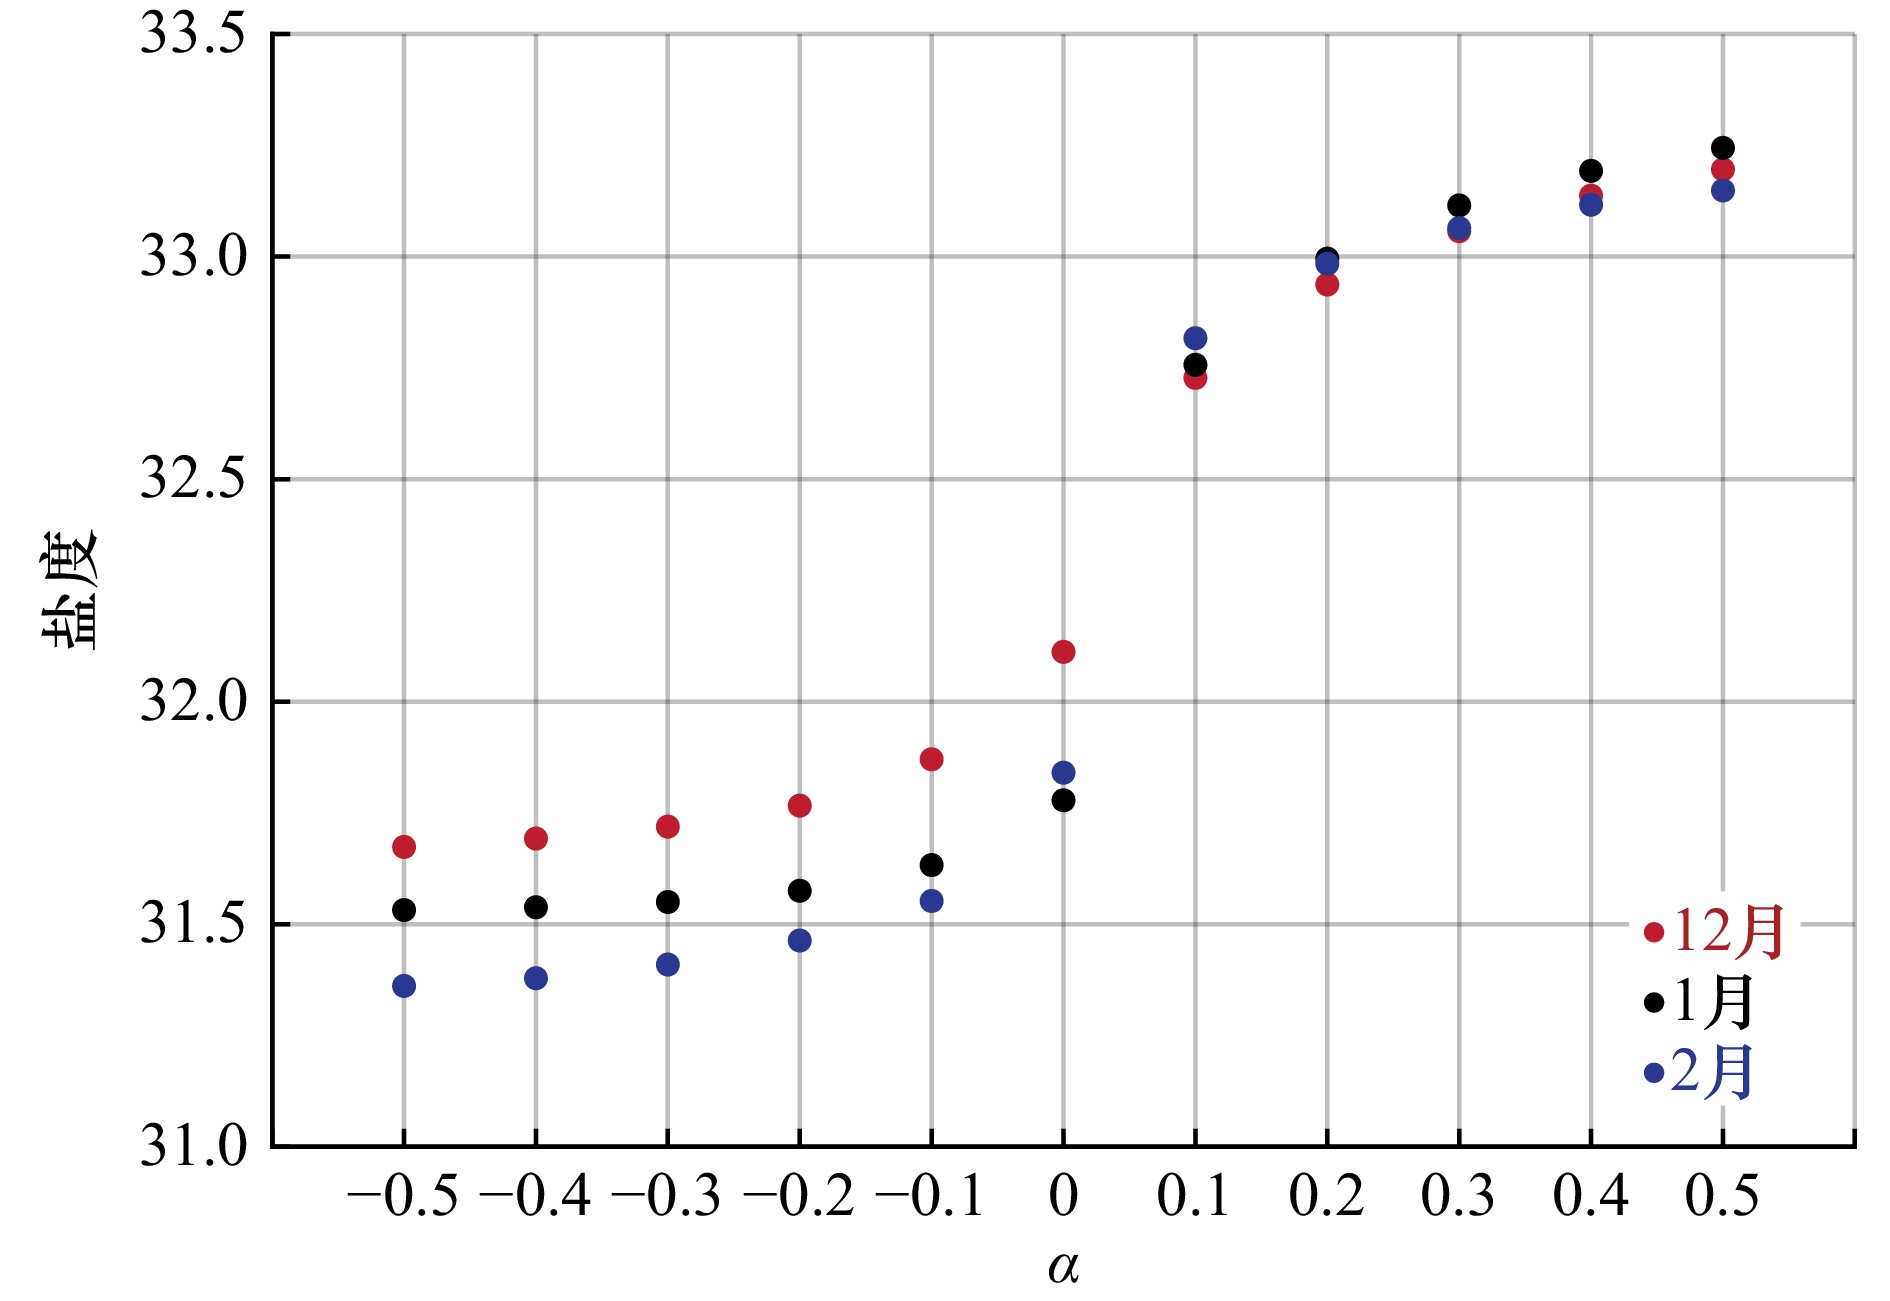
图 7 望加锡海峡松弛区域内不同松弛系数
$ \alpha $ 下的空间平均混合层盐度红点、黑点和蓝点分别表示 12月、1月和2月的情况
Fig. 7 Area averaged mixed layer salinities in the Karimata relaxation region with different nudging coefficient
$ \alpha $ Red, black and blue dots represent that in December, January and February, respectively

图 8 混合层盐度、海面高度(SSH)和混合层流速在 EXP2A 与 EXP0 之间,以及 EXP2J 与 EXP0 之间的差异
a和 b分别为 EXP2A 和 EXP2J 的混合层盐度(阴影)和流速(箭头);c、d与 a、b相同,但为 SSH
Fig. 8 Differences of mixed layer salinity, sea surface height (SSH) and mixed layer velocity between EXP2A and EXP0, and between EXP2J and EXP0
a and b are mixed layer salinity (shading) and velocity (vector) for EXP2A and EXP2J, respectively; c and d are the same as a and b, but for SSH
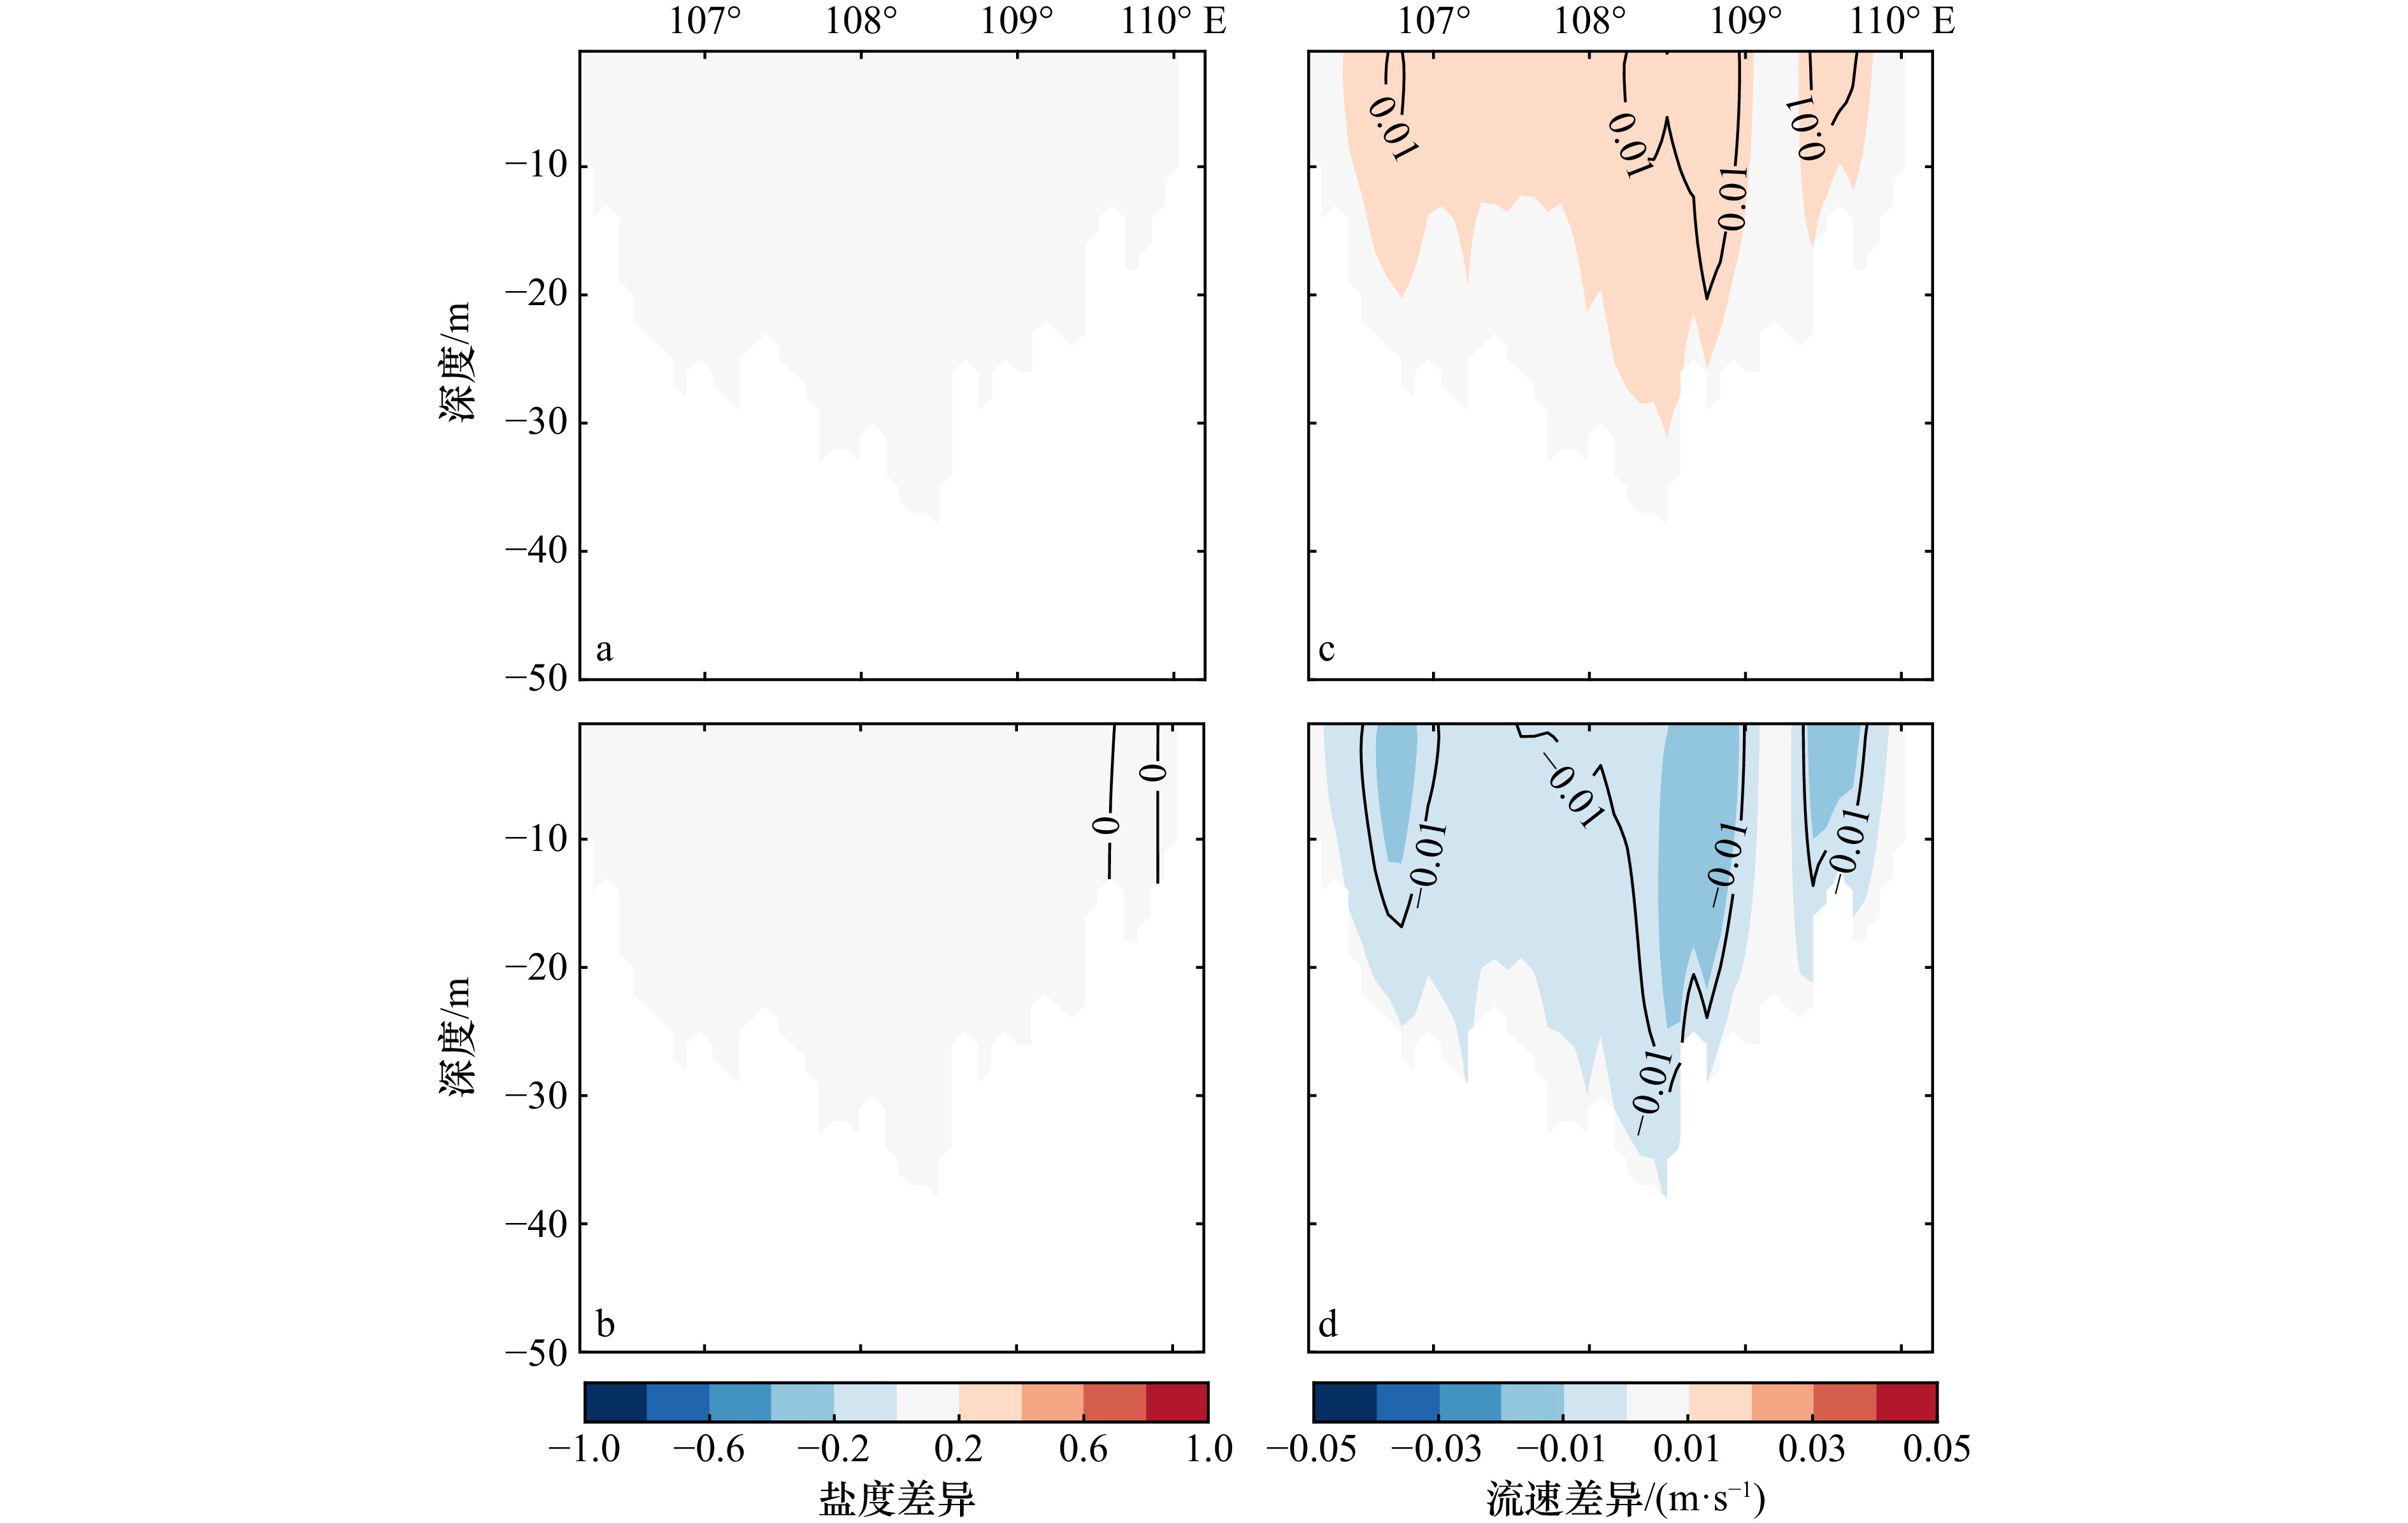
图 9 卡里马塔海峡(2°S, 106.2°~110.2°E)中EXP2A 与 EXP0 之间的盐度差异(a),EXP2J 与 EXP0 之间的盐度差异(b);EXP2A 与 EXP0 之间的经向流速差异(c),EXP2J 与 EXP0 之间的经向流速差异(d)
Fig. 9 Differences of salinity between EXP2A and EXP0 (a), EXP2J and EXP0(b), and meridional velocity between EXP2A and EXP0 (c), EXP2J and EXP0 (d) in the Karimata Strait (2°S, 106.2°−110.2°E)
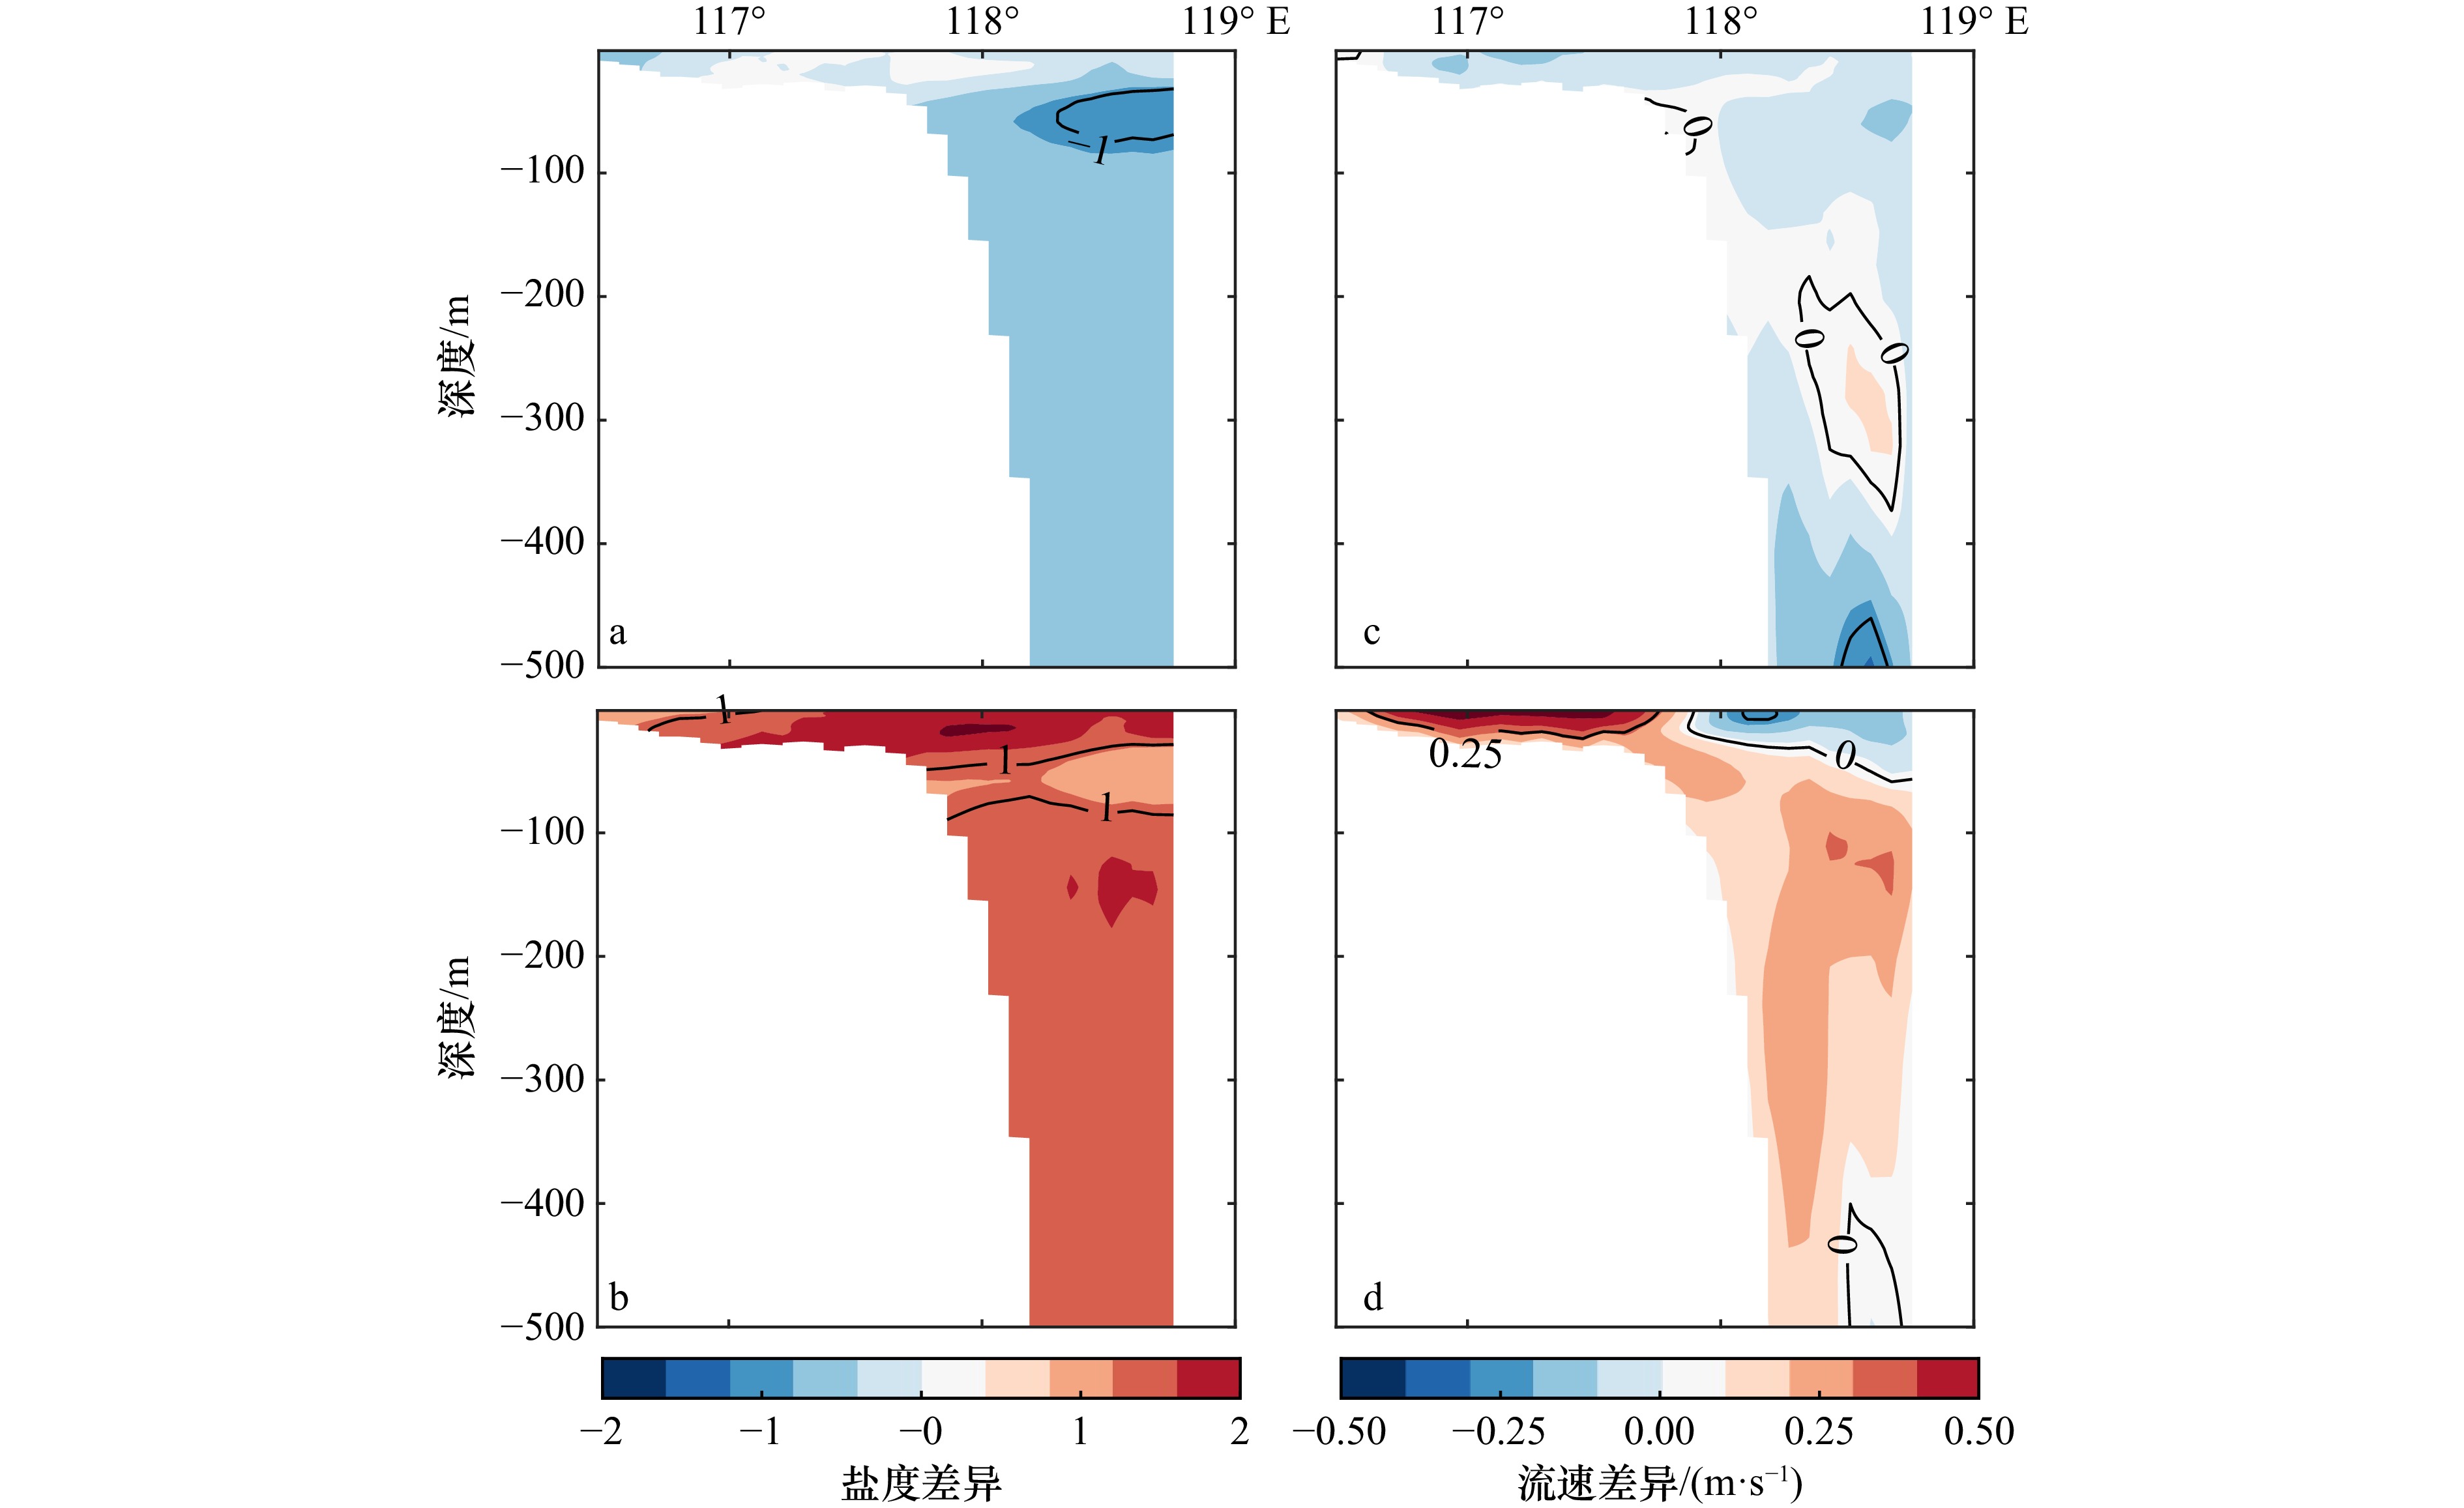
图 10 望加锡海峡(2.7°S, 116.4°~119°E)中EXP2A与EXP0之间的盐度差异(a) ;EXP2J与 EXP0之间的盐度差异(b) ;EXP2A与EXP0之间的沿海峡流速差异(c) ;EXP2J与EXP0 之间的沿海峡流速差异(d)
Fig. 10 Differences of salinity between EXP1A and EXP0 (a), EXP1J and EXP0 (b), and along strait velocity between EXP1A and EXP0 (c), EXP1J and EXP0 (d) in the Makassar Strait (2.7°S, 116.4°–119°E)
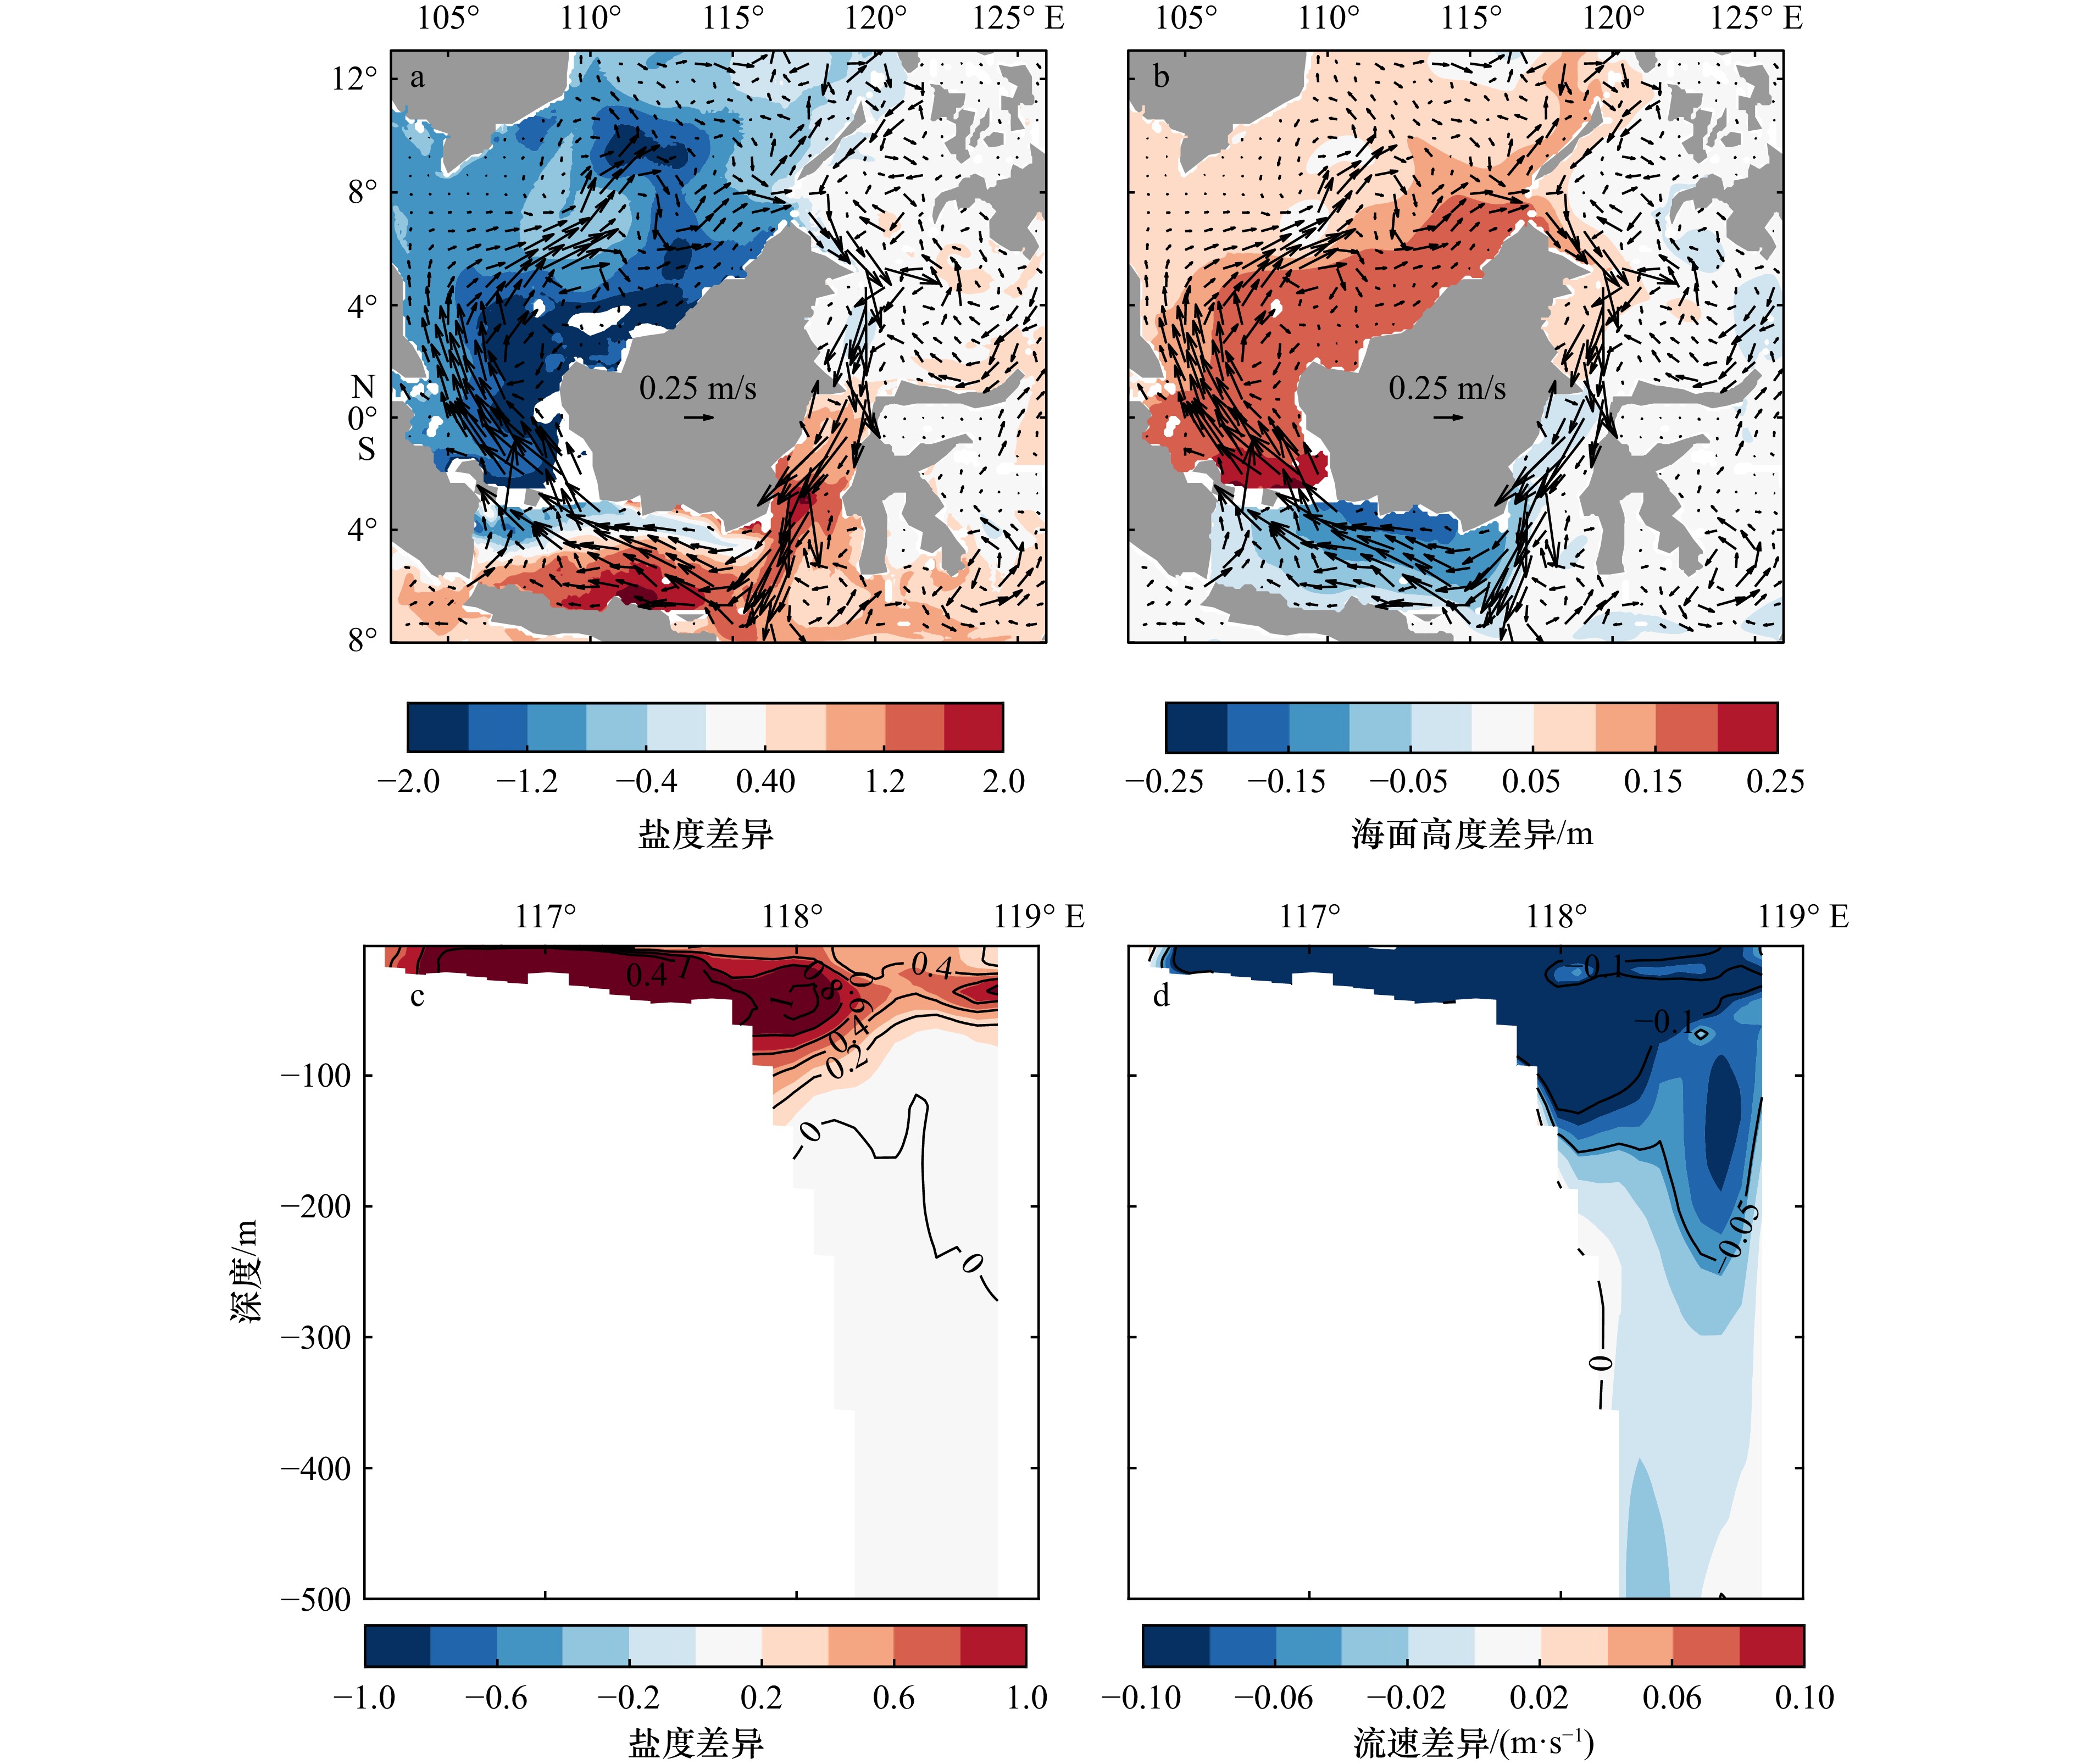
图 11 试验EXP3和EXP0之间的差异结果(2.7°S, 116.4°~119°E)
a.上层50 m平均盐度和流速(矢量)的差异,b.上层50 m平均海面高度(SSH)和流速(矢量)的差异;c.望加锡海峡垂直剖面的盐度差异,d.望加锡海峡垂直剖面的经向流速$ v $差异
Fig. 11 Differences between EXP3 and EXP0 (2.7°S, 116.4°−119°E)
Differences of salinity (a), SSH (b) and current velocity (vector) averaged over the upper 50 m. Differences of salinity (c) and meridional velocity $ v $ (d) along the vertical profile of the Makassar Strait
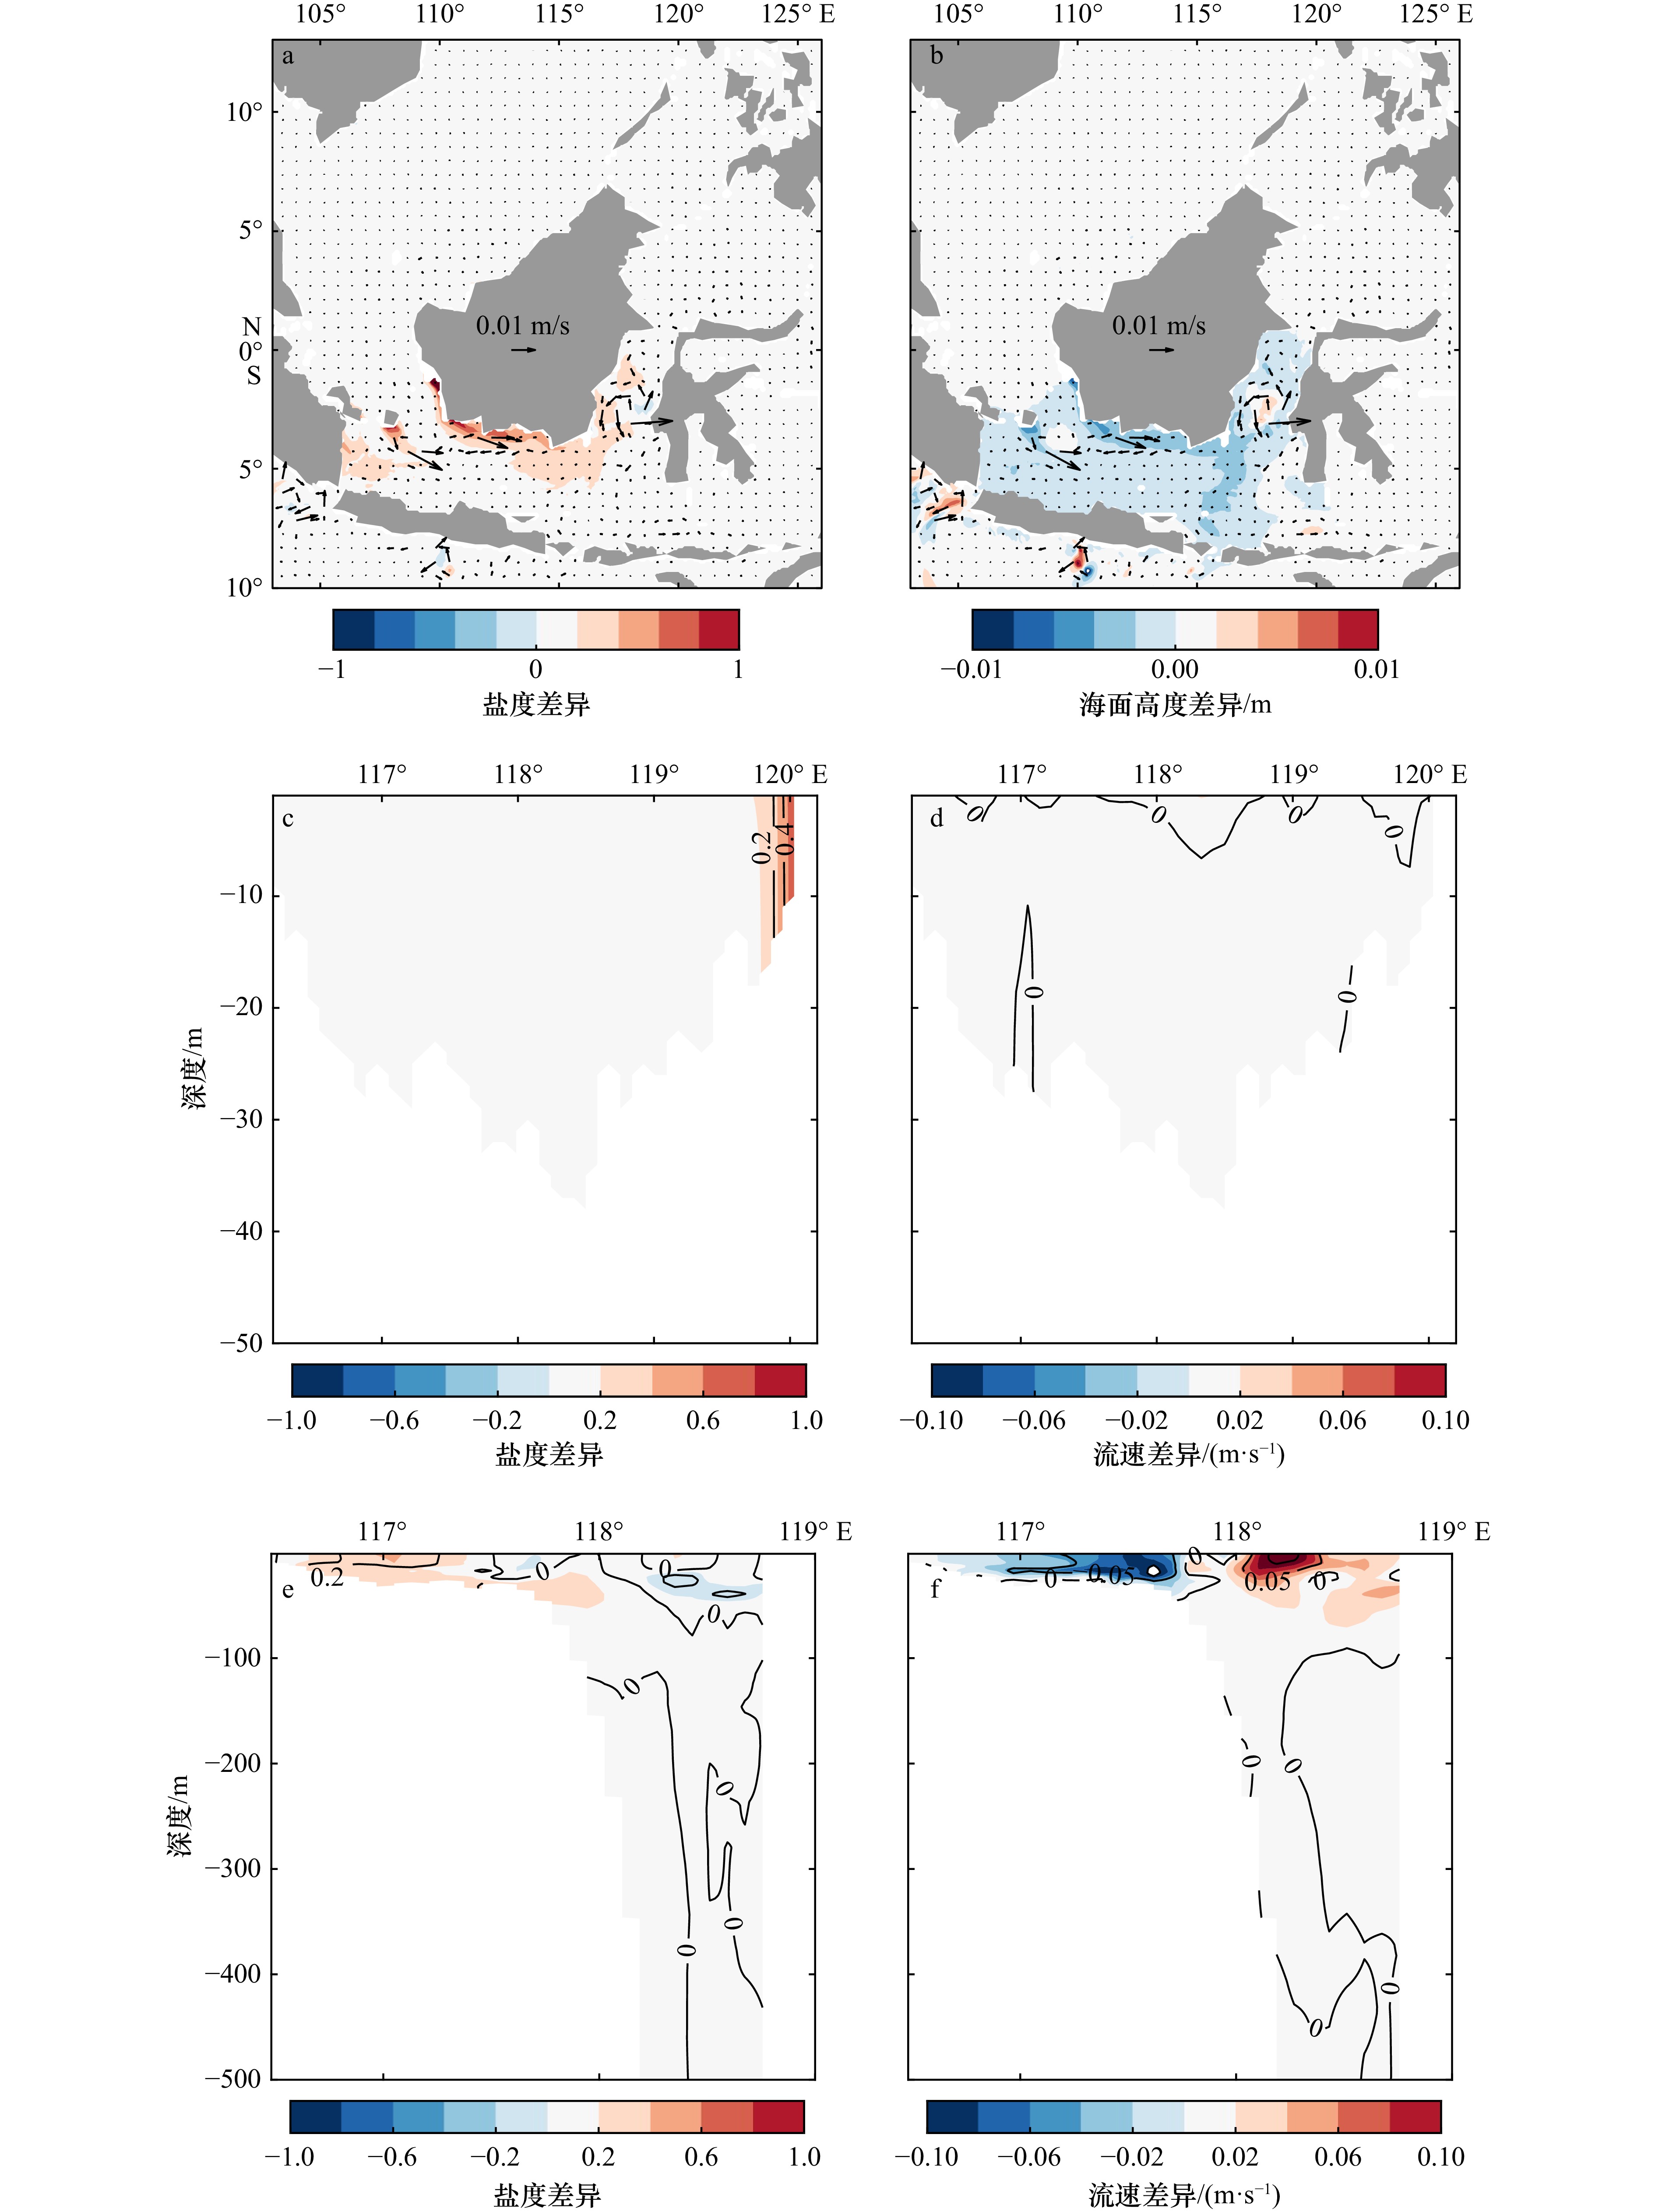
图 12 试验EXP4和EXP0之间的差异结果
a.上层50 m平均盐度的差异,b.上层50 m平均海面高度(SSH)和流速(矢量)的差异;c.卡里马塔海峡垂直剖面的盐度差异,d.卡里马塔海峡垂直剖面的经向流速v差异;e.望加锡海峡垂直剖面的盐度差异,f. 望加锡海峡垂直剖面的经向流速v差异
Fig. 12 Differences between EXP4 and EXP0
Differences of salinity (a), SSH and current velocity (vector) (b) averaged over the upper 50 m. Differences of salinity (c) and meridional velocity v (d) along the vertical profile of the Karimata Strait. Differences of salinity (e) and meridional velocity v (f) along the vertical profile of the Makassar Strait
表 1 模式垂直分层系数(Cs_w为S坐标下垂向速度w的分层系数,Cs_r为S坐标下水平温度盐度密度流速的分层系数)
Tab. 1 Vertical layer coefficient of the model (Cs_w is S-coordinate at w-points, while Cs_r is S-coordinate stretching curves at RHO-points)
分层系数 1层 2层 3层 4层 5层 6层 7层 8层 9层 10层 Cs_w −1 − 0.88725 − 0.78446 − 0.69138 − 0.60759 − 0.53253 − 0.46559 − 0.40612 − 0.35345 − 0.30695 Cs_r − 0.94237 − 0.83462 − 0.73673 − 0.64836 −0.569 − 0.49808 − 0.43496 − 0.37897 − 0.32947 − 0.28582 分层系数 11层 12层 13层 14层 15层 16层 17层 18层 19层 20层 Cs_w − 0.26599 −0.23 − 0.19843 − 0.17078 − 0.14662 − 0.12551 − 0.10711 − 0.09109 − 0.07715 − 0.06504 Cs_r − 0.24741 − 0.21369 − 0.18415 − 0.15829 − 0.1357 −0.116 − 0.09882 − 0.08388 − 0.07088 − 0.0596 分层系数 21层 22层 23层 24层 25层 26层 27层 28层 29层 30层 Cs_w − 0.05453 − 0.04543 − 0.03756 − 0.03077 − 0.02493 − 0.01992 − 0.01565 − 0.01203 − 0.00899 − 0.00646 Cs_r − 0.04982 − 0.04136 − 0.03404 − 0.02774 − 0.02233 − 0.0177 − 0.01376 − 0.01044 − 0.00766 − 0.00538 分层系数 31层 32层 33层 34层 35层 36层 Cs_w − 0.00441 − 0.00278 − 0.00155 − 0.00068 − 0.00017 0 Cs_r − 0.00354 − 0.00211 − 0.00107 − 0.00038 −4.2 × 10⁻⁵  下载: 导出CSV
表 2 松弛试验的松弛系数
$ \alpha \left(i\right) $ Tab. 2 The relaxation coefficient
$ \alpha \left(i\right) $ for the relaxation experiment试验 每组试验的α(i) 卡里马塔海峡盐度
松弛试验EXP1EXP1A
α(1)EXP1B
α(2)EXP1C
α(3)EXP1D
α(4)EXP1E
α(5)EXP1F
α(6)EXP1G
α(7)EXP1H
α(8)EXP1I
α(9)EXP1J
α(10)−0.5 −0.4 −0.3 −0.2 −0.1 0.1 0.2 0.3 0.4 0.5 望加锡海峡盐度
松弛试验EXP2EXP2A
α(1)EXP2B
α(2)EXP2C
α(3)EXP2D
α(4)EXP2E
α(5)EXP2F
α(6)EXP2G
α(7)EXP2H
α(8)EXP2I
α(9)EXP2J
α(10)−0.5 −0.4 −0.3 −0.2 −0.1 0.1 0.2 0.3 0.4 0.5
下载: 导出CSV
表 3 卡里马塔海峡体积输运部分观测数据与模式结果(单位:Sv)
Tab. 3 Partial observed data and model results of volume transport in the Karimata Strait (unit: Sv)
文献 冬季 夏季 方法 Wyrtki[38] −4.5 3.0 基于观测数据 Susanto等[39] −2.7 1.2 基于观测数据 Fang等[14] −3.6 / 基于观测数据 Wang等[40] −3.72 1.86 基于观测数据 Xu和Malanotte-Rizzoli[17] −3.6 1.1 基于观测数据 Wang等[20] −1.99 0.69 基于观测数据 Xu等[21] −1.98 ± 0.23 0.47 ± 0.20 基于观测数据 Fang等[11] −4.22 1.54 海洋数值模式 Yu等[41] 超过−3 接近 0 海洋数值模式 Fang等[42] 超过−3 接近−1 海洋数值模式 He等[19] 超过−4 接近−1 海洋数值模式 本文模式结果 −3.42 1.20 海洋数值模式 注:符号仅代表方向,负号为南向流。
下载: 导出CSV
表 4 在试验EXP0、 EXP1A和EXP1J中通过卡里马塔海峡和望加锡海峡的流量及松弛试验与基准试验之差
Tab. 4 The flux of Karimata Strait and Makassar Strait in EXP0, EXP1A and EXP1J, and differences between relaxation experiments and EXP0
各海峡通量 EXP0 EXP1A EXP1J 值 值 差值 百分比 值 差值 百分比 卡里马塔海峡 体积通量/Sv −3.42 −3.37 0.05 1.57% −3.52 0.15 4.31% 热通量/TW −382.17 −381.56 0.61 0.16% −387.25 5.09 1.33% 淡水通量/mSV −253.01 −294.44 44.43 16.37% −184.03 68.99 27.27% 望加锡海峡(上50 m) 体积通量/Sv −0.08 −0.07 0.01 12.5% −0.11 0.03 34.69% 热通量/TW −7.17 −6.78 0.39 5.42% −10.23 3.06 42.67% 淡水通量/mSV 9.58 19.30 9.72 101.52% −7.58 17.16 179.18% 望加锡海峡(全水深) 体积通量/Sv −11.11 −11.12 0.01 0.09% −11.11 0 0 热通量/TW −599.03 −599.08 0.05 0.01% −599.04 0.01 0 淡水通量/mSV 12.24 19.01 6.77 55.36% −2.43 14.67 119.87% 注:红色表示正值,蓝色表示负值。
下载: 导出CSV
表 5 在试验EXP0、 EXP2A和EXP2J中通过卡里马塔海峡和望加锡海峡的流量及松弛试验与基准试验之差
Tab. 5 The flux of Karimata Strait and Makassar Strait in EXP0, EXP2A and EXP2J, and differences between relaxation experiments and EXP0
各海峡通量 EXP0 EXP2A EXP2J 值 值 差值 百分比 值 差值 百分比 卡里马塔海峡 体积通量/Sv −3.42 −3.35 0.08 2.21% −3.51 0.09 2.65% 热通量/TW −382.17 −376.01 6.16 1.61% −389.87 7.70 2.02% 淡水通量/mSV −253.01 −249.07 3.94 1.56% −257.72 4.70 1.86% 望加锡海峡(上50 m) 体积通量/Sv −0.08 −0.82 0.74 910.49% 0.77 0.85 1044.57 %热通量/TW −7.17 −83.50 76.33 1065.50 %82.53 89.70 1250.99 %淡水通量/mSV 9.57 −40.85 50.43 526.66% 31.54 21.97 229.43% 望加锡海峡(全水深) 体积通量/Sv −11.11 −15.35 4.24 38.17% −6.27 4.84 43.55% 热通量/TW −599.03 −440.83 158.20 26.41% −531.70 67.33 11.24% 淡水通量/mSV 12.24 −321.21 333.45 2724.98 %296.94 284.71 2326.68 %注:红色表示正值,蓝色表示负值。
下载: 导出CSV
表 6 在试验EXP0、 EXP1J,EXP3和EXP4中通过卡里马塔海峡和望加锡海峡的流量及敏感性试验与基准试验之差
Tab. 6 The flux of Karimata Strait and Makassar Strait in EXP0, EXP1J, EXP3, and EXP4, and differences between sensitivity experiments and EXP0
各海峡通量 EXP0 EXP1J (盐度松弛试验) EXP3 (海峡封闭试验) EXP4 (降水改变试验) 值 值 差值 百分比 值 差值 百分比 值 差值 百分比 卡里马塔海峡 体积通量/Sv −3.42 −3.52 0.15 4.31% −3.45 0.03 0.82% 热通量/TW −382.17 −387.25 5.09 1.33% −384.70 2.53 0.66% 淡水通量/mSV −253.01 −184.03 68.99 27.27% −250.71 2.30 0.91% 望加锡海峡(上50 m) 体积通量/Sv −0.08 −0.11 0.03 34.69% −3.84 3.76 4635.80 %−0.11 0.02 32.84% 热通量/TW −7.17 −10.23 3.06 42.67% −415.36 408.19 5692.67 %−9.27 2.10 29.29% 淡水通量/mSV 9.57 −7.58 17.16 179.18% −126.45 136.02 1420.63 %7.47 2.11 21.99% 望加锡海峡(全水深) 体积通量/Sv −11.11 −11.11 0.00 0.004% −15.69 4.58 41.25% −11.13 0.02 0.16% 热通量/TW −599.03 −599.04 0.02 0.003% − 1020.89 421.84 70.42% −600.16 1.14 0.19% 淡水通量/mSV 12.24 −2.43 14.69 119.87% −130.64 142.88 1167.63 %10.74 1.49 12.20% 注:红色表示正值,蓝色表示负值。
下载: 导出CSV
-
[1] Gordon A L, Sprintall J, Van Aken H M, et al. The Indonesian throughflow during 2004−2006 as observed by the INSTANT program[J]. Dynamics of Atmospheres and Oceans, 2010, 50(2): 115−128. doi: 10.1016/j.dynatmoce.2009.12.002 [2] Gordon A L, Napitu A, Huber B A, et al. Makassar strait throughflow seasonal and interannual variability: an overview[J]. Journal of Geophysical Research: Oceans, 2019, 124(6): 3724−3736. doi: 10.1029/2018JC014502 [3] Sprintall J, Wijffels S E, Molcard R, et al. Direct estimates of the Indonesian throughflow entering the Indian Ocean: 2004−2006[J]. Journal of Geophysical Research: Oceans, 2009, 114(C7): C07001. doi: 10.1029/2008JC005257 [4] Sprintall J, Gordon A L, Wijffels S E, et al. Detecting change in the Indonesian seas[J]. Frontiers in Marine Science, 2019, 6: 257. doi: 10.3389/fmars.2019.00257 [5] Susanto R D, Ffield A, Gordon A L, et al. Variability of Indonesian throughflow within Makassar Strait, 2004−2009[J]. Journal of Geophysical Research: Oceans, 2012, 117(C9): C09013. doi: 10.1029/2012JC008096 [6] Wijffels S E, Meyers G, Godfrey J S. A 20-yr average of the Indonesian Throughflow: Regional currents and the interbasin exchange[J]. Journal of Physical Oceanography, 2008, 38(9): 1965−1978. doi: 10.1175/2008jpo3987.1 [7] Tillinger D, Gordon A L. Transport weighted temperature and internal energy transport of the Indonesian Throughflow[J]. Dynamics of Atmospheres and Oceans, 2010, 50(2): 224−232. doi: 10.1016/j.dynatmoce.2010.01.002 [8] Xie Tengxiang, Newton R, Schlosser P, et al. Long-term mean mass, heat and nutrient flux through the Indonesian Seas, based on the Tritium Inventory in the Pacific and Indian Oceans[J]. Journal of Geophysical Research: Oceans, 2019, 124(6): 3859−3875. doi: 10.1029/2018jc014863 [9] Zhang Tiecheng, Wang Weiqiang, Xie Qiang, et al. Heat contribution of the Indonesian throughflow to the Indian Ocean[J]. Acta Oceanologica Sinica, 2019, 38(4): 72−79. doi: 10.1007/s13131-019-1414-6 [10] Fang Guohong, Wei Zexun, Choi B H, et al. Interbasin freshwater, heat and salt transport through the boundaries of the East and South China Seas from a variable-grid global ocean circulation model[J]. Science in China Series D: Earth Sciences, 2003, 46(2): 149−161. doi: 10.1360/03yd9014 [11] Fang Guohong, Susanto D, Soesilo I, et al. A note on the South China Sea shallow interocean circulation[J]. Advances in Atmospheric Sciences, 2005, 22(6): 946−954. doi: 10.1007/BF02918693 [12] Qu Tangdong, Du Yan, Sasaki H. South China Sea throughflow: a heat and freshwater conveyor[J]. Geophysical Research Letters, 2006, 33(23): L23617. doi: 10.1029/2006GL028350 [13] Wang Dongxiao, Liu Qinyan, Huang Ruixin, et al. Interannual variability of the South China Sea Throughflow inferred from wind data and an ocean data assimilation product[J]. Geophysical Research Letters, 2006, 33(14): L14605. doi: 10.1029/2006GL026316 [14] Fang Guohong, Susanto R D, Wirasantosa S, et al. Volume, heat, and freshwater transports from the South China Sea to Indonesian seas in the boreal winter of 2007−2008[J]. Journal of Geophysical Research: Oceans, 2010, 115(C12): C12020. doi: 10.1029/2010JC006225 [15] Sprintall J, Gordon A L, Flament P, et al. Observations of exchange between the South China Sea and the Sulu Sea[J]. Journal of Geophysical Research: Oceans, 2012, 117(C5): C05036. doi: 10.1029/2011JC007610 [16] 刘钦燕, 王东晓, 谢强, 等. 印尼贯穿流与南海贯穿流的年代际变化特征及机制[J]. 热带海洋学报, 2007, 26(6): 1−6. doi: 10.3969/j.issn.1009-5470.2007.06.001Liu Qinyan, Wang Dongxiao, Xie Qiang, et al. Decadal variability of Indonesian throughflow and South China Sea throughflow and its mechanism[J]. Journal of Tropical Oceanography, 2007, 26(6): 1−6. doi: 10.3969/j.issn.1009-5470.2007.06.001 [17] Xu Danya, Malanotte-Rizzoli P. The seasonal variation of the upper layers of the South China Sea (SCS) circulation and the Indonesian through flow (ITF): an ocean model study[J]. Dynamics of Atmospheres and Oceans, 2013, 63: 103−130. doi: 10.1016/j.dynatmoce.2013.05.002 [18] Du Yan, Qu Tangdong. Three inflow pathways of the Indonesian throughflow as seen from the simple ocean data assimilation[J]. Dynamics of Atmospheres and Oceans, 2010, 50(2): 233−256. doi: 10.1016/j.dynatmoce.2010.04.001 [19] He Zhigang, Feng Ming, Wang Dongxiao, et al. Contribution of the Karimata Strait transport to the Indonesian Throughflow as seen from a data assimilation model[J]. Continental Shelf Research, 2015, 92: 16−22. doi: 10.1016/j.csr.2014.10.007 [20] Wang Yan, Xu Tengfei, Li Shujiang, et al. Seasonal variation of water transport through the Karimata Strait[J]. Acta Oceanologica Sinica, 2019, 38(4): 47−57. doi: 10.1007/s13131-018-1224-2 [21] Xu Tengfei, Wei Zexun, Susanto R D, et al. Observed water exchange between the South China Sea and Java Sea through Karimata Strait[J]. Journal of Geophysical Research: Oceans, 2021, 126(2): e2020JC016608. doi: 10.1029/2020JC016608 [22] Gordon A L, Susanto R D, Vranes K. Cool Indonesian throughflow as a consequence of restricted surface layer flow[J]. Nature, 2003, 425(6960): 824−828. doi: 10.1038/nature02038 [23] Gordon A L, Huber B A, Metzger E J, et al. South China Sea throughflow impact on the Indonesian throughflow[J]. Geophysical Research Letters, 2012, 39(11): L11602. doi: 10.1029/2012GL052021 [24] Tozuka T, Qu Tangdong, Masumoto Y, et al. Impacts of the South China Sea throughflow on seasonal and interannual variations of the Indonesian Throughflow[J]. Dynamics of Atmospheres and Oceans, 2009, 47(1/3): 73−85. doi: 10.1016/j.dynatmoce.2008.09.001 [25] Li Mingting, Wei Jun, Wang Dongxiao, et al. Exploring the importance of the mindoro-sibutu pathway to the upper-layer circulation of the south china sea and the indonesian throughflow[J]. Journal of Geophysical Research: Oceans, 2019, 124(7): 5054−5066. doi: 10.1029/2018jc014910 [26] Jiang Guoqing, Wei Jun, Malanotte-Rizzoli P, et al. Seasonal and interannual variability of the subsurface velocity profile of the Indonesian throughflow at Makassar strait[J]. Journal of Geophysical Research: Oceans, 2019, 124(12): 9644−9657. doi: 10.1029/2018jc014884 [27] Lu Xi, Hu Shijian, Guan Cong, et al. Quantifying the contribution of salinity effect to the seasonal variability of the Makassar Strait throughflow[J]. Geophysical Research Letters, 2023, 50(21): e2023GL105991. doi: 10.1029/2023GL105991 [28] Shchepetkin A F, McWilliams J C. The regional oceanic modeling system (ROMS): a split-explicit, free-surface, topography-following-coordinate oceanic model[J]. Ocean Modelling, 2005, 9(4): 347−404. doi: 10.1016/j.ocemod.2004.08.002 [29] Haidvogel D B, Arango H, Budgell W P, et al. Ocean forecasting in terrain-following coordinates: formulation and skill assessment of the Regional Ocean Modeling System[J]. Journal of Computational Physics, 2008, 227(7): 3595−3624. doi: 10.1016/j.jcp.2007.06.016 [30] Shchepetkin A F, McWilliams J C. Computational kernel algorithms for fine-scale, multiprocess, longtime oceanic simulations[J]. Handbook of Numerical Analysis, 2009, 14: 121−183. doi: 10.1016/S1570-8659(08)01202-0 [31] Haidvogel D B, Arango H G, Hedstrom K, et al. Model evaluation experiments in the North Atlantic Basin: Simulations in nonlinear terrain-following coordinates[J]. Dynamics of Atmospheres and Oceans, 2000, 32(3/4): 239−281. doi: 10.1016/S0377-0265(00)00049-X [32] Chassignet E P, Smith L T, Halliwell G R, et al. North Atlantic simulations with the Hybrid Coordinate Ocean Model (HYCOM): impact of the vertical coordinate choice, reference pressure, and thermobaricity[J]. Journal of Physical Oceanography, 2003, 33(12): 2504−2526. doi: 10.1175/1520-0485(2003)033<2504:NASWTH>2.0.CO;2 [33] Locarnini R A, Mishonov A V, Antonov J I, et al. World Ocean Atlas 2013, Volume 1: Temperature[R]. Maryland: NOAA National Environmental Satellite, Data, and Information Service, 2013. [34] Hersbach H, Bell B, Berrisford P, et al. The ERA5 global reanalysis[J]. Quarterly Journal of the Royal Meteorological Society, 2020, 146(730): 1999−2049. doi: 10.1002/qj.3803 [35] Schneider D P, Deser C, Fasullo J, et al. Climate data guide spurs discovery and understanding[J]. Eos, Transactions American Geophysical Union, 2013, 94(13): 121−122. doi: 10.1002/2013EO130001 [36] Locarnini R A, Mishonov A V, Baranova O K. et al. World Ocean Atlas 2023, Volume 1: Temperature[R]. Maryland: NOAA National Environmental Satellite, Data, and Information Service, 2024. [37] Xu Tengfei, Wei Zexun, Zhao Haifeng, et al. Simulated Indonesian throughflow in Makassar Strait across the SODA3 products[J]. Acta Oceanologica Sinica, 2024, 43(1): 80−98. doi: 10.1007/s13131-023-2186-6 [38] Wyrtki K. Physical oceanography of the Southeast Asian waters (Vol. 2)[R]. La Jolla: University of California, Scripps Institution of Oceanography, 1961. [39] Susanto R D, Wei Zexun, Adi R T, et al. Observations of the Karimata Strait througflow from December 2007 to November 2008[J]. Acta Oceanologica Sinica, 2013, 32(5): 1−6. doi: 10.1007/s13131-013-0307-3 [40] Wang Weiwen, Wang Dongxiao, Zhou Wen, et al. Impact of the South China Sea throughflow on the Pacific low-latitude western boundary current: a numerical study for seasonal and interannual time scales[J]. Advances in Atmospheric Sciences, 2011, 28(6): 1367−1376. doi: 10.1007/s00376-011-0142-4 [41] Yu Z, Shen S, McCreary J P, et al. South China Sea throughflow as evidenced by satellite images and numerical experiments[J]. Geophysical Research Letters, 2007, 34(1): L01601. doi: 10.1029/2006GL028103 [42] Fang Guohong, Wang Yongang, Wei Zexun, et al. Interocean circulation and heat and freshwater budgets of the South China Sea based on a numerical model[J]. Dynamics of Atmospheres and Oceans, 2009, 47(1/3): 55−72. doi: 10.1016/j.dynatmoce.2008.09.003 -


计量
- 文章访问数: 358
- HTML全文浏览量: 205
- PDF下载量: 45
- 被引次数: 0
