

A Study on Remote Sensing Monitoring of Nearshore Turbidity in Hong Kong Based on Sentinel-2
-
摘要: 浊度是评估水质状况的可靠指标之一,通过浊度监测能够有效反映水体健康状况,保障生态系统的可持续发展和水资源的安全利用。本文利用2016-2023年的Sentinel-2 MSI影像,通过构建遥感定量反演模型,分析8年间香港近海浊度的时空分布特征和变化规律,并探究其主要影响因素。对比传统经验模型、随机森林(RF)模型、梯度提升决策树(GBDT)模型、K最近邻(KNN)模型,基于RF的浊度反演模型精度最高(R2=0.71,RMSE=1.77 NTU,MAE=1.44 NTU)。结果表明,年均水体浊度的变化范围为4.02-4.16 NTU,近8年呈波动下降趋势(−
0.0243 NTU/a),且空间分布呈西北高东南低的特点;季均水体浊度从高到低依次为冬季(4.54 NTU)、秋季(4.03 NTU)、春季(3.86 NTU)、夏季(3.76 NTU)。本文利用气象数据及香港地区的污水处理投资数据,从自然环境和人类活动两方面分析影响浊度时空分布的因素。香港近海水体浊度与入海径流量、气温呈负相关关系,并受到香港污水处理这一人为因素的影响,此外热带气旋活动期内的降水量和风速与水体浊度变化显著相关。-
关键词:
- 香港近海 /
- 浊度 /
- Sentinel-2 /
- 遥感反演 /
- 时空分布
Abstract: Turbidity is a reliable indicator for assessing water quality conditions. Turbidity monitoring can effectively reflect the health status of water bodies and guarantee the sustainable development of ecosystems and the safe utilization of water resources. In this study, Sentinel-2 MSI images from 2016 to 2023 were employed in the construction of a quantitative inversion model based on measured data. The temporal and spatial distribution characteristics and variation rules of water turbidity in the Hong Kong coastal waters over the past eight years were analyzed, and the main influencing factors were explored. In comparison to the traditional empirical model, random forest (RF) model, gradient boosted decision tree (GBDT) model, and K Nearest Neighbor (KNN) model, the RF-based turbidity inversion model had the highest accuracy (R2 = 0.708, RMSE = 1.774 NTU, MAE = 1.439 NTU). The results demonstrate that the annual average turbidity of the water body fluctuates between 4.02 and 4.16 NTU, exhibiting a downward trend over the past eight years (-0.0243 NTU/a). Additionally, the spatial distribution is high in the north-west and low in the south-east. The seasonal average water turbidity, in descending order, was as follows: winter (4.54 NTU), autumn (4.03 NTU), spring (3.86 NTU) and summer (3.76 NTU). Utilizing meteorological data and investment data on sewage treatment in Hong Kong, we analyzed the factors affecting the spatial and temporal distribution of turbidity in terms of the natural environment and human activities. Turbidity in Hong Kong's offshore waters exhibits a negative correlation with inlet runoff and air temperature. Additionally, it is influenced by the anthropogenic factor of sewage treatment in Hong Kong. Furthermore, there is a significant correlation between precipitation and wind speed during the period of tropical cyclone activity and the change in turbidity in the water column. -

图 2 验证数据集反演模型性能比较
Fig. 2 Comparison of inversion model performance for validation dataset
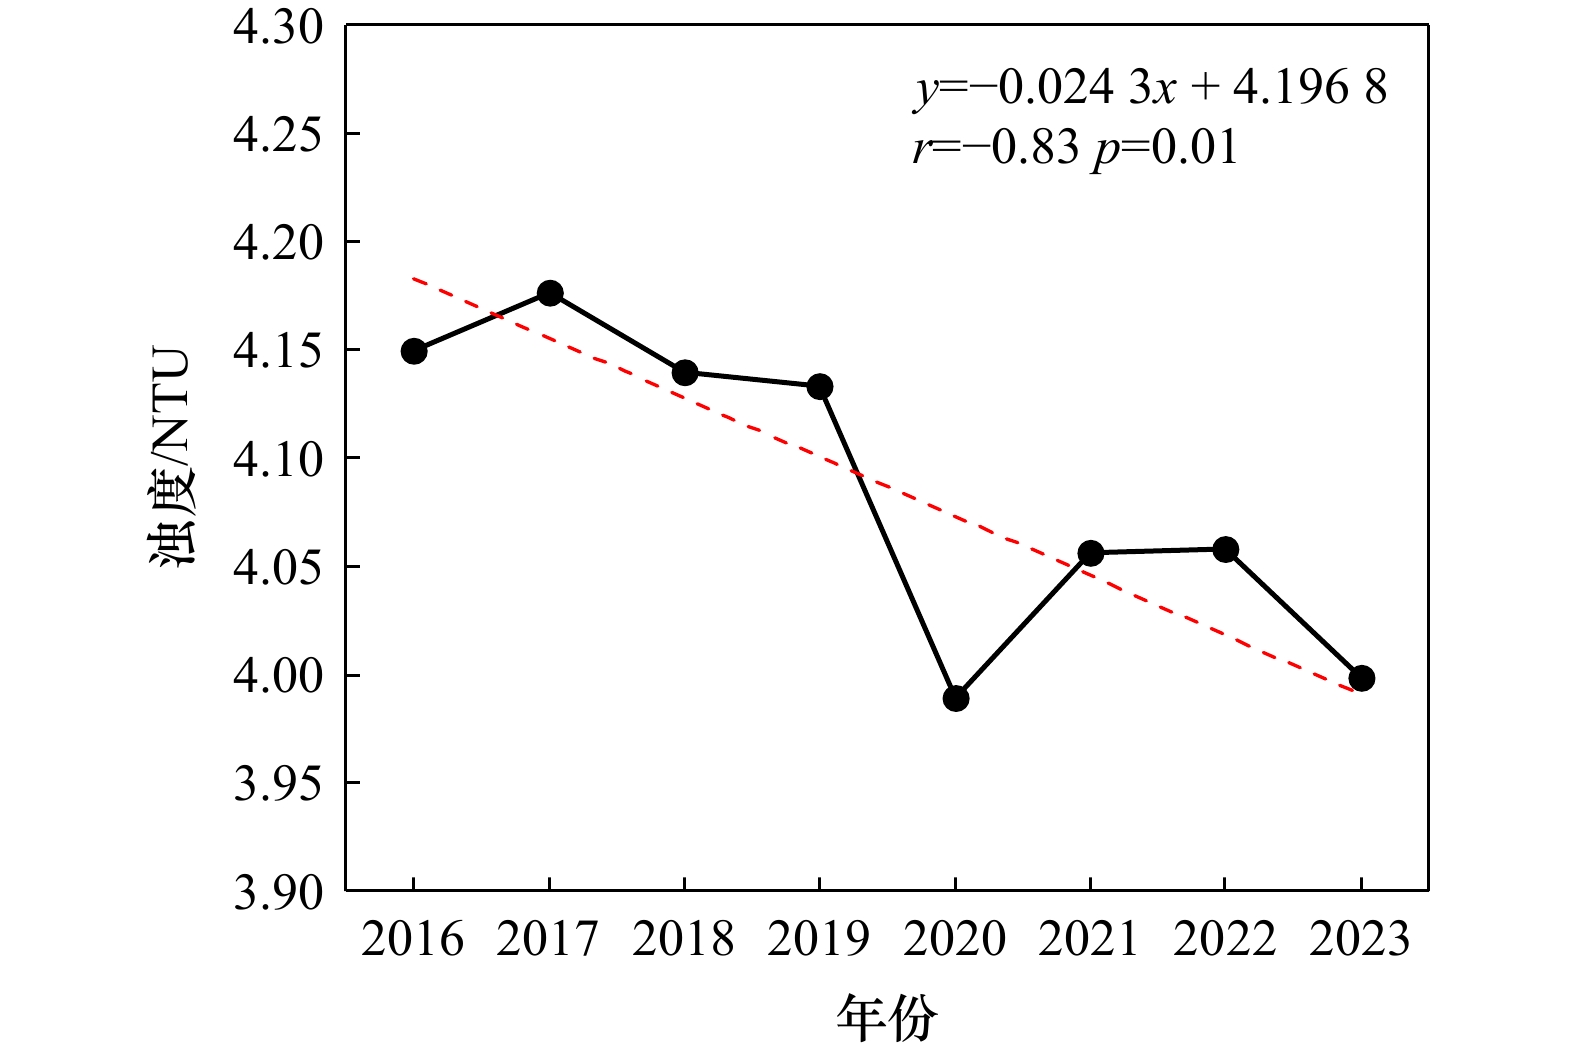
图 3 2016−2023年研究区域浊度年均变化
Fig. 3 Annual mean change of turbidity in the study area from 2016 to 2023
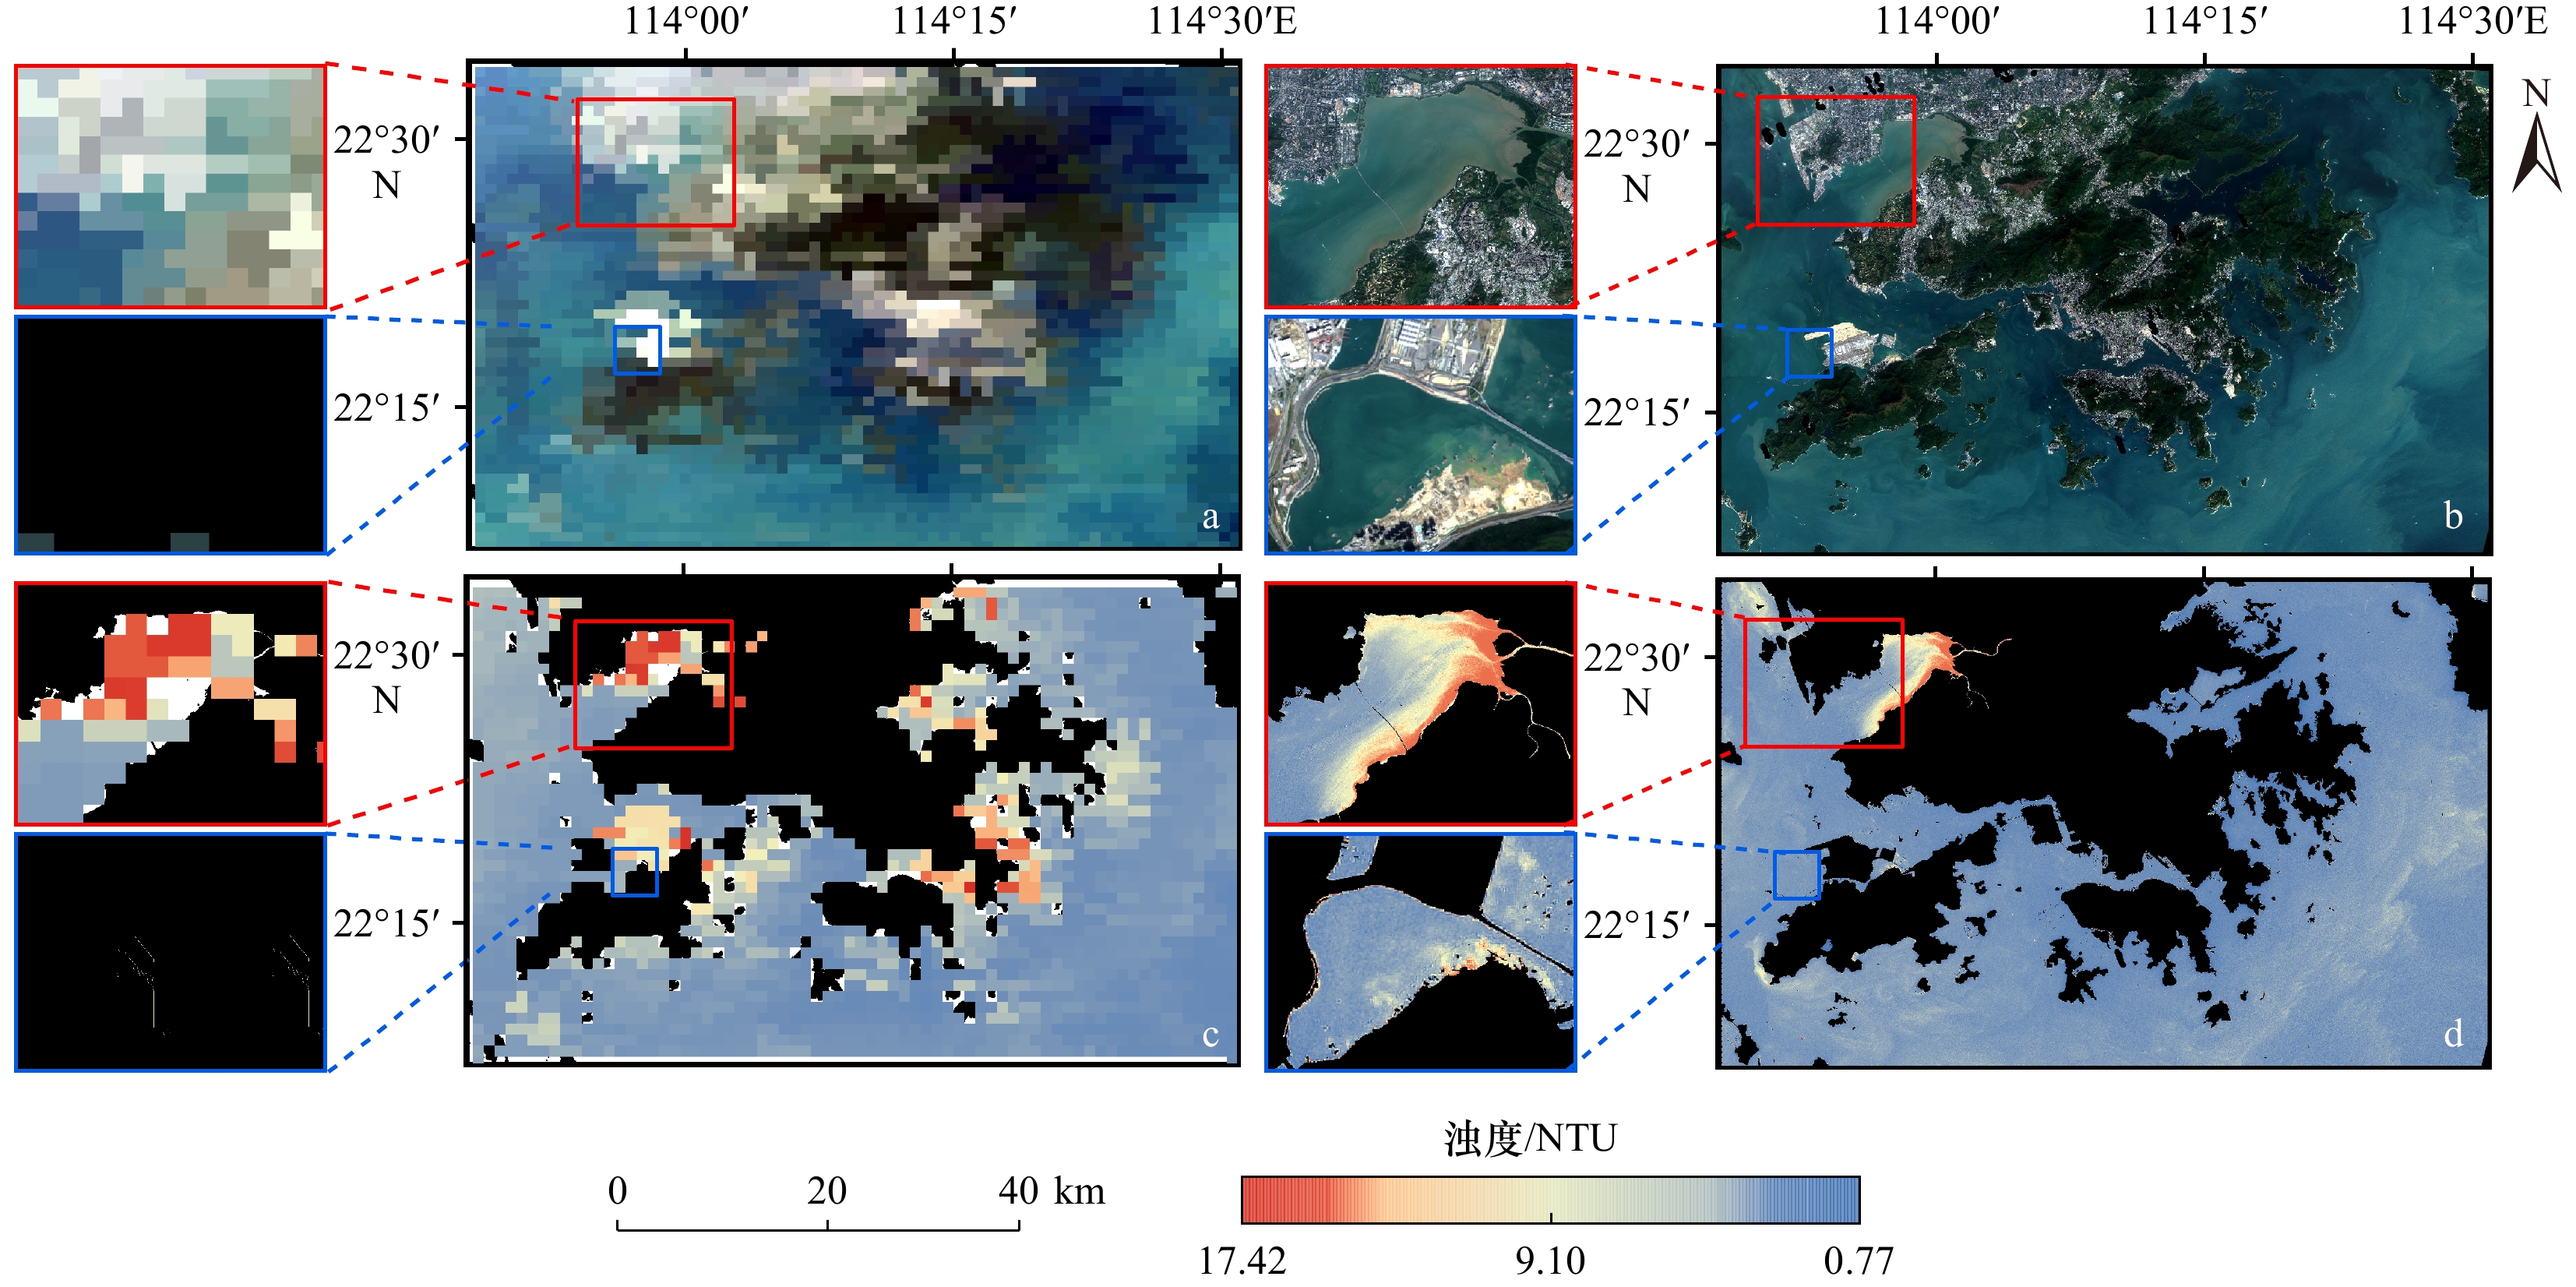
图 4 2020年11月5日MODIS真彩色影像(a)、Sentinel-2 MSI真彩色影像(b)及MODIS浊度空间分布反演图(c)、Sentinel-2浊度空间分布反演图(d)
Fig. 4 MODIS true-color imagery (a), Sentinel-2 MSI true-color imagery (b) and inversion of MODIS spatial distribution of turbidity (c) and Sentinel-2 spatial distribution of turbidity (d) for 5 November 2020

图 5 2016−2023年香港近海浊度逐年均值分布
Fig. 5 Annual mean distribution of turbidity in the offshore waters of Hong Kong from 2016 to 2023

图 6 2016−2023年香港近海浊度月均分布
Fig. 6 Monthly mean distribution of turbidity in the offshore waters of Hong Kong from 2016 to 2023

图 7 香港近海浊度季均值(a、b、c、d)和年均值(e)分布
Fig. 7 Seasonal mean (a, b, c, d) and annual mean (e) distribution of turbidity in the offshore waters of Hong Kong
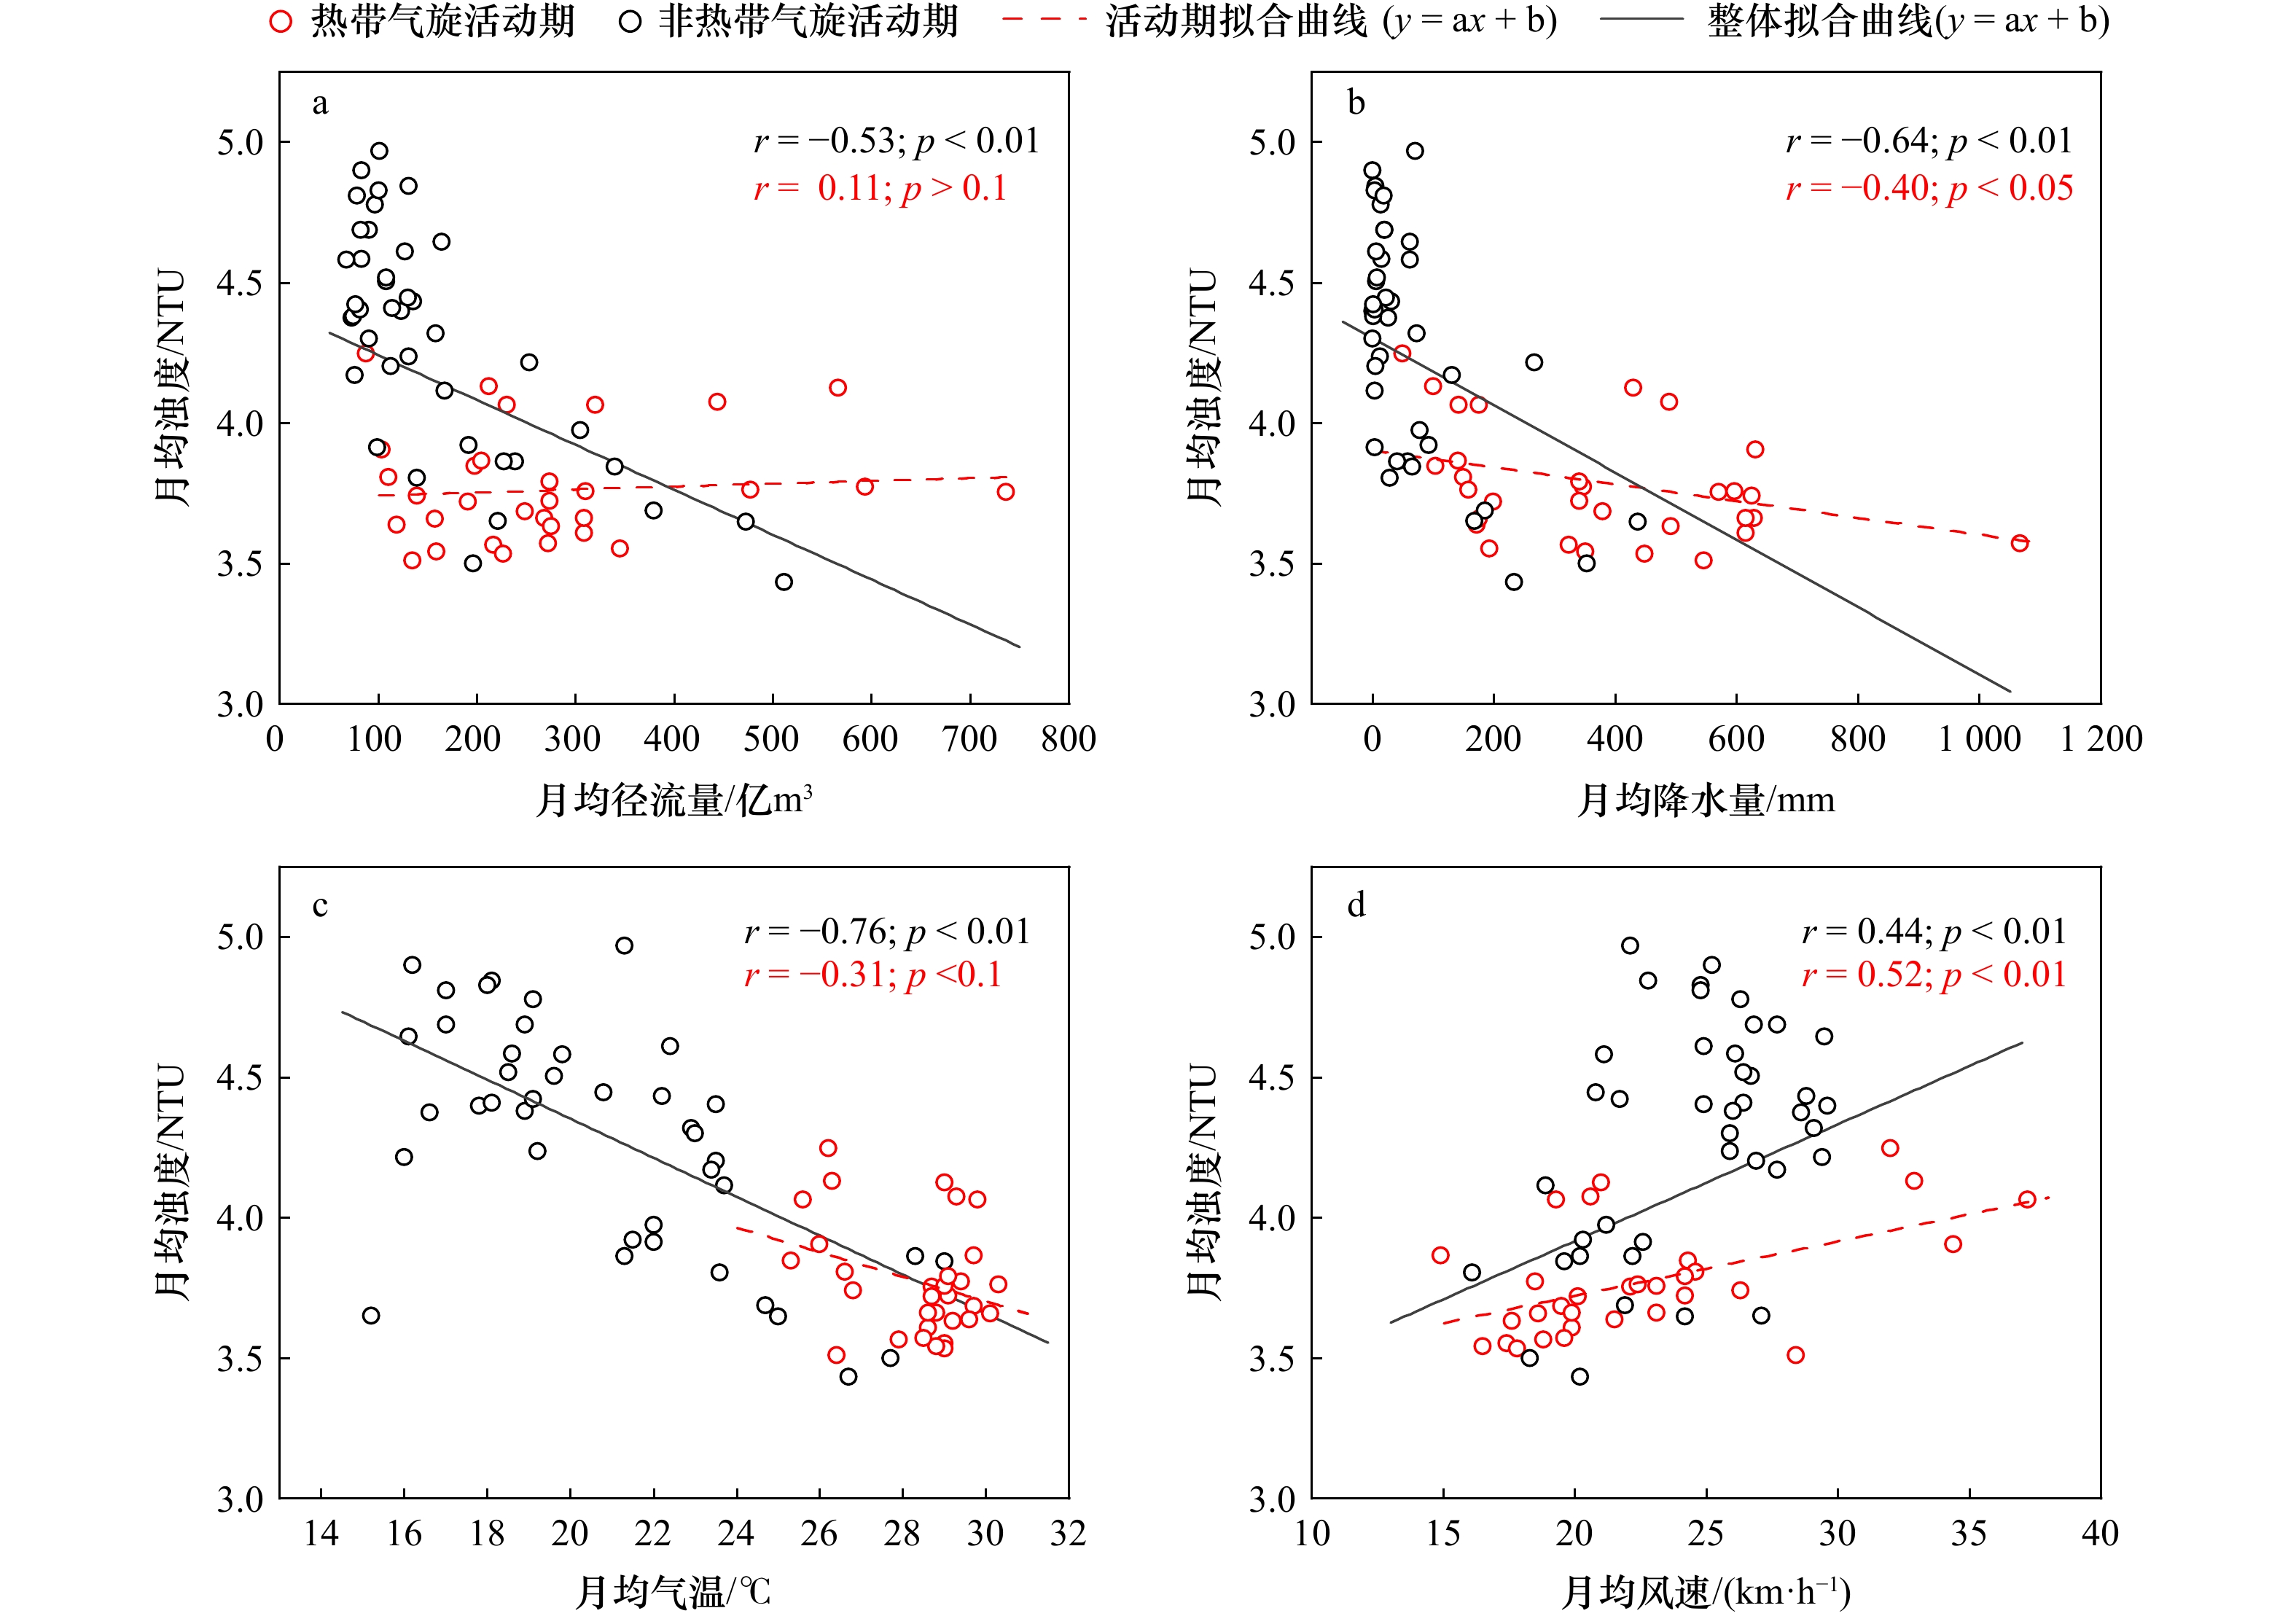
图 8 香港近海月均浊度与入海径流量(a)、降水量(b)、气温(c)、风速(d)的关系
Fig. 8 Relationship between monthly mean turbidity and inlet runoff (a), precipitation (b), air temperature (c) and wind speed (d) in the Hong Kong offshore waters
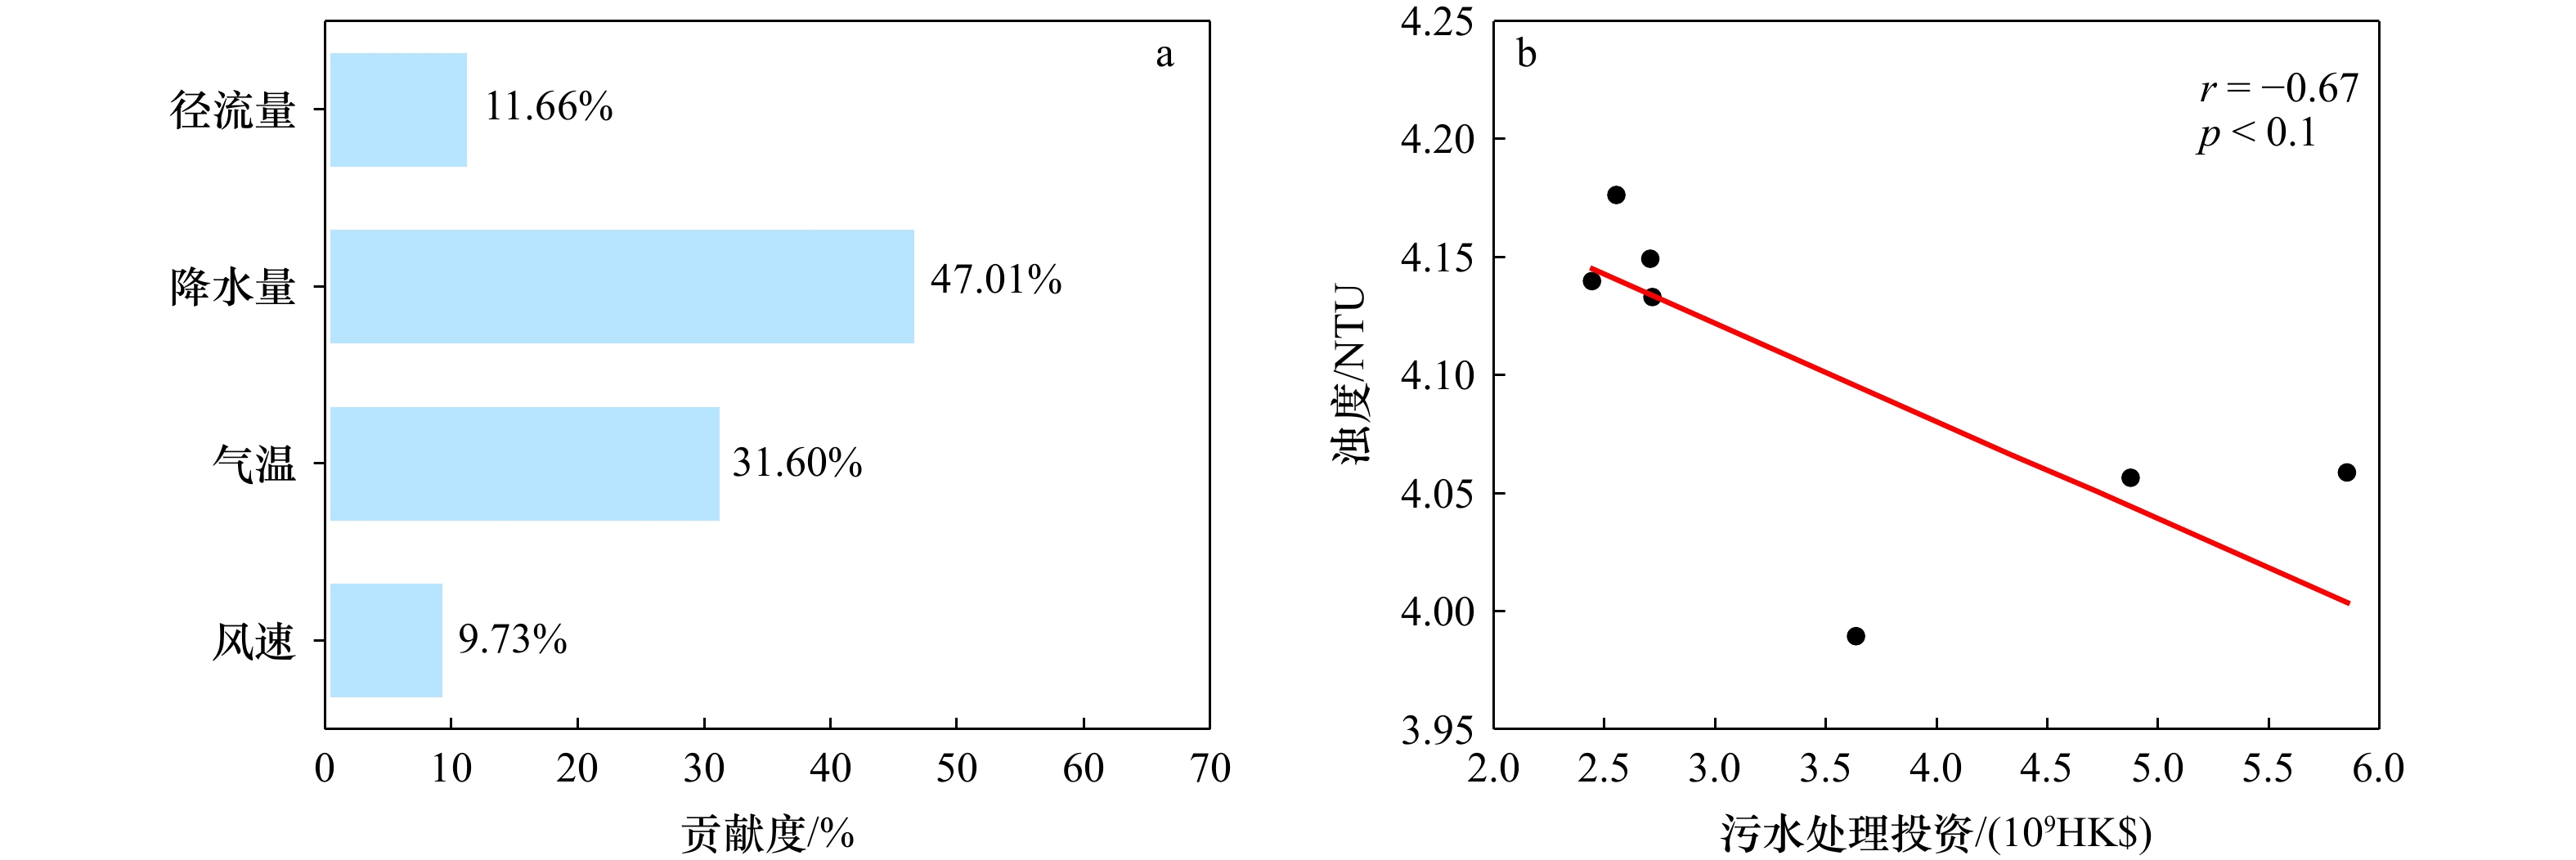
图 9 自然环境因素贡献度(a)及香港近海年均浊度与污水处理投资的关系(b)
Fig. 9 Contribution of natural environmental factors and relationship between annual mean turbidity and investment data on sewage treatment in the Hong Kong offshore waters
表 1 Sentinel-2 MSI影像光谱波段信息
Tab. 1 Sentinel-2 MSI image spectral band information
波段号 波段 中心波长(μm) 空间分辨率(m) 波段号 波段 中心波长(μm) 空间分辨率(m) B1 气溶胶 0.443 60 B8 近红外 0.842 10 B2 蓝 0.490 10 B8A 窄波近红外 0.865 20 B3 绿 0.560 10 B9 水蒸气 0.945 60 B4 红 0.665 10 B10 卷云 1.375 60 B5 红边1 0.705 20 B11 短波红外 1.610 20 B6 红边2 0.740 20 B12 短波红外 2.190 20 B7 红边3 0.783 20  下载: 导出CSV
表 2 经验模型表达式及机器学习模型最优参数组合
Tab. 2 Empirical model expressions and optimal parameter combinations for machine learning models
模型 变量 表达式/参数 多项式模型 LH456 y = 666.14x2 + 76.2x + 4.11 指数函数模型 B3-B2,(B3+B5)/(B2/B3) ${ \mathrm{y}=1.95{\mathrm{e}}^{(3.56{\mathrm{x}}_{1}+0.68{\mathrm{x}}_{2})} }$ RF B4,
B5,
B3-B2,
LH456,
LH567,
(B3+B5)/(B2/B3)n_estimators:25
min_samples_split:4
max_depth:15GBDT n_estimators:100
learning_rate:0.08
min_samples_split:3
max_depth:5KNN n_neighbors:15
algorithm:kd_tree
weights:uniform注:在多项式模型中,变量x为LH456;指数函数模型中变量x1、x2分别为B3-B2,(B3+B5)/(B2/B3)。
下载: 导出CSV
表 3 Sentinel-2典型波段及波段组合与浊度的相关性分析
Tab. 3 Correlation analysis of typical Sentinel-2 bands and band combinations with turbidity
波段组合 相关系数 波段组合 相关系数 B4 0.42** LH456 0.76** B5 0.42** LH567 −0.69** B3-B2 0.60** (B3+B5)/(B2/B3) 0.57** 注:**表示相关性在0.01水平上显著
下载: 导出CSV
表 4 建模数据集各模型性能对比
Tab. 4 Comparison of the performance of each model in the modelled dataset
模型 R2 RMSE MAE 多项式模型 0.67 1.97 2.36 指数函数模型 0.59 2.07 1.52 RF 0.91 1.11 0.68 GBDT 0.80 1.55 1.28 KNN 0.63 1.20 1.27
下载: 导出CSV
-
[1] Dogliotti A I, Ruddick K G, Nechad B, et al. A single algorithm to retrieve turbidity from remotely-sensed data in all coastal and estuarine waters[J]. Remote Sensing of Environment, 2015, 156: 157−168. doi: 10.1016/j.rse.2014.09.020 [2] Nienhuis J H, Ashton A D, Edmonds D A, et al. Global-scale human impact on delta morphology has led to net land area gain[J]. Nature, 2020, 577(7791): 514−518. doi: 10.1038/s41586-019-1905-9 [3] McCarthy M J, Muller-Karger F E, Otis D B, et al. Impacts of 40 years of land cover change on water quality in Tampa Bay, Florida[J]. Cogent Geoscience, 2018, 4(1): 1422956. doi: 10.1080/23312041.2017.1422956 [4] Li Jian, Chen Xiaoling, Tian Liqiao, et al. Improved capabilities of the Chinese high-resolution remote sensing satellite GF-1 for monitoring suspended particulate matter (SPM) in inland waters: radiometric and spatial considerations[J]. ISPRS Journal of Photogrammetry and Remote Sensing, 2015, 106: 145−156. doi: 10.1016/j.isprsjprs.2015.05.009 [5] Liu Ge, Li Lin, Song Kaishan, et al. An OLCI-based algorithm for semi-empirically partitioning absorption coefficient and estimating chlorophyll a concentration in various turbid case-2 waters[J]. Remote Sensing of Environment, 2020, 239: 111648. doi: 10.1016/j.rse.2020.111648 [6] Peterson K T, Sagan V, Sloan J J. Deep learning-based water quality estimation and anomaly detection using Landsat-8/Sentinel-2 virtual constellation and cloud computing[J]. GIScience & Remote Sensing, 2020, 57(4): 510−525. [7] Zheng Lufei, Qiu Zhongfeng, Zhou Yan, et al. Comparisons of algorithms to estimate water turbidity in the coastal areas of China[J]. International Journal of Remote Sensing, 2016, 37(24): 6165−6186. doi: 10.1080/01431161.2016.1256510 [8] Wang Shengqiang, Mao Ying, Zheng Lufei, et al. Remote sensing of water turbidity in the Eastern China Seas from Geostationary Ocean Colour Imager[J]. International Journal of Remote Sensing, 2020, 41(11): 4080−4101. doi: 10.1080/01431161.2020.1714775 [9] El-Alem A, Chokmani K. A machine learning-based regional hybrid model for remote retrieving turbidity from Landsat imagery[J]. IEEE Geoscience and Remote Sensing Letters, 2022, 19: 8021605. [10] Drusch M, Del Bello U, Carlier S, et al. Sentinel-2: ESA’s optical high-resolution mission for GMES operational services[J]. Remote Sensing of Environment, 2012, 120: 25−36. doi: 10.1016/j.rse.2011.11.026 [11] Tian Liqiao, Wai O W H, Chen Xiaoling, et al. Assessment of total suspended sediment distribution under varying tidal conditions in deep bay: initial results from HJ-1A/1B satellite CCD images[J]. Remote Sensing, 2014, 6(10): 9911−9929. doi: 10.3390/rs6109911 [12] Nazeer M, Nichol J E. Combining Landsat TM/ETM+ and HJ-1 A/B CCD sensors for monitoring coastal water quality in Hong Kong[J]. IEEE Geoscience and Remote Sensing Letters, 2015, 12(9): 1898−1902. doi: 10.1109/LGRS.2015.2436899 [13] Hafeez S, Wong M S. Measurement of coastal water quality indicators using Sentinel-2; an evaluation over Hong Kong and the Pearl River Estuary[C]//IGARSS 2019 - 2019 IEEE International Geoscience and Remote Sensing Symposium. Yokohama: IEEE, 2019: 8249-8252. [14] Kuhn C, De Matos Valerio A, Ward N, et al. Performance of Landsat-8 and Sentinel-2 surface reflectance products for river remote sensing retrievals of chlorophyll-a and turbidity[J]. Remote Sensing of Environment, 2019, 224: 104−118. doi: 10.1016/j.rse.2019.01.023 [15] Warren M A, Simis S G H, Selmes N. Complementary water quality observations from high and medium resolution Sentinel sensors by aligning chlorophyll-a and turbidity algorithms[J]. Remote Sensing of Environment, 2021, 265: 112651. doi: 10.1016/j.rse.2021.112651 [16] Wilson R T. Py6S: a Python interface to the 6S radiative transfer model[J]. Computers & Geosciences, 2013, 51: 166−171. [17] Nazeer M, Nichol J E, Yung Y K. Evaluation of atmospheric correction models and Landsat surface reflectance product in an urban coastal environment[J]. International Journal of Remote Sensing, 2014, 35(16): 6271−6291. doi: 10.1080/01431161.2014.951742 [18] Ouma Y O, Noor K, Herbert K. Modelling reservoir chlorophyll-a, TSS, and turbidity using Sentinel-2A MSI and Landsat-8 OLI satellite sensors with empirical multivariate regression[J]. Journal of Sensors, 2020, 2020: 8858408. [19] Murphy S, Hård J. Atmospheric correction of Sentinel 2 imagery in Google Earth Engine using Py6S(2020)[Z]. https://github.com/samsammurphy/gee-atmcorr-S2. (不确定本条文献类型及格式是否正确,请确认)Murphy S, Hård J. Atmospheric correction of Sentinel 2 imagery in Google Earth Engine using Py6S(2020)[Z]. https://github.com/samsammurphy/gee-atmcorr-S2. (不确定本条文献类型及格式是否正确,请确认) [20] Kwong I H Y, Wong F K K, Fung T. Automatic mapping and monitoring of marine water quality parameters in Hong Kong using Sentinel-2 image time-series and Google Earth Engine cloud computing[J]. Frontiers in Marine Science, 2022, 9: 871470. doi: 10.3389/fmars.2022.871470 [21] Gons H J. Optical teledetection of chlorophyll a in turbid inland waters[J]. Environmental Science & Technology, 1999, 33(7): 1127−1132. [22] Gower J, King S, Borstad G, et al. Detection of intense plankton blooms using the 709 nm band of the MERIS imaging spectrometer[J]. International Journal of Remote Sensing, 2005, 26(9): 2005−2012. doi: 10.1080/01431160500075857 [23] Topp S N, Pavelsky T M, Jensen D, et al. Research trends in the use of remote sensing for inland water quality science: moving towards multidisciplinary applications[J]. Water, 2020, 12(1): 169. doi: 10.3390/w12010169 [24] Ma Yue, Song Kaishan, Wen Zhidan, et al. Remote sensing of turbidity for lakes in northeast China using Sentinel-2 images with machine learning algorithms[J]. IEEE Journal of Selected Topics in Applied Earth Observations and Remote Sensing, 2021, 14: 9132−9146. doi: 10.1109/JSTARS.2021.3109292 [25] Wang Jun, Tong Yan, Feng Lian, et al. Satellite‐observed decreases in water turbidity in the Pearl River Estuary: potential linkage with sea‐level rise[J]. Journal of Geophysical Research: Oceans, 2021, 126(4): e2020JC016842. doi: 10.1029/2020JC016842 [26] 李盈盈. 辽河口浊度遥感反演及时空变化分析[D]. 大连: 大连理工大学, 2022.Li Yingying. Water turbidity retrieval and spatial-temporal analysis based on remote sensing data in the Liao River Estuary[D]. Dalian: Dalian University of Technology, 2022. [27] 黎栩霞, 王裕东, 肖佑鹏, 等. 深圳近岸海域水质遥感监测及时空变化[J]. 环境工程, 2024, 42(1): 243−252.Li Xuxia, Wang Yudong, Xiao Youpeng, et al. Quality monitoring of Shenzhen’s coastal waters by satellite and its spatiotemporal variation[J]. Environmental Engineering, 2024, 42(1): 243−252. [28] Hou Xuejiao, Feng Lian, Duan Hongtao, et al. Fifteen-year monitoring of the turbidity dynamics in large lakes and reservoirs in the middle and lower basin of the Yangtze River, China[J]. Remote Sensing of Environment, 2017, 190: 107−121. doi: 10.1016/j.rse.2016.12.006 [29] Lin Jie, Zou Xinqing, Huang Faming. Effects of the thermal discharge from an offshore power plant on plankton and macrobenthic communities in subtropical China[J]. Marine Pollution Bulletin, 2018, 131: 106−114. doi: 10.1016/j.marpolbul.2018.04.005 [30] Jiang Cong, Xiong Lihua, Wang Dingbao, et al. Separating the impacts of climate change and human activities on runoff using the Budyko-type equations with time-varying parameters[J]. Journal of Hydrology, 2015, 522: 326−338. doi: 10.1016/j.jhydrol.2014.12.060 [31] Zheng Zhubin, Li Yunmei, Guo Yulong, et al. Landsat-based long-term monitoring of total suspended matter concentration pattern change in the wet season for Dongting Lake, China[J]. Remote Sensing, 2015, 7(10): 13975−13999. doi: 10.3390/rs71013975 [32] Lu Jian, Jiang Jingbo, Li Anchun, et al. Impact of Typhoon Chan-hom on the marine environment and sediment dynamics on the inner shelf of the East China Sea: in-situ seafloor observations[J]. Marine Geology, 2018, 406: 72−83. doi: 10.1016/j.margeo.2018.09.009 [33] Liu Dong, Bai Yan, Wei Xiaodao, et al. Sewage treatment decreased organic carbon resources in Hong Kong waters during 1986-2020[J]. Environmental Pollution, 2023, 335: 122219. doi: 10.1016/j.envpol.2023.122219 -

计量
- 文章访问数: 139
- HTML全文浏览量: 38
- PDF下载量: 60
- 被引次数: 0
