

Temperature inversion and its decline over the eastern continental slope in the Gulf of Alaska based on seal observation
-
摘要: 利用2014年3–4月北象海豹携带的自动温盐深仪(CTD-SRDL)在阿拉斯加湾东部陆坡海域上采集到的温盐剖面数据,分析了该海域逆温现象的空间分布和演变过程。结果显示,研究海域存在明显的逆温现象,逆温幅度和逆温厚度范围分别介于0.2~1.6˚C和20~280 m之间,前者沿陆坡向北幅度逐渐增大,后者在50˚~58˚N间往北逐渐变厚,在58˚N以北海域平均厚度较薄。3月25日至4月22日,逆温层处于衰退阶段。逆温层下界温度不断下降,逆温幅度呈变弱趋势,逆温厚度呈变薄趋势。一维扩散模型模拟结果表明,湍扩散作用下,观测期间海表受热导致混合层上部位温升高,但底部仍保持低温,因此逆温层上界温度变化并不明显。次表层由于具有强的位温梯度,湍扩散导致逆温层下界温度显著降低,是观测期间逆温衰退的主要原因。湍扩散作用导致次表层水体温盐属性趋于均匀,这一过程对于阿拉斯加湾逆温现象的形成及演变研究具有重要意义。Abstract: Hydrographic data collected from March to April 2014 by CTD-SRDL mounted on northern elephant seal were analyzed to study the distribution and decline of the temperature inversion over the eastern continental slope in Gulf of Alaska. The results show that temperature inversion occurred significantly in this region. Temperature difference was between 0.2°C and 1.6°C and thickness of temperature inversion was between 20 m and 280 m, respectively. The temperature difference increased northward along the continental slope, while the thickness thickened from 50°N to 58°N, but the average thickness at north of 58°N was relative thinner. The temperature inversion was decay during March 25 to April 22, 2014. The subsurface maximum temperature continued to fall, the temperature difference tended to be weaker, and the thickness presented a thinning tendency. Numerical results of a one-dimensional model reveal that, the temperature at the upper mixed layer increased by heating on the sea surface, but the temperature at the bottom of the mixed layer remained low, therefore the minimum temperature of temperature inversion change was not notable. With a strong temperature gradient in the subsurface, the subsurface maximum temperature dropped pronouncedly due to the turbulent diffusion, which is the main reason for temperature inversion decline. Turbulent diffusion modified temperature and salinity in subsurface water to be uniform, thus it is important to study this process for the formation and evolution of temperature inversion.
-
Key words:
- Gulf of Alaska /
- temperature inversion /
- turbulent diffusion
-
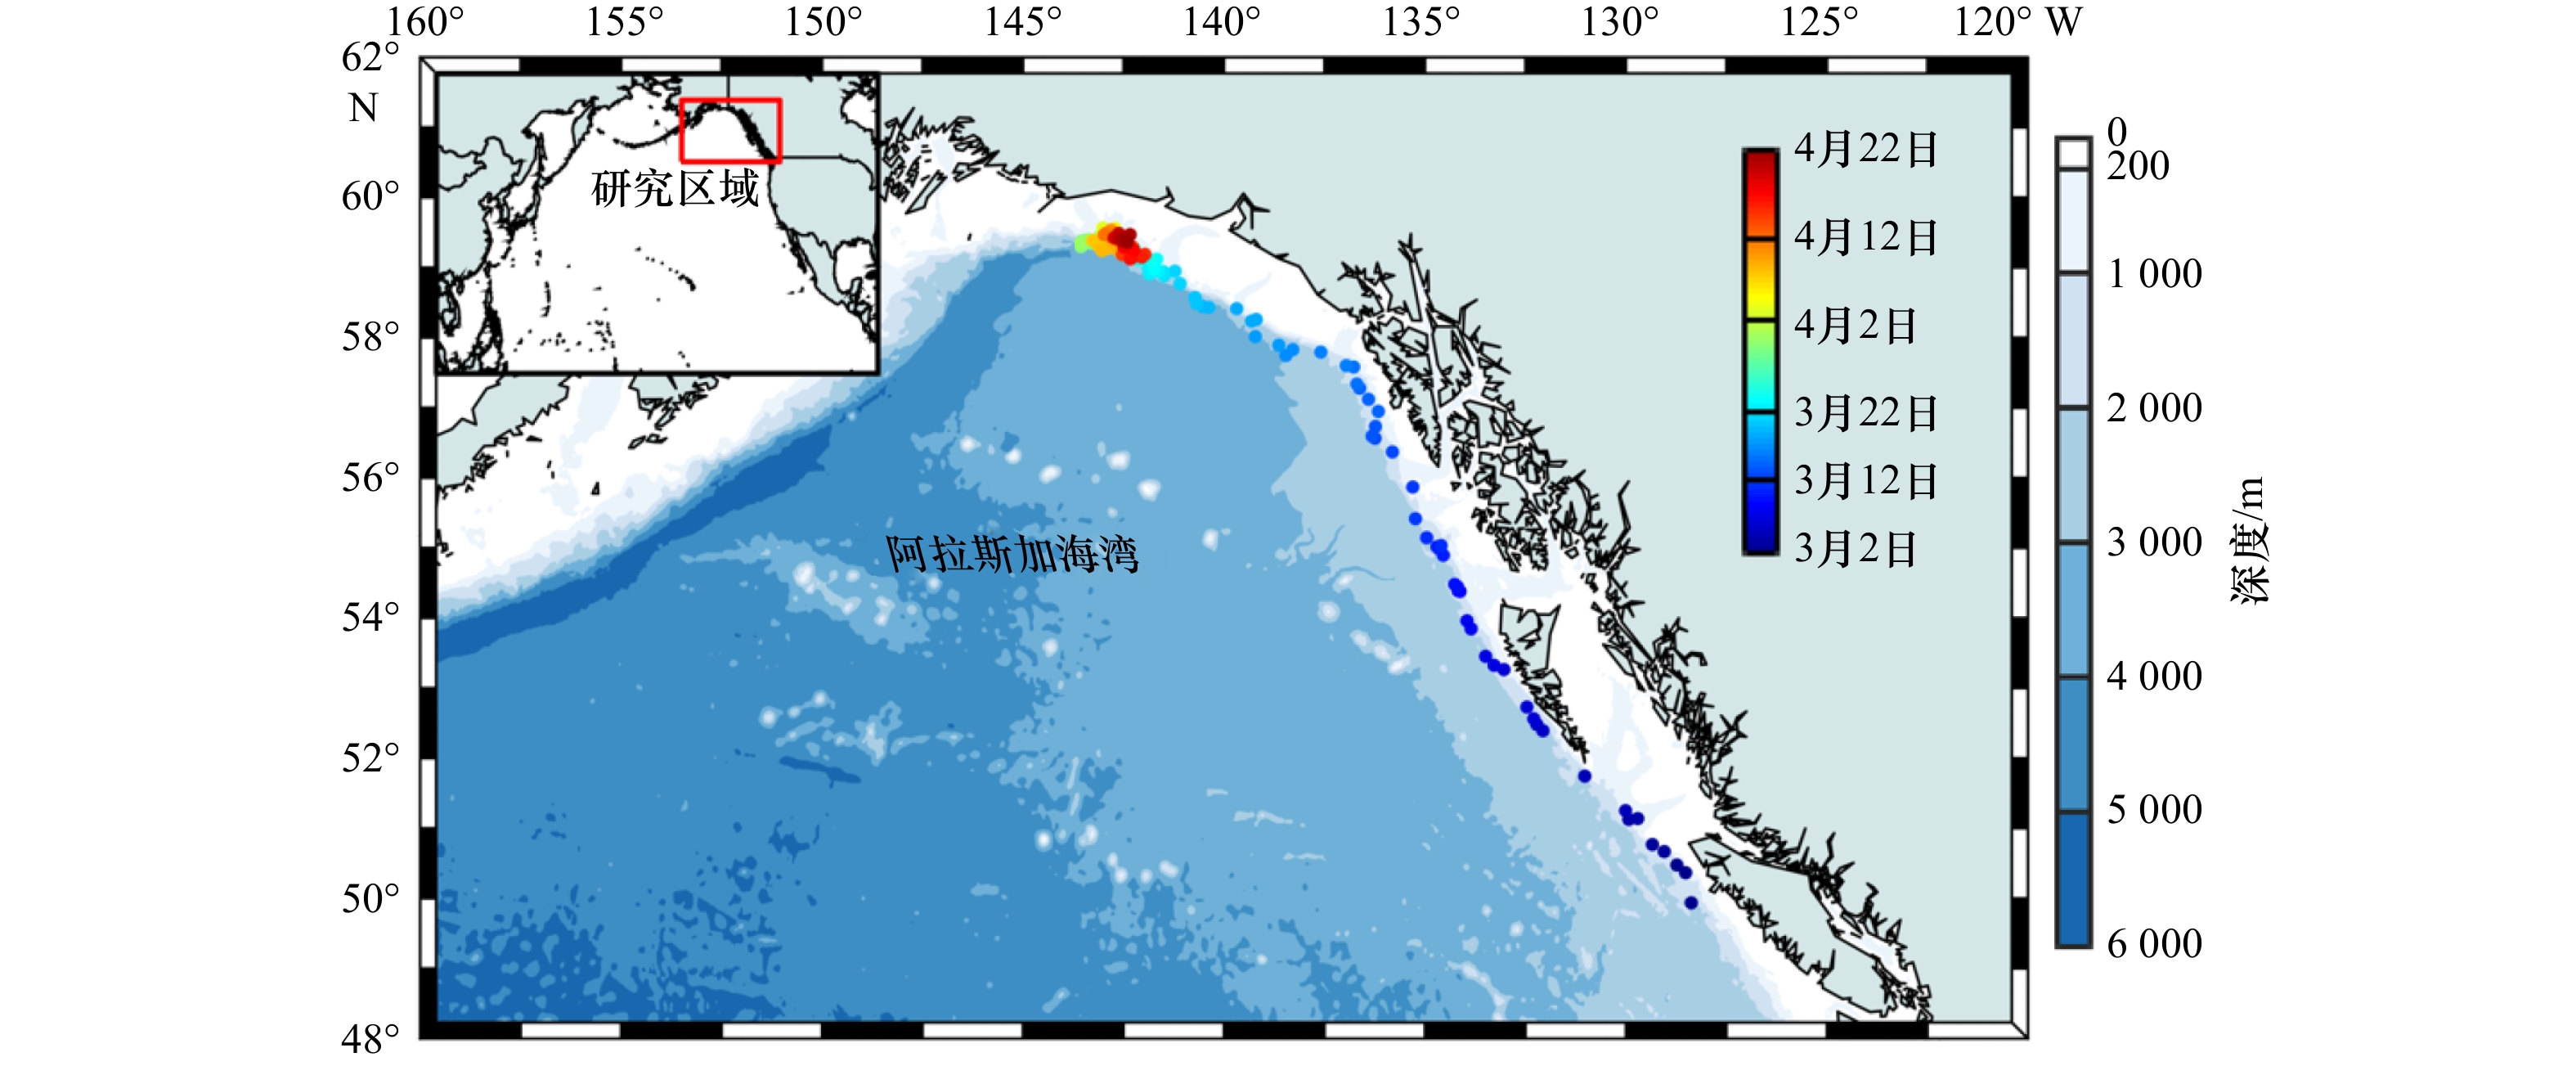
图 1 2014年3–4月阿拉斯加湾东部陆坡海域北象海豹温盐剖面位置分布
圆点颜色表示观测日期,蓝色填充表示水深,插图为研究区域(红色矩形)在北太平洋的位置
Fig. 1 Distribution of potential temperature and salinity profiles observed by north elephant seal during March to April, 2014 over eastern continental slope in the Gulf of Alaska
Colors in filled circle represent date, and the bottom topography is blue shaded. The inset figure is the study area (red rectangle) in the North Pacific
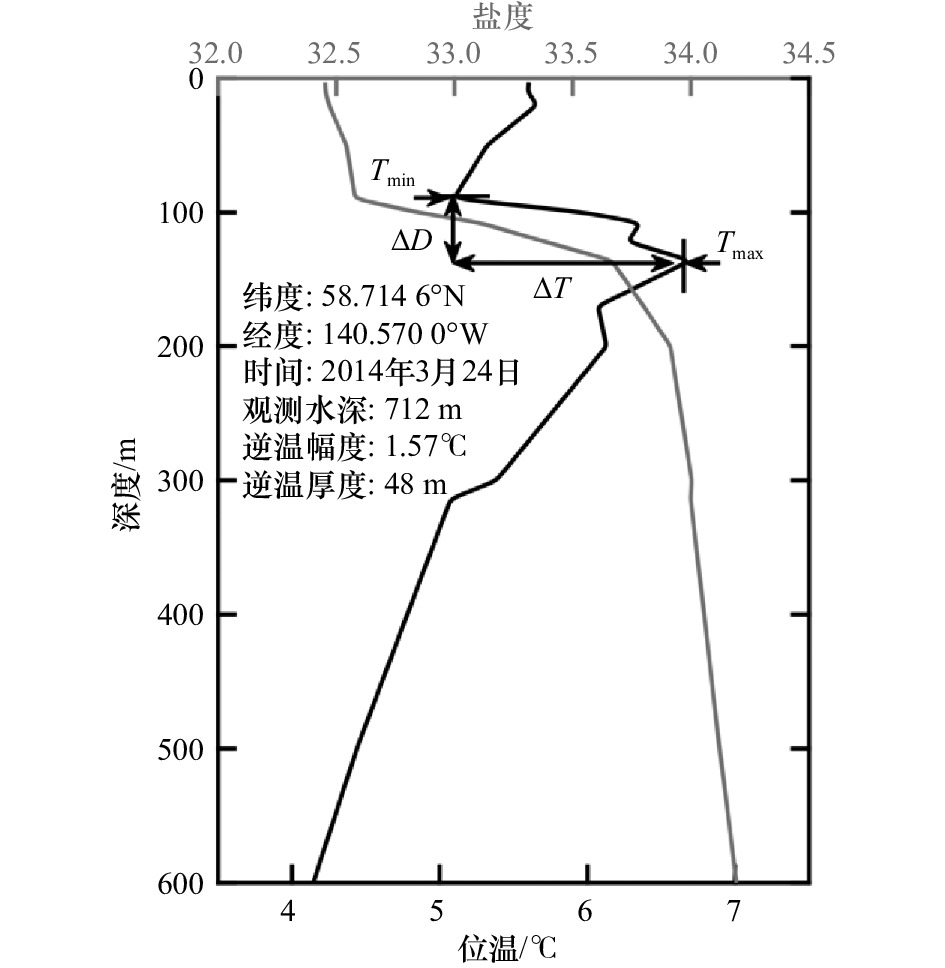
图 2 位于GOA北部陆坡海域(58.7146°N,140.5700°W)的位温(黑线)和盐度(灰线)剖面
Fig. 2 Profile of potential temperature (black line) and salinity (grey line) in the northern continental slope, Gulf of Alaska (58.7146°N, 140.5700°W)
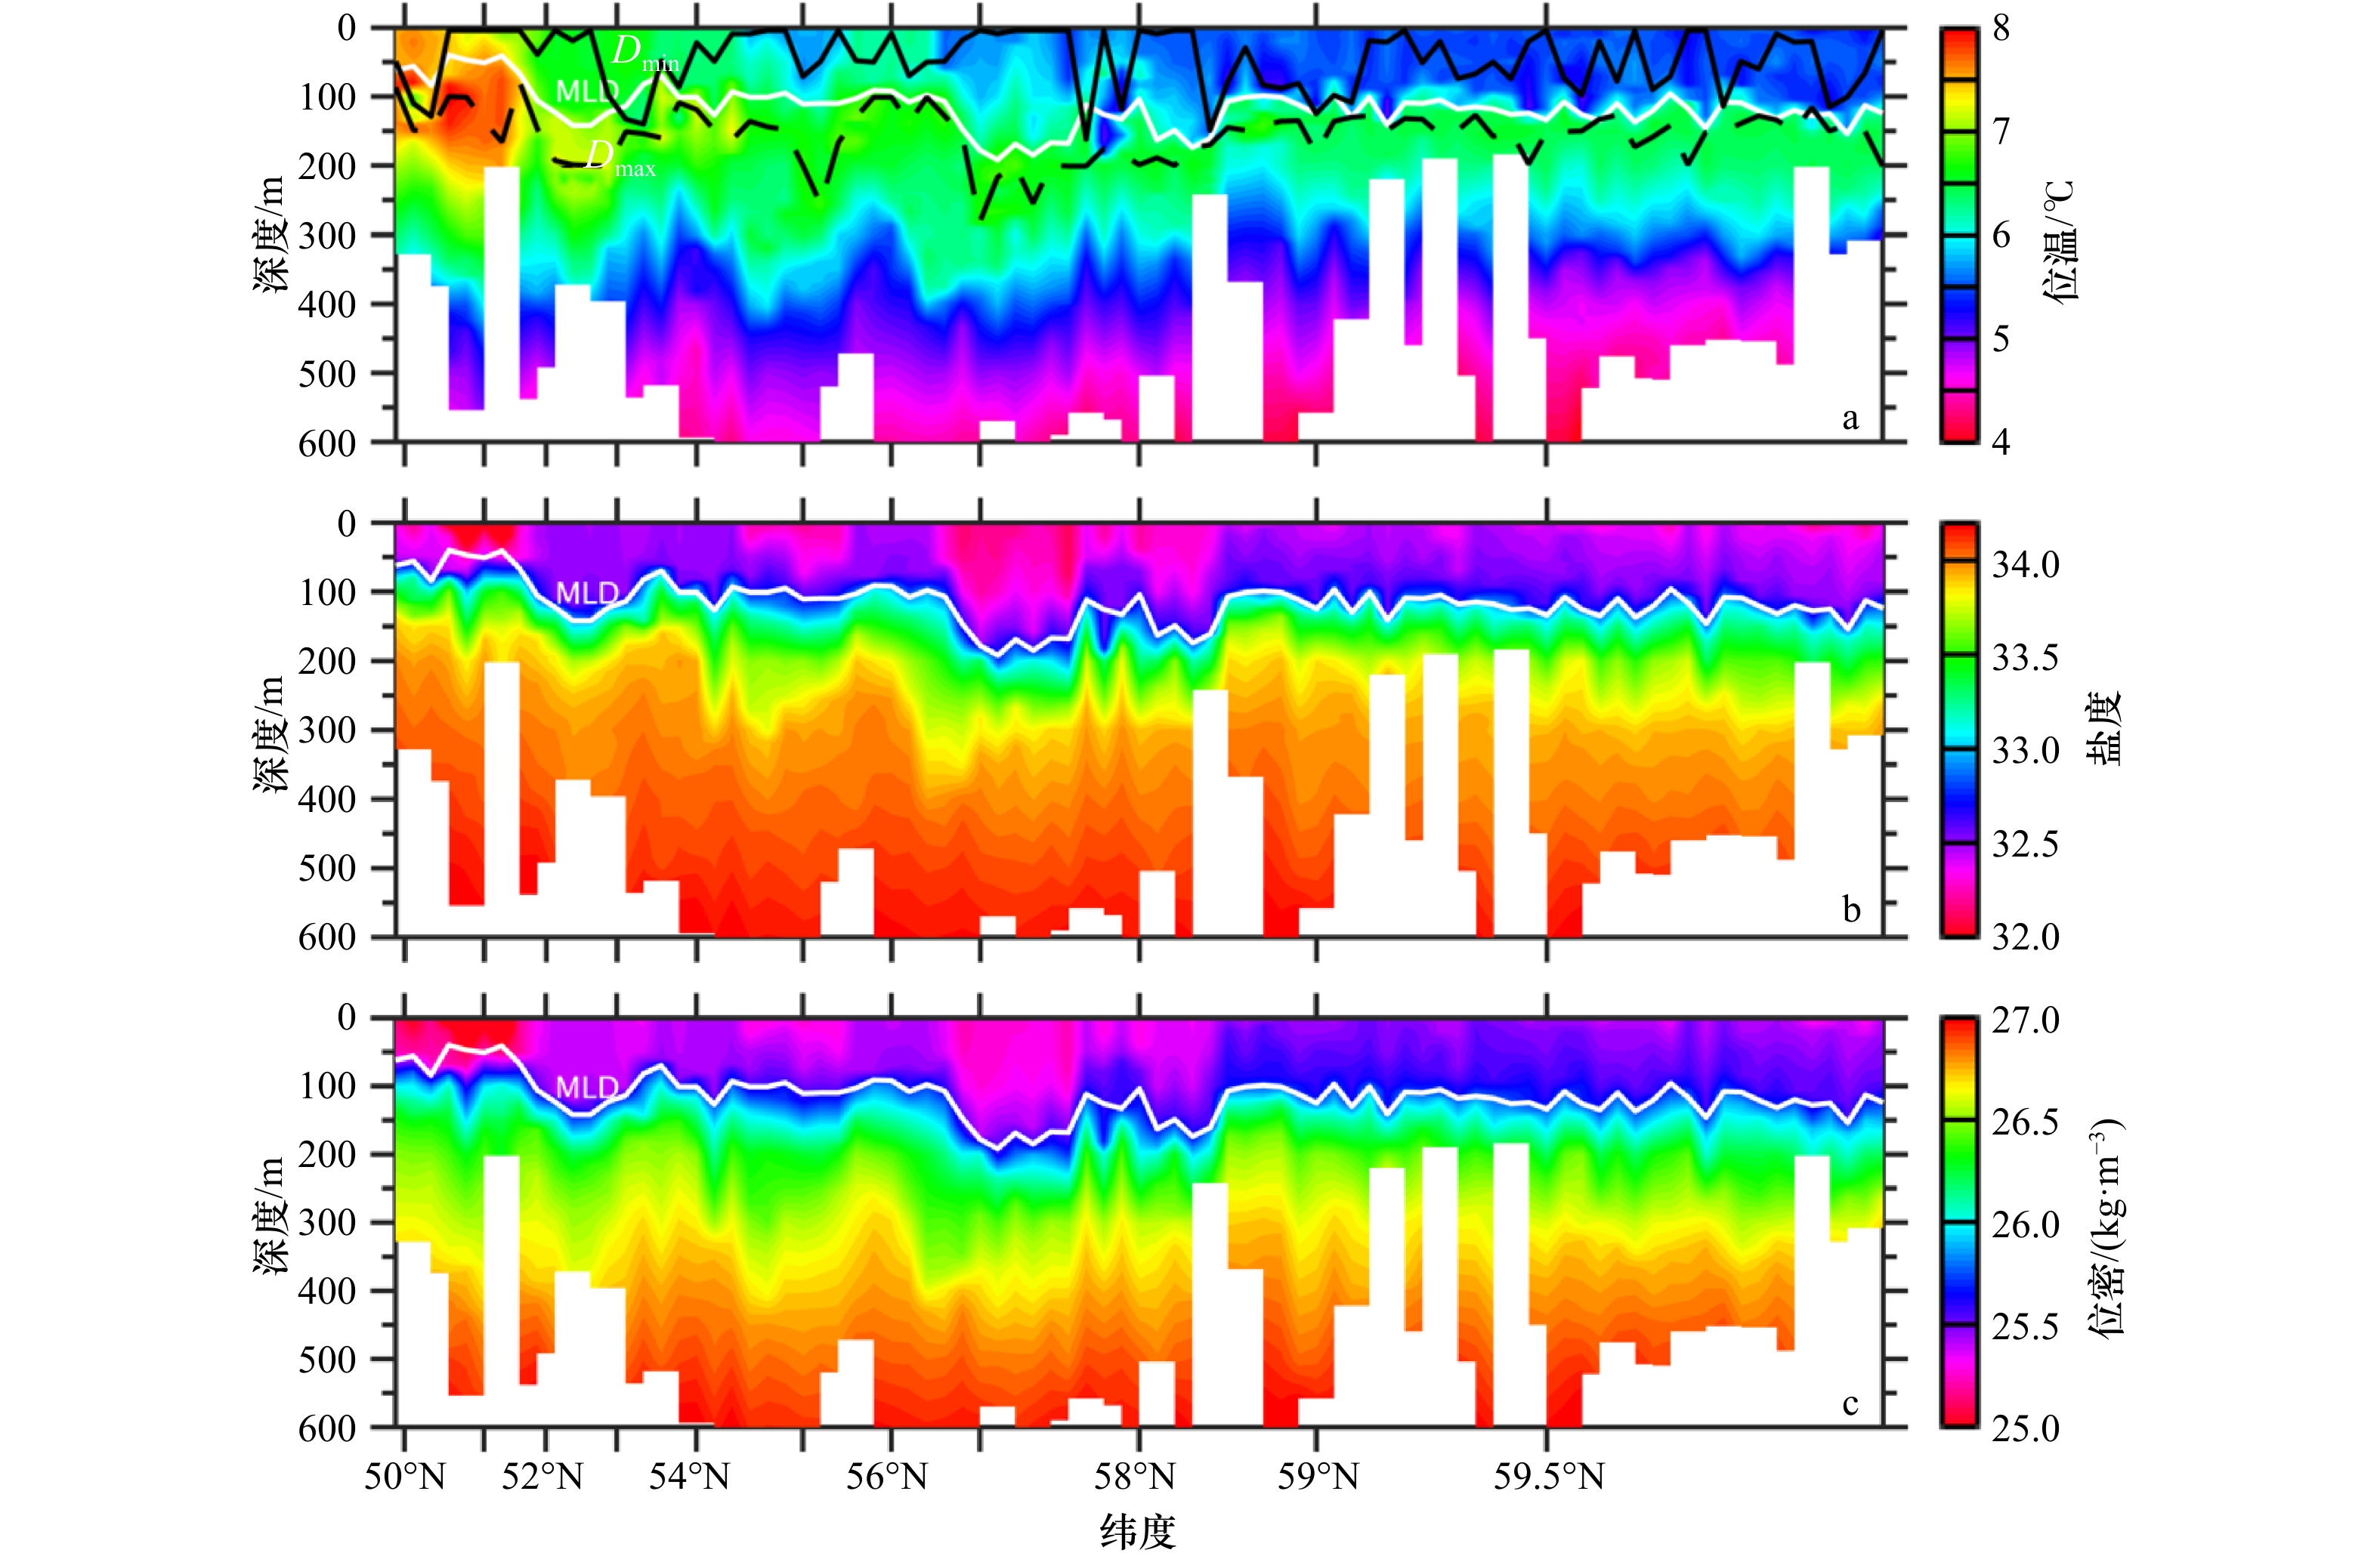
图 3 2014年3月位温(a)、盐度(b)、位密(c)沿陆坡的断面
黑色实、虚线分别表示逆温层上界深度($ {D}_{\mathrm{m}\mathrm{i}\mathrm{n}} $)、逆温层下界深度($ {D}_{\mathrm{m}\mathrm{a}\mathrm{x}} $),白色实线为混合层深度(MLD)
Fig. 3 The section of potential temperature (a), salinity (b), and potential density (c) along the continental slope in March 2014
The black solid, dotted line represent $ {D}_{\mathrm{m}\mathrm{i}\mathrm{n}} $, $ {D}_{\mathrm{m}\mathrm{a}\mathrm{x}} $, respectively, the white line is mixed layer depth (MLD)
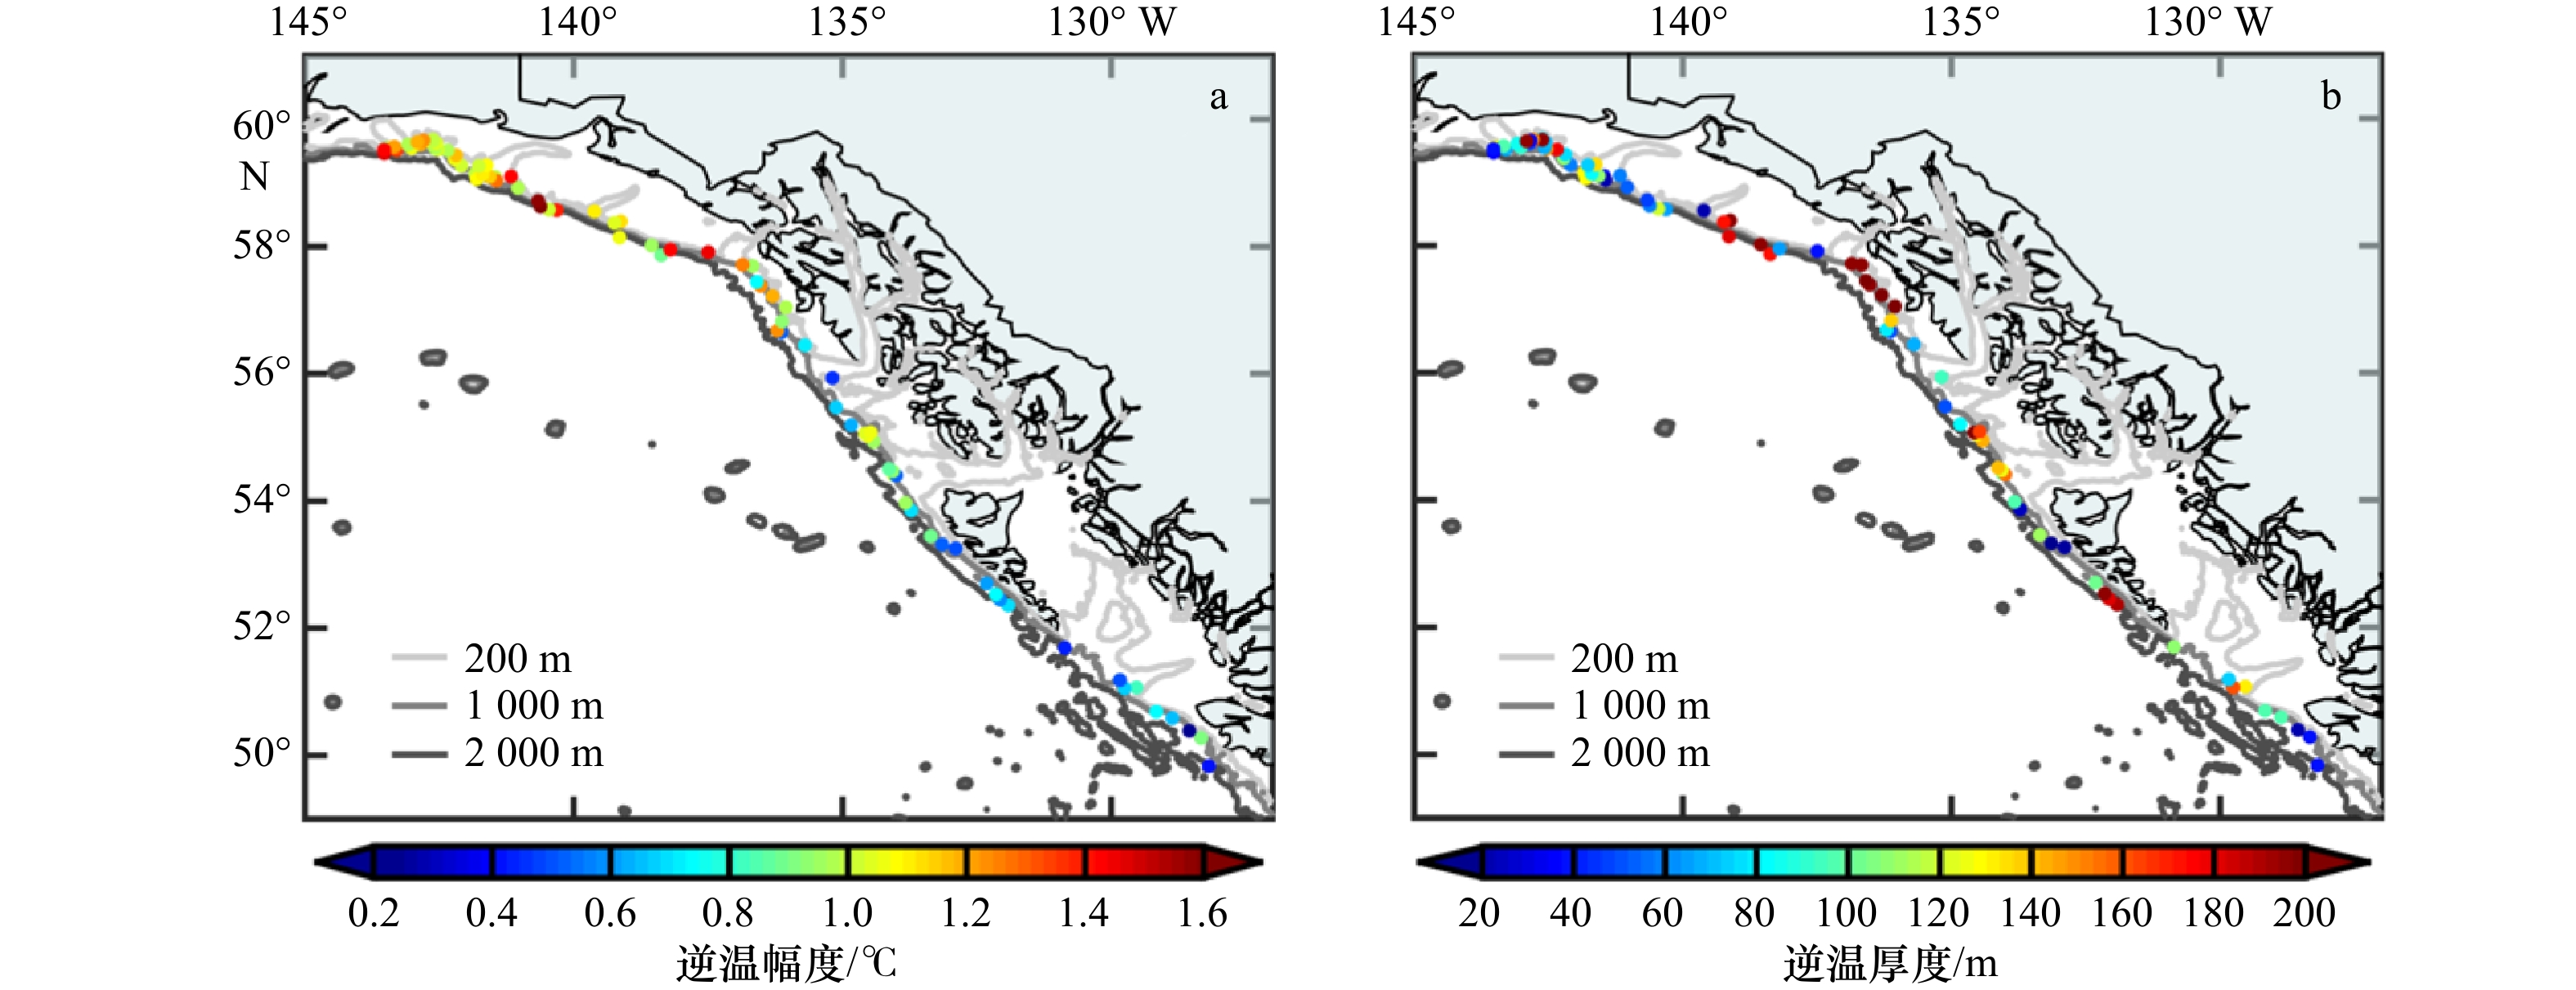
图 4 2014年3月逆温幅度(a)和逆温厚度(b)的空间分布
等值线表示200 m,1 000 m,2 000 m等深线
Fig. 4 Distribution of temperature difference (a) and thickness (b) in March 2014
Contours indicate 200 m, 1 000 m and 2 000 m isobaths respectively
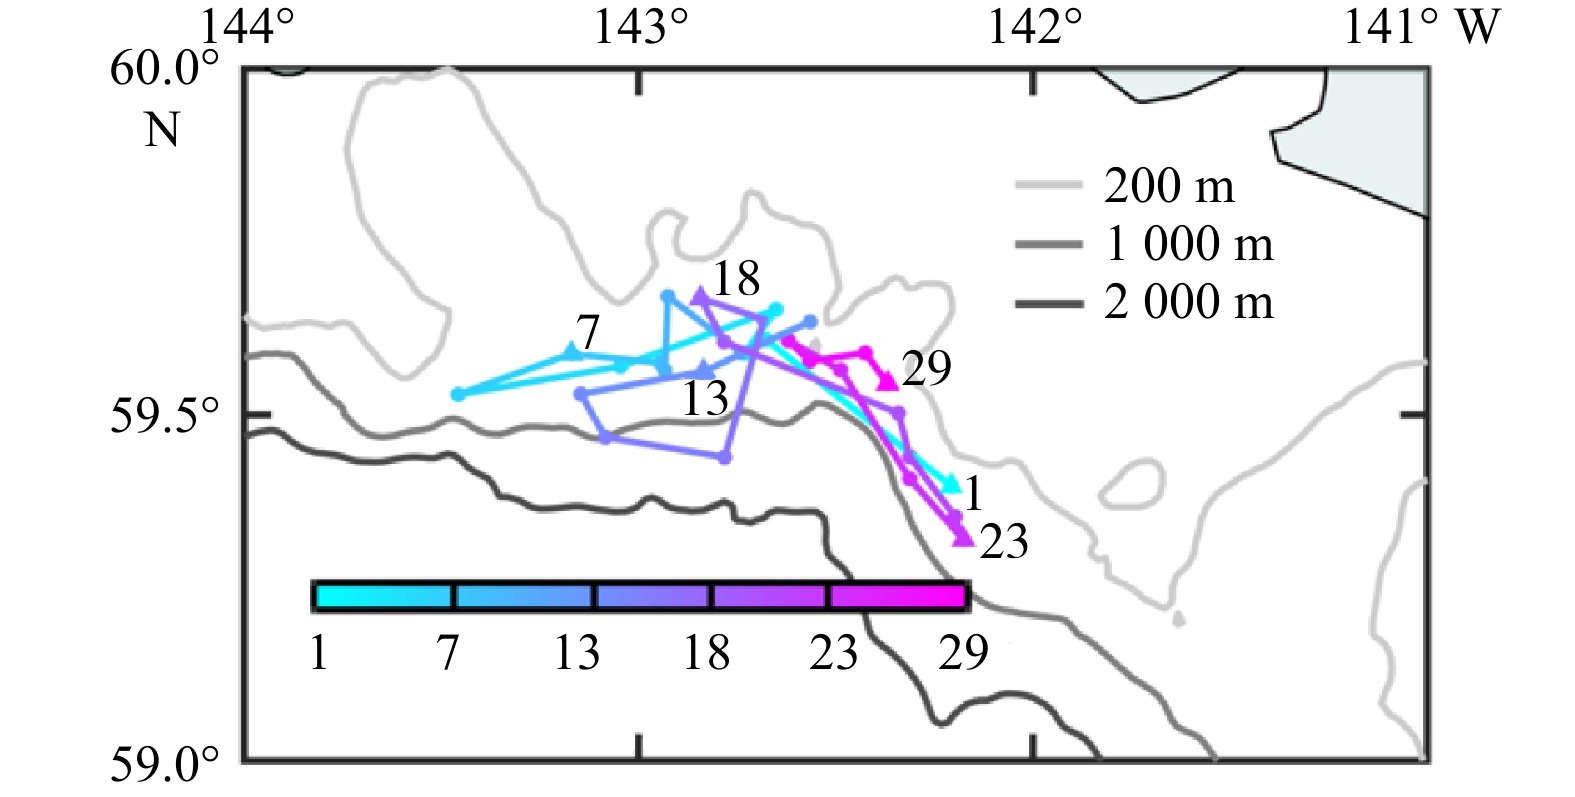
图 5 2014年3月25日至4月22日每日平均的剖面位置分布
等值线为200 m,1 000 m,2 000 m等深线。数字表示观测日期的序号:1、7、13、18、23和29分别为3月25日,3月31日、4月6日、4月11日、4月16日和4月22日,相应的位置用三角形标记
Fig. 5 Distribution of daily-averaged profiles from March 25 to April 22, 2014
Contours indicate 200 m, 1 000 m and 2 000 m isobaths respectively. The number presents sequence of observation date:1, 7, 13, 18, 23, 29 represent March 25, March 31, April 6, April 11, April 16 and April 22 respectively with the corresponding location marked by triangles
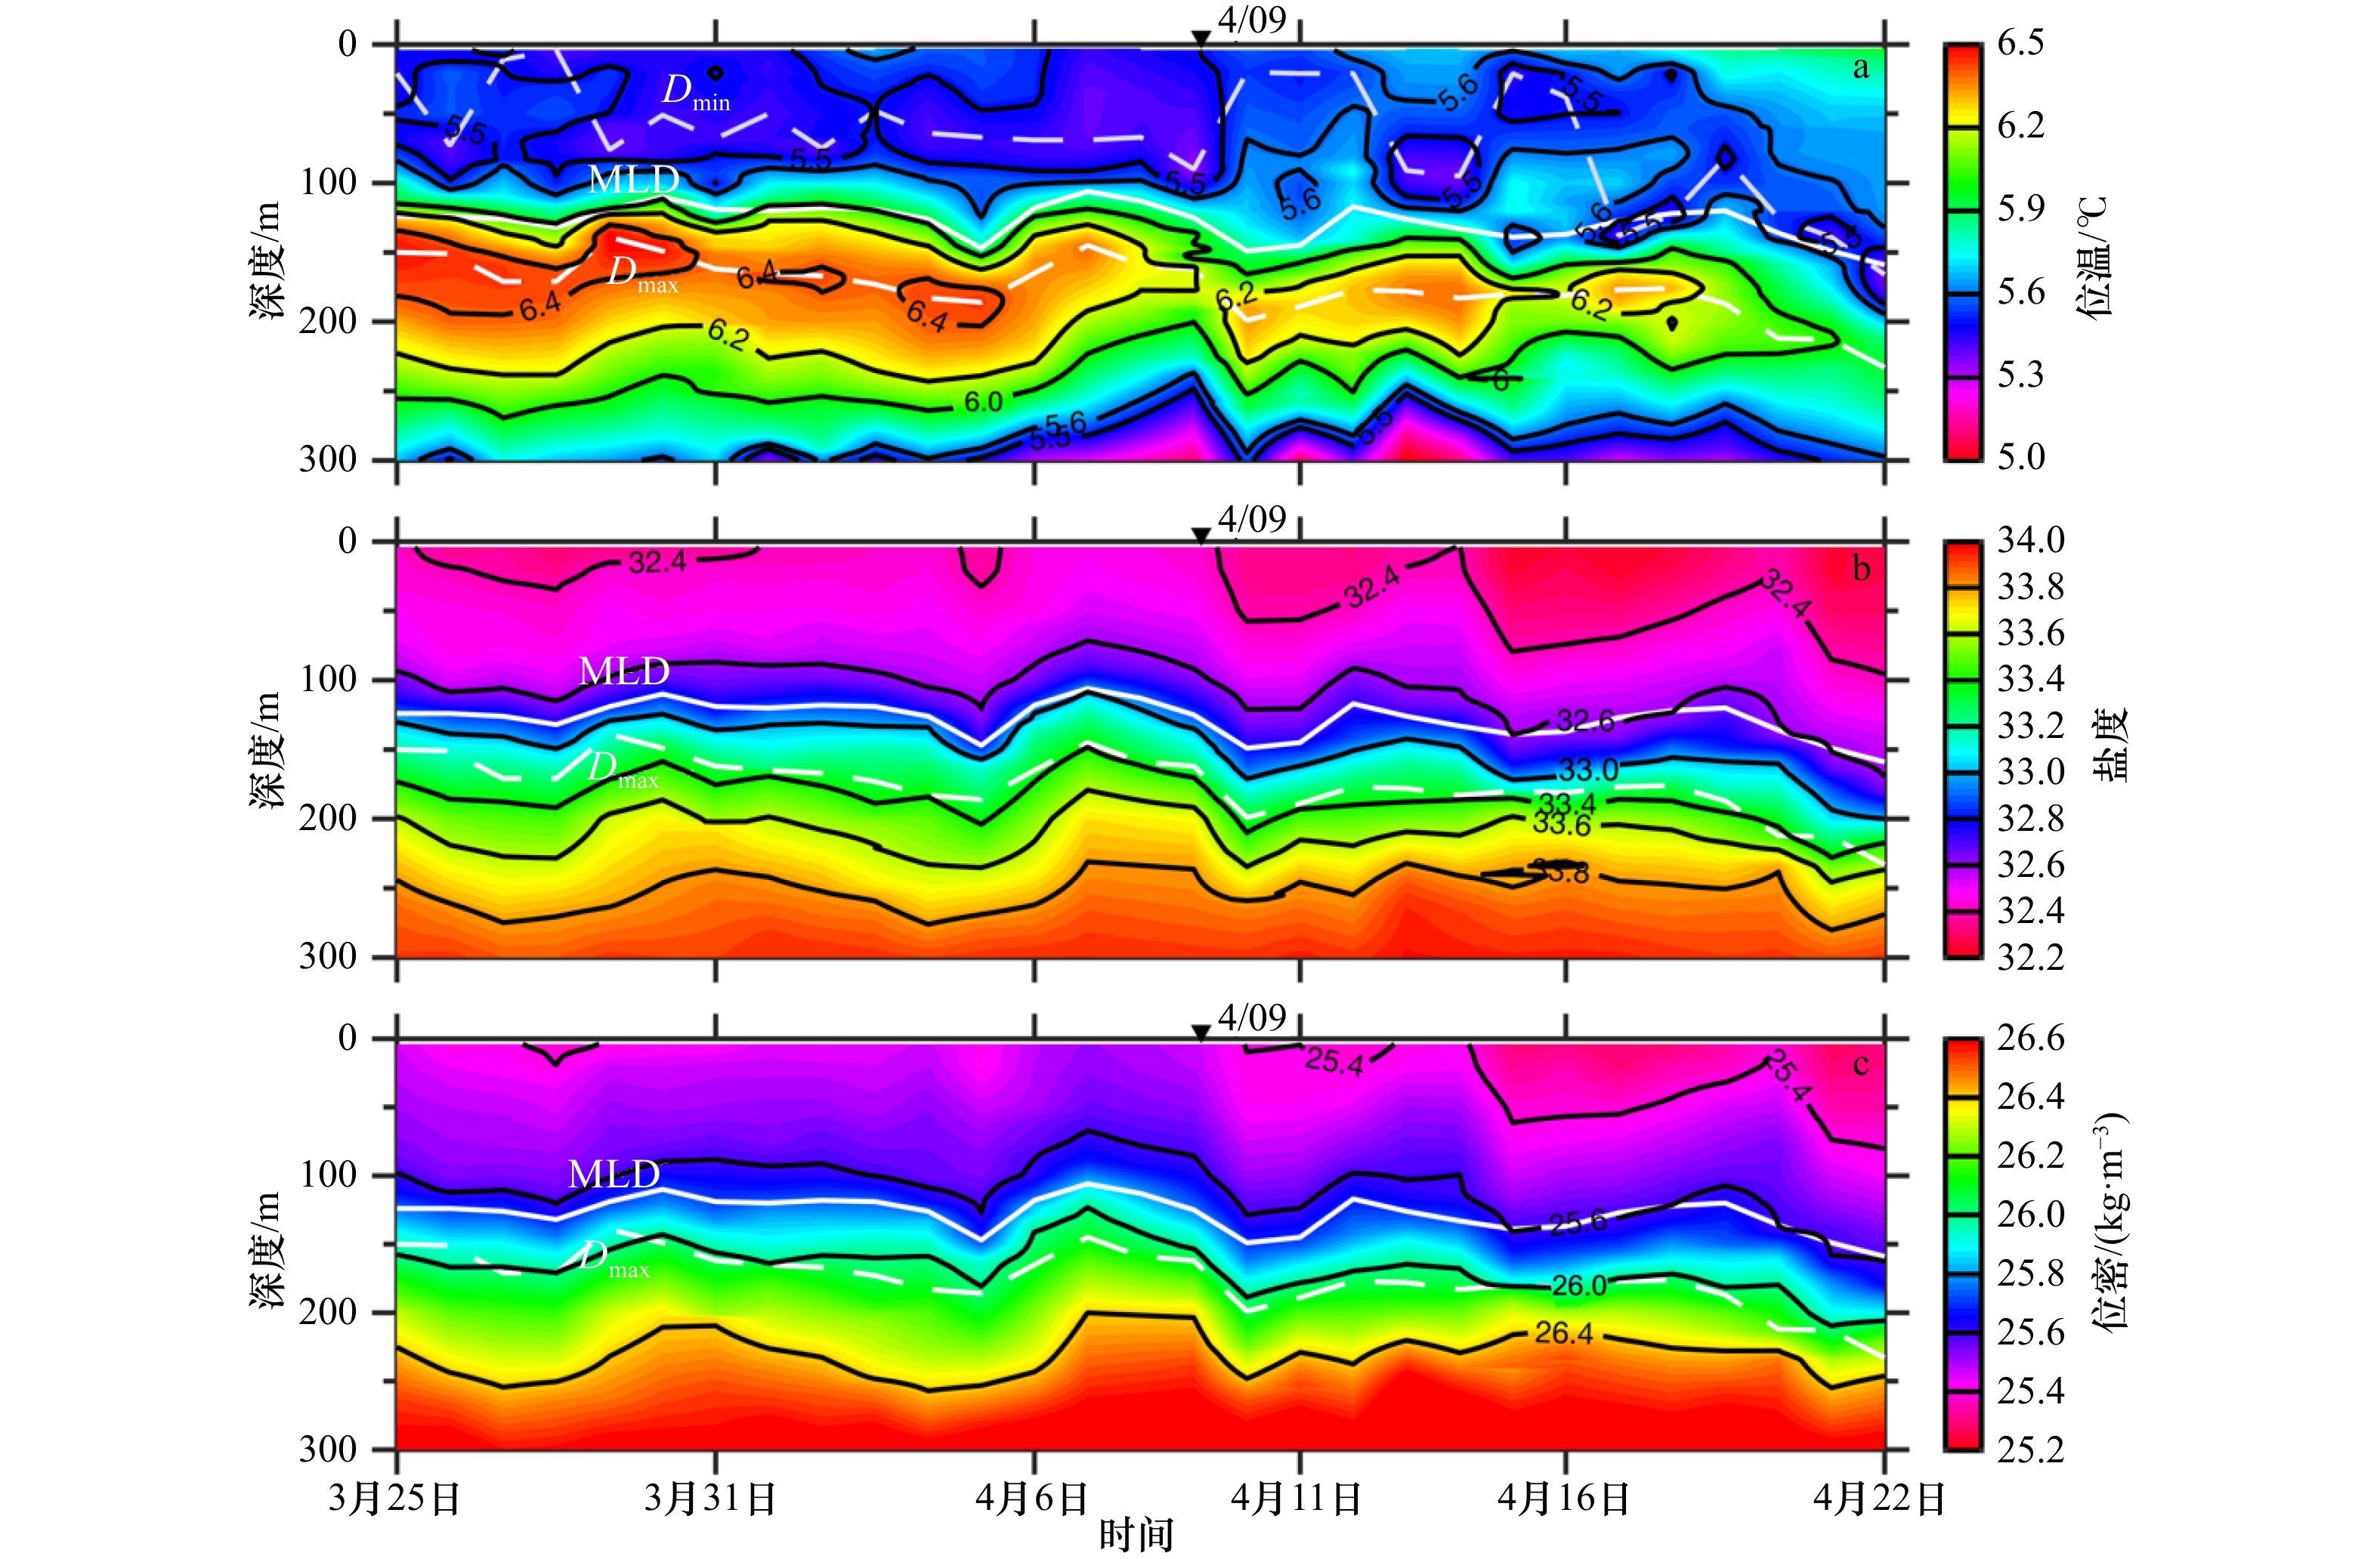
图 6 2014年3月25日至4月22日位温(a)、盐度(b)、位密(c)的时间变化
浅白、白色虚线分别为逆温层上界深度($ {D}_{\mathrm{m}\mathrm{i}\mathrm{n}} $)、逆温层下界深度($ {D}_{\mathrm{m}\mathrm{a}\mathrm{x}} $),白色实线是混合层深度(MLD)
Fig. 6 Temporal evolutions of potential temperature (a), salinity (b), and potential density (c) profiles from March 25 to April 22, 2014
The slight white and white dotted line represent $ {D}_{\mathrm{m}\mathrm{i}\mathrm{n}} $ and $ {D}_{\mathrm{m}\mathrm{a}\mathrm{x}} $, respectively, and the solid white line is mixed layer depth (MLD)
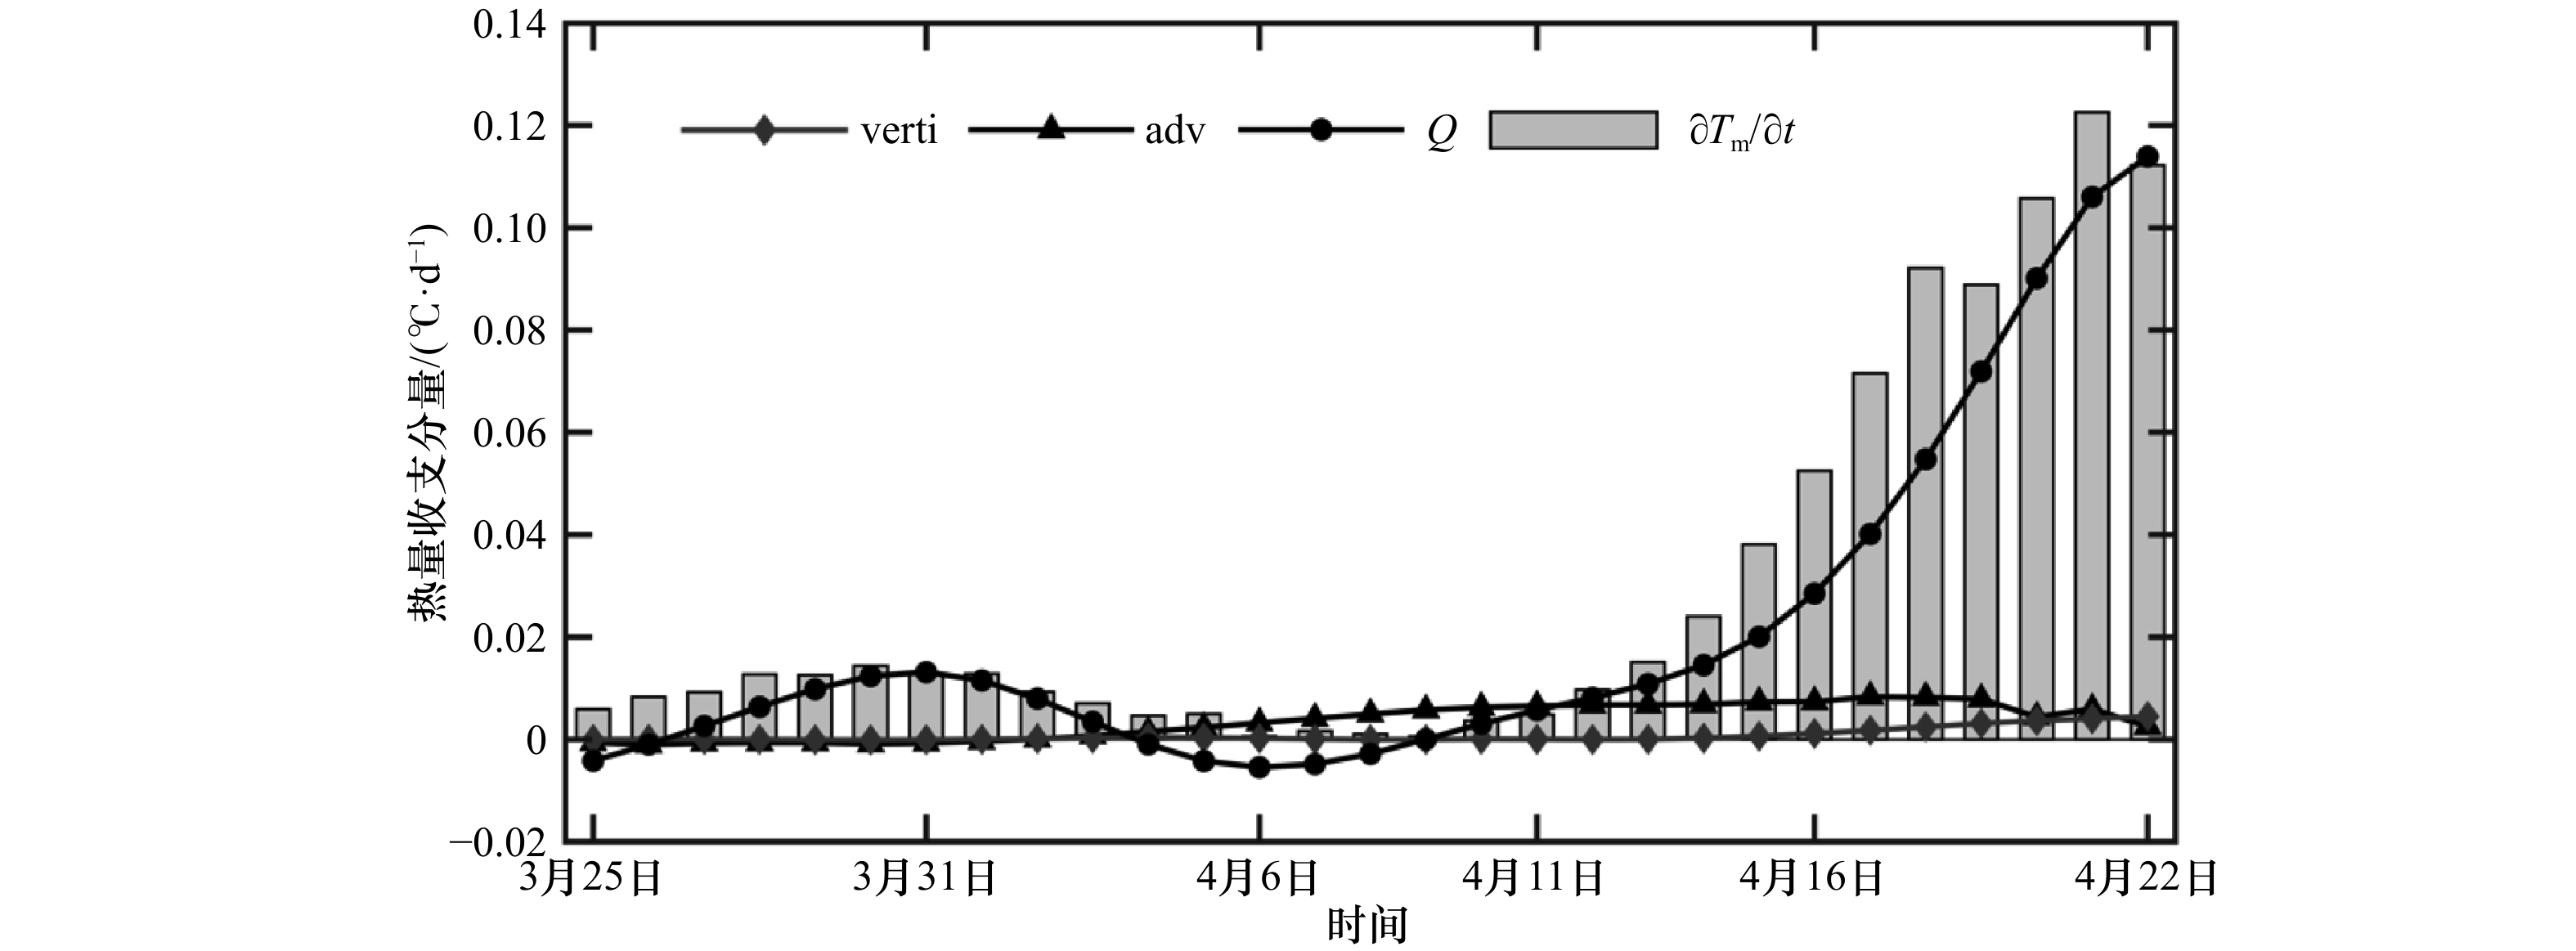
图 8 混合层热量收支分量的日变化
verti代表垂向卷挟项,adv代表位温平流项,Q代表净热通量项,$\partial {T}_{m}/\partial t$代表位温趋势项
Fig. 8 Time series of heat budget terms in the mixed layer
verti represents entrainment, adv represents potential temperature advection, Q represents net heat flux term, and $\partial {T}_{m}/\partial t$ represents potential temperature tendency
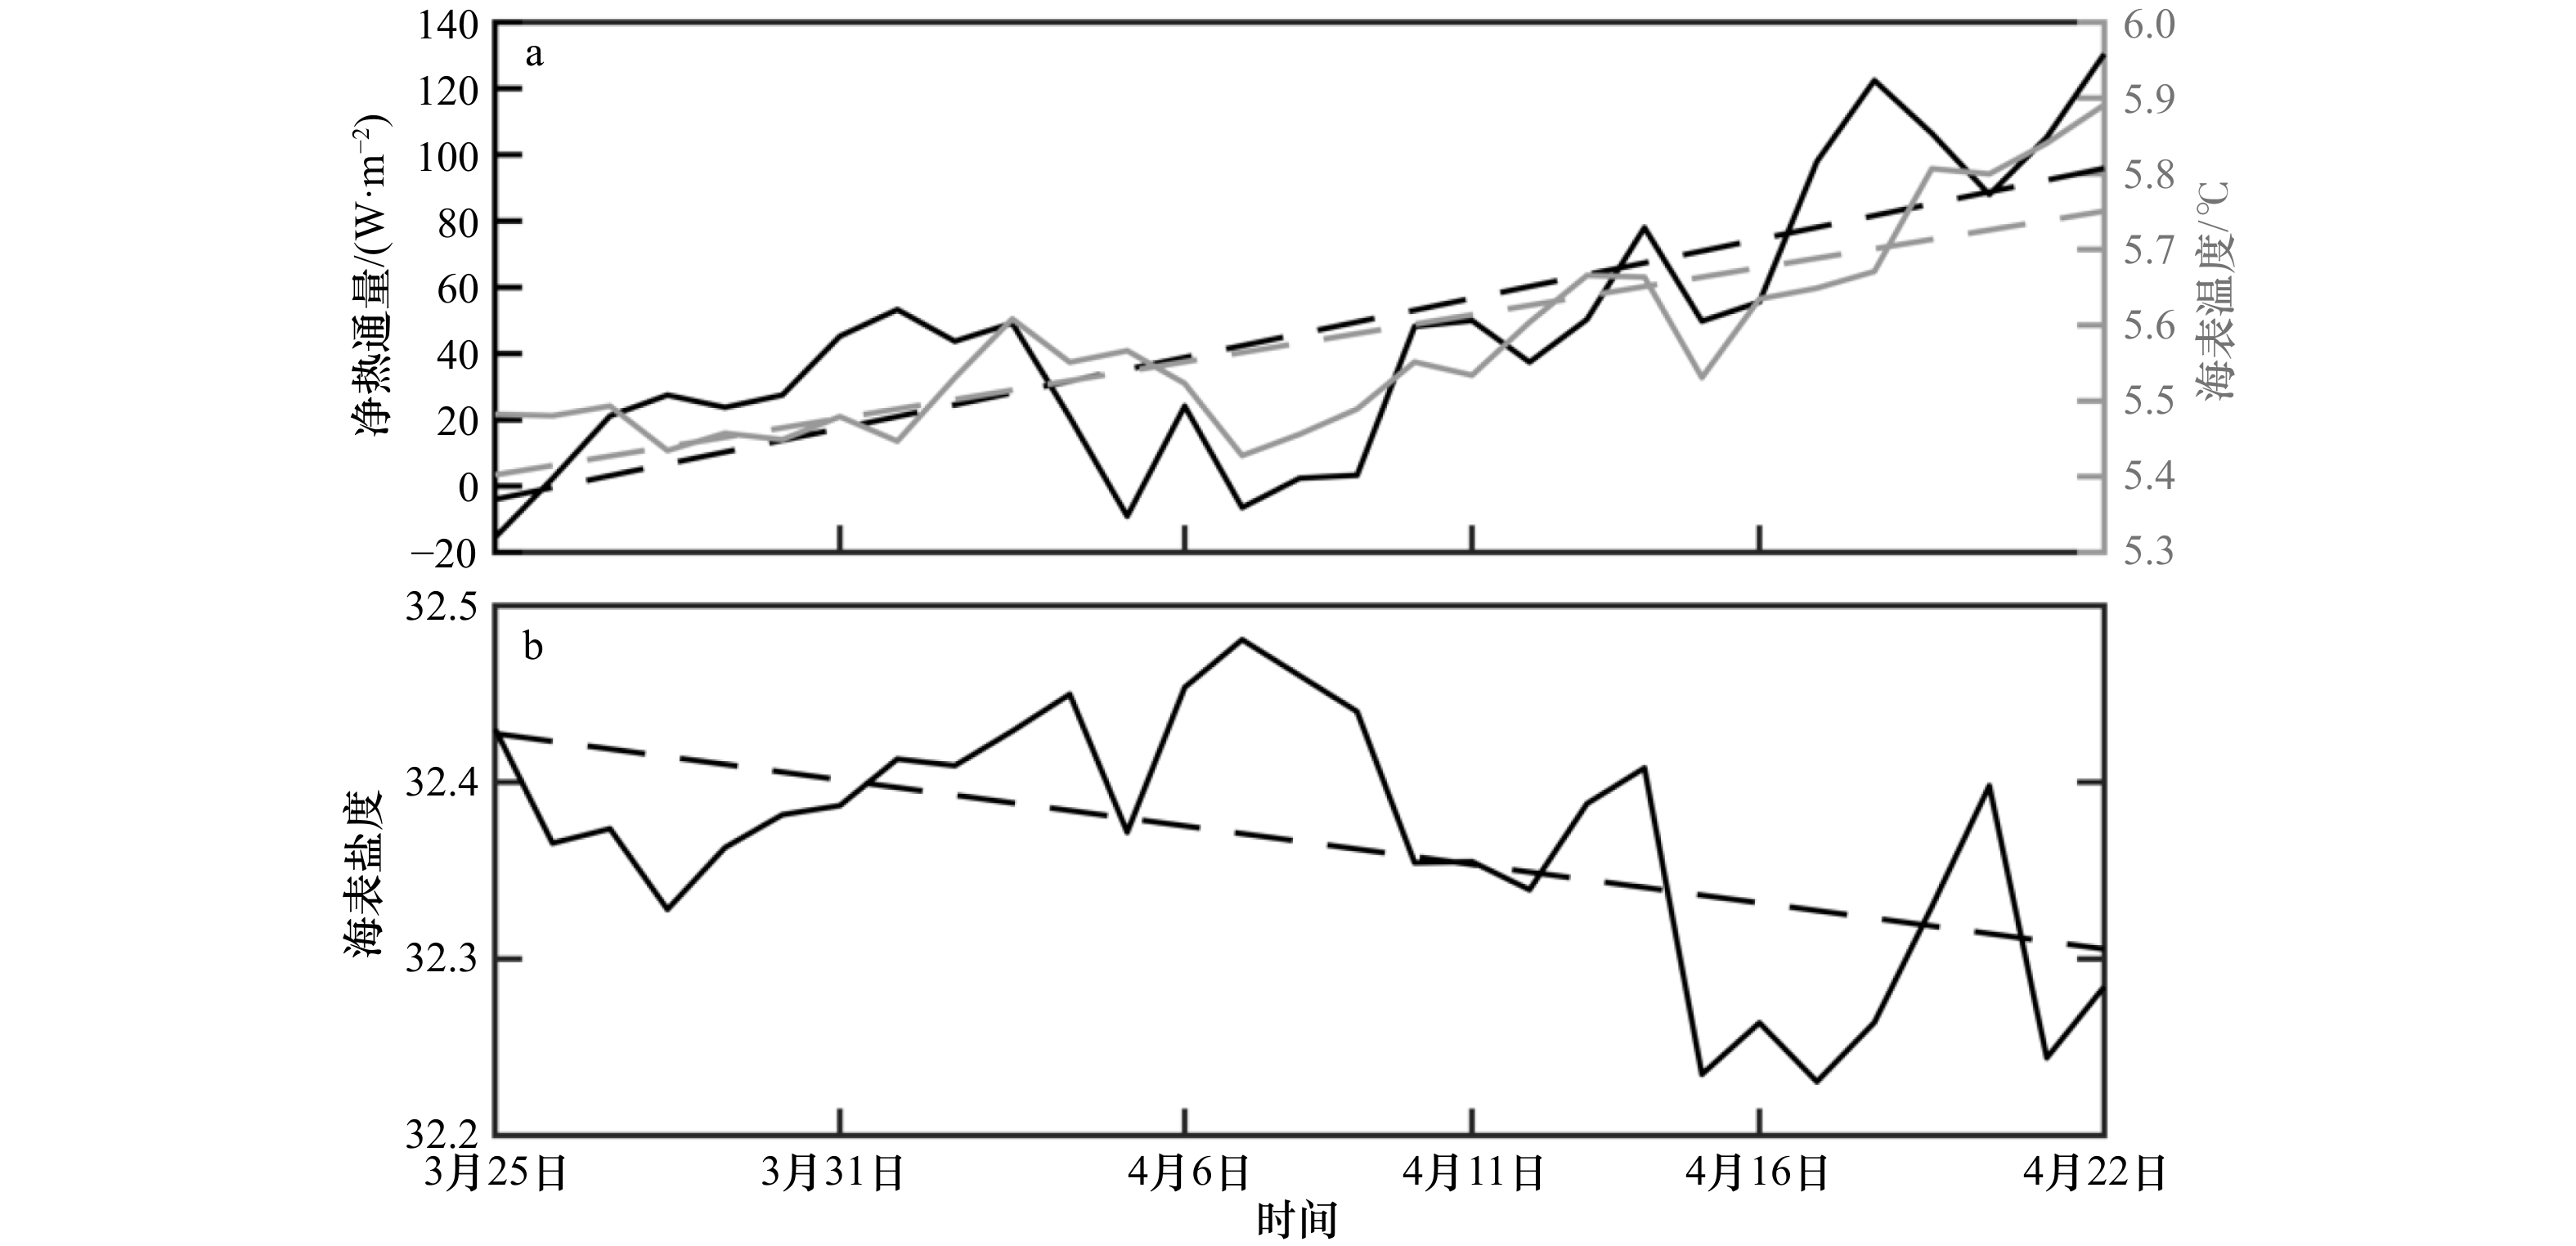
图 9 净热通量和SST(a)、SSS(b)的日变化(实线)及趋势(虚线)
Fig. 9 Time series (solid line) of net heat flux and SST(a), SSS(b) with corresponding trends (dotted line)
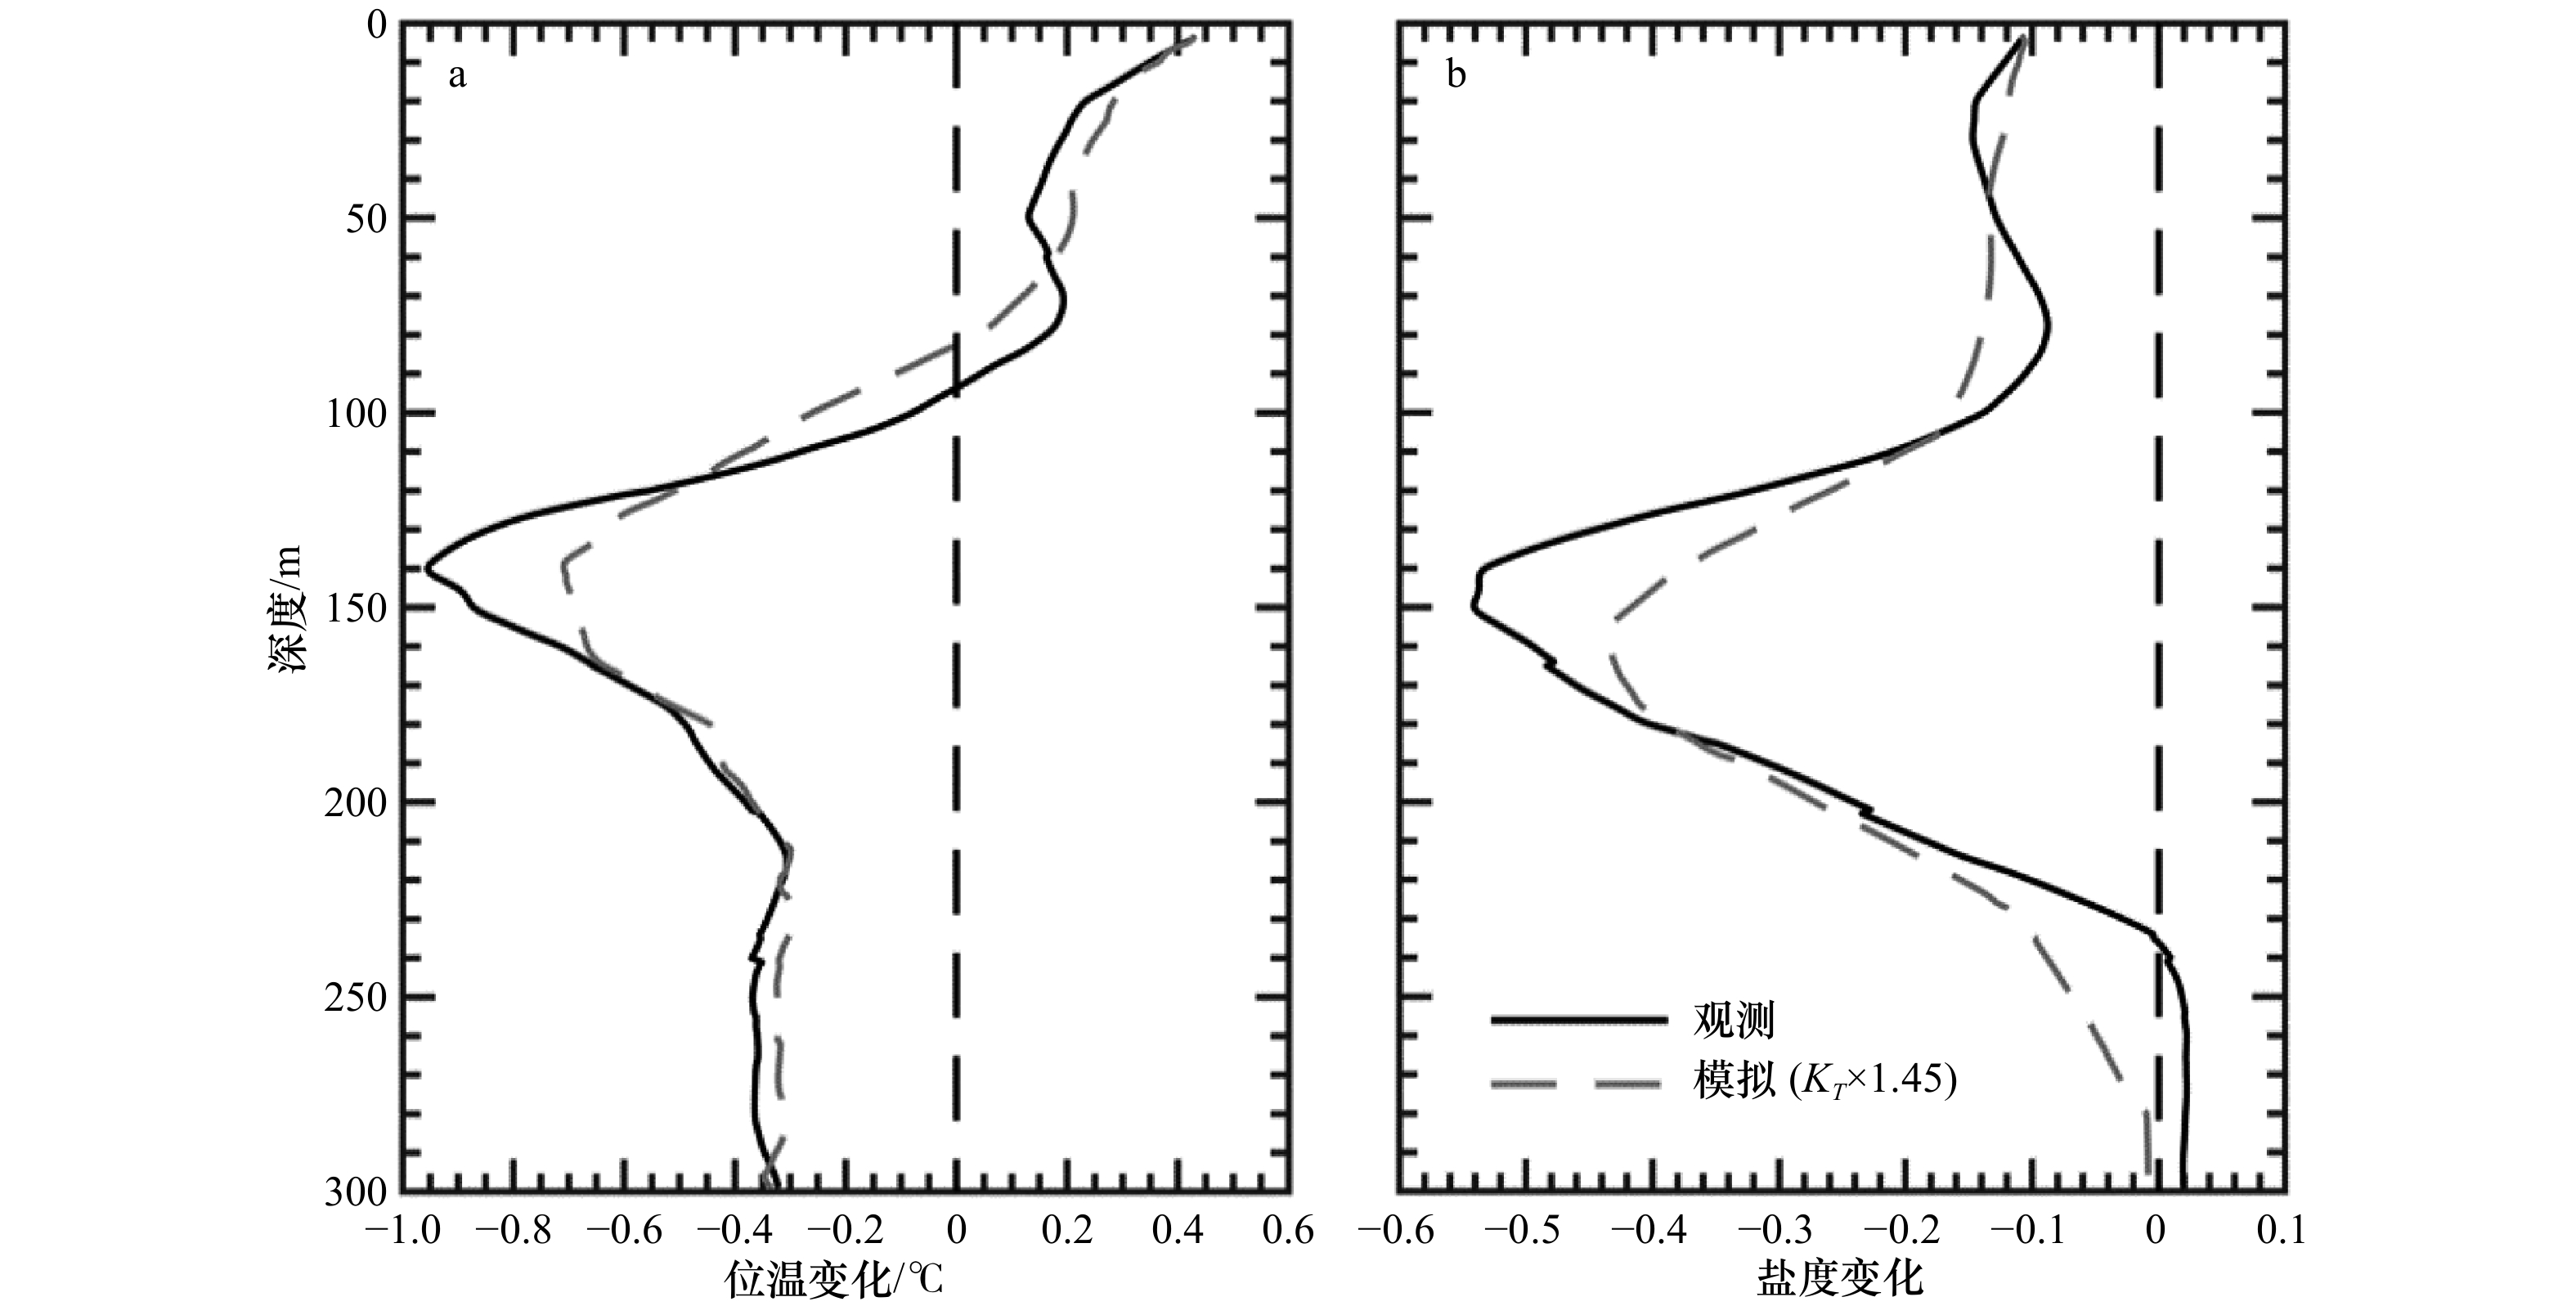
图 10 观测(黑色实线)和模拟(灰色虚线)的位温(a)、盐度(b)变化趋势
Fig. 10 Potential temperature (a),salinity (b) trend of the observation (black solid line) and model (grey dotted line)
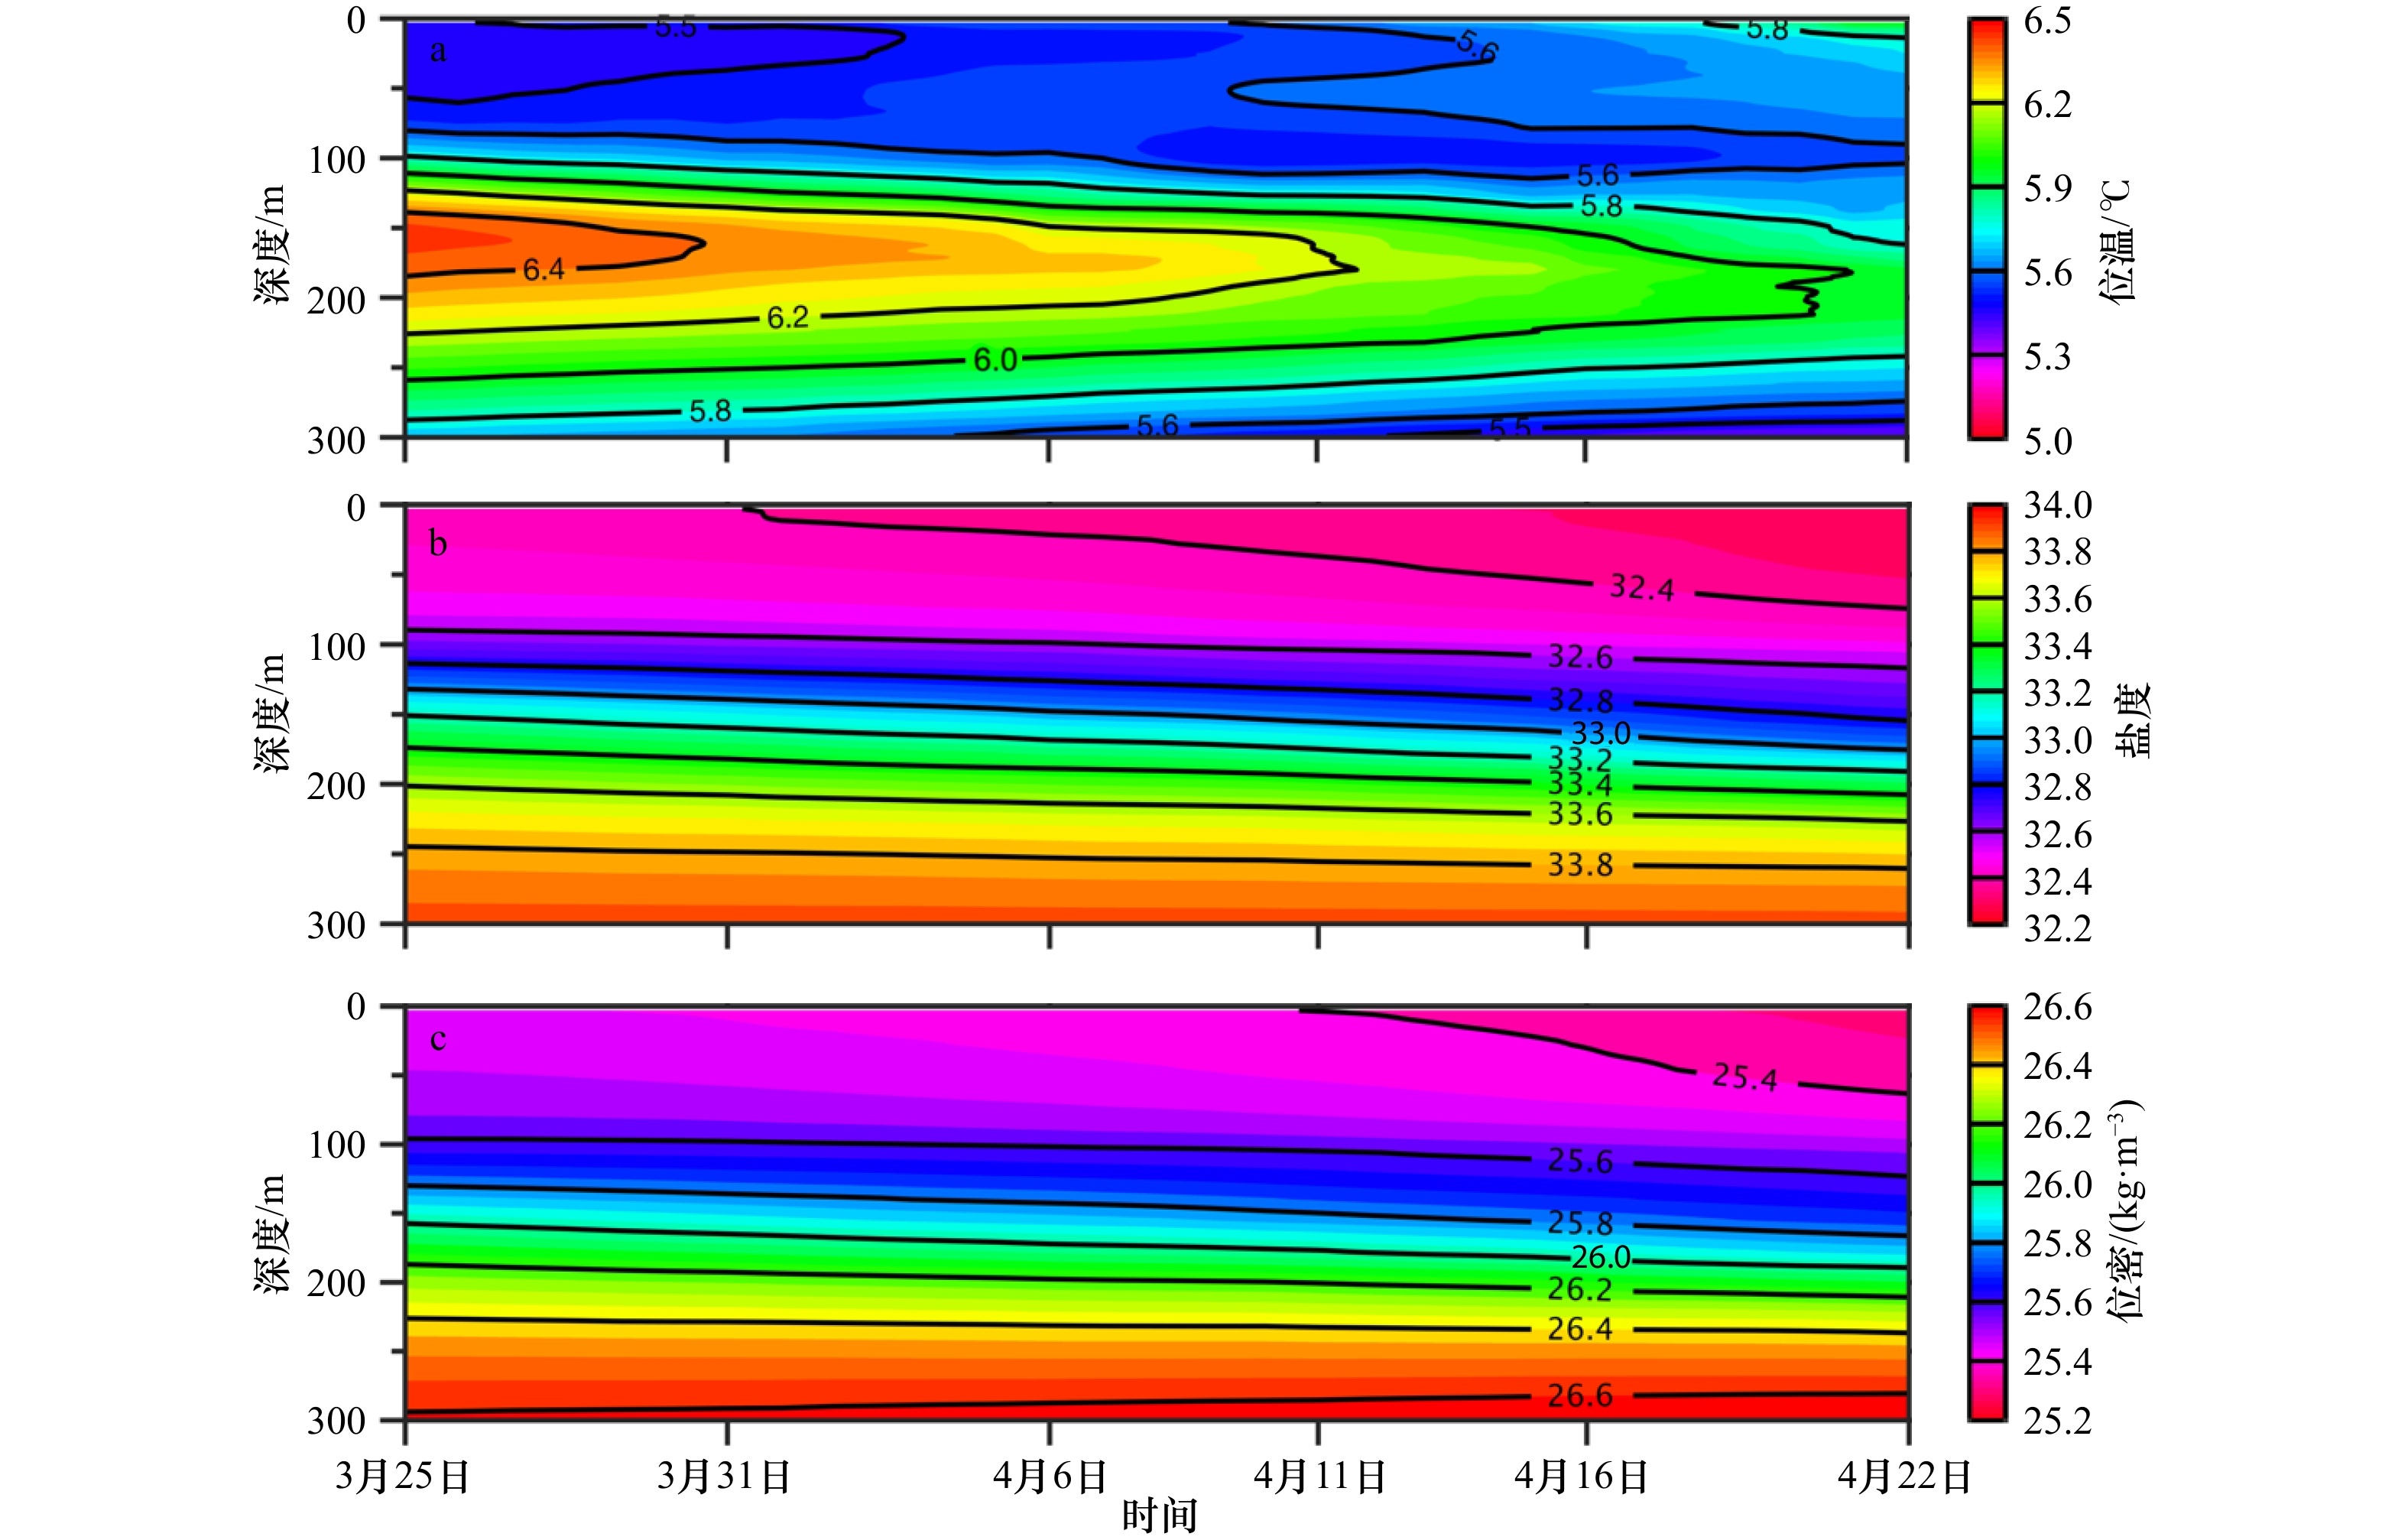
图 11 一维扩散模型模拟的位温(a)、盐度(b)和位密(c)时间变化
Fig. 11 Variations of potential temperature (a), salinity (b), and potential density (c) from the one-dimensional diffusion model
表 1 逆温幅度(
$ \Delta T $ )和逆温厚度($ \Delta D $ )沿陆坡的平均值Tab. 1 Along slope-averaged temperature difference (
$ \Delta T $ ) and thickness ($ \Delta D $ )<52°N 52°~54°N 54°~56°N 56°~58°N 58°~60°N $ \Delta T $/°C 0.60 0.68 0.84 1.04 1.14 $ \Delta D $/m 85 104 126 149 100  下载: 导出CSV
-
[1] Roden G I. Shallow temperature inversions in the Pacific Ocean[J]. Journal of Geophysical Research: Atmosphere, 1964, 69(14): 2899−2914. doi: 10.1029/JZ069i014p02899 [2] Ueno H, Yasuda I. Distribution and formation of the mesothermal structure (temperature inversions) in the North Pacific subarctic region[J]. Journal of Geophysical Research: Oceans, 2000, 105(C7): 16885−16897. doi: 10.1029/2000JC900020 [3] Uda M. Oceanography of the subarctic Pacific Ocean[J]. Journal of the Fisheries Research Board of Canada, 1963, 20(1): 119−179. doi: 10.1139/f63-011 [4] Roden G I. Oceanic subarctic fronts of the central pacific: structure of and response to atmospheric forcing[J]. Journal of Physical Oceanography, 1977, 7(6): 761−778. doi: 10.1175/1520-0485(1977)007<0761:OSFOTC>2.0.CO;2 [5] Ueno H, Yasuda I. Temperature inversions in the subarctic North Pacific[J]. Journal of Physical Oceanography, 2005, 35(12): 2444−2456. doi: 10.1175/JPO2829.1 [6] Chen Xianyao, Qiao Fangli, Ge Renfeng, et al. Development of subsurface warm water in the East China Sea in fall[J]. Journal of Geophysical Research: Oceans, 2006, 111(C11): C11S10. [7] 陈志华, 赵进平. 北冰洋次表层暖水形成机制的研究[J]. 海洋与湖沼, 2010, 41(2): 167−174. doi: 10.11693/hyhz201002002002Chen Zhihua, Zhao Jinping. The thermodynamics of subsurface warm water in the Arctic Ocean[J]. Oceanologia et Limnologia Sinica, 2010, 41(2): 167−174. doi: 10.11693/hyhz201002002002 [8] Ueno H, Yasuda I. Warm and saline water transport to the North Pacific subarctic region: world ocean circulation experiment and subarctic gyre experiment data analysis[J]. Journal of Geophysical Research: Oceans, 2001, 106(C10): 22131−22141. doi: 10.1029/2000JC000457 [9] Ueno H, Oka E, Suga T, et al. Seasonal and interannual variability of temperature inversions in the subarctic North Pacific[J]. Geophysical Research Letters, 2005, 32(20): L20603. doi: 10.1029/2005GL023948 [10] Goszczko I, Ingvaldsen R B, Onarheim I H. Wind-driven cross-shelf exchange–West Spitsbergen current as a source of heat and salt for the adjacent shelf in Arctic winters[J]. Journal of Geophysical Research: Oceans, 2018, 123(4): 2668−2696. doi: 10.1002/2017JC013553 [11] 高郭平, 闫敏斐, 徐智昕, 等. 2011年初冬南极普里兹湾冰间湖区上层水体结构演化研究[J]. 极地研究, 2016, 28(2): 219−227.Gao Guoping, Yan Minfei, Xu Zhixin, et al. The evolution of upper water structure in the Prydz Bay polynya region during Antarctic winter, 2011[J]. Chinese Journal of Polar Research, 2016, 28(2): 219−227. [12] Williams G D, Hindell M, Houssais M N, et al. Upper ocean stratification and sea ice growth rates during the summer-fall transition, as revealed by elephant seal foraging in the Adélie Depression, East Antarctica[J]. Ocean Science, 2011, 7(2): 185−202. doi: 10.5194/os-7-185-2011 [13] Keates T R, Kudela R M, Holser R R, et al. Chlorophyll fluorescence as measured in situ by animal-borne instruments in the northeastern Pacific Ocean[J]. Journal of Marine Systems, 2020, 203: 103265. doi: 10.1016/j.jmarsys.2019.103265 [14] Nakanowatari T, Ohshima K I, Mensah V, et al. Hydrographic observations by instrumented marine mammals in the Sea of Okhotsk[J]. Polar Science, 2017, 13: 56−65. doi: 10.1016/j.polar.2017.06.001 [15] Boehme L, Lovell P, Biuw M, et al. Technical note: animal-borne CTD-Satellite Relay Data Loggers for real-time oceanographic data collection[J]. Ocean Science, 2009, 5(4): 685−695. doi: 10.5194/os-5-685-2009 [16] Roquet F, Charrassin J B, Marchand S, et al. Delayed-mode calibration of hydrographic data obtained from animal-borne satellite relay data loggers[J]. Journal of Atmospheric and Oceanic Technology, 2011, 28(6): 787−801. doi: 10.1175/2010JTECHO801.1 [17] Siegelman L, Roquet F, Mensah V, et al. Correction and accuracy of high- and low-resolution CTD data from animal-borne instruments[J]. Journal of Atmospheric and Oceanic Technology, 2019, 36(5): 745−760. doi: 10.1175/JTECH-D-18-0170.1 [18] Slivinski L C, Compo G P, Whitaker J S, et al. Towards a more reliable historical reanalysis: improvements for version 3 of the Twentieth Century Reanalysis system[J]. Quarterly Journal of the Royal Meteorological Society, 2019, 145(724): 2876−2908. doi: 10.1002/qj.3598 [19] Carton J A, Chepurin G A, Chen L G. SODA3: a new ocean climate reanalysis[J]. Journal of Climate, 2018, 31(17): 6967−6983. doi: 10.1175/JCLI-D-18-0149.1 [20] Feng Ming, Lukas R, Hacker P, et al. Upper-ocean heat and salt balances in the western Equatorial Pacific in response to the intraseasonal oscillation during TOGA COARE[J]. Journal of Climate, 1998, 13(14): 2409−2427. [21] 张莹, 赵进平. 加拿大海盆冰下表层海水湍扩散系数估计[J]. 中国海洋大学学报, 2007, 37(5): 695−703.Zhang Ying, Zhao Jinping. The estimation of vertical turbulent diffusivity in the surface layer in the Canada Basin[J]. Periodical of Ocean University of China, 2007, 37(5): 695−703. [22] Bryan F. Parameter sensitivity of primitive equation ocean general circulation models[J]. Journal of Physical Oceanography, 1987, 17(7): 970−985. doi: 10.1175/1520-0485(1987)017<0970:PSOPEO>2.0.CO;2 [23] Beamer J P, Hill D F, Arendt A, et al. High-resolution modeling of coastal freshwater discharge and glacier mass balance in the Gulf of Alaska watershed[J]. Water Resources Research, 2016, 52(5): 3888−3909. doi: 10.1002/2015WR018457 -


计量
- 文章访问数: 511
- HTML全文浏览量: 217
- PDF下载量: 53
- 被引次数: 0
