

The robust salinity anomaly event during 2015−2017 in the tropical Pacific Ocean
-
摘要: 本文利用Argo海水盐度资料、海流同化数据和同期大气再分析数据,探讨热带太平洋盐度趋势变化和相关动力过程。Argo资料显示,2015−2017年热带太平洋出现显著的盐度异常(SAE),这是改变长期趋势的主要原因,表现为表层显著淡化和次表层咸化特征。这种盐度异常具有明显的区域性特征和垂直结构的差异,体现在热带太平洋北部海区(NTP)和南太平洋辐合区(SPCZ)表层淡化,盐度最大变幅为0.71~0.92,淡化可以达到混合层底;热带太平洋南部海区(STP)次表层咸化,最大变幅为0.46,主要发生在温跃层附近,期间盐度异常沿着等位密面从西向东扩展。平流和挟卷是与SAE密切相关的海洋动力过程,两者在NTP淡化海域有着持续而较为显著的影响,在SPCZ淡化、STP咸化海域后期贡献也较大,其中盐度平流对热带太平洋海区盐度变化起主要贡献。NTP淡化海区表层淡水通量和STP咸化海区密度补偿引起的混合也是SAE的重要影响因素。Abstract: Salinity linear trends and their contributed dynamics processes in the tropical Pacific Ocean were investigated with the Argo salinity and temperature fields, current assimilations and atmospheric reanalysis datasets. The robust salinity anomaly event (SAE) occurred in the tropical Pacific Ocean during 2015−2017, which resulted possibly in the reversing of Argo salinity long-term trends. Such SAE was characterized as distinct regional discrepancies and vertical structures. Significant surface freshening occurred in the northern tropical Pacific (NTP) and Southern Ocean Convergence Zone (SPCZ), whose remarkable freshening maximum could reach 0.71−0.92 and covered the upper mixed layer. Another subsurface salinification in the southern tropical Pacific (STP) with the maximum of 0.46 was found around thermocline layer. Moreover, the salinity anomalies in SAE can expand from west to east along the isopycnal layers. Salinity advection and entrainment were exhibited as the fundamental dynamic processes to the SAE event in the tropical Pacific Ocean, while advection term acted as the major contribution to salinity variability. Both of the dynamic factors played important role on SAE features during the whole event in the NTP and later period in the SPCZ and STP. The surface freshwater flux and subsurface mixing induce by density compensation were also supplements to the SAE events in the NTP freshening and STP salinification respectively.
-

图 1 2004−2014年(a,c)和2004−2017年(b,d)热带太平洋表层(a,b)和次表层(100 m)(c,d)的盐度线性变化趋势
图中黑色点覆盖区域表示盐度线性趋势通过95%的显著性检验
Fig. 1 Surface salinity (a, b) and subsurface (100 m) salinity (c, d) linear trends during 2004−2014 (a, c) and 2004−2017 (b, d) in the tropical Pacific Ocean
The regions shaded in black represented the significant area at the 95% confidence level
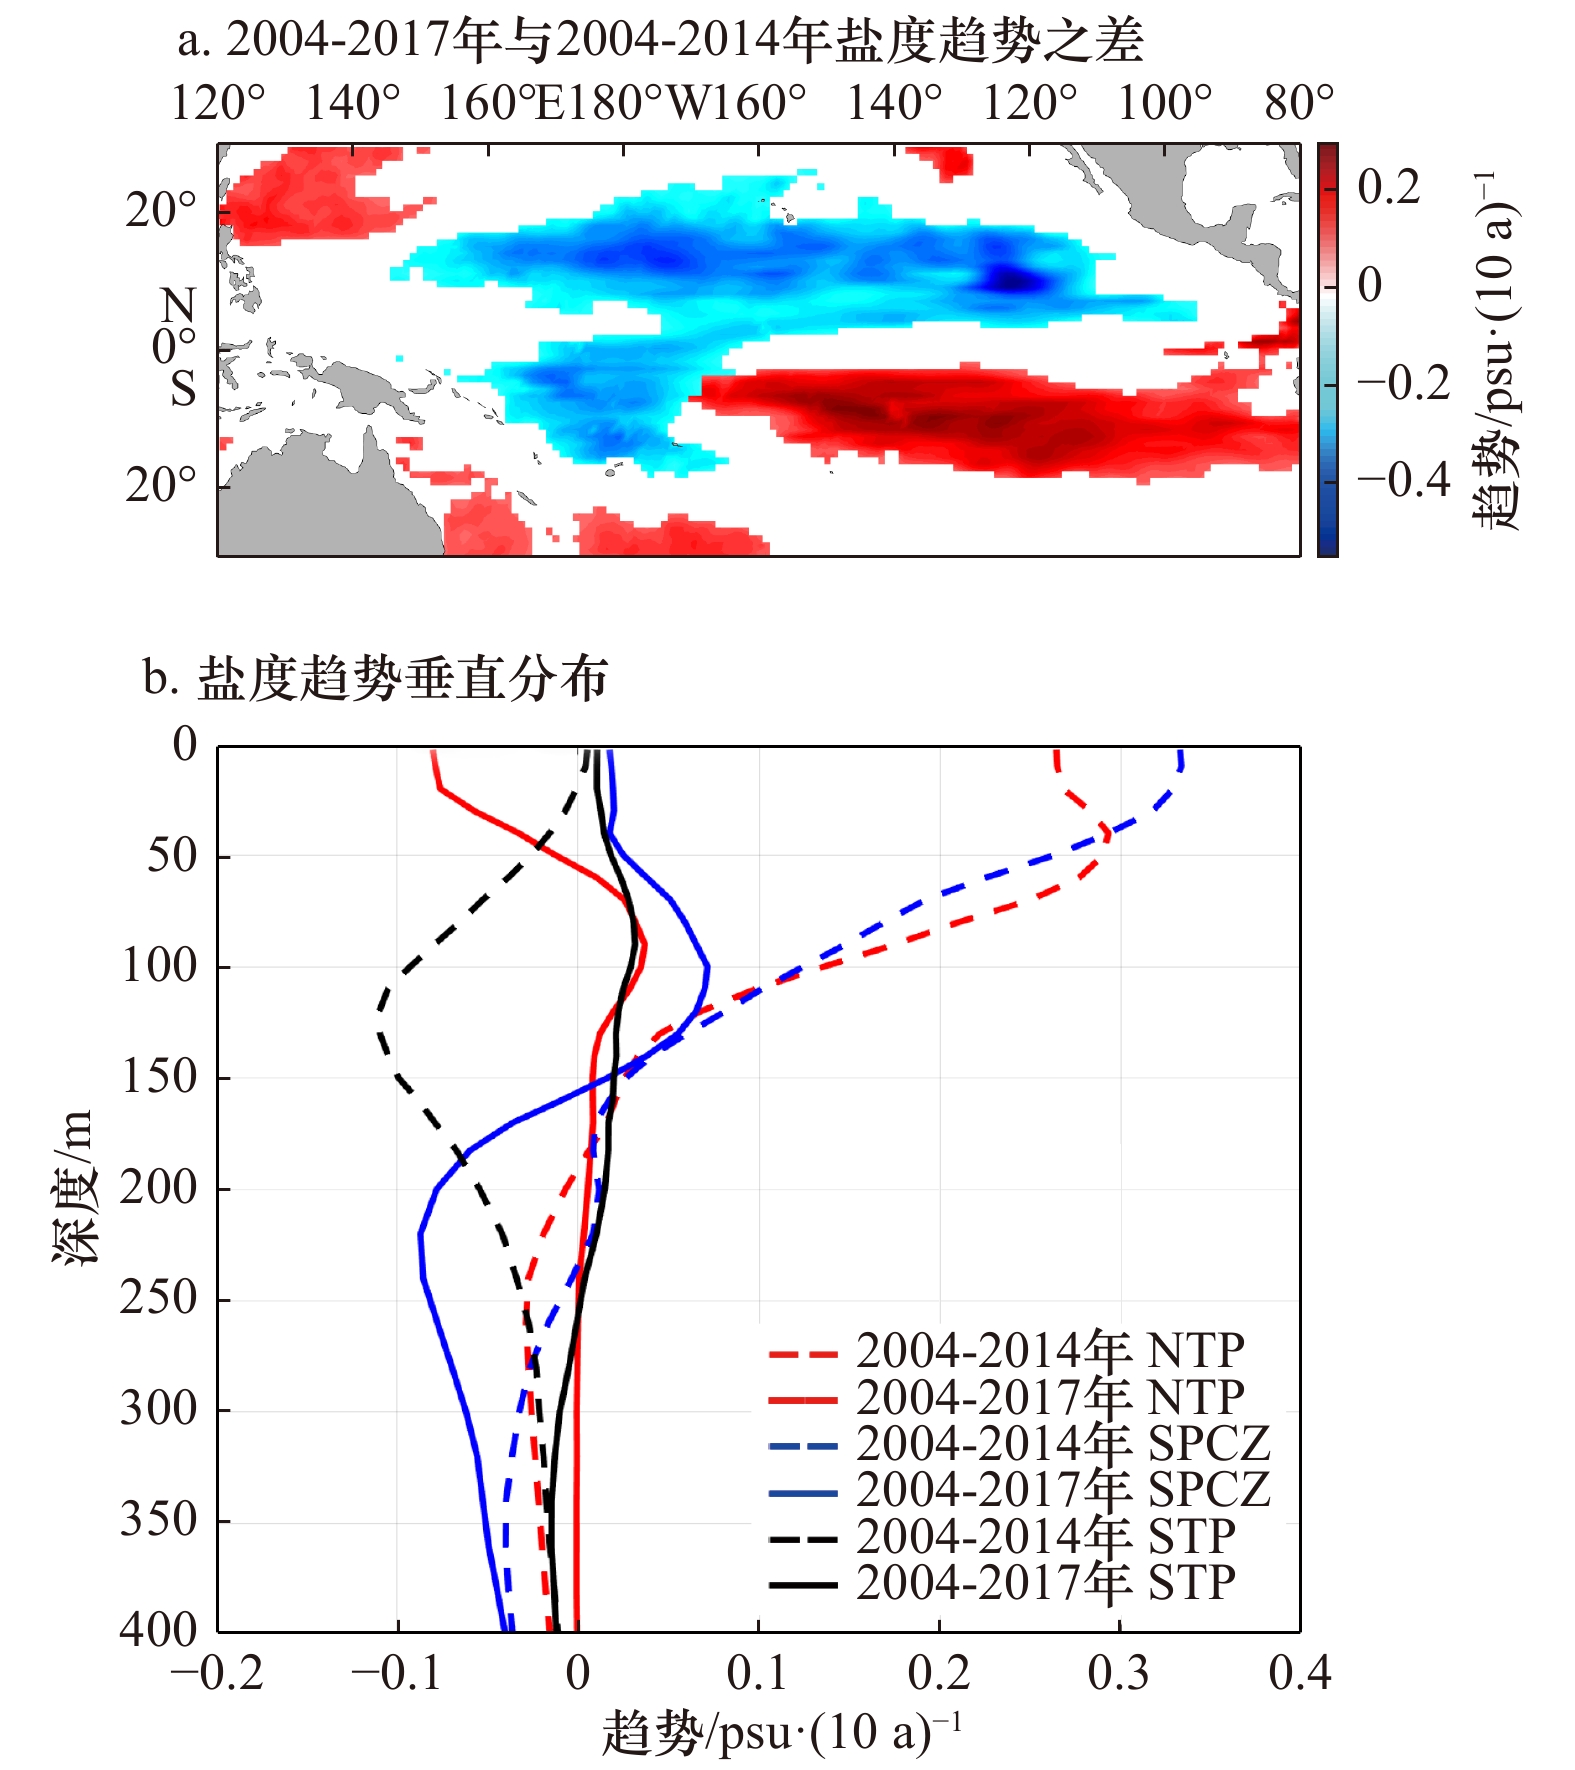
图 2 热带太平洋上层盐度的线性趋势之差(a),及其显著区两个时段盐度趋势的垂直结构(b)
Fig. 2 The salinity trend differences of the two periods (a) and salinity trends vertical structure of the three regions in the upper tropical Pacific Ocean (b)
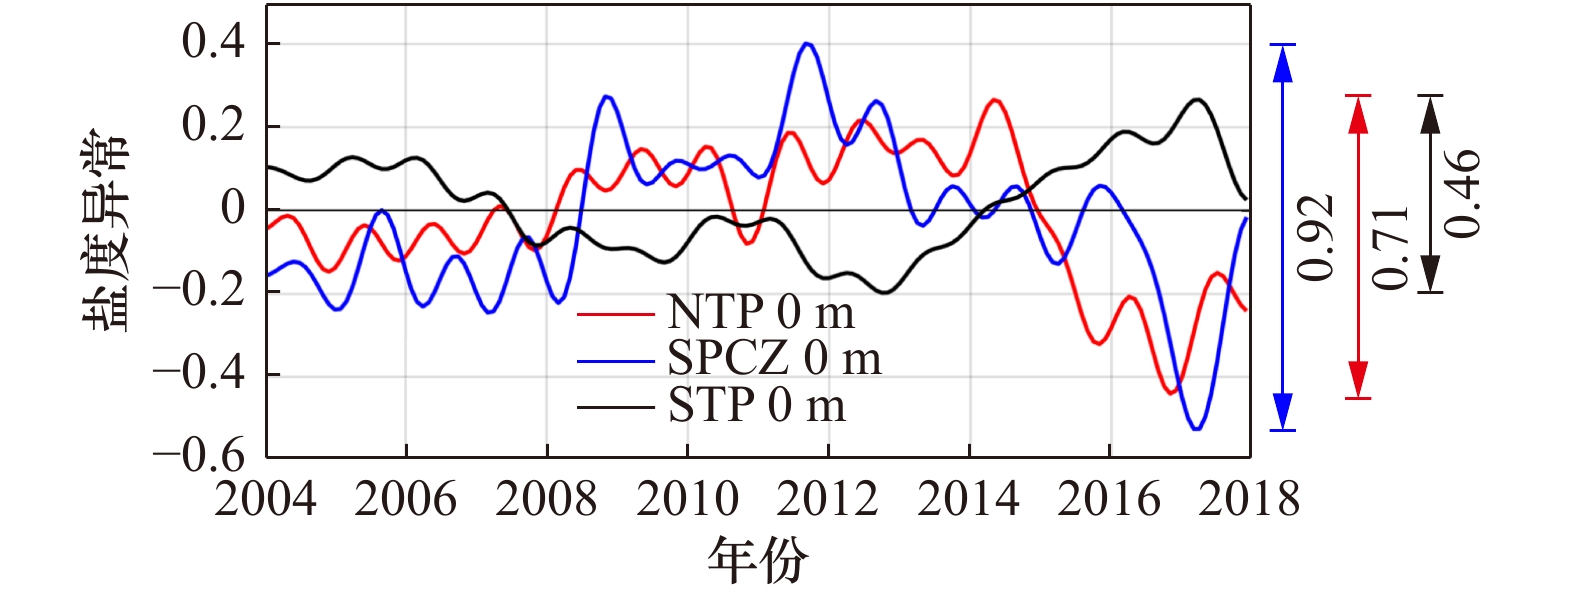
图 3 热带太平洋NTP,SPCZ和STP海区的盐度异常低频变化(13个月低通滤波)
Fig. 3 The 13-month lowpass filtered salinity variabilities of three regions (NTP, SPCZ and STP) in the tropical Pacific Ocean

图 4 2004−2014年(a, d)和2004−2017年(b, e)热带太平洋上层的盐度趋势及温跃层深度变化(c, f)
图中黑色点表示盐度线性趋势通过了95%显著性检验
Fig. 4 Vertical structure of the upper salinity trends (a−e) and thermocline depth trends(c, f) during the 2004−2014 (a, d) and 2004−2017 (b, e) periods in 14°N and 8°S sections
The regions significant at the 95% confidence level are hatched in black
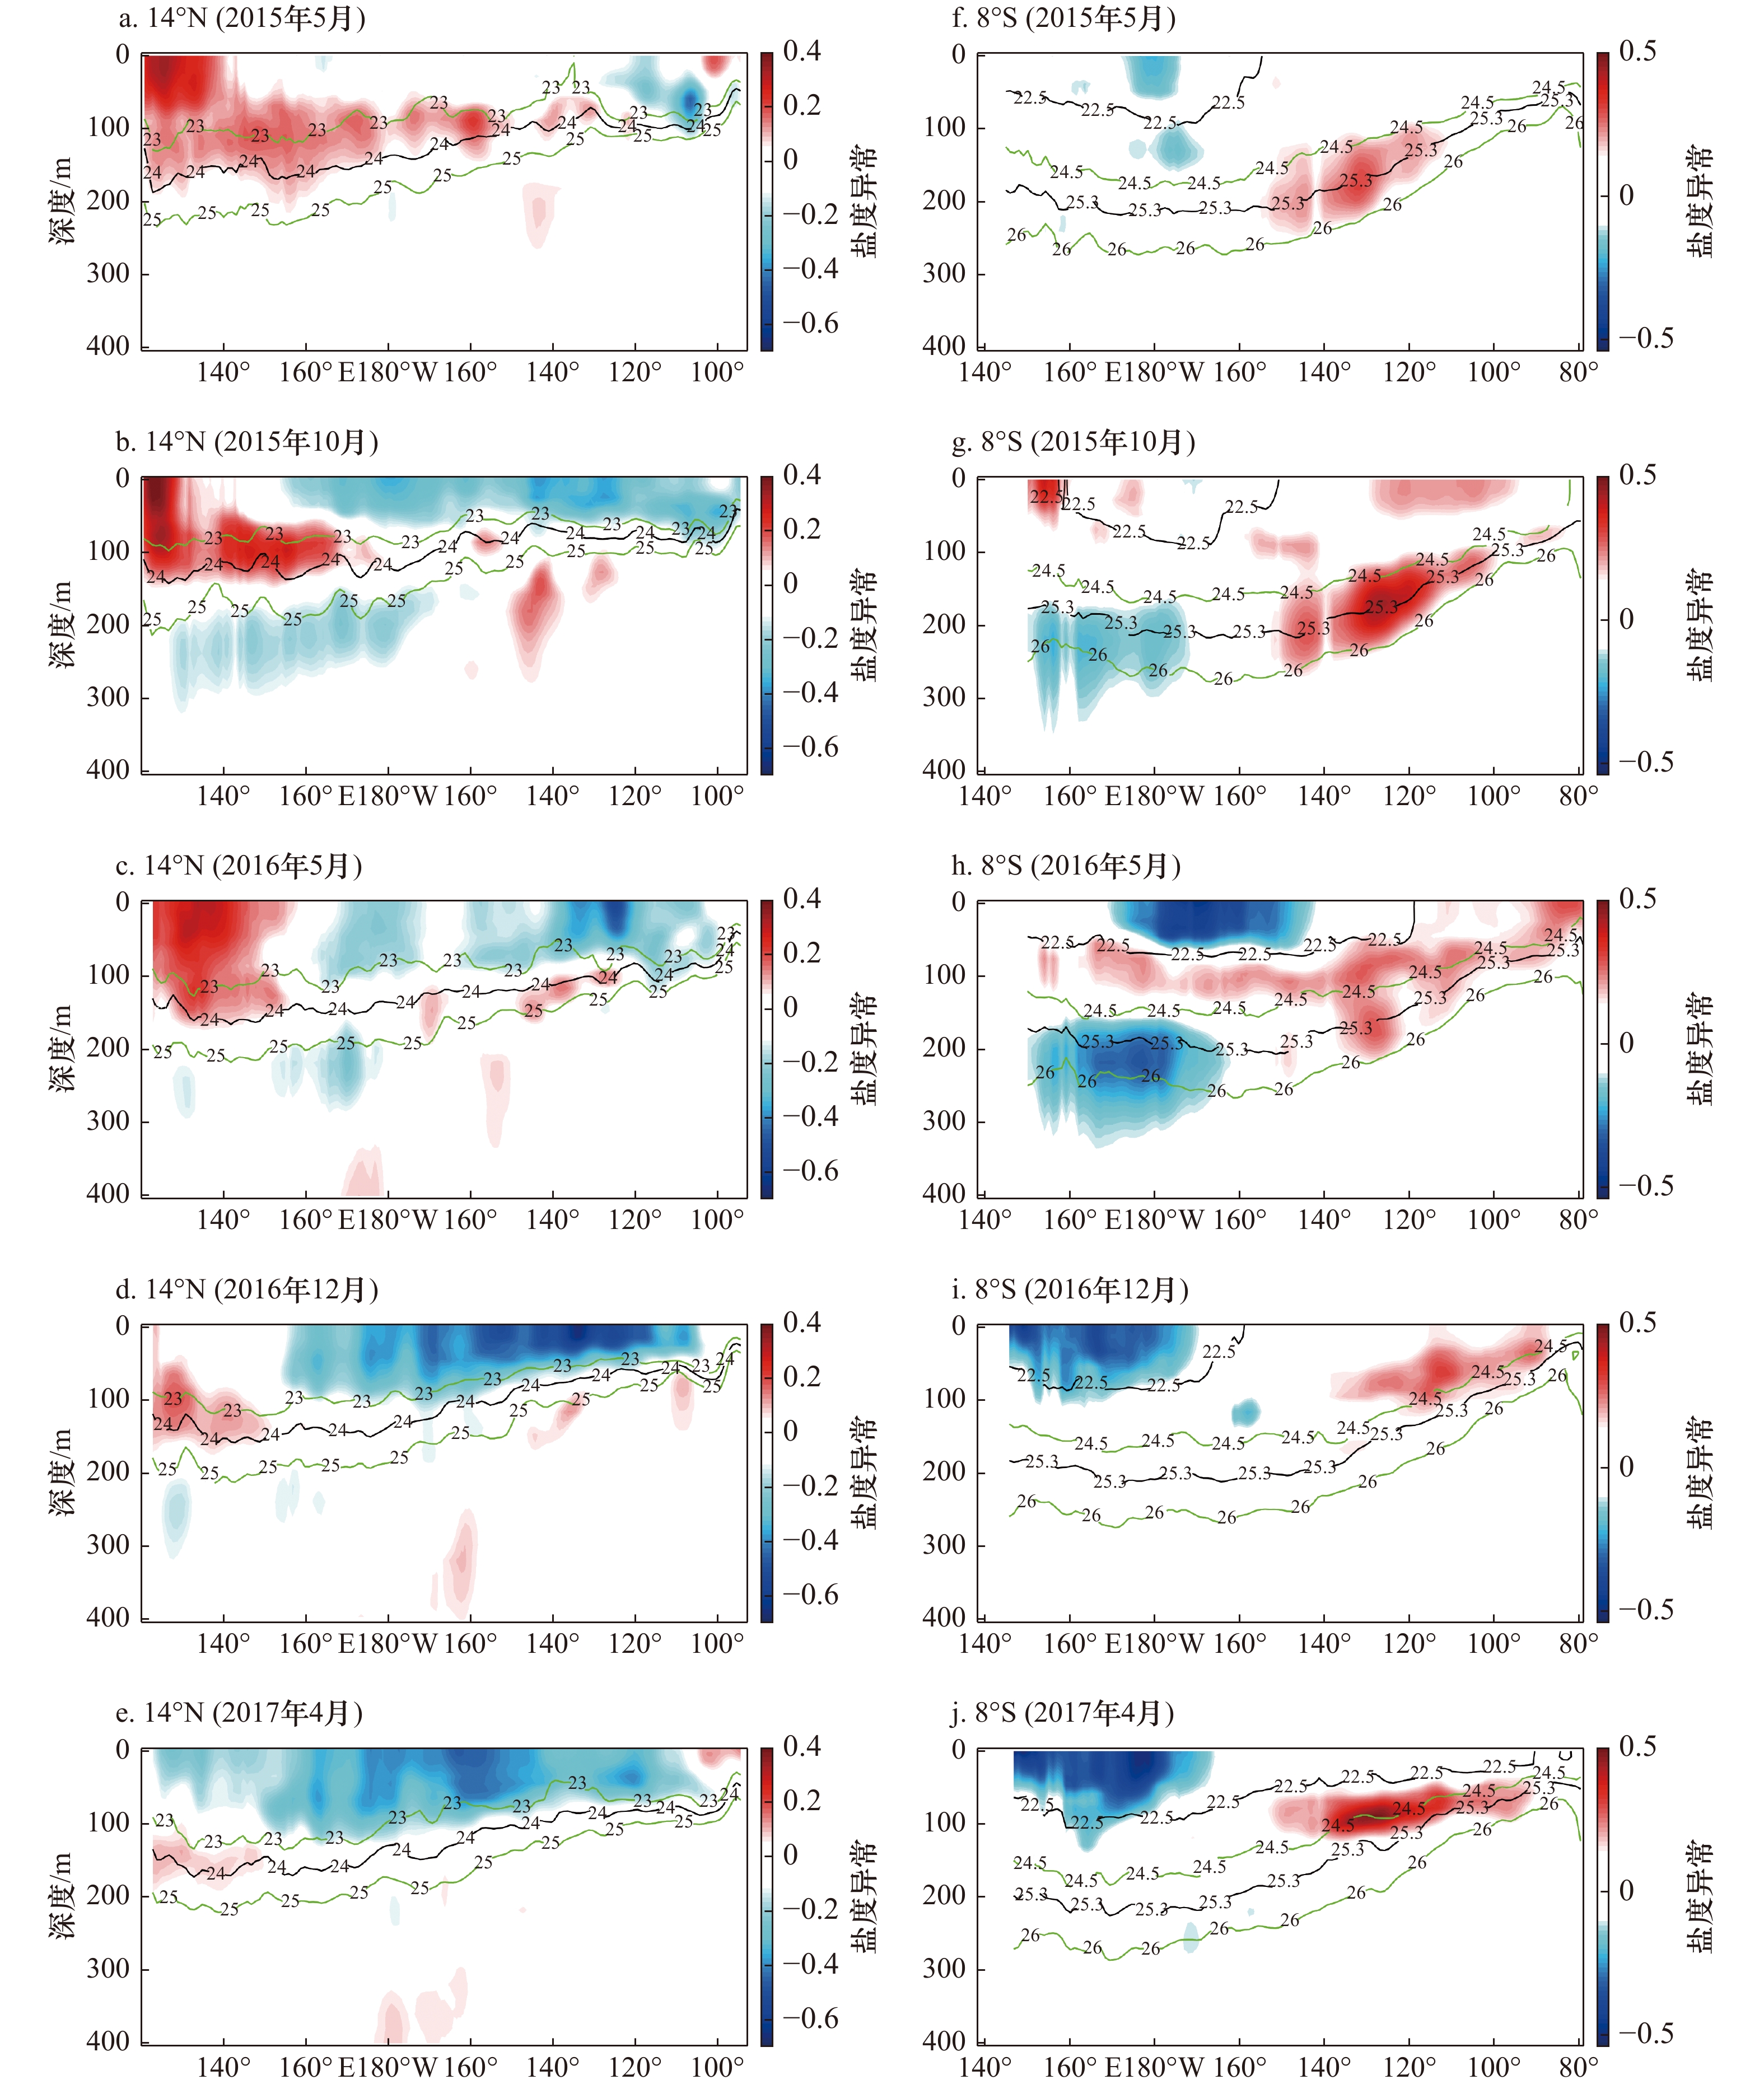
图 5 14°N (a−e)和8°S (f−j) 纬度带上2015−2017年盐度异常事件的垂直结构演变
等值线为等位密面,其中黑线分别代表24σθ,22.5σθ和25.3σθ等位密面
Fig. 5 The evolution of salinity anomaly vertical structure during 2015−2017 in 14°N (a−e) and 8°S (f−j) sections
The contour lines indicate potential isopycnal layers. Black lines represent the 24σθ, 22.5σθ and 25.3σθ,respectively

图 6 14°N和8°S纬度带24σθ和25.3σθ等位密面上的盐度异常时空变化
Fig. 6 The salinity anomaly spatiotemporal variability on 24σθ and 25.3σθ potential isopycnal layers respectively in the 14°N and 8°S sections
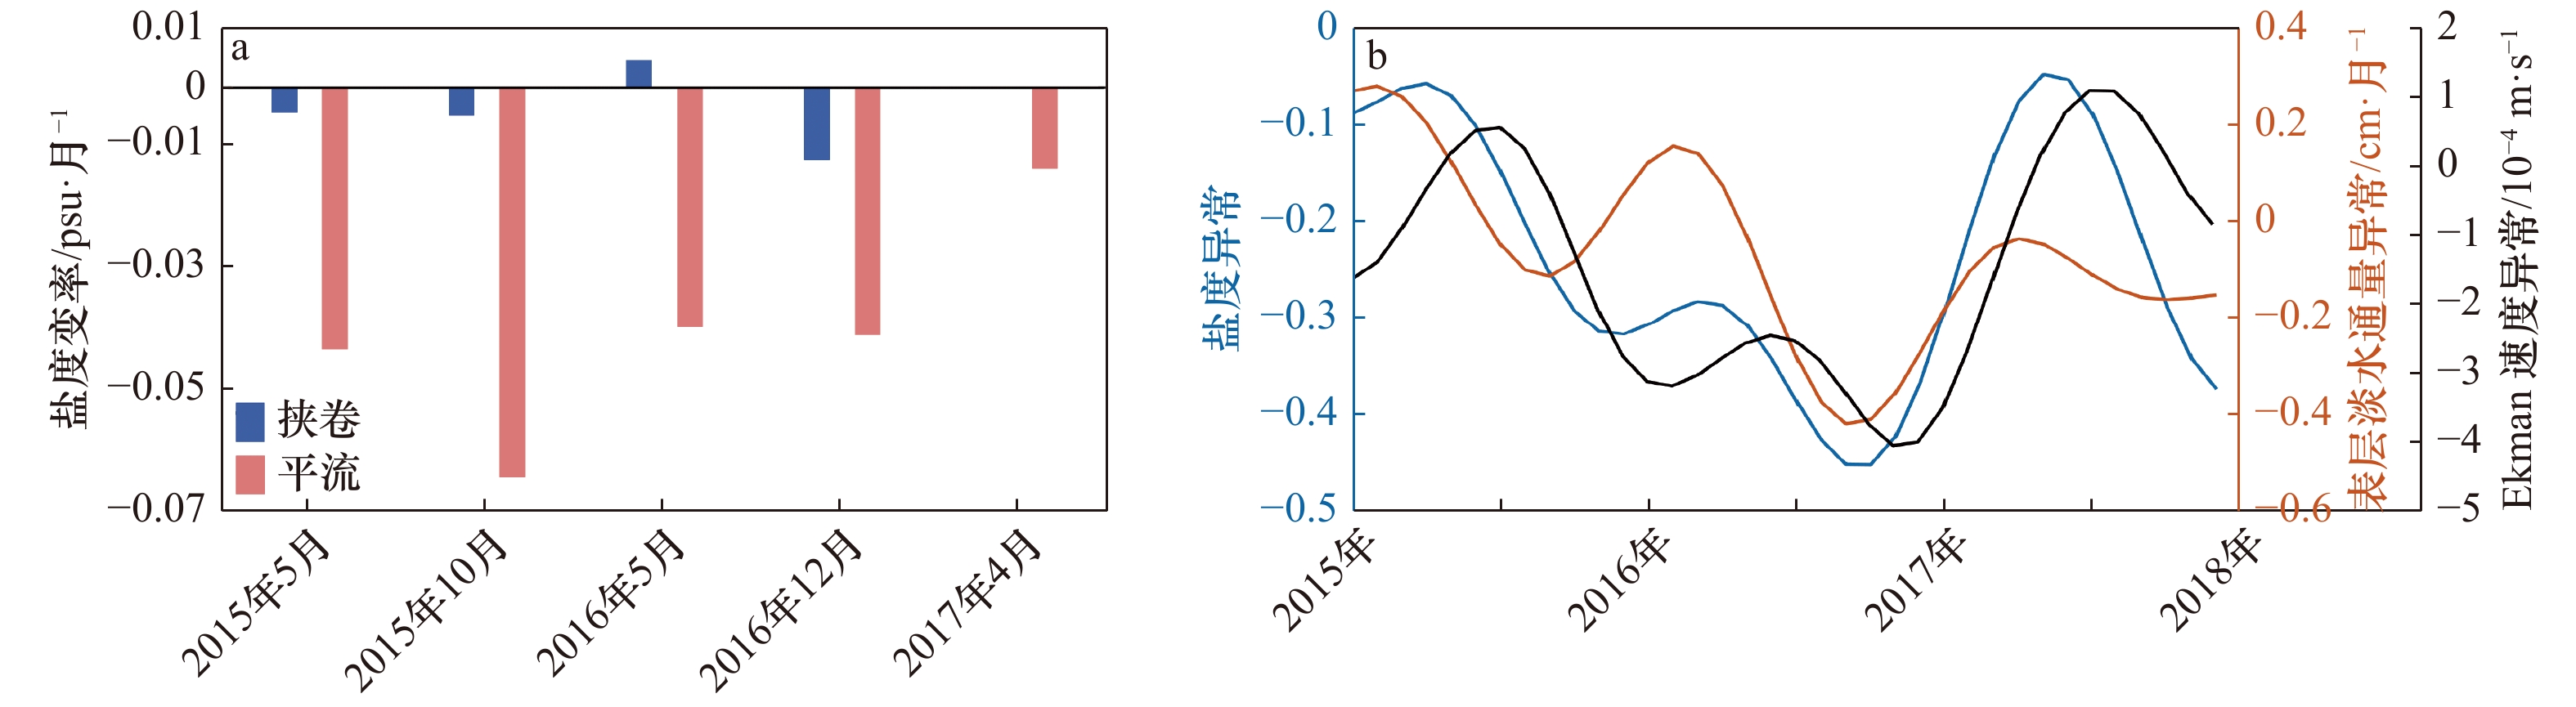
图 7 NTP淡化海区平流和挟卷过程的贡献(a)、局地(10°~20°N,100°~140°W)表层盐度、淡水通量、Ekman输运速度异常的低频变化(b)
Fig. 7 Salinity advection and entrainment fractions (a), low frequency variability of surface salinity, freshwater flux and Ekman transport velocity in NTP freshening region (10°~20°N,100°~140°W)(b)
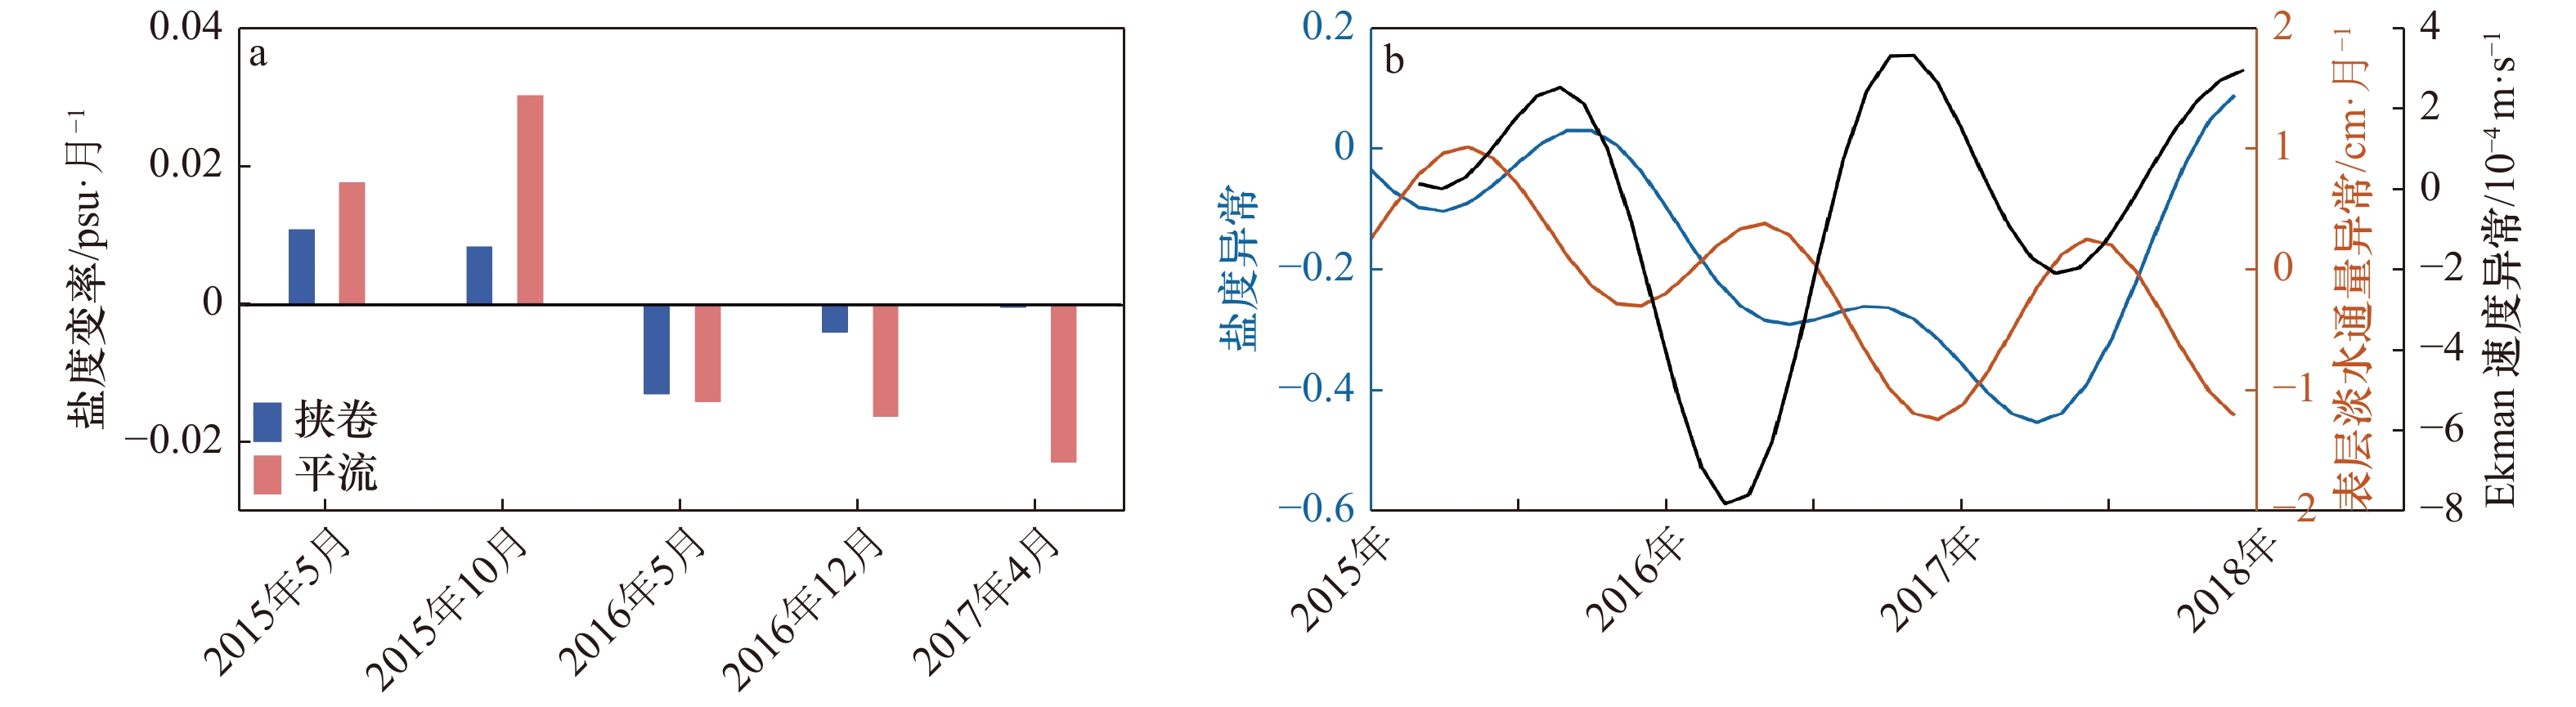
图 8 SPCZ淡化海域平流和挟卷的贡献(a),局地(5°~10°S,170°E~180°)表层盐度、淡水通量、Ekman输运速度异常的低频变化(b)
Fig. 8 Salinity advection and entrainment fractions (a), low frequency variability of surface salinity, freshwater flux and Ekman transport velocity in SPCZ freshening region (5°~10°S,170°E~180°) (b)
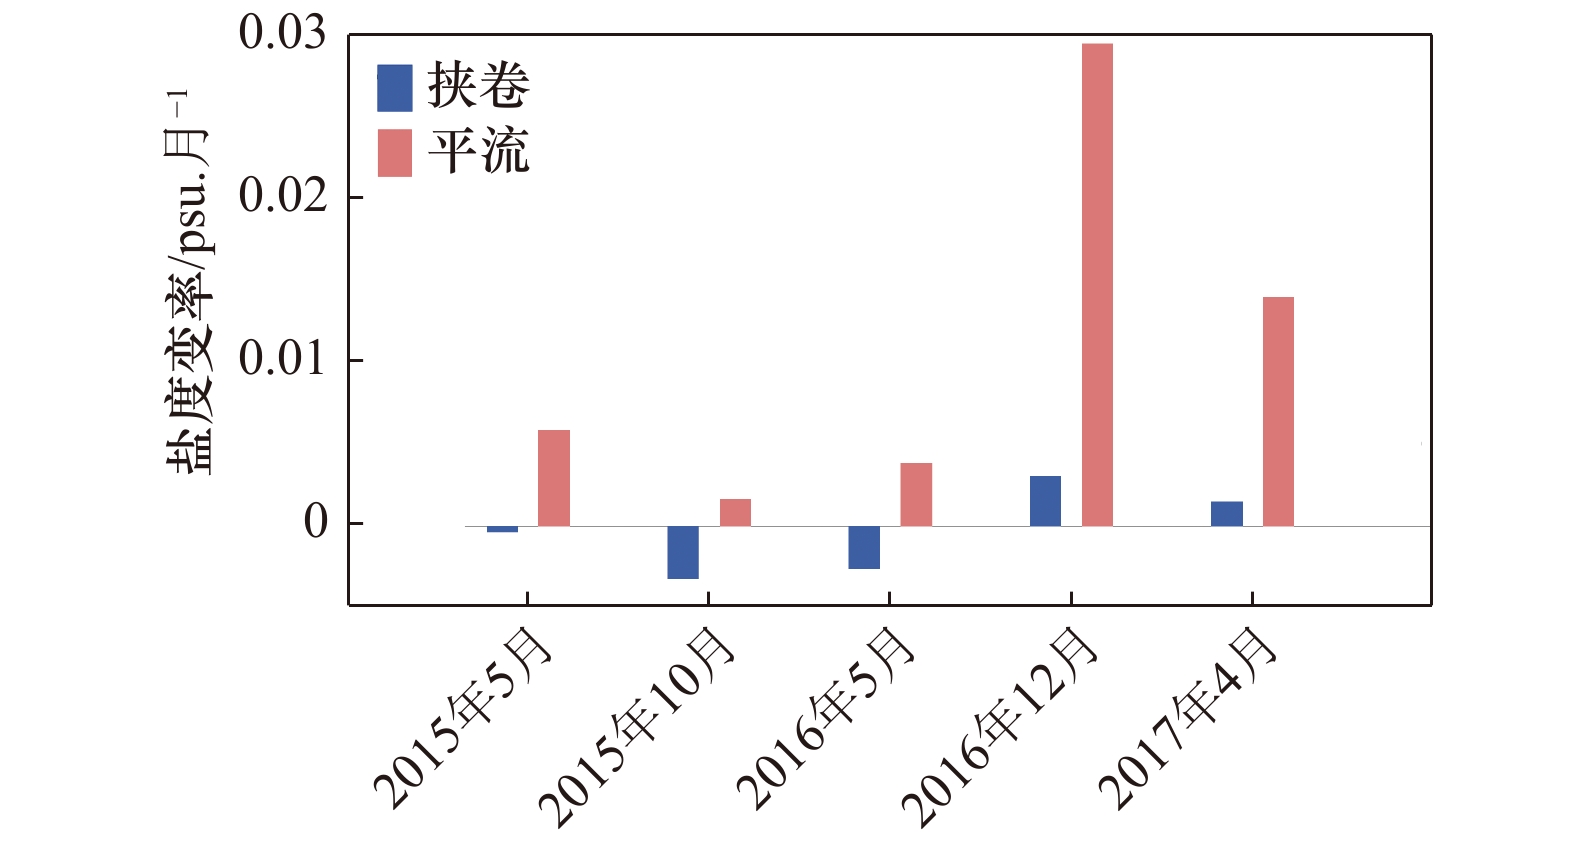
图 9 咸化海区(STP)平流和挟卷的动力贡献
Fig. 9 The contribution of salinity advection and entrainment terms to the STP salinification SAE

图 10 2015年6–8月STP海区盐度垂向梯度
黑色等值线分别代表混合层、24σθ和25.3σθ等位密面的所在深度;绿线指示了温度垂向梯度;若垂向梯度值大于0,表示随着深度增加分别对应着盐度增加和温度升高
Fig. 10 Salinity vertical gradients in STP from June to August, 2015
The black contours indicate the depth of the mix layer, 24σθ and 25.3σθ isopycnal. Green contours indicate the temperature vertical gradient. If the vertical gradient >0, it means that the salinity and temperature increases with the depth respectively
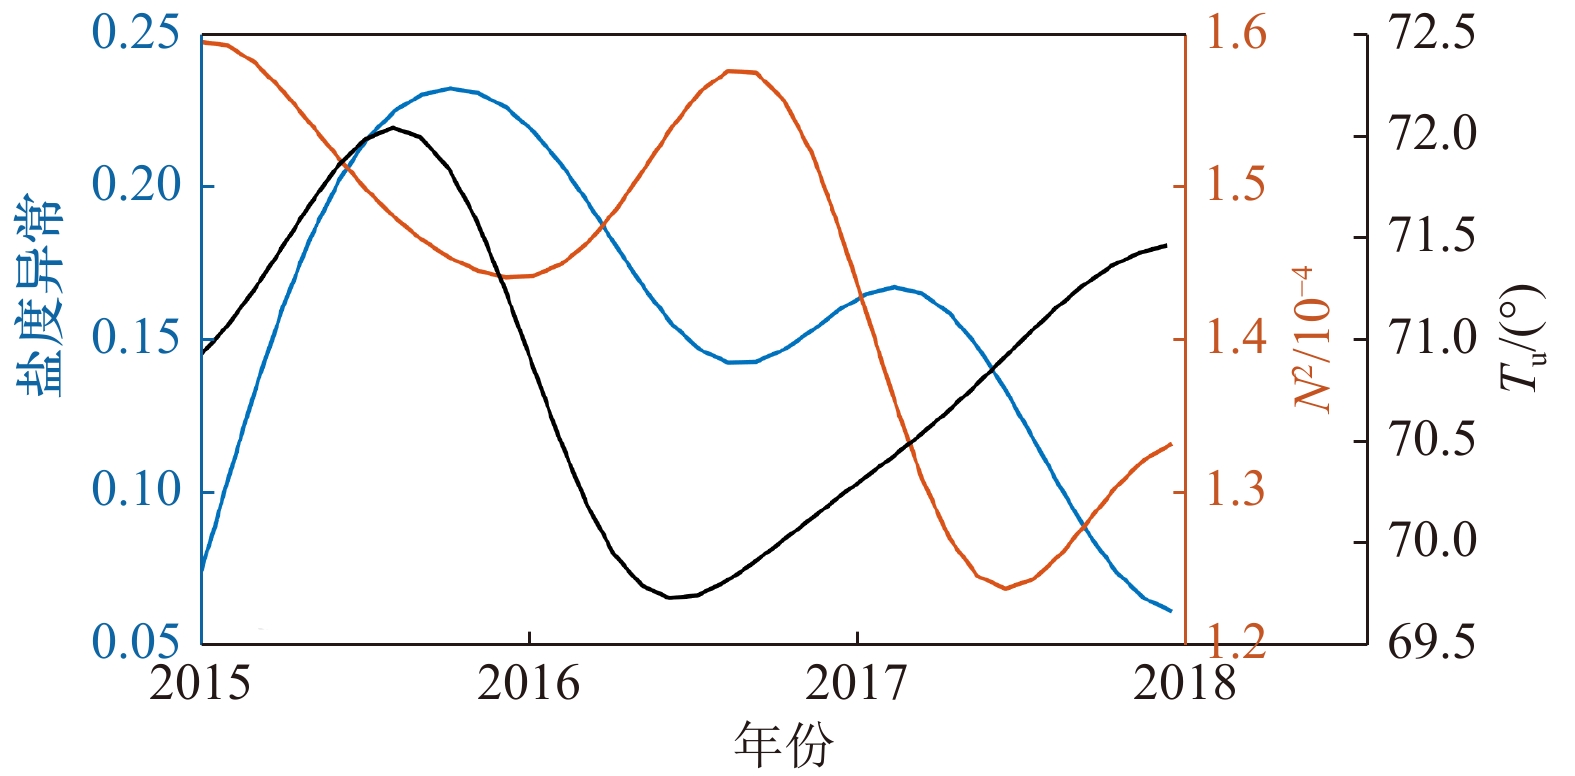
表 1 热带太平洋3个海区在两个时间段的盐度变化特征
Tab. 1 The salinity variability in the tropical Pacific Ocean three key regions during the two periods
NTP SPCZ STP(100 m) 2004−2014年 2004−2017年 2004−2014年 2004−2017年 2004−2014年 2004−2017年 平均盐度 34.4 34.3 34.9 34.8 36.0 36.1 趋势/psu·(10 a)−1 0.26 −0.08 0.33 0.02 −0.21 0.03 趋势差异*/psu·(10 a)−1 −0.34 −0.31 0.24 盐度变幅** 0.71 0.92 0.46 注:*表示2004−2017年盐度趋势与2004−2014年盐度趋势之差;**表示2004−2017年各海区盐度低频变化的幅度,详见图3。  下载: 导出CSV
-
[1] Durack P J. Ocean salinity and the global water cycle[J]. Oceanography, 2015, 28(1): 20−31. doi: 10.5670/oceanog.2015.03 [2] Cravatte S, Delcroix T, Zhang Dongxiao, et al. Observed freshening and warming of the western Pacific Warm Pool[J]. Climate Dynamics, 2009, 33(4): 565−589. doi: 10.1007/s00382-009-0526-7 [3] Maes C. Estimating the influence of salinity on sea level anomaly in the ocean[J]. Geophysical Research Letters, 1998, 25(19): 3551−3554. doi: 10.1029/98GL02758 [4] Antonov J I, Levitus S, Boyer T P. Steric sea level variations during 1957−1994: importance of salinity[J]. Journal of Geophysical Research: Oceans, 2002, 107(C12): 14−1. [5] Bindoff N L, Willebrand J, Artale V, et al. Observations: oceanic climate change and sea level[M]//Solomon S, Qin D, Manning M, et al. Climate Change 2007: the Physical Science Basis: Contribution of Working Group I to the Fourth Assessment Report of the Intergovernmental Panel on Climate Change. Cambridge, UK: Cambridge University Press, 2007: 385−432. [6] Katsura S, Oka E, Qiu Bo, et al. Formation and subduction of North Pacific tropical water and their interannual variability[J]. Journal of Physical Oceanography, 2013, 43(11): 2400−2415. doi: 10.1175/JPO-D-13-031.1 [7] Held I M, Soden B J. Robust responses of the hydrological cycle to global warming[J]. Journal of Climate, 2006, 19(21): 5686−5699. doi: 10.1175/JCLI3990.1 [8] Terray L, Corre L, Cravatte S, et al. Near-surface salinity as nature’s rain gauge to detect human influence on the tropical water cycle[J]. Journal of Climate, 2012, 25(3): 958−977. doi: 10.1175/JCLI-D-10-05025.1 [9] Hosoda S, Suga T, Shikama N, et al. Global surface layer salinity change detected by Argo and its implication for hydrological cycle intensification[J]. Journal of Oceanography, 2009, 65(4): 579−586. doi: 10.1007/s10872-009-0049-1 [10] Delcroix T, Cravatte S, McPhaden M J. Decadal variations and trends in tropical Pacific sea surface salinity since 1970[J]. Journal of Geophysical Research: Oceans, 2007, 112(C3): C03012. [11] Du Yan, Zhang Yuhong, Shi Jiancheng. Relationship between sea surface salinity and ocean circulation and climate change[J]. Science China Earth Sciences, 2019, 62(5): 771−782. doi: 10.1007/s11430-018-9276-6 [12] Durack P J, Wijffels S E. Fifty-year trends in global ocean salinities and their relationship to broad-scale warming[J]. Journal of Climate, 2010, 23(16): 4342−4362. doi: 10.1175/2010JCLI3377.1 [13] Purich A, England M H, Cai Wenju, et al. Impacts of broad-scale surface freshening of the Southern Ocean in a coupled climate model[J]. Journal of Climate, 2018, 31(7): 2613−2632. doi: 10.1175/JCLI-D-17-0092.1 [14] Blunden J, Arndt D S. State of the climate in 2015[J]. Bulletin of the American Meteorological Society, 2016, 97(8): Si-S275. [15] Boyer T P, Levitus S, Antonov J I, et al. Linear trends in salinity for the World Ocean, 1955−1998[J]. Geophysical Research Letters, 2005, 32(1): L01604. [16] Durack P J, Wijffels S E, Boyer T P. Long-term salinity changes and implications for the global water cycle[M]//Siedler G, Griffies S M, Gould J, et al. International Geophysics. Amsterdam: Academic Press, 2013, 103: 727−757. [17] Wong A P S, Bindoff N L, Church J A. Freshwater and heat changes in the North and South Pacific Oceans between the 1960s and 1985-94[J]. Journal of Climate, 2001, 14(7): 1613−1633. doi: 10.1175/1520-0442(2001)014<1613:FAHCIT>2.0.CO;2 [18] Oka E, Katsura S, Inoue H, et al. Long-term change and variation of salinity in the western North Pacific subtropical gyre revealed by 50-year long observations along 137°E[J]. Journal of Oceanography, 2017, 73(4): 479−490. doi: 10.1007/s10872-017-0416-2 [19] Du Yan, Zhang Yuhong, Feng Ming, et al. Decadal trends of the upper ocean salinity in the tropical Indo-Pacific since mid-1990s[J]. Scientific Reports, 2015, 5: 16050. doi: 10.1038/srep16050 [20] Yan Youfang, Svendsen L, Wang Chunzai, et al. A north-south contrast of subsurface salinity anomalies in the northwestern Pacific from 2002 to 2013[J]. Journal of Geophysical Research: Oceans, 2019, 124(3): 1795−1806. doi: 10.1029/2018JC014656 [21] Delcroix T, Hénin C. Seasonal and interannual variations of sea surface salinity in the tropical Pacific Ocean[J]. Journal of Geophysical Research: Oceans, 1991, 96(C12): 22135−22150. doi: 10.1029/91JC02124 [22] Johnson E S, Lagerloef G S E, Gunn J T, et al. Surface salinity advection in the tropical oceans compared with atmospheric freshwater forcing: a trial balance[J]. Journal of Geophysical Research: Oceans, 2002, 107(C12): SRF 15−1−SRF 15−11. doi: 10.1029/2001JC001122 [23] Vialard J, Delecluse P, Menkes C. A modeling study of salinity variability and its effects in the tropical Pacific Ocean during the 1993-1999 period[J]. Journal of Geophysical Research: Oceans, 2002, 107(C12): SRF 6−1−SRF 6−14. doi: 10.1029/2000JC000758 [24] Bindoff N L, Mcdougall T J. Diagnosing climate change and ocean ventilation using hydrographic data[J]. Journal of Physical Oceanography, 1994, 24(6): 1137−1152. doi: 10.1175/1520-0485(1994)024<1137:DCCAOV>2.0.CO;2 [25] Nonaka M, Sasaki H. Formation mechanism for isopycnal temperature-salinity anomalies propagating from the eastern South Pacific to the equatorial region[J]. Journal of Climate, 2007, 20(7): 1305−1315. doi: 10.1175/JCLI4065.1 [26] Yeager S G, Large W G. Observational evidence of winter spice injection[J]. Journal of Physical Oceanography, 2007, 37(12): 2895−2919. doi: 10.1175/2007JPO3629.1 [27] Cronin M F, McPhaden M J. Upper ocean salinity balance in the western equatorial Pacific[J]. Journal of Geophysical Research: Oceans, 1998, 103(C12): 27567−27587. doi: 10.1029/98JC02605 [28] Foltz G R, Grodsky S A, Carton J A, et al. Seasonal salt budget of the northwestern tropical Atlantic Ocean along 38°W[J]. Journal of Geophysical Research: Oceans, 2004, 109(C3): C03052. [29] Dong Shenfu, Garzoli S L, Baringer M. An assessment of the seasonal mixed layer salinity budget in the Southern Ocean[J]. Journal of Geophysical Research: Oceans, 2009, 114(C12): C12001. doi: 10.1029/2008JC005258 [30] Gao Shan, Qu Tangdong, Nie Xunwei. Mixed layer salinity budget in the tropical Pacific Ocean estimated by a global GCM[J]. Journal of Geophysical Research: Oceans, 2014, 119(12): 8255−8270. doi: 10.1002/2014JC010336 [31] Chi Jingshan, Du Yan, Zhang Yuhong, et al. A new perspective of the 2014/15 failed El Niño as seen from ocean salinity[J]. Scientific Reports, 2019, 9: 2720. doi: 10.1038/s41598-019-38743-z [32] Gasparin F, Roemmich D. The strong freshwater anomaly during the onset of the 2015/2016 El Niño[J]. Geophysical Research Letters, 2016, 43(12): 6452−6460. doi: 10.1002/2016GL069542 [33] Roemmich D, Gilson J. The 2004-2008 mean and annual cycle of temperature, salinity, and steric height in the global ocean from the Argo Program[J]. Progress in Oceanography, 2009, 82(2): 81−100. doi: 10.1016/j.pocean.2009.03.004 [34] Behringer D, Xue Yan. Evaluation of the global ocean data assimilation system at NCEP: the Pacific Ocean[C]//Proceedings of the Eighth Symposium on Integrated Observing and Assimilation Systems for Atmosphere, Oceans, and Land Surface. Seattle, Washington: AMS, 2004. [35] Dee D P, Uppala S M, Simmons A J, et al. The ERA-Interim reanalysis: configuration and performance of the data assimilation system[J]. Quarterly Journal of the Royal Meteorological Society, 2011, 137(656): 553−597. doi: 10.1002/qj.828 [36] Yu Lisan, Weller R A. Objectively analyzed air-sea heat fluxes for the global ice-free oceans (1981-2005)[J]. Bulletin of the American Meteorological Society, 2007, 88(4): 527−540. doi: 10.1175/BAMS-88-4-527 [37] Huffman G J, Adler R F, Arkin P, et al. The global precipitation climatology project (GPCP) combined precipitation dataset[J]. Bulletin of the American Meteorological Society, 1997, 78(1): 5−20. doi: 10.1175/1520-0477(1997)078<0005:TGPCPG>2.0.CO;2 [38] Adler R F, Huffman G J, Chang A, et al. The version-2 global precipitation climatology project (GPCP) monthly precipitation analysis (1979-present)[J]. Journal of Hydrometeorology, 2003, 4(6): 1147−1167. doi: 10.1175/1525-7541(2003)004<1147:TVGPCP>2.0.CO;2 [39] Wong A P S, Johnson G C. South Pacific eastern subtropical mode water[J]. Journal of Physical Oceanography, 2003, 33(7): 1493−1509. doi: 10.1175/1520-0485(2003)033<1493:SPESMW>2.0.CO;2 [40] Qu Tangdong, Gao Shan. Resurfacing of South Pacific tropical water in the Equatorial Pacific and its variability associated with ENSO[J]. Journal of Physical Oceanography, 2017, 47(5): 1095−1106. doi: 10.1175/JPO-D-16-0078.1 [41] Huang Ruixin, Qiu Bo. The structure of the wind-driven circulation in the subtropical South Pacific Ocean[J]. Journal of Physical Oceanography, 1998, 28(6): 1173−1186. doi: 10.1175/1520-0485(1998)028<1173:TSOTWD>2.0.CO;2 [42] Stevenson J W, Niiler P P. Upper ocean heat budget during the Hawaii-to-Tahiti shuttle experiment[J]. Journal of Physical Oceanography, 1983, 13(10): 1894−1907. doi: 10.1175/1520-0485(1983)013<1894:UOHBDT>2.0.CO;2 [43] 安玉柱, 张韧, 王辉赞, 等. 全球大洋混合层深度的计算及其时空变化特征分析[J]. 地球物理学报, 2012, 55(7): 2249−2258. doi: 10.6038/j.issn.0001-5733.2012.07.011An Yuzhu, Zhang Ren, Wang Huizan, et al. Study on calculation and spatio-temporal variations of global ocean mixed layer depth[J]. Chinese Journal of Geophysics, 2012, 55(7): 2249−2258. doi: 10.6038/j.issn.0001-5733.2012.07.011 [44] Ren Li, Riser S C. Seasonal salt budget in the northeast Pacific Ocean[J]. Journal of Geophysical Research: Oceans, 2009, 114(C12): C12004. doi: 10.1029/2009JC005307 [45] Kolodziejczyk N, Gaillard F. Observation of spiciness interannual variability in the Pacific pycnocline[J]. Journal of Geophysical Research: Oceans, 2012, 117(C12): C12018. [46] Ruddick B. A practical indicator of the stability of the water column to double-diffusive activity[J]. Deep Sea Research Part A: Oceanographic Research Papers, 1983, 30(10): 1105−1107. doi: 10.1016/0198-0149(83)90063-8 [47] Johnson G C. Generation and initial evolution of a mode water θ-S anomaly[J]. Journal of Physical Oceanography, 2006, 36(4): 739−751. doi: 10.1175/JPO2895.1 [48] Qu T, Song Y T, Maes C. Sea surface salinity and barrier layer variability in the equatorial Pacific as seen from Aquarius and Argo[J]. Journal of Geophysical Research: Oceans, 2014, 119(1): 15−29. -

计量
- 文章访问数: 1016
- HTML全文浏览量: 209
- PDF下载量: 163
- 被引次数: 0
