

Different sea level variations in the South China Sea in response to two types of El Niño
-
摘要: 利用ECMWF ORAS4重构数据,分析了南海海平面异常(SLA)对东部型(EP)El Niño和中部型(CP)El Niño的不同响应特征。南海SLA在两类El Niño期间表现出不同的时空演变规律。对于东部型El Niño,南海空间平均的SLA在发展年的秋、冬季显著下降,最低可达−2 cm,并在次年开始上升,至次年冬季可达2 cm。空间分布上,在发展年秋、冬季,除越南东南部海域存在一个正异常中心外,在南海绝大部分海域,SLA均表现为显著的负异常;从次年春季开始,SLA负异常减弱,而越南东南部的正异常开始发展,直至冬季南海大部分海域以正异常为主。对于中部型El Niño,南海SLA在整个El Niño发展和衰退期间均表现为显著负异常,异常值始终维持在−2 cm左右,并且在空间上表现为全海盆一致的负异常模态。相比于传统的经验正交分解(EOF),季节EOF(S-EOF)能够更好地刻画南海SLA在两类El Niño期间的时空演变特征,S-EOF的第一模态表现为中部型El Niño模态,而第二模态更多地表现为南海SLA在东部型El Niño期间的演变特征。南海海平面在两类El Niño期间的不同变化主要是由于海峡通道处的热量平流输运异常所产生的热比容效应导致的,但是比容海平面的贡献主要集中在南海内区和南海东部等深水海域,对于南海西部等近岸海域,海平面的变化机制还有待进一步深入研究。
-
关键词:
- 东部型El Niño /
- 中部型El Niño /
- 南海海平面 /
- 比容海平面
Abstract: Using the ECMWF ORAS4 reconstruction data, the different response characteristics of the South China Sea Sea Level Anomaly (SLA) to the Eastern Pacific (EP) El Niño and the Central Pacific (CP) El Niño were analyzed. The South China Sea SLA showed different spatial and temporal evolution during the two types of El Niño. For the EP El Niño, the average SLA in the South China Sea decreased significantly in the autumn and winter of the developing year, with a minimum of −2 cm, and began to rise in the following year, up to 2 cm in the following winter. In terms of spatial distribution, in the autumn and winter of developing year, except for the existence of a positive anomaly to the southeast of Vietnam, in most of the South China Sea, SLAs are characterized by significant negative anomalies; from the spring of the following year, SLA negatively weakens, while the southeastern part of Vietnam was beginning to develop abnormally until the majority of the South China Sea is dominated by positive anomalies. For the CP El Niño, the South China Sea SLA showed significant negative anomalies throughout the El Niño development and decline, the outliers were always maintained at around −2 cm, and spatially represented as a consistent negative anomaly of the whole basin. Compared with the traditional empirical orthogonal decomposition (EOF), the seasonal EOF (S-EOF) can better characterize the temporal and spatial evolution of the South China Sea SLA during the two types of El Niño. The first mode of the S-EOF is CP El Niño mode, while the second mode is more characterized by the evolution of the South China Sea SLA during the EP El Niño. The different variations of the South China Sea SLA during the two types of El Niño are mainly due to the thermal specific volume effect caused by the thermal advection transport anomaly at the channel, but the contribution of the thermosteric sea level is mainly concentrated in the interior South China Sea. While in the coastal regions, such as the western South China Sea, the mechanism of sea level change needs further study. -

图 2 两类El Niño期间合成的南海区域平均海平面异常时间演变
Year (0)表示El Niño发展年,Year (1)表示El Niño衰减年;加粗实线表示通过90%置信检验
Fig. 2 Evolution of composited area-averaged sea level anomaly during two types of El Niño
Year (0) and Year (1) indicate the developing and decaying year of El Niño, respectively. Bold parts represent the composite exceeding the 90% significance level based on a Student’s t test

图 3 东部型El Niño期间合成的南海海平面异常空间分布
MAM,JJA,SON和DJF分别表示春、夏、秋、冬4个季节。(0),(1),(2)分别表示El Niño的发展年、衰减年以及衰减年的次年。白色等值线包围的区域表示通过90%显著性检验的区域
Fig. 3 Spatial evolution of composited sea level anomaly during EP El Niño
MAM, JJA, SON, DJF indicate boreal spring, summer, autumn, and winter. (0), (1), (2) denote the developing year, decaying year, and third year of El Niño, respectively. The white contours filled with dots indicate the composite exceeding the 90% significance level based on a Student’s t test
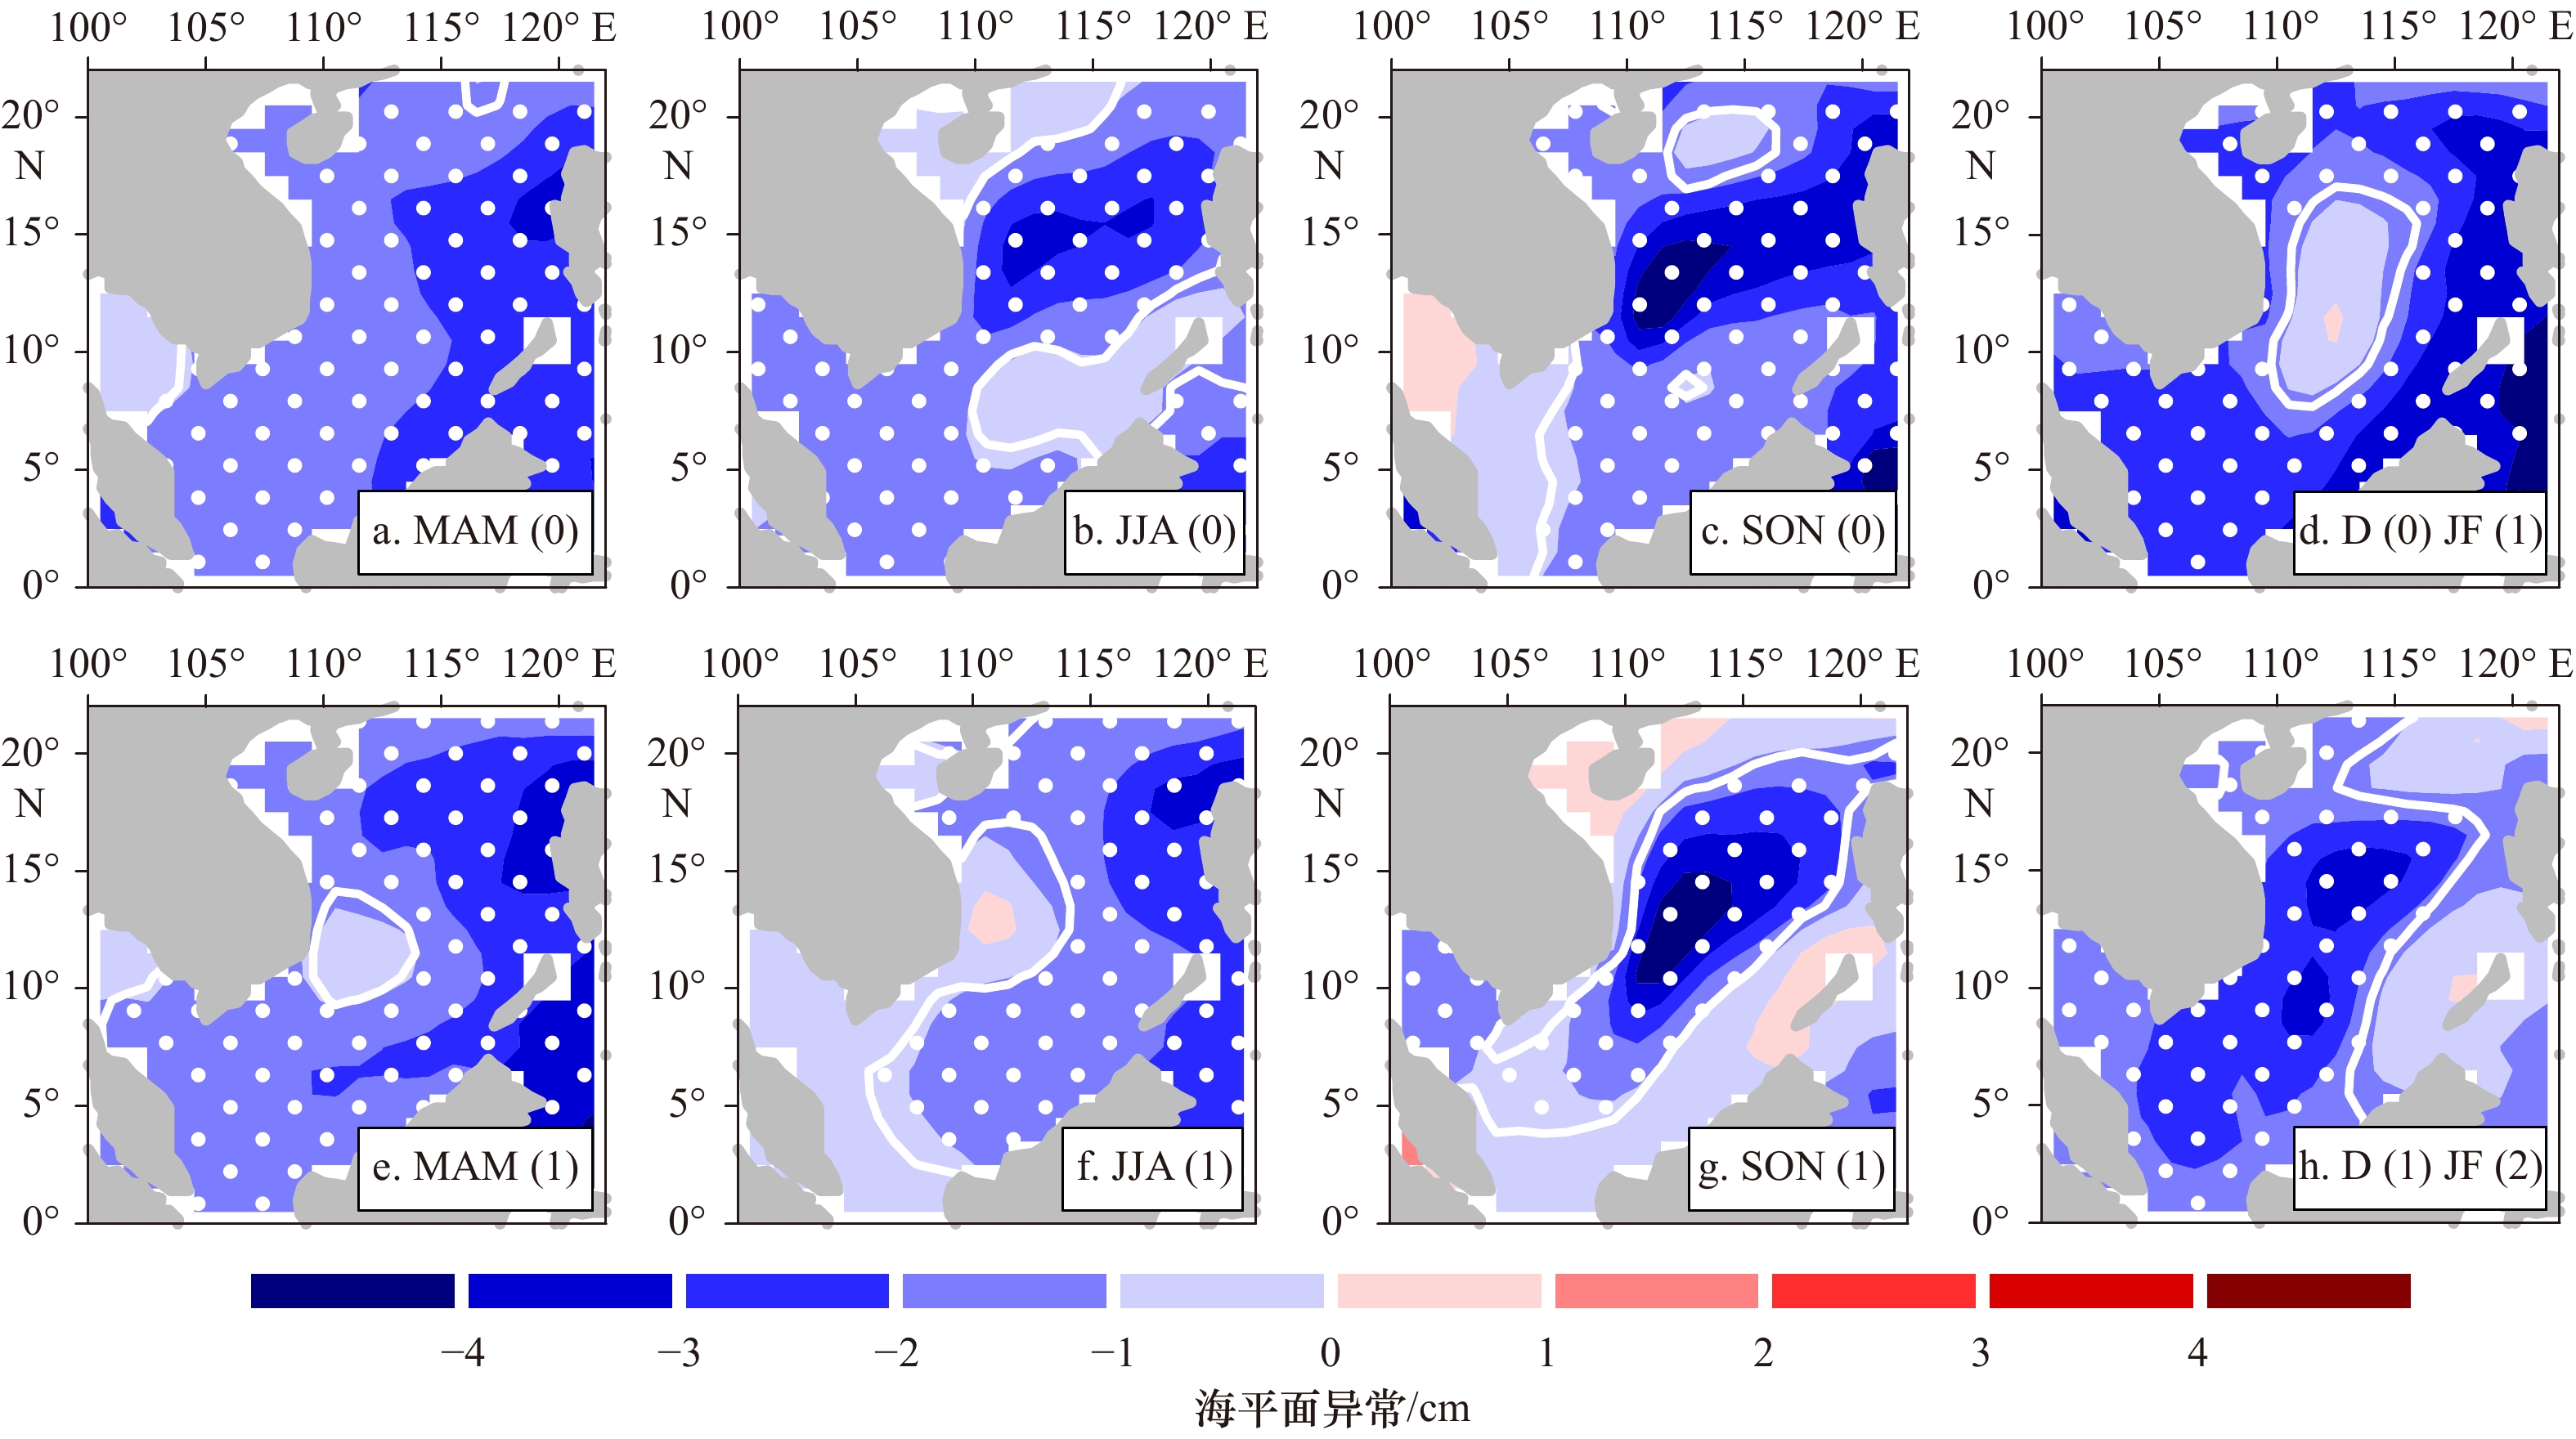
图 4 中部型El Niño期间合成的南海海平面异常空间分布
MAM,JJA,SON和DJF分别表示春、夏、秋、冬4个季节。(0),(1),(2)分别表示El Niño的发展年、衰减年以及衰减年的次年。白色等值线包围的区域表示通过90%显著性检验的区域
Fig. 4 Spatial evolution of composited sea level anomaly during CP El Niño
MAM, JJA, SON, DJF indicate boreal spring, summer, autumn, and winter. (0), (1), (2) denote the developing year, decaying year, and third year of El Niño, respectively. The white contours filled with dots indicate the composite exceeding the 90% significance level based on a Student’s t test
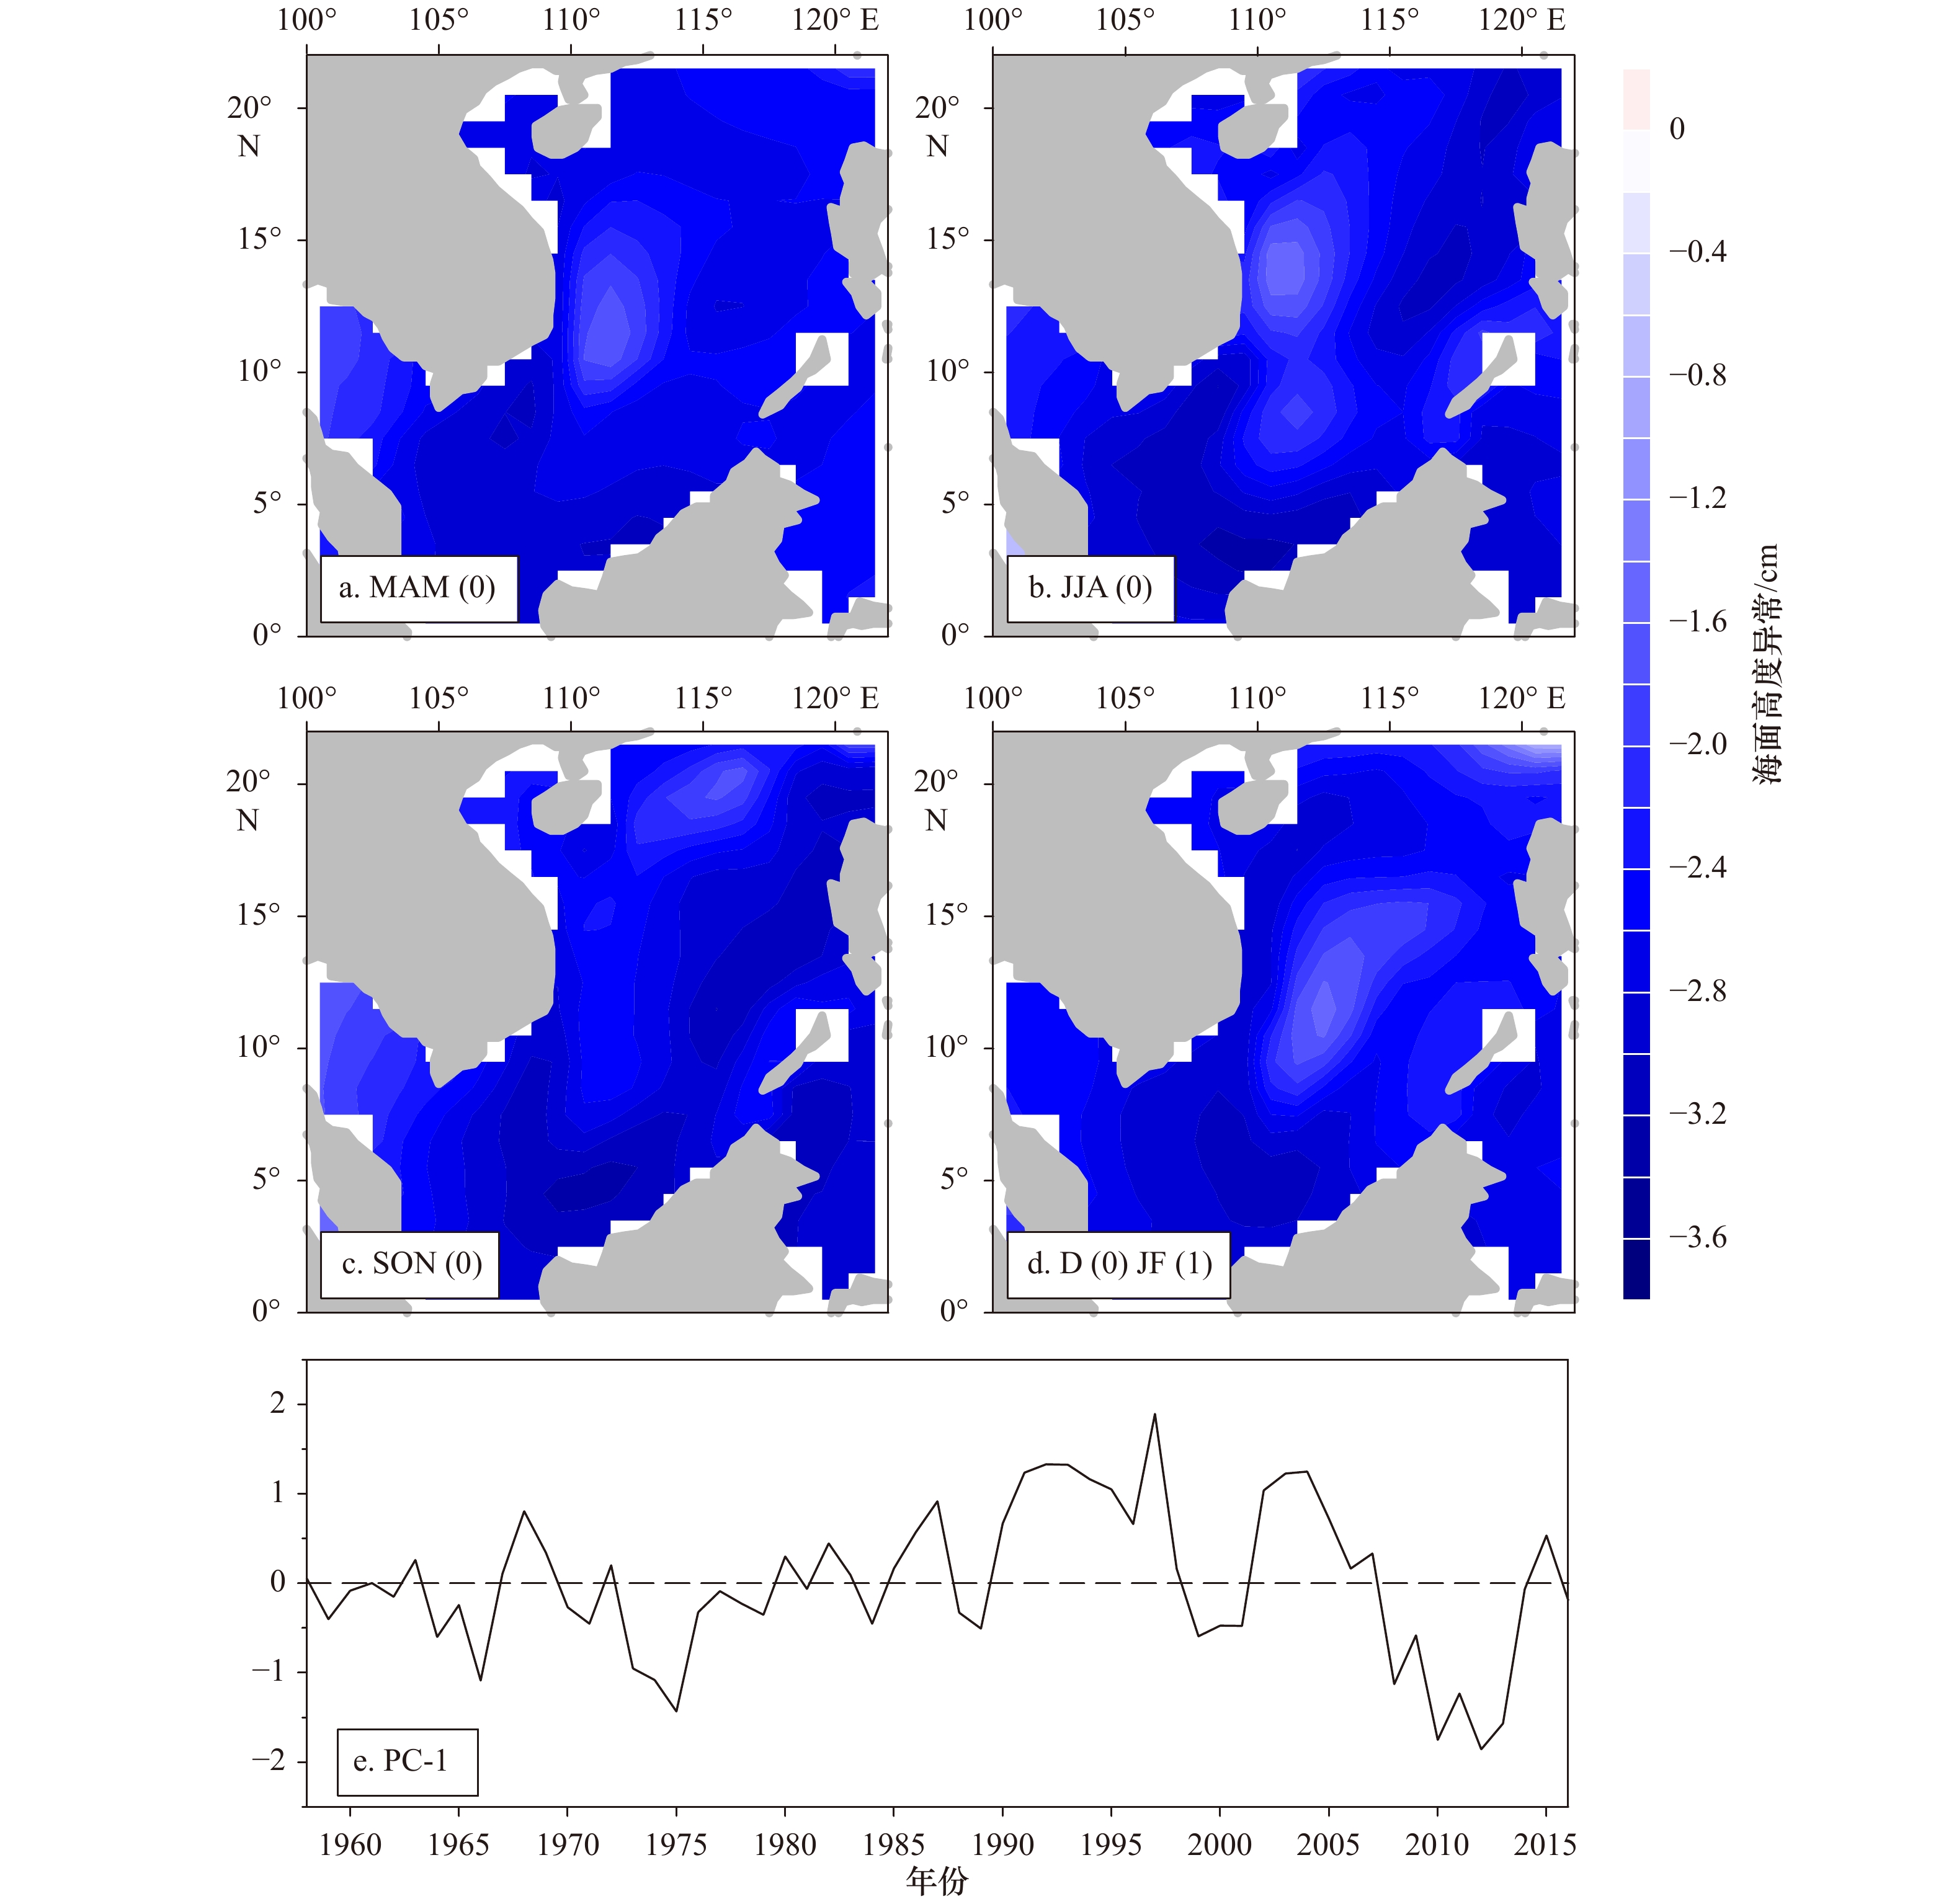
图 5 南海海平面高度异常(SLA)的S-EOF分解第一模态
a−d分别为春 (MAM)、夏 (JJA)、秋 (SON)、冬 (DJF) 4个季节的海面高度异常空间分布;(0)和(1)分别表示El Niño的发展年和衰减年;e为第一模态时间序列图
Fig. 5 First S-EOF mode of sea level anomaly (SLA) in the South China Sea
a−d are SLA spatial pattern of spring (MAM), summer (JJA), autumn (SON), winter (DJF), respectively; (0) and (1) indicate the developing and decaying year of El Niño; e is principal component time series of SLA
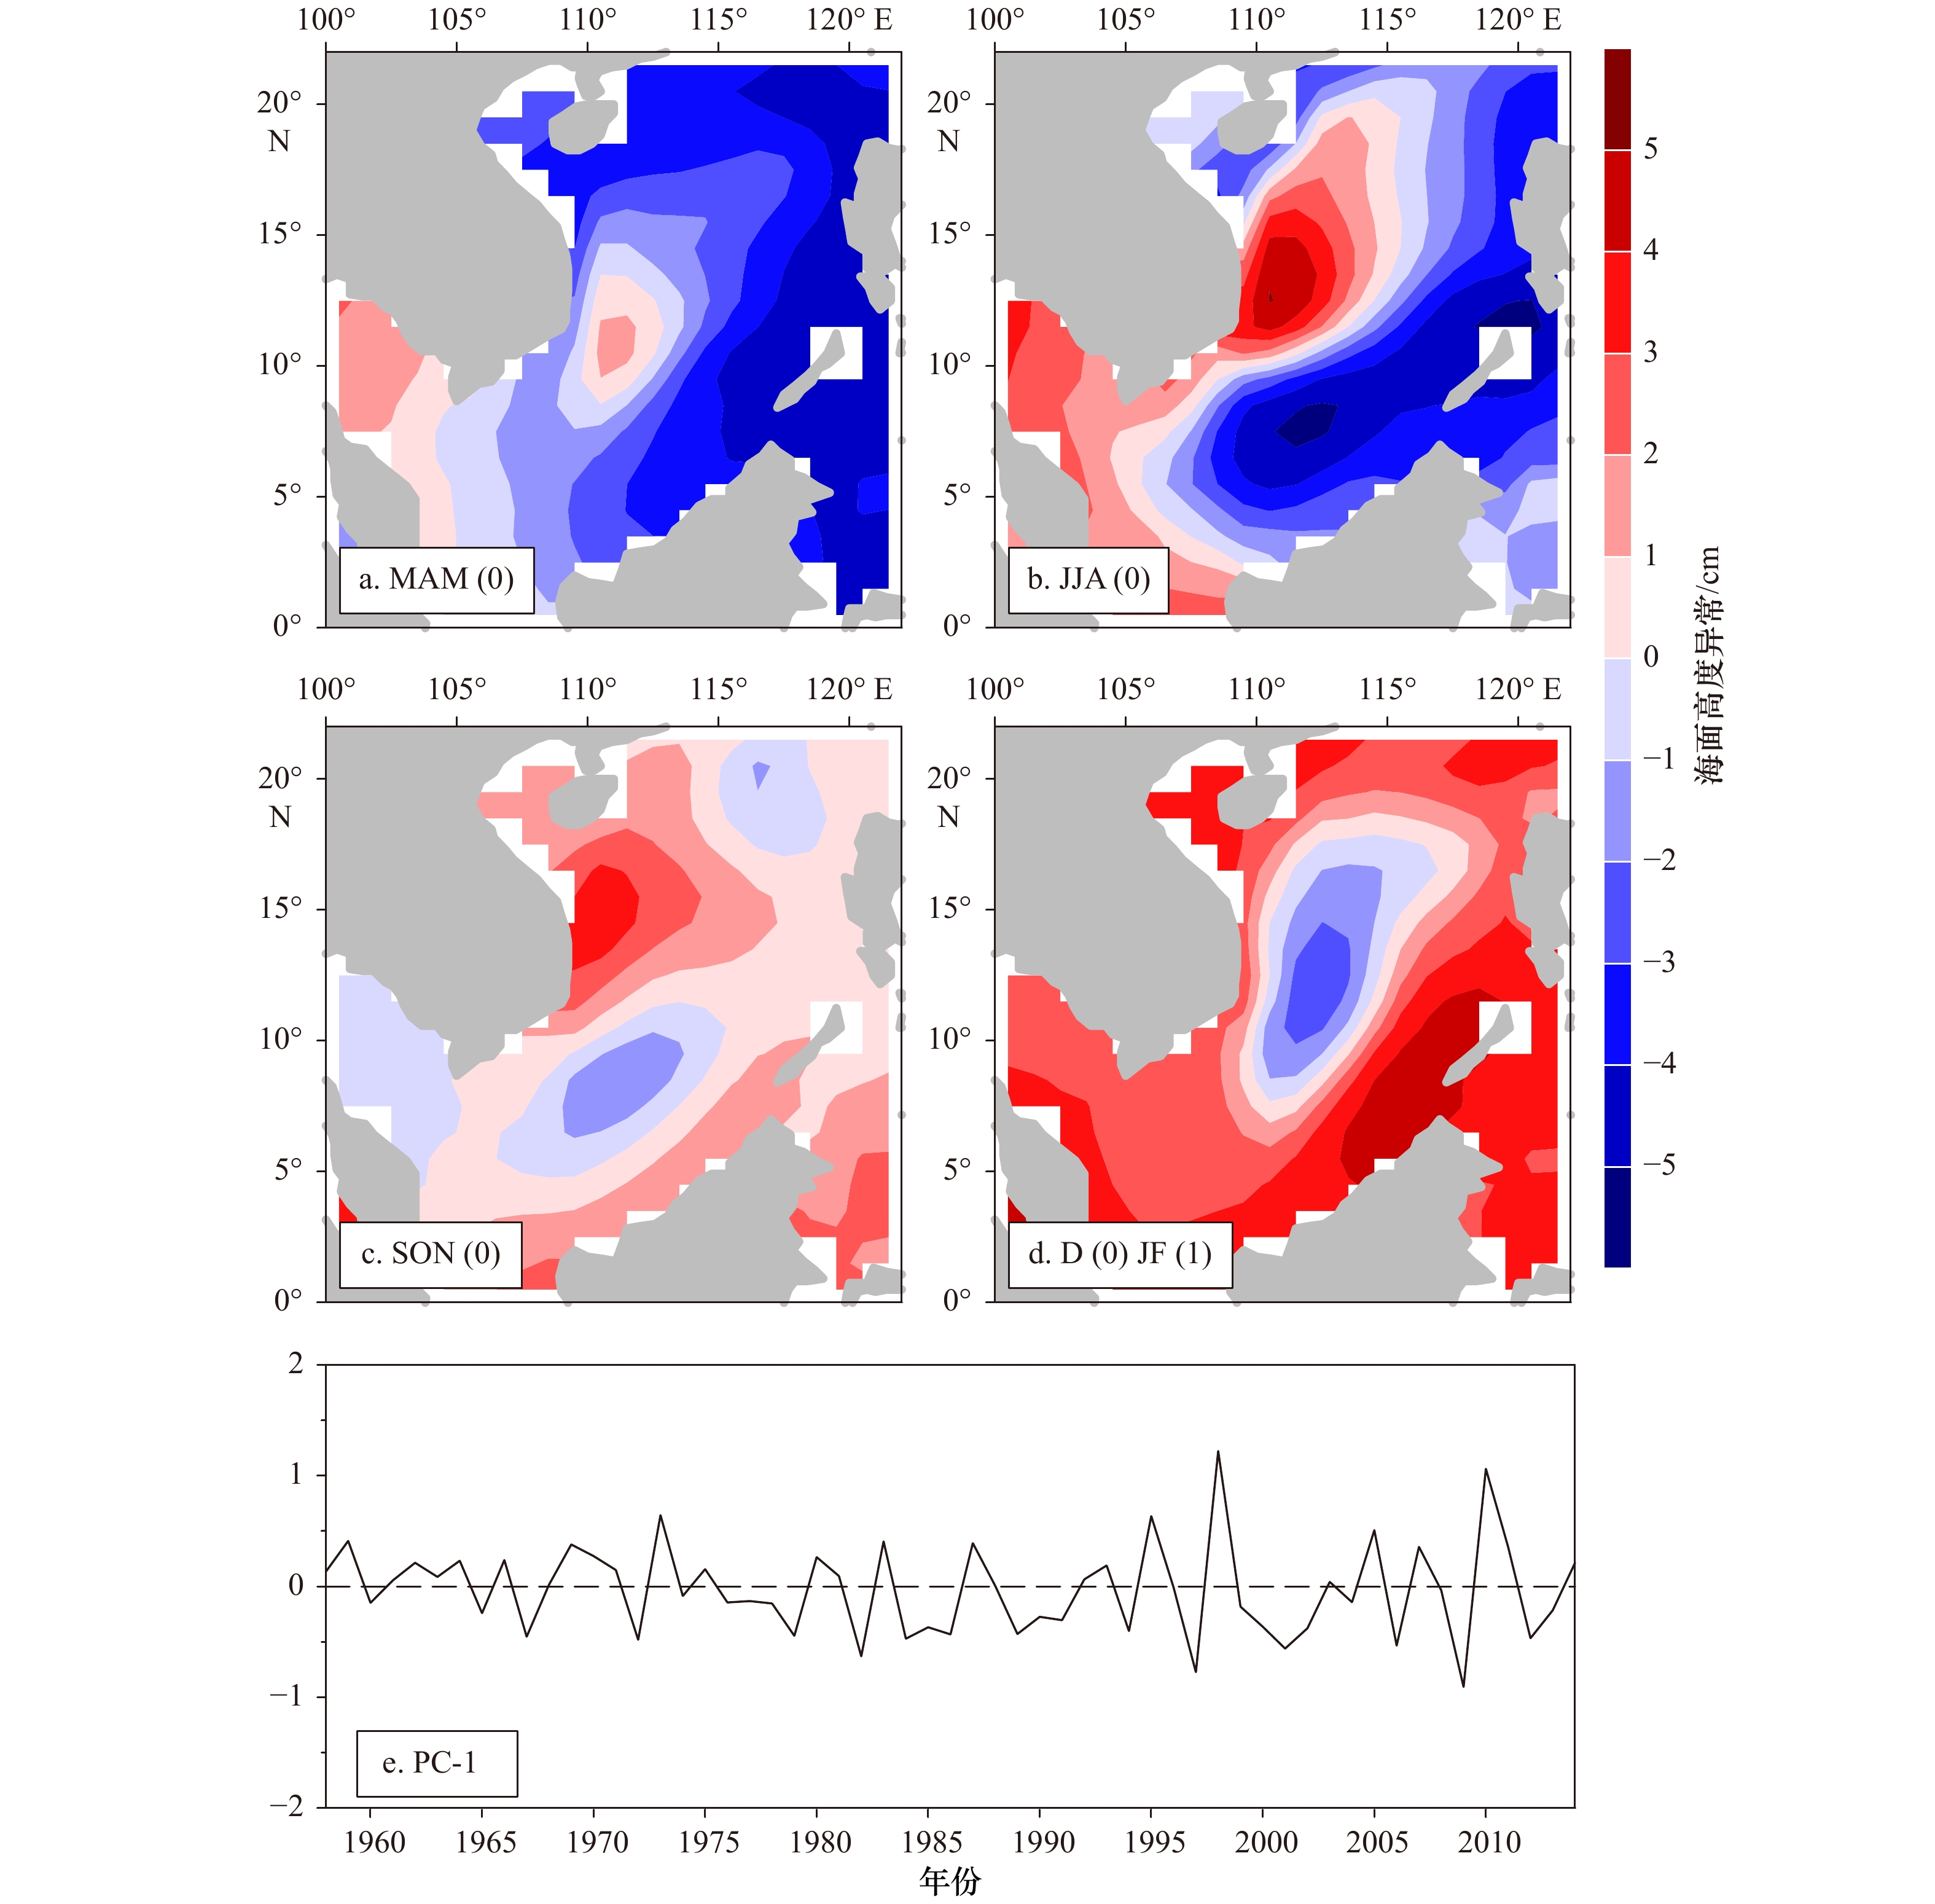
图 6 南海海平面高度异常(SLA)的S-EOF分解第二模态
a−d分别为春 (MAM)、夏 (JJA)、秋 (SON)、冬 (DJF) 4个季节的海面高度异常空间分布;(0)和(1)分别表示El Niño的发展年和衰减年;e为第二模态时间序列图
Fig. 6 The second S-EOF mode of sea level anomaly (SLA) in the South China Sea
a−d are SLA spatial pattern of spring (MAM), summer (JJA), autumn (SON), winter (DJF), respectively; (0) and (1) indicate the developing and decaying year of El Niño; e is principal component time series of sea level anomaly
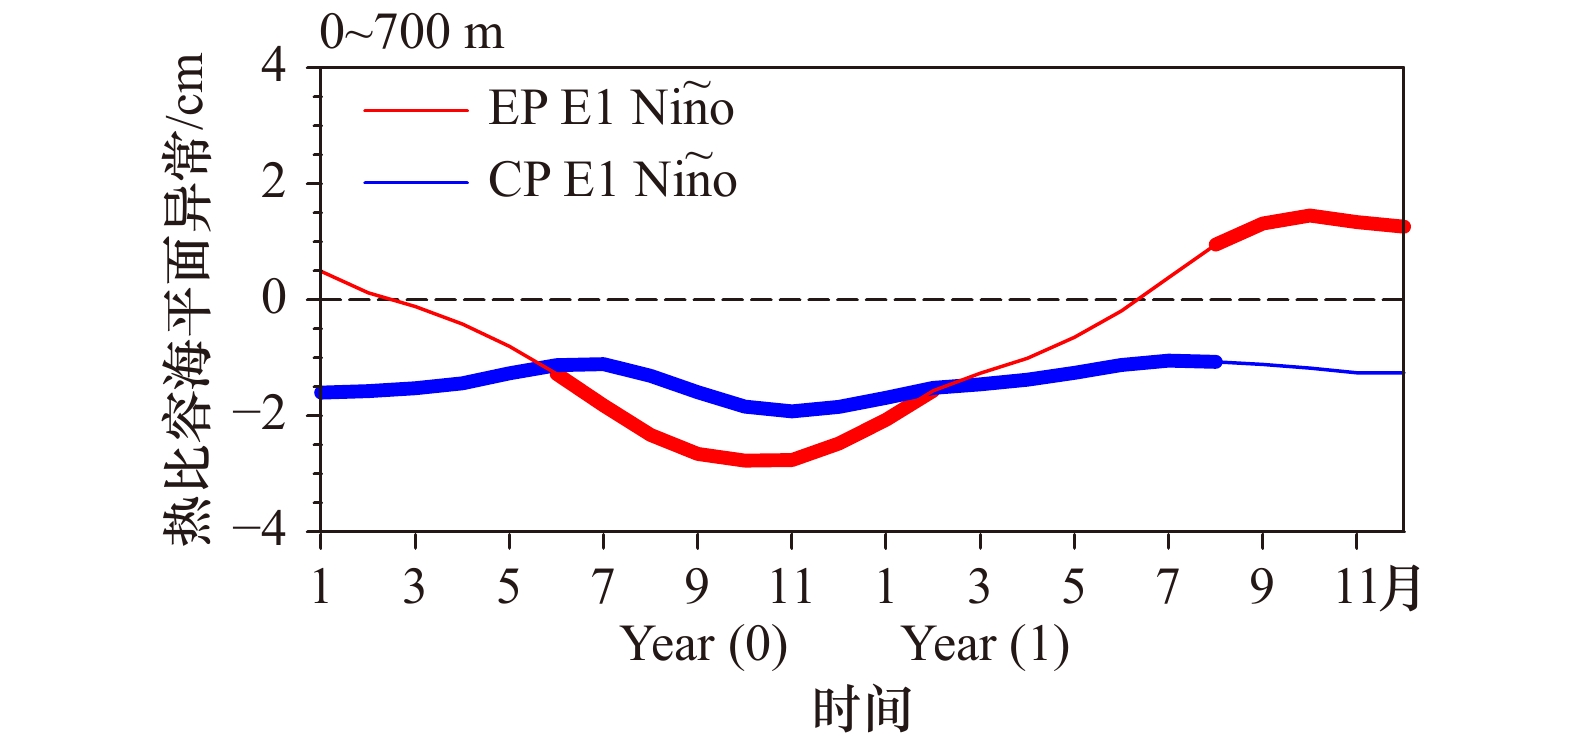
图 7 两类El Niño 期间合成的南海区域平均热比容海平面异常(TSLA)时间演变
Year (0)表示El Niño发展年,Year (1)表示El Niño衰减年;加粗实线表示通过90%置信检验
Fig. 7 Evolution of composited area-averaged TSLA during two types of El Niño
Year (0) and Year (1) indicate the developing and decaying year of El Niño, respectively. Bold parts represent the composite exceeding the 90% significance level based on a Student’s t test

图 8 东部型El Niño期间合成的南海热比容海平面异常(TSLA)空间分布
MAM,JJA,SON和DJF分别表示春、夏、秋、冬4个季节。(0),(1),(2)分别表示El Niño的发展年、衰减年以及衰减年的次年。白色等值线包围的区域表示通过90%显著性检验的区域
Fig. 8 Spatial evolution of composited TSLA during EP El Niño
MAM, JJA, SON, DJF indicate boreal spring, summer, autumn, and winter. (0), (1), (2) denote the developing year, decaying year, and third year of El Niño, respectively. The white contours filled with dots indicate the composite exceeding the 90% significance level based on a Student’s t test

图 9 中部型El Niño期间合成的南海热比容海平面异常(TSLA)空间分布
MAM,JJA,SON和DJF分别表示春、夏、秋、冬4个季节。(0),(1),(2)分别表示El Niño的发展年、衰减年以及衰减年的次年。白色等值线包围的区域表示通过90%显著性检验的区域
Fig. 9 Spatial evolution of composited TSLA during CP El Niño
MAM, JJA, SON, DJF indicate boreal spring, summer, autumn, and winter. (0), (1), (2) denote the developing year, decaying year, and third year of El Niño, respectively. The white contours filled with dots indicate the composite exceeding the 90% significance level based on a Student’s t test

图 10 东部型El Niño(a)和中部型El Niño(b)期间合成的海温异常垂向分布
Year (0)表示El Niño发展年,Year (1)表示El Niño衰减年;白色等值线包围的区域表示通过90%显著性检验的区域
Fig. 10 Composite temperature anomaly as a function of depth during the EP El Niño (a) and CP El Niño (b)
Year (0) and Year (1) indicate the developing and decaying year of El Niño, respectively. The white contours filled with dots indicate the composite exceeding the 90% significance level based on a Student’s t test

图 11 东部型El Niño(a)和中部型El Niño(b)期间合成的南海净热输运异常垂向演变
净热输运负值表示南海热量减少,正值表示南海热量增加。Year (0)表示El Niño发展年,Year (1)表示El Niño衰减年。白色等值线包围的区域表示通过90%显著性检验的区域
Fig. 11 Composite net heat transport anomaly as a function of depth during the EP El Niño (a) and CP El Niño (b)
Negative net heat transport means that heat decreases in the South China Sea, vice versa. Year (0) and Year (1) indicate the developing and decaying year of El Niño, respectively. The white contours filled with dots indicate the composite exceeding the 90% significance level based on a Student’s t test
-
[1] Chao S Y, Shaw P T, Wu S Y. Deep water ventilation in the South China Sea[J]. Deep Sea Research Part I: Oceanographic Research Papers, 1996, 43(4): 445−466. doi: 10.1016/0967-0637(96)00025-8 [2] Chen C T A, Huang M H. A mid-depth front separating the South China Sea water and the Philippine sea water[J]. Journal of Oceanography, 1996, 52(1): 17−25. doi: 10.1007/BF02236530 [3] Qu Tangdong, Song Y T, Yamagata T. An introduction to the South China Sea throughflow: its dynamics, variability, and application for climate[J]. Dynamics of Atmospheres and Oceans, 2009, 47(1/3): 3−14. [4] Sprintall J, Gordon A L, Flament P, et al. Observations of exchange between the South China Sea and the Sulu Sea[J]. Journal of Geophysical Research: Oceans, 2012, 117(C5): C05036. [5] Cai Shuqun, Liu Hailong, Li Wei, et al. Application of LICOM to the numerical study of the water exchange between the South China Sea and its adjacent oceans[J]. Acta Oceanologica Sinica, 2005, 24(4): 10−19. [6] Chen H W, Liu C T, Matsuno T, et al. Temporal variations of volume transport through the Taiwan Strait, as identified by three-year measurements[J]. Continental Shelf Research, 2016, 114: 41−53. doi: 10.1016/j.csr.2015.12.010 [7] Wang Yan, Xu Tengfei, Li Shujiang, et al. Seasonal variation of water transport through the Karimata Strait[J]. Acta Oceanologica Sinica, 2019, 38(4): 47−57. doi: 10.1007/s13131-018-1224-2 [8] Susanto R D, Wei Zexun, Adi R T, et al. Observations of the Karimata Strait througflow from December 2007 to November 2008[J]. Acta Oceanologica Sinica, 2013, 32(5): 1−6. doi: 10.1007/s13131-013-0307-3 [9] Rong Zengrui, Liu Yuguang, Zong Haibo, et al. Interannual sea level variability in the South China Sea and its response to ENSO[J]. Global and Planetary Change, 2007, 55(4): 257−272. doi: 10.1016/j.gloplacha.2006.08.001 [10] Wang Hui, Liu Kexiu, Wang Aimei, et al. Regional characteristics of the effects of the El Niño-Southern Oscillation on the sea level in the China Sea[J]. Ocean Dynamics, 2018, 68(4/5): 485−495. [11] Fang Guohong, Chen Haiying, Wei Zexun, et al. Trends and interannual variability of the South China Sea surface winds, surface height, and surface temperature in the recent decade[J]. Journal of Geophysical Research: Oceans, 2006, 111(C11): C11S16. [12] Cheng Yongcun, Hamlington B D, Plag H P, et al. Influence of ENSO on the variation of annual sea level cycle in the South China Sea[J]. Ocean Engineering, 2016, 126: 343−352. doi: 10.1016/j.oceaneng.2016.09.019 [13] Soumya M, Vethamony P, Tkalich P. Inter-annual sea level variability in the southern South China Sea[J]. Global and Planetary Change, 2015, 133: 17−26. doi: 10.1016/j.gloplacha.2015.07.003 [14] Qiu Bo, Chen Shuiming. Interannual-to-decadal variability in the bifurcation of the North Equatorial Current off the Philippines[J]. Journal of Physical Oceanography, 2010, 40(11): 2525−2538. doi: 10.1175/2010JPO4462.1 [15] Qu Tangdong, Kim Y Y, Yaremchuk M, et al. Can Luzon Strait transport play a role in conveying the impact of ENSO to the South China Sea?[J]. Journal of Climate, 2004, 17(18): 3644−3657. doi: 10.1175/1520-0442(2004)017<3644:CLSTPA>2.0.CO;2 [16] Liu Qinyan, Huang Ruixin, Wang Dongxiao, et al. Interplay between the Indonesian throughflow and the South China Sea throughflow[J]. Chinese Science Bulletin, 2006, 51(S2): 50−58. doi: 10.1007/s11434-006-9050-x [17] Liu Qinyan, Feng Ming, Wang Dongxiao. ENSO-induced interannual variability in the southeastern South China Sea[J]. Journal of Oceanography, 2011, 67(1): 127−133. doi: 10.1007/s10872-011-0002-y [18] Zhuang Wei, Qiu Bo, Du Yan. Low-frequency western Pacific Ocean sea level and circulation changes due to the connectivity of the Philippine Archipelago[J]. Journal of Geophysical Research: Oceans, 2013, 118(12): 6759−6773. doi: 10.1002/2013JC009376 [19] Ashok K, Behera S K, Rao S A, et al. El Niño Modoki and its possible teleconnection[J]. Journal of Geophysical Research: Oceans, 2007, 112(C11): C11007. doi: 10.1029/2006JC003798 [20] Yu Jinyi, Kao H Y. Decadal changes of ENSO persistence barrier in SST and ocean heat content indices: 1958-2001[J]. Journal of Geophysical Research: Atmospheres, 2007, 112(D13): D13106. [21] Larkin N K, Harrison D E. Global seasonal temperature and precipitation anomalies during El Niño autumn and winter[J]. Geophysical Research Letters, 2005, 32(16): L16075. [22] Kug J S, Jin Feifei, An S I. Two types of El Niño events: cold tongue El Niño and warm pool El Niño[J]. Journal of Climate, 2009, 22(6): 1499−1515. doi: 10.1175/2008JCLI2624.1 [23] Kao H Y, Yu Jinyi. Contrasting eastern-Pacific and central-Pacific types of ENSO[J]. Journal of Climate, 2009, 22(3): 615−632. doi: 10.1175/2008JCLI2309.1 [24] Yeh S W, Kug J S, Dewitte B, et al. El Niño in a changing climate[J]. Nature, 2009, 461(7263): 511−514. doi: 10.1038/nature08316 [25] Lee T, McPhaden M J. Increasing intensity of El Niño in the central-equatorial Pacific[J]. Geophysical Research Letters, 2010, 37(14): L14603. [26] Weng Hengyi, Ashok K, Behera S K, et al. Impacts of recent El Niño Modoki on dry/wet conditions in the Pacific rim during boreal summer[J]. Climate Dynamics, 2007, 29(2/3): 113−129. [27] Kim J S, Zhou Wen, Wang Xin, et al. El Niño Modoki and the summer precipitation variability over South Korea: a diagnostic study[J]. Journal of the Meteorological Society of Japan, 2012, 90: 673−684. doi: 10.2151/jmsj.2012-507 [28] Wang Xin, Zhou Wen, Li Chongyin, et al. Comparison of the impact of two types of El Niño on tropical cyclone genesis over the South China Sea[J]. International Journal of Climatology, 2014, 34(8): 2651−2660. doi: 10.1002/joc.3865 [29] Liu Qinyan, Wang Dongxiao, Wang Xin, et al. Thermal variations in the South China Sea associated with the eastern and central Pacific El Niño events and their mechanisms[J]. Journal of Geophysical Research: Oceans, 2014, 119(12): 8955−8972. doi: 10.1002/2014JC010429 [30] Hong C C, Li Y H, Li T, et al. Impacts of central Pacific and eastern Pacific El Niños on tropical cyclone tracks over the western North Pacific[J]. Geophysical Research Letters, 2011, 38(16): L16712. [31] Balmaseda M A, Mogensen K, Weaver A T. Evaluation of the ECMWF ocean reanalysis system ORAS4[J]. Quarterly Journal of the Royal Meteorological Society, 2013, 139(674): 1132−1161. doi: 10.1002/qj.2063 [32] Balmaseda M A, Trenberth K E, Källén E. Distinctive climate signals in reanalysis of global ocean heat content[J]. Geophysical Research Letters, 2013, 40(9): 1754−1759. doi: 10.1002/grl.50382 [33] Carton J A, Giese B S. A reanalysis of ocean climate using simple ocean data assimilation (SODA)[J]. Monthly Weather Review, 2008, 136(8): 2999−3017. doi: 10.1175/2007MWR1978.1 [34] Rayner N A, Parker D E, Horton E B, et al. Global analyses of sea surface temperature, sea ice, and night marine air temperature since the late nineteenth century[J]. Journal of Geophysical Research: Atmospheres, 2003, 108(D14): 4407. doi: 10.1029/2002JD002670 [35] Wang Chunzai, Wang Xin. Classifying El Niño Modoki I and II by different impacts on rainfall in Southern China and typhoon tracks[J]. Journal of Climate, 2013, 26(4): 1322−1338. doi: 10.1175/JCLI-D-12-00107.1 [36] Fang Guohong, Susanto R D, Wirasantosa S, et al. Volume, heat, and freshwater transports from the South China Sea to Indonesian seas in the boreal winter of 2007-2008[J]. Journal of Geophysical Research: Oceans, 2010, 115(C12): C12020. doi: 10.1029/2010JC006225 [37] Fang Guohong, Wang Yonggang, Wei Zexun, et al. Interocean circulation and heat and freshwater budgets of the South China Sea based on a numerical model[J]. Dynamics of Atmospheres and Oceans, 2009, 47(1/3): 55−72. -

 下载:
下载:
计量
- 文章访问数: 915
- HTML全文浏览量: 536
- PDF下载量: 121
- 被引次数: 0
