

The preservation of organic carbon by active iron oxides in surface sediments from Guangxi mangroves
-
摘要: 铁氧化物在全球土壤(沉积物)有机碳(Organic Carbon,OC)存储中具有重要作用。红树林湿地同时具有陆源与海源输入,为活性铁氧化物(FeR)对OC的保存提供了独特的生境。然而红树林表层沉积物中FeR对OC保存过程中的影响因素以及FeR对OC组分的选择性尚不明确。本研究选择广西大风江入海口和茅尾海周围受到潮汐与河流影响的天然红树林生境中的表层沉积物,研究沉积物中铁结合有机碳(Fe-OC)含量以及组分的变化。结果表明,大风江入海口与茅尾海表层沉积物中Fe-OC平均含量分别为0.16% ± 0.07%与0.17% ± 0.07%,在总有机碳(TOC)中所占比例(fFe-OC)分别为16.2% ± 5.04%与10.9% ± 5.63%,主要保存方式为吸附。FeR对OC的保存受到沉积物粒度、FeR含量与形态以及TOC来源与组分的影响。TOC、FeR与Fe-OC主要分布在粒度较小的沉积物组分中。表层沉积物中铁的存在形式以Fe3+为主,占总铁的87.42%,在高盐度沉积物中相对更高。FeR会选择性保存结合δ13C值(稳定性碳同位素自然丰度)偏正的OC与芳香族OC。与茅尾海相比较,大风江入海口表层沉积物Fe-OC中类蛋白荧光组分占总荧光组分的比例更高。类蛋白荧光组分占比随Fe-OC∶Fe摩尔比升高而升高。本研究有助于明确广西红树林表层沉积物中FeR对OC的选择性保存机制,加深对陆海界面沉积物中OC的保存过程的了解。Abstract: Iron oxides play a significant role in the global soil (sediment) organic carbon (OC) storage. Mangrove wetlands, receiving both terrestrial and marine inputs, provide a unique habitat for the preservation of organic carbon by reactive iron oxides (FeR). However, the impact of FeR in the surface sediments of mangroves on the preservation process of OC, as well as the selectivity of FeR towards different OC components, is still unclear. The surface sediments in the present work was collected in the natural mangrove areas around the estuaries of the Dafeng River and Maowei Sea in Guangxi, which are highly influenced by tides and rivers. The research was focused on the changes in the content and composition of iron-bound organic carbon (Fe-OC) in sediments. The results indicated that the average content of Fe-OC in surface sediments in the estuaries of Dafeng River and Maowei Sea was 0.16% ± 0.07% and 0.17% ± 0.07%, respectively. These values represented 16.2 ± 5.04% and 10.9 ± 5.63% of the total organic carbon (TOC) content in the respective sediments, which were primarily preserved through adsorption. Furthermore, the preservation of OC by FeR was influenced by the sediment particle size, the content and form of FeR, and the source and composition of TOC. TOC, FeR and Fe-OC were mainly distributed in the smaller grain size sediment fractions. The predominant form of iron in surface sediments was Fe3+, accounting for 87.42% of the total iron, and was relatively higher in high salinity sediments. FeR selectively preserved OC with higher δ13C (stable carbon isotope natural abundance) and aromatic OC. Compared with the Maowei Sea, the proportion of protein-like fluorescent components in Fe-OC of surface sediments from the Dafeng River estuary was higher and the proportion of protein-like fluorescent components increased as the molar ratio of Fe-OC∶Fe increased. This study helps to clarify the selective preservation mechanism of OC by FeR in mangrove surface sediments in Guangxi, and deepen our understanding of the preservation process of OC in land-sea interface sediments.
-
Key words:
- mangroves /
- sediments /
- iron-bound organic carbon /
- stable carbon isotope
-

图 1 采样站位
a. 广西壮族自治区钦州市钦南区海域,b. 茅尾海(MW),c. 大风江入海口(DF)
Fig. 1 Sampling site
a. Marine area of Qinnan District, Qinzhou in Guangxi; b. Maowei Sea (MW); c. the estuary of Dafeng River (DF)

图 2 广西大风江(DF)与茅尾海(MW)红树林表层沉积物中TOC含量(a)、FeR含量(b)、黏土与粉砂比例(c)、Fe-OC含量(d)与fFe-OC(e)
Fig. 2 The contents of total OC (a), FeR (b), the proportion of clay + silt (c), Fe-OC (d) and fFe-OC (e) in surface sediments in the estuary of Dafeng River (DF) and Maowei Sea (MW) from Guangxi mangroves

图 3 广西大风江(DF)与茅尾海(MW)红树林表层沉积物中原始样品与DCB处理后样品的δ13C值分布
Fig. 3 Distribution of δ13C in surface sediments of original samples and after DCB treatment samples in the estuary of Dafeng River (DF) and Maowei Sea (MW) from Guangxi mangroves

图 4 广西大风江入海口(DF)与茅尾海(MW)红树林典型表层沉积物的穆斯堡尔谱图
a. DF-1-A站位,b. DF-6-A站位,c. MW-3-A站位。D1:顺磁性高自旋亚铁的双峰(para-Fe2+);D2:低自旋三价铁的双峰(para-Fe3+)
Fig. 4 Mössbauer spectra of typical surface sediments in the estuary of Dafeng River (DF) and Maowei Sea (MW) from Guangxi mangroves
a. DF-1-A site, b. DF-6-A site, c. MW-3-A site. D1: doublet for paramagnetic high-spin ferrous iron (para-Fe2+); D2: doublet for low-spin ferric iron (para-Fe3+)
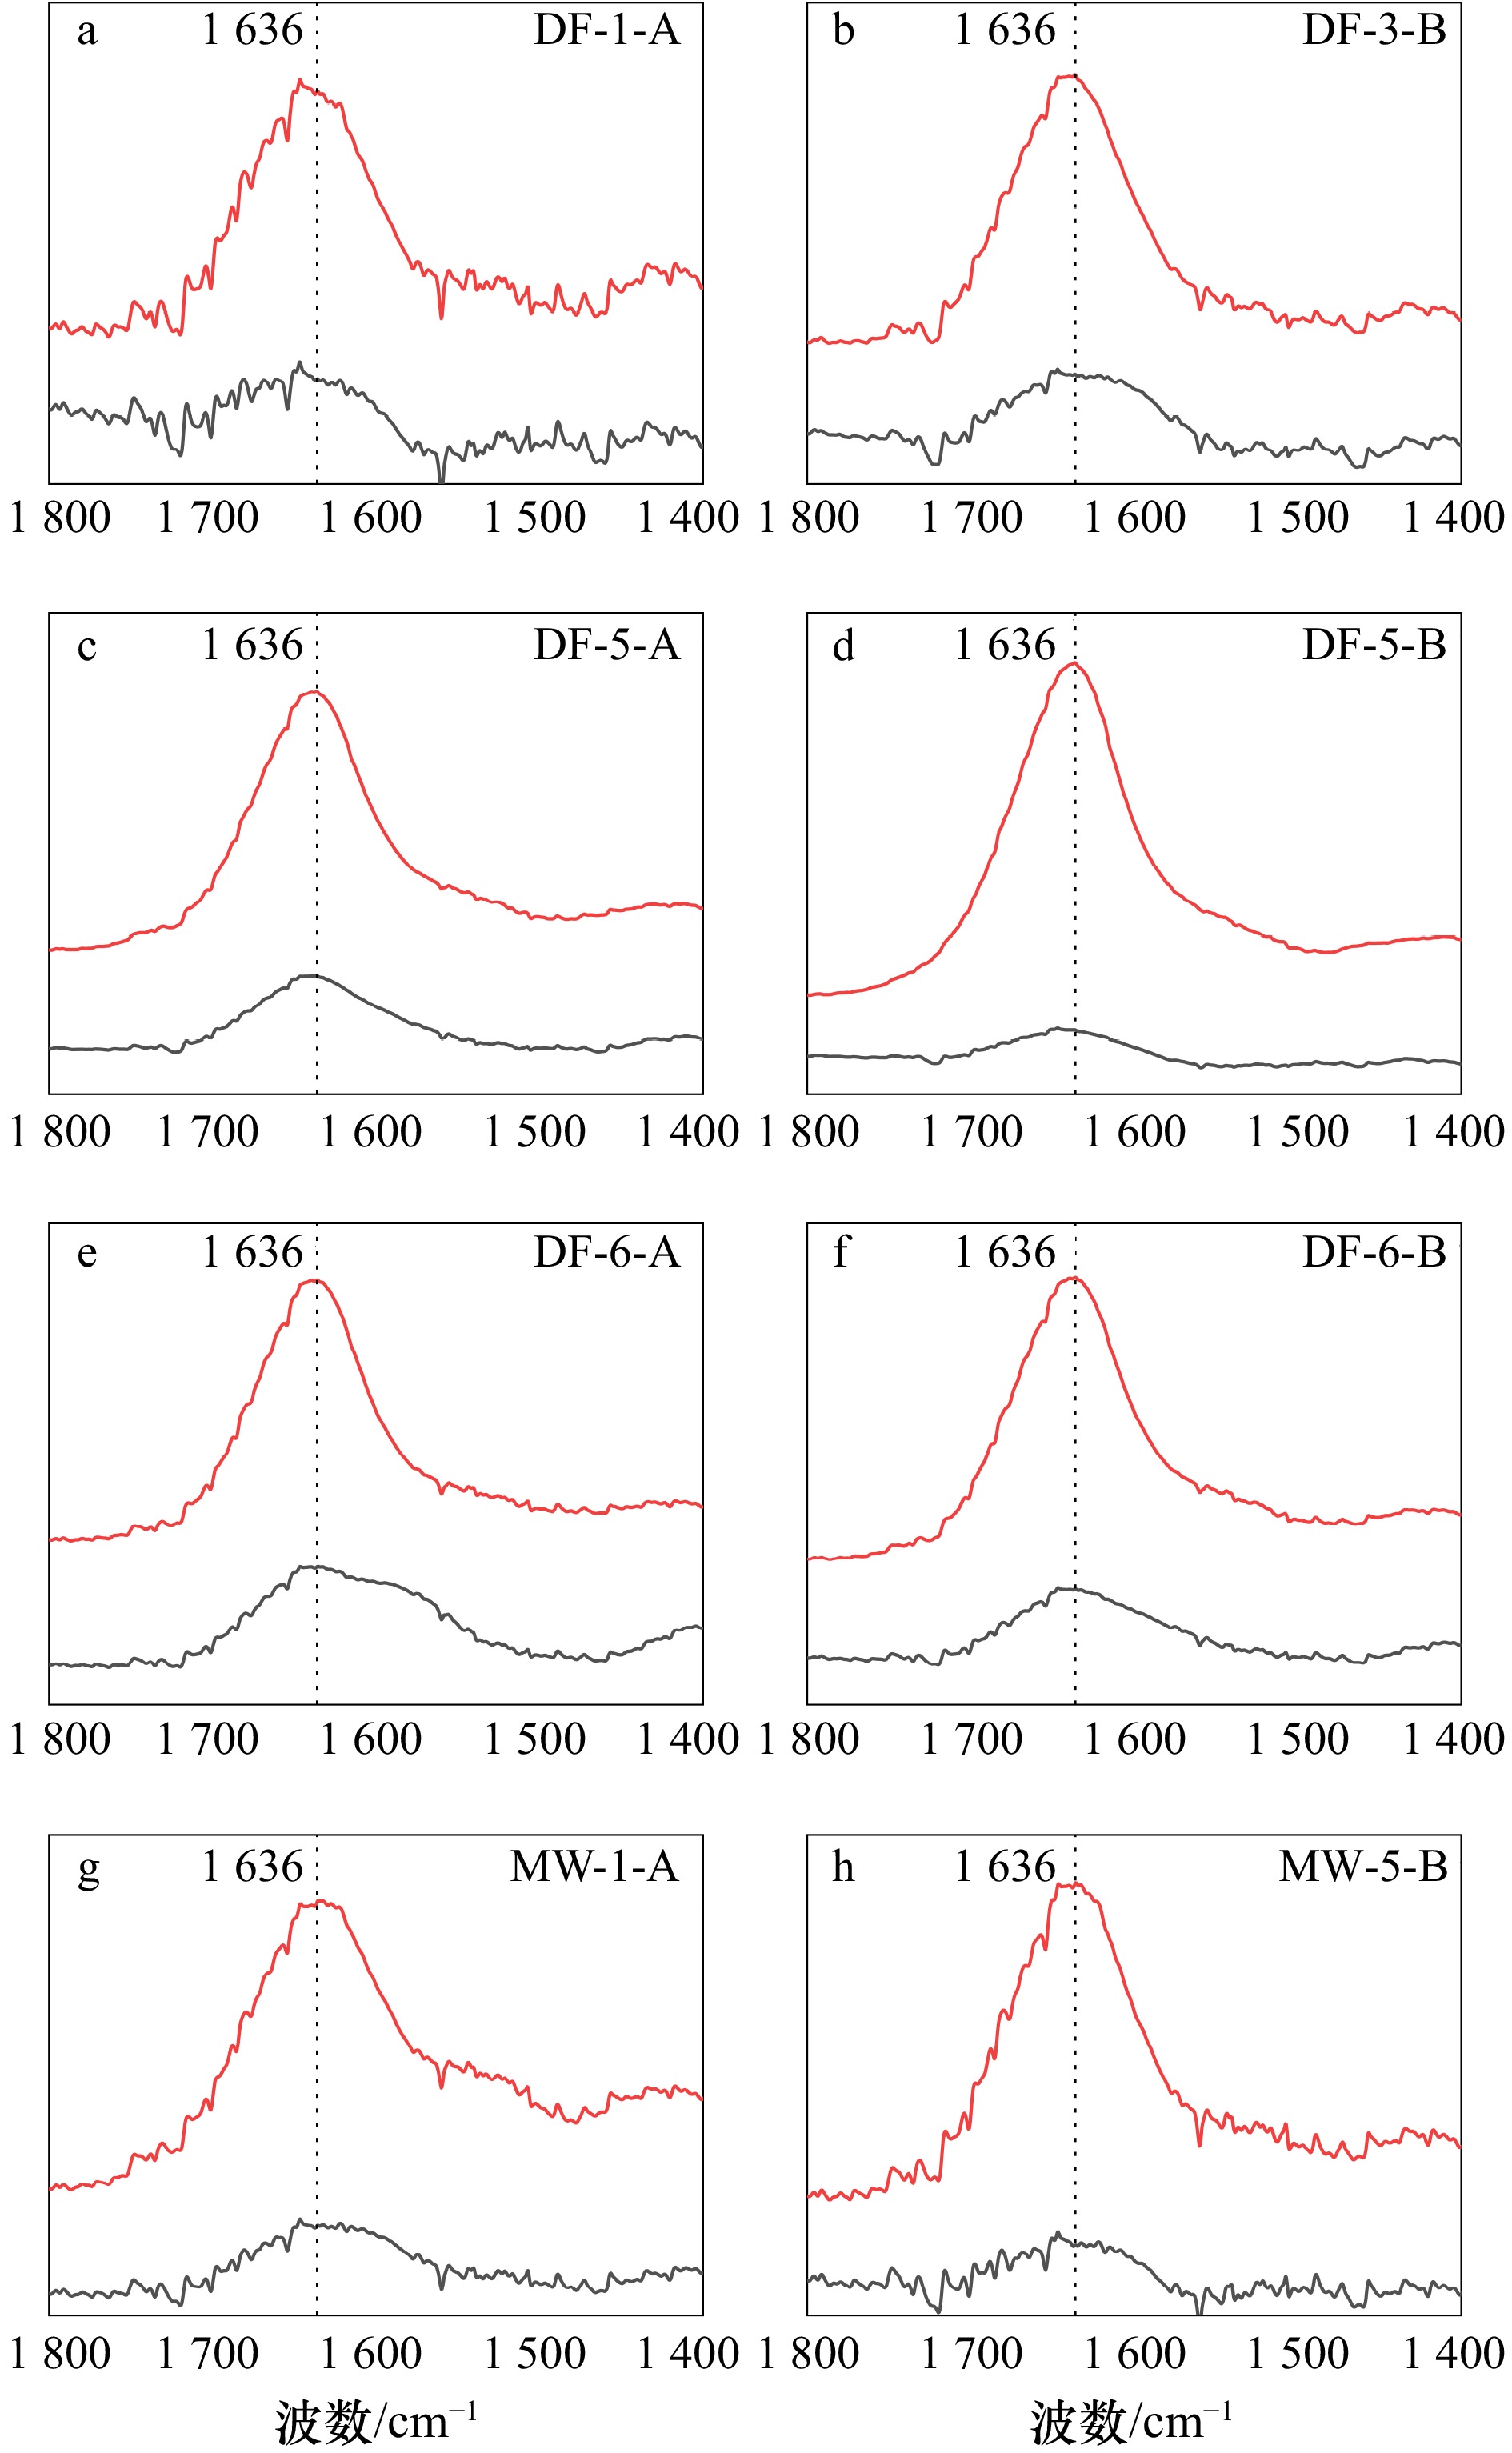
图 5 广西大风江入海口(DF)与茅尾海(MW)红树林表层沉积物在DCB处理前后
1800 ~1400 cm−1范围内衰减全反射−傅里叶变换红外光谱差异(ATR-FTIR)红线为原始样品,黑线为DCB处理后样品。所有光谱均经过背景校准
Fig. 5 Variations in attenuated total reflectance-Fouriertransform infrared (ATR-FTIR) spectra in the
1800 −1400 cm−1 range for surface sediments in the estuary of Dafeng River (DF) and Maowei Sea (MW) from Guangxi mangroves before and after DCB treatmentThe red line represents the original sample, while the black line represents the sample after DCB treatment. All spectra are background-corrected

图 6 广西大风江入海口(DF)与茅尾海(MW)红树林表层沉积物在DCB处理前后
3000 ~2800 cm−1范围内衰减全反射−傅里叶变换红外光谱差异(ATR-FTIR)红线为原始样品,黑线为DCB处理后样品。所有光谱均经过背景校准
Fig. 6 Variations in attenuated total reflectance-Fouriertransform infrared (ATR-FTIR) spectra in the
3000 −2800 cm−1 range for surface sediments in the estuary of Dafeng River (DF) and Maowei Sea (MW) from Guangxi mangroves before and after DCB treatmentThe red line represents the original sample, while the black line represents the sample after DCB treatment. All spectra are background-corrected
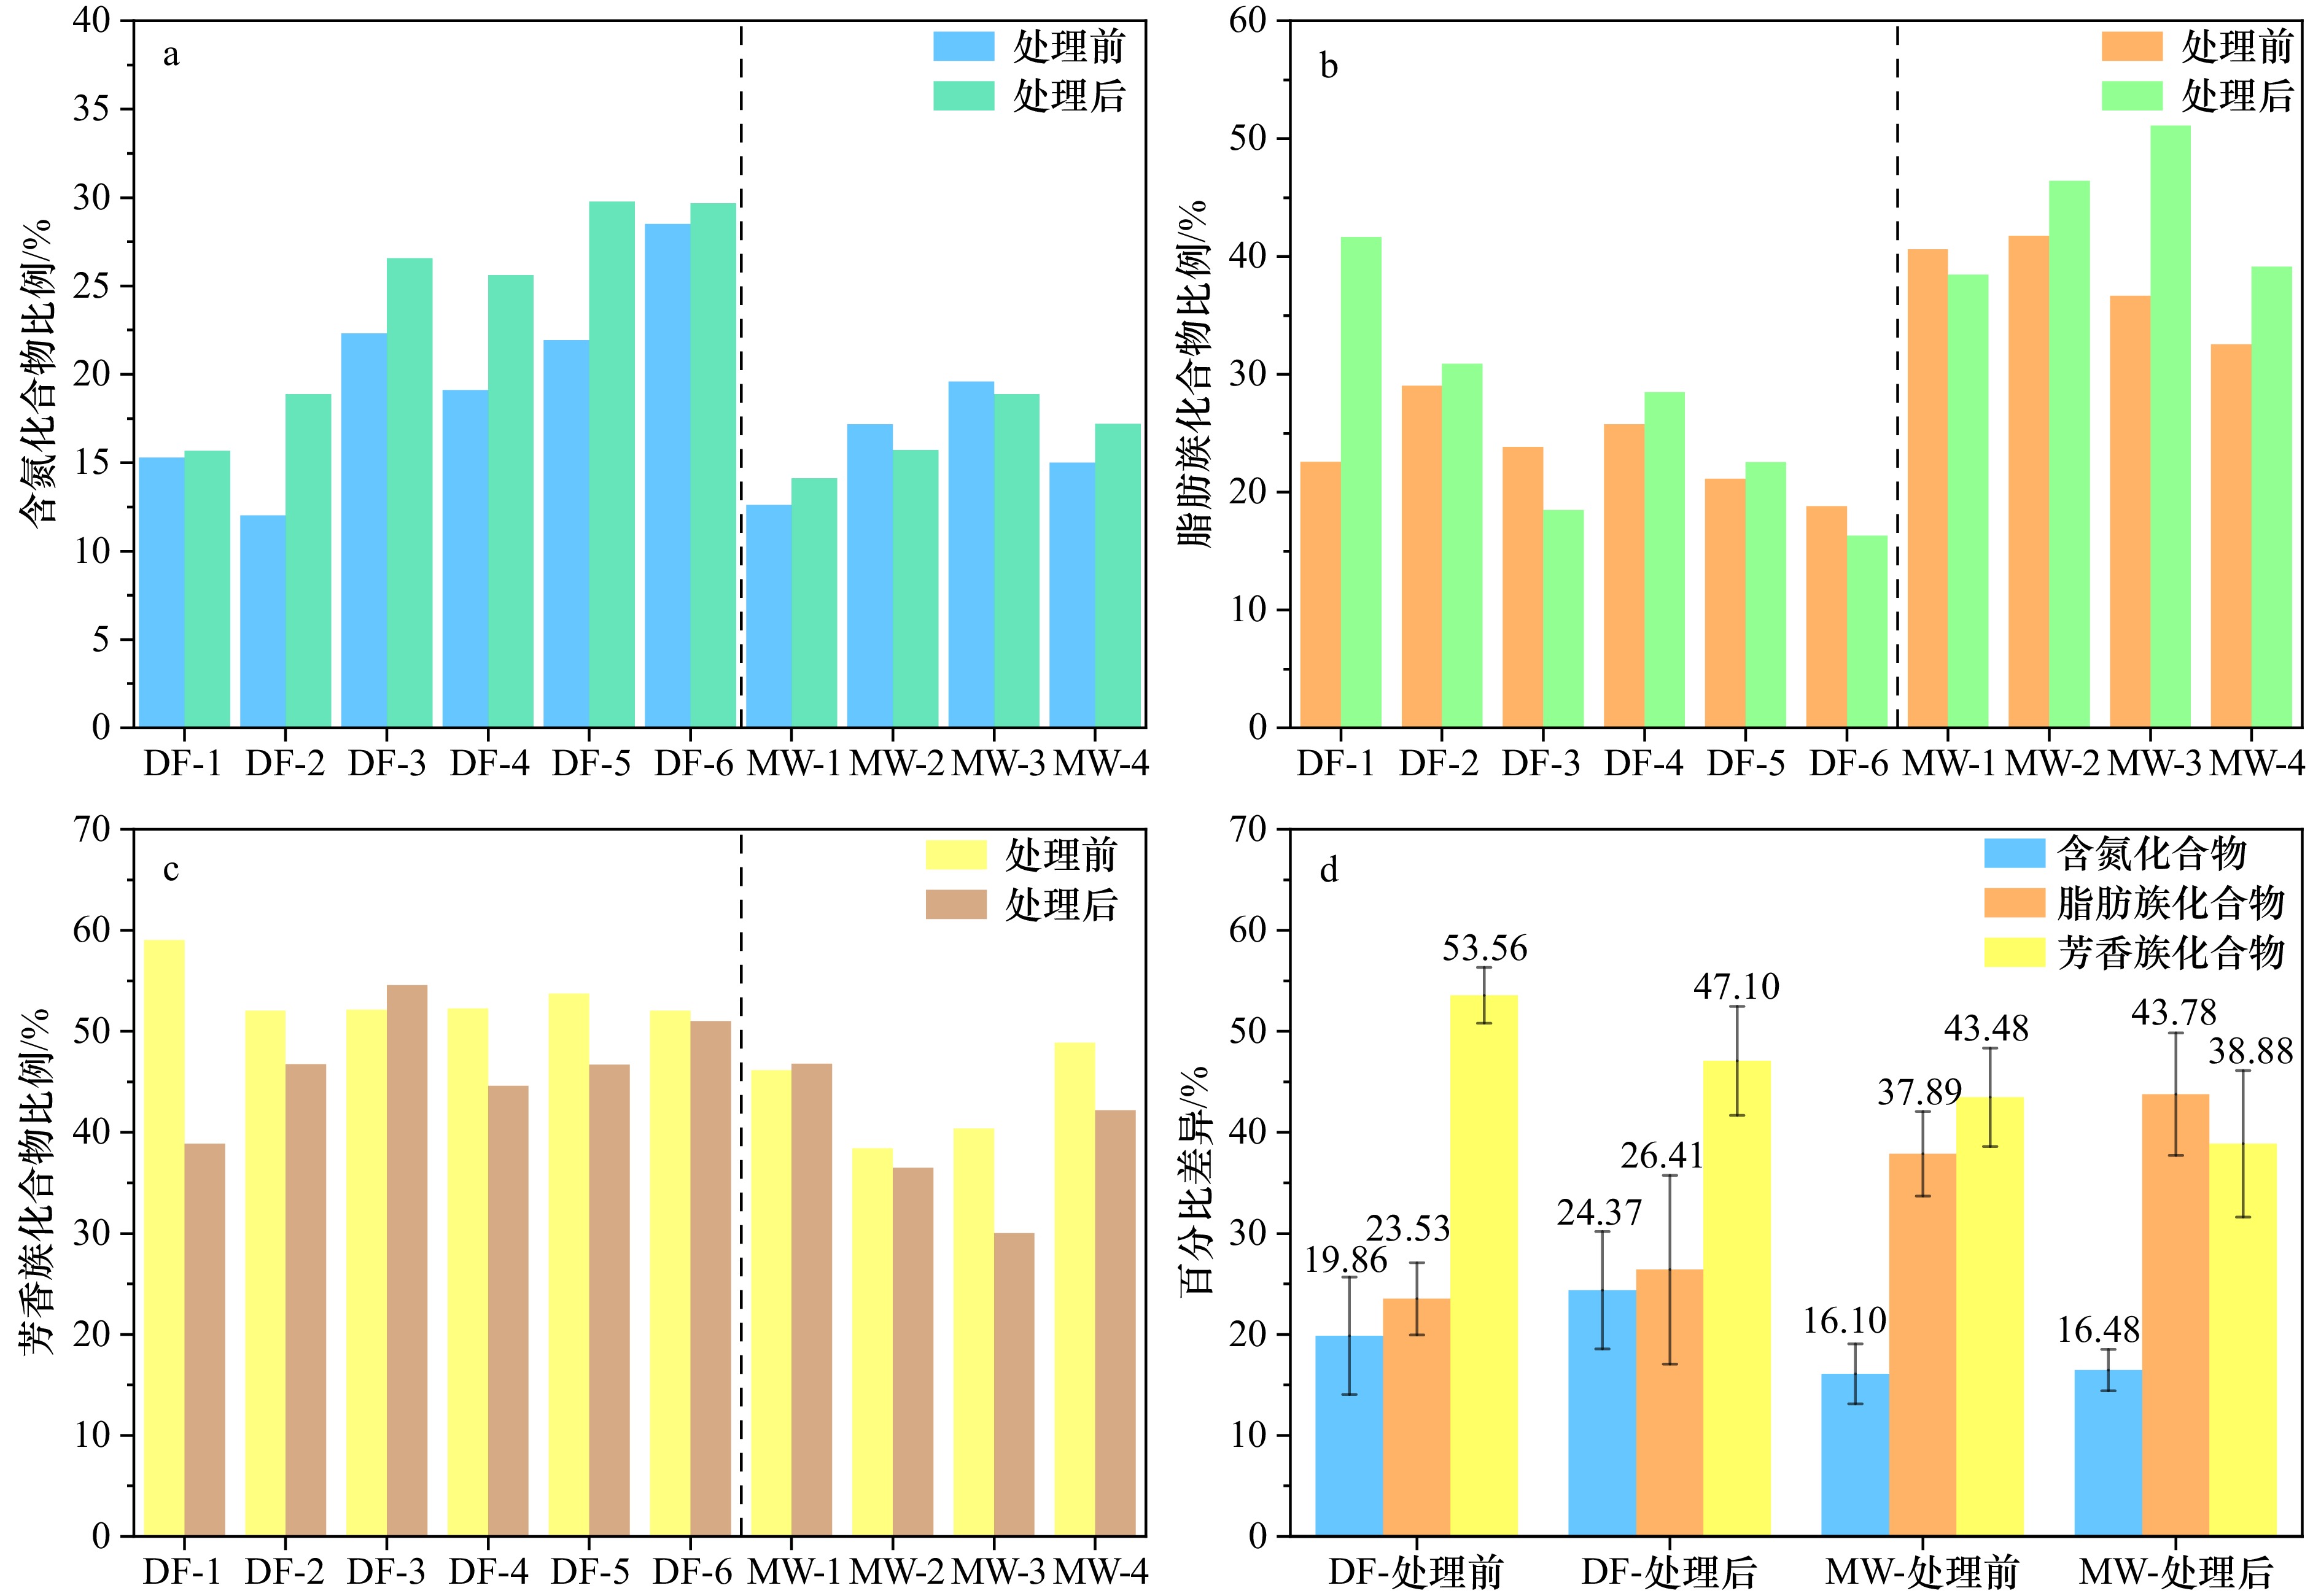
图 7 广西大风江入海口(DF)与茅尾海(MW)红树林表层沉积物原始样品与DCB处理后含氮化合物(a)、脂肪族(b)、芳香族(c)在总结构基团中相对比例与平均值百分比差异(d)
Fig. 7 Relative proportions of nitrogenous compounds (a), aliphatics (b), aromatics (c) in the total structural groups, and the average percentage difference (d) in surface sediment original samples and after DCB treatment in the estuary of Dafeng River (DF) and Maowei Sea (MW) from Guangxi mangroves
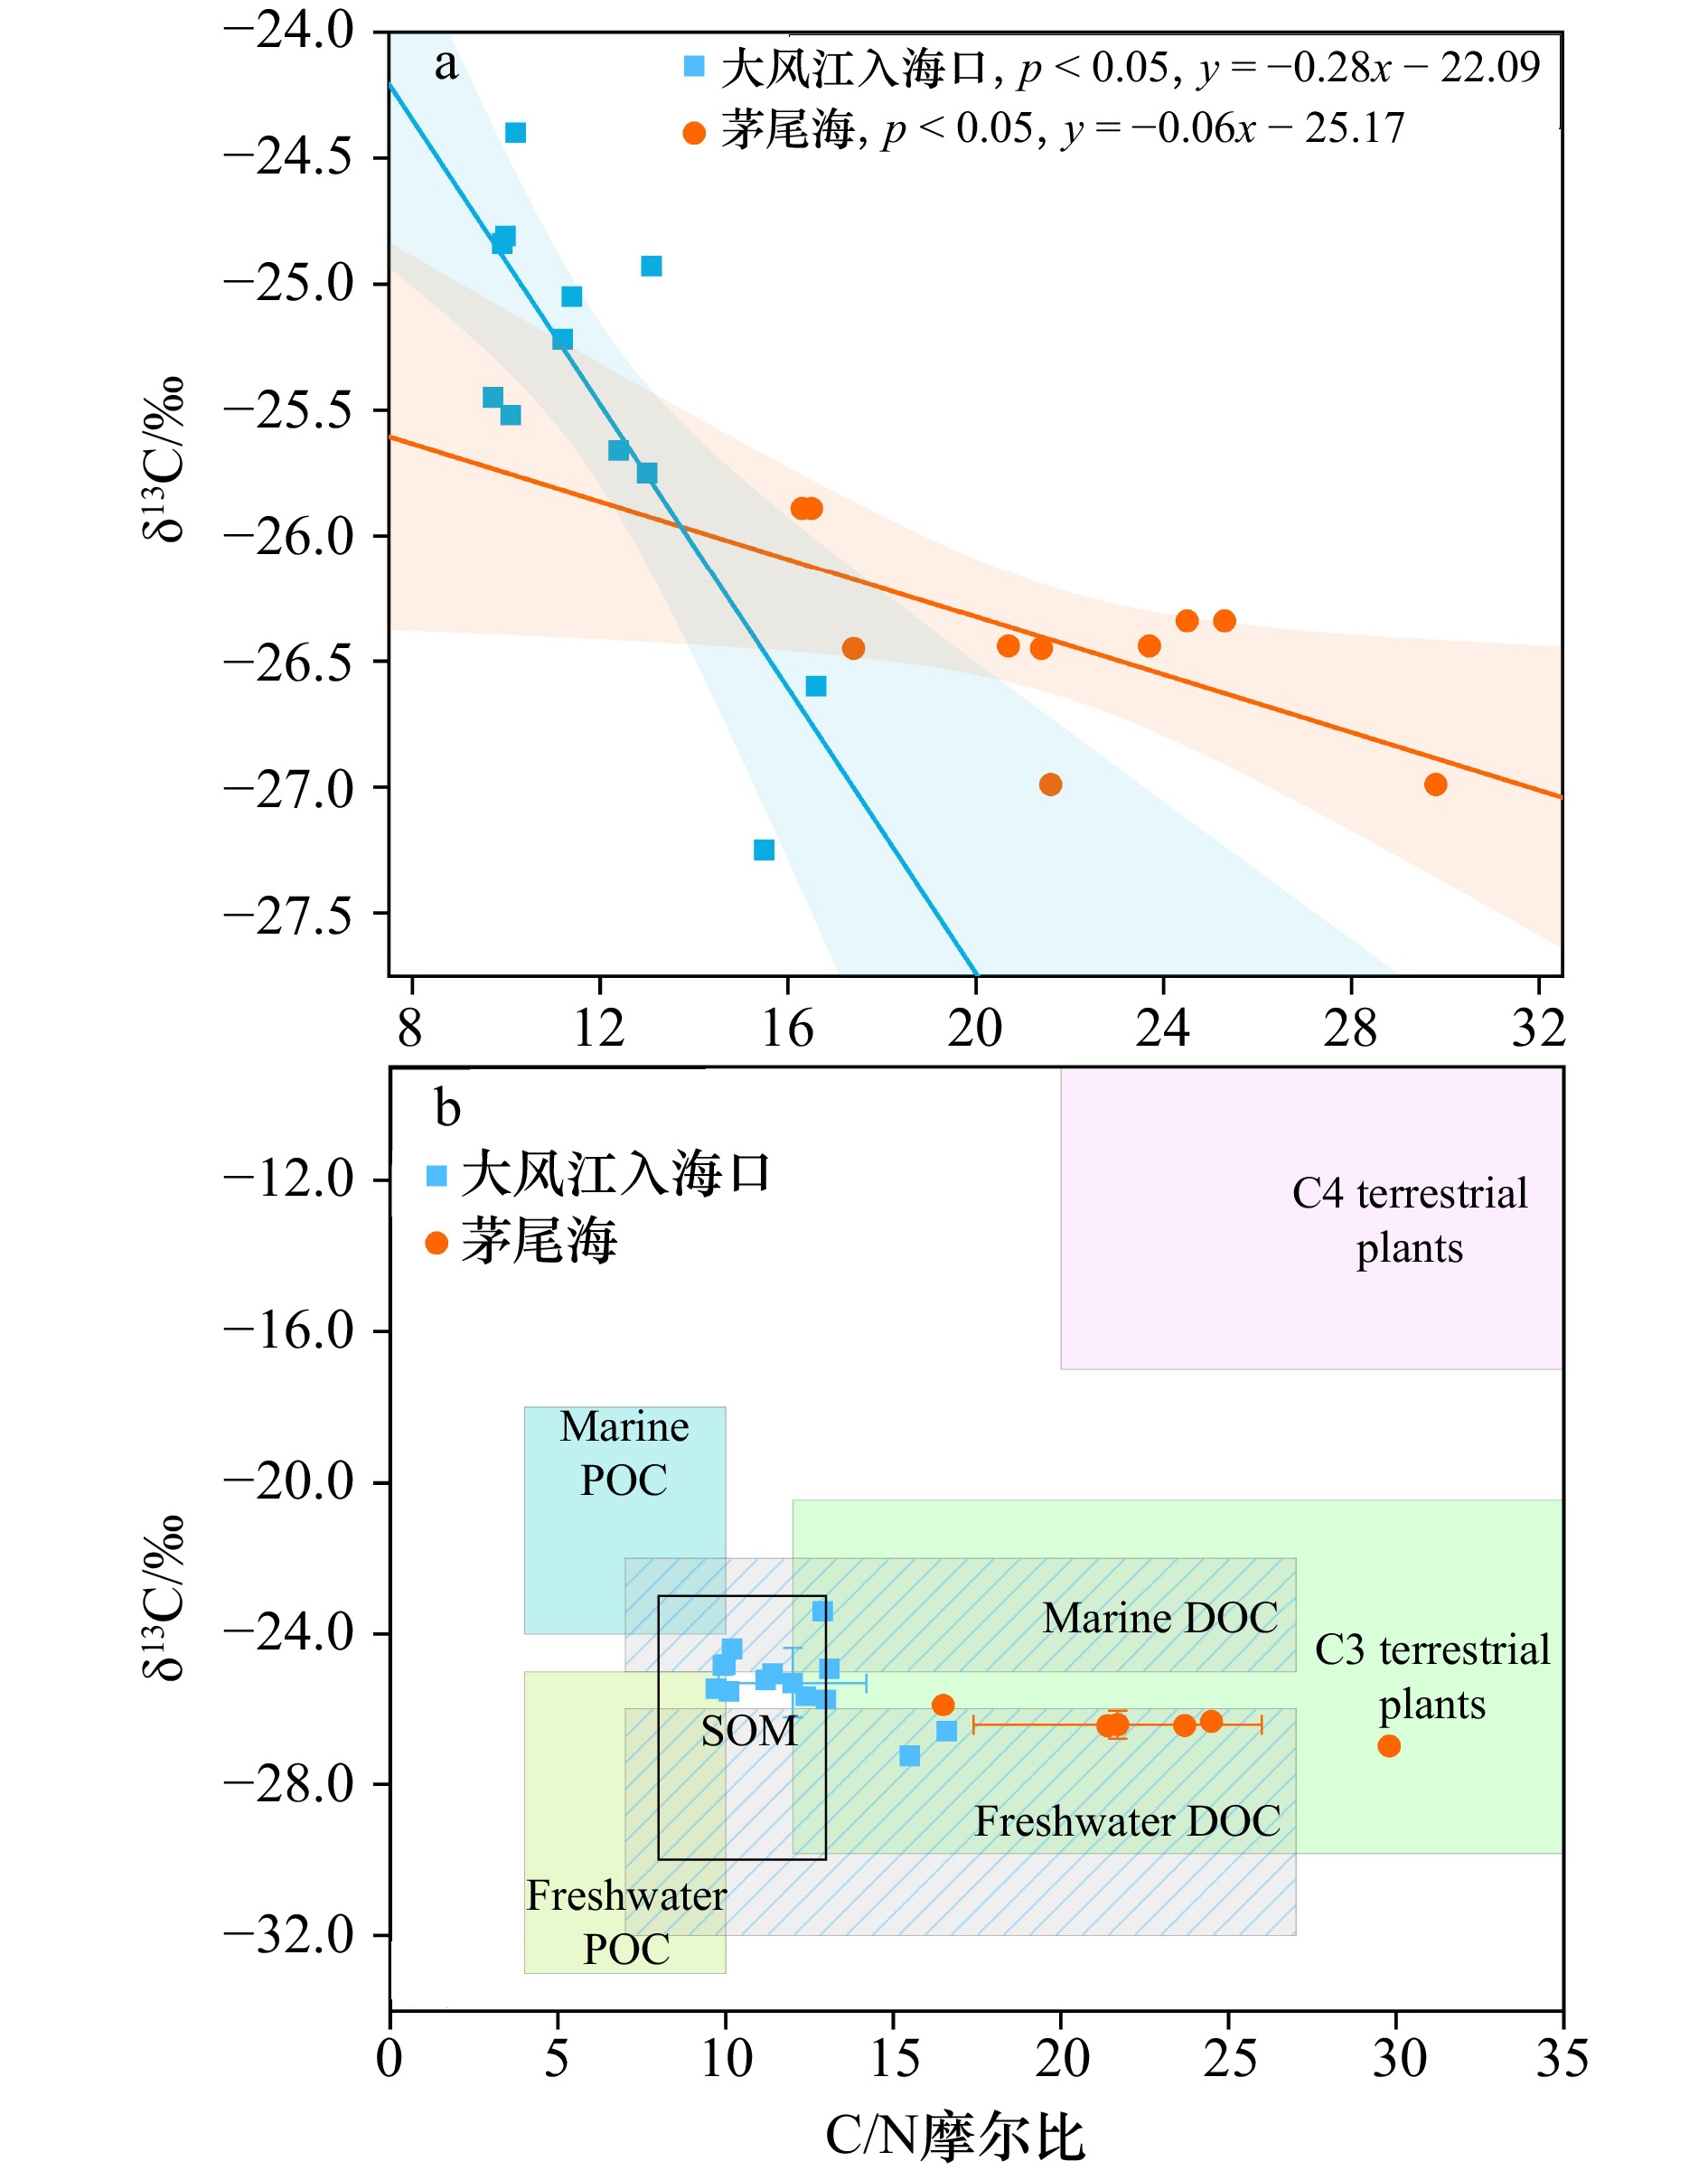

图 8 广西红树林表层沉积物的三角图分布
a. 大风江入海口,b. 茅尾海
Fig. 8 Triangular distribution of surface sediments from Guangxi mangroves
a. The estuary of Dafeng River, b. Maowei Sea
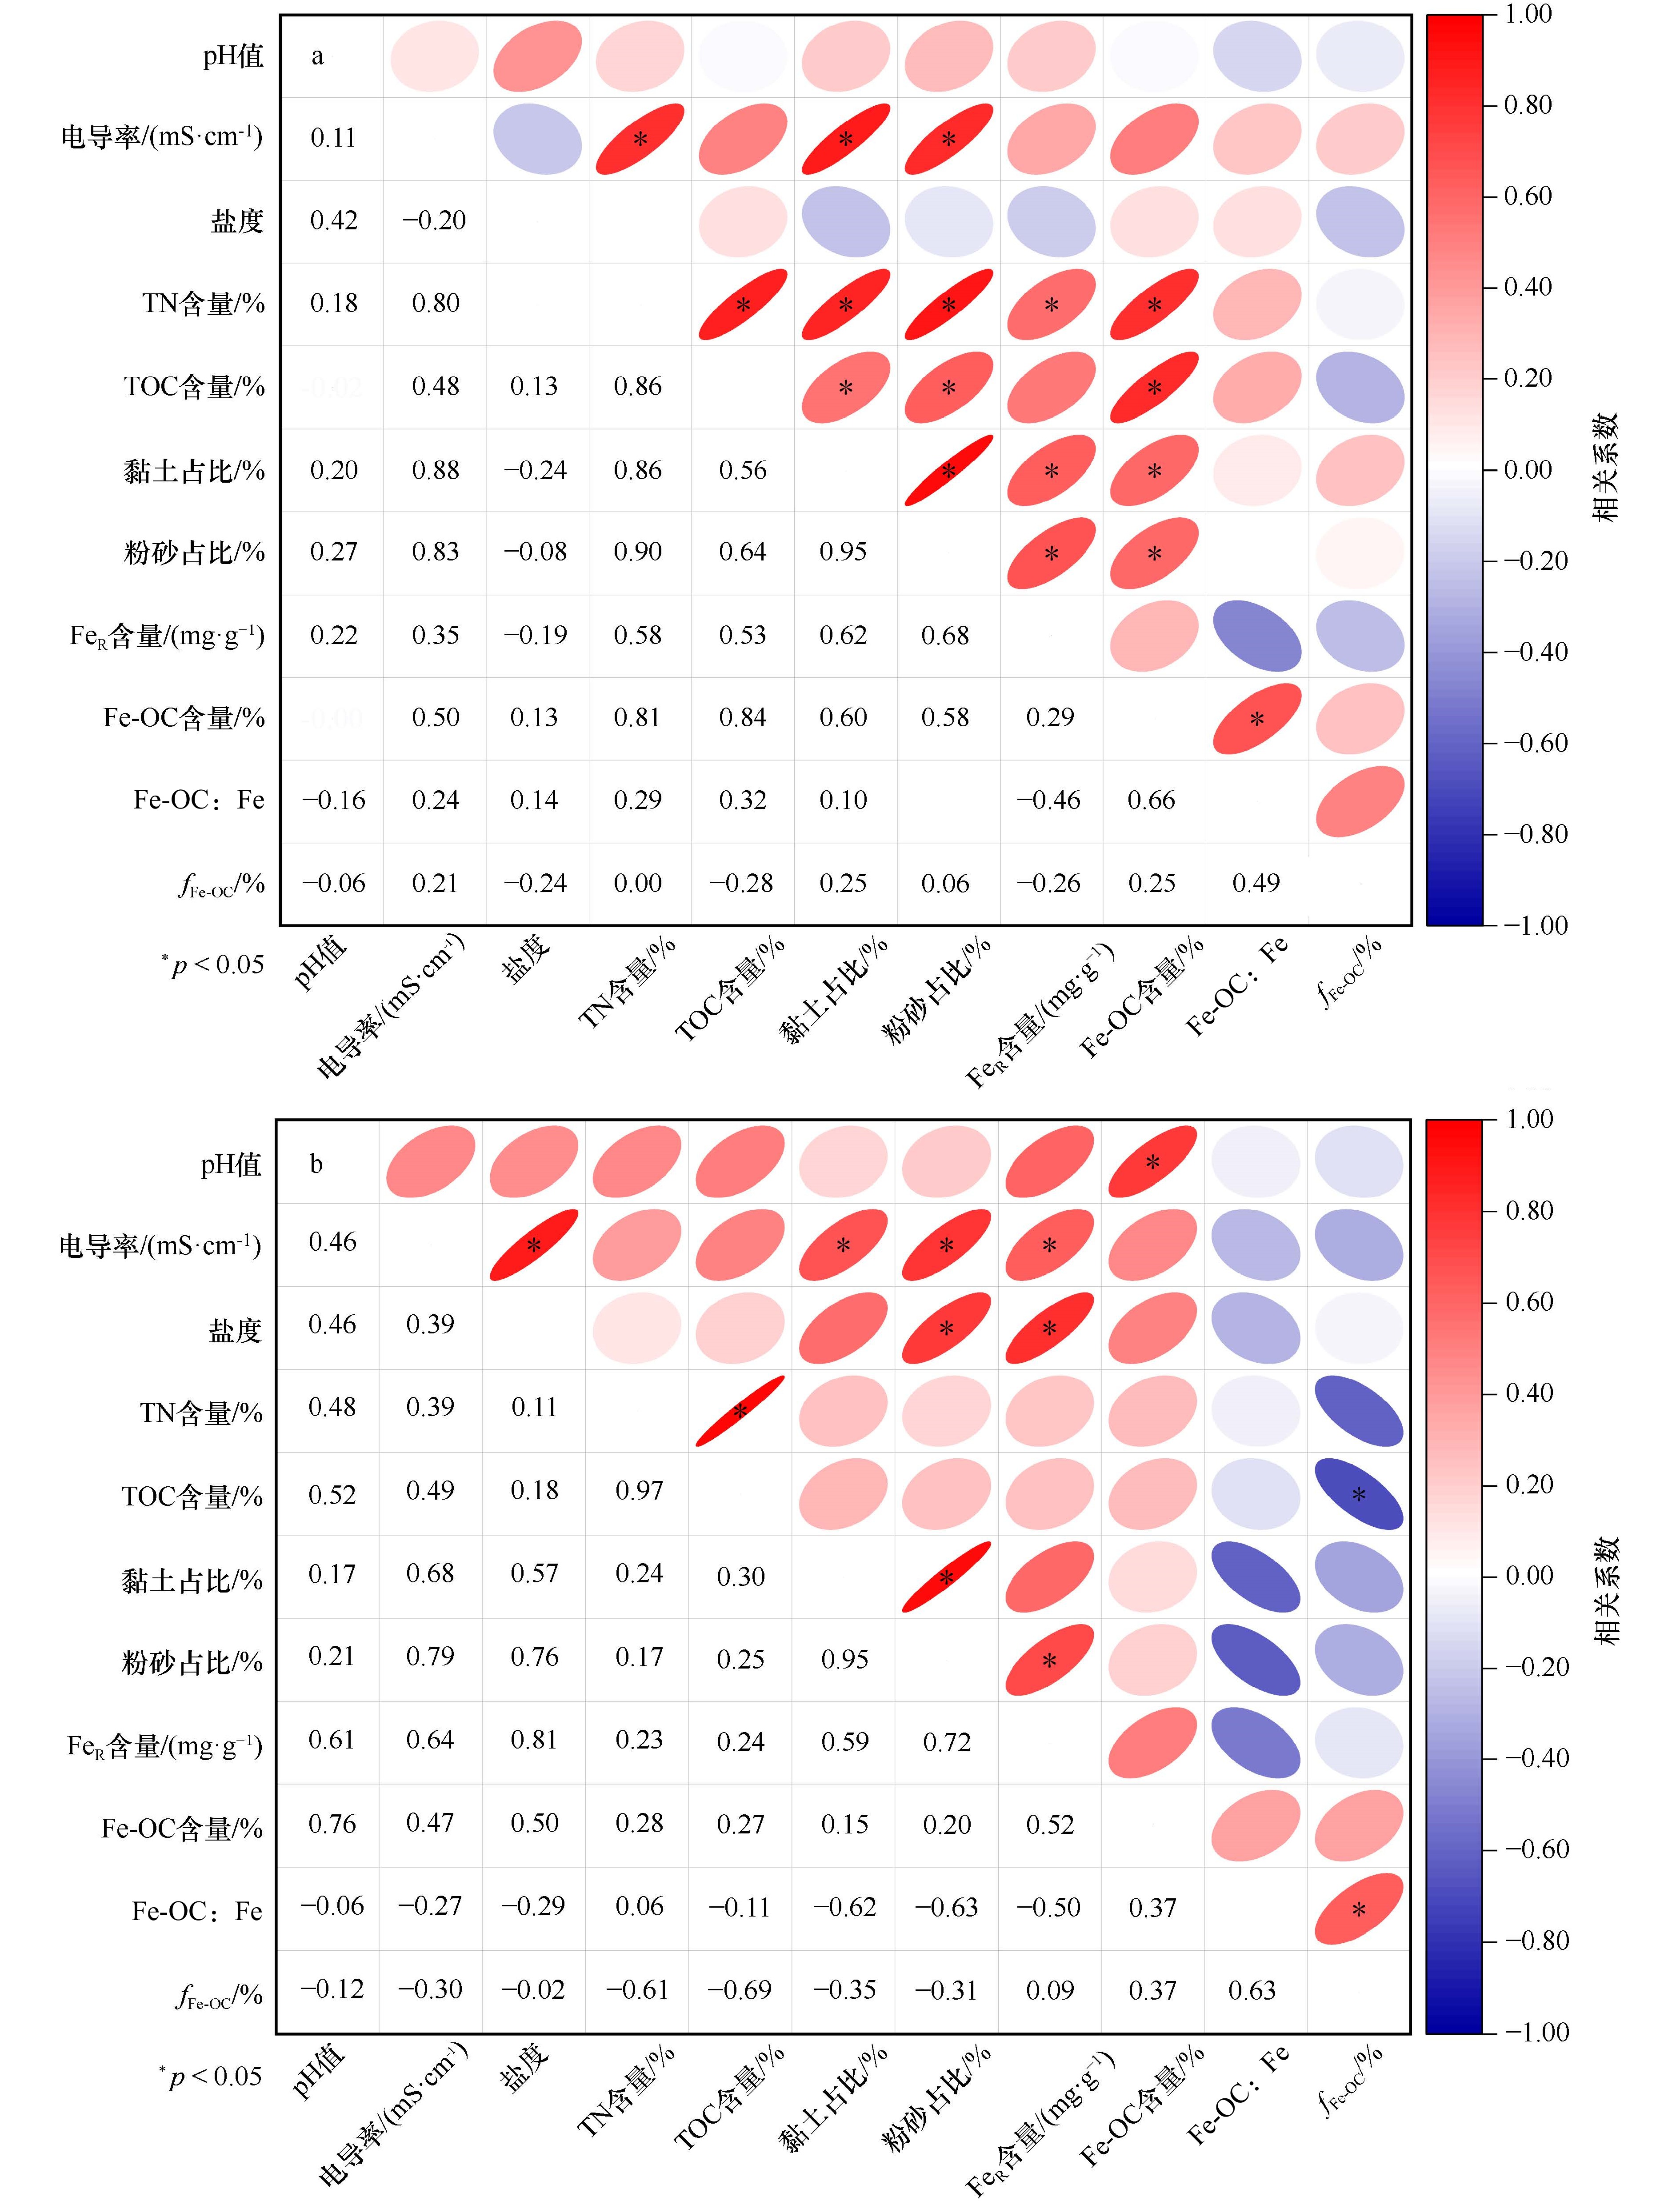
图 9 广西红树林表层沉积物各参数相关性
a. 大风江入海口,b. 茅尾海。椭圆形部分为皮尔逊相关性表示图,红色为正相关,蓝色为负相关,星号表示相关性显著(p < 0.05);数字部分为具体的皮尔逊相关性系数大小
Fig. 9 Correlation analysis of various parameters in surface sediments from Guangxi mangroves
a. The estuary of Dafeng River, b. Maowei Sea. The elliptical part represents Pearson correlation representation, where red indicates positive correlation, blue indicates negative correlation, and asterisks denote significant correlations (p < 0.05); the number part represents specific Pearson correlation coefficients
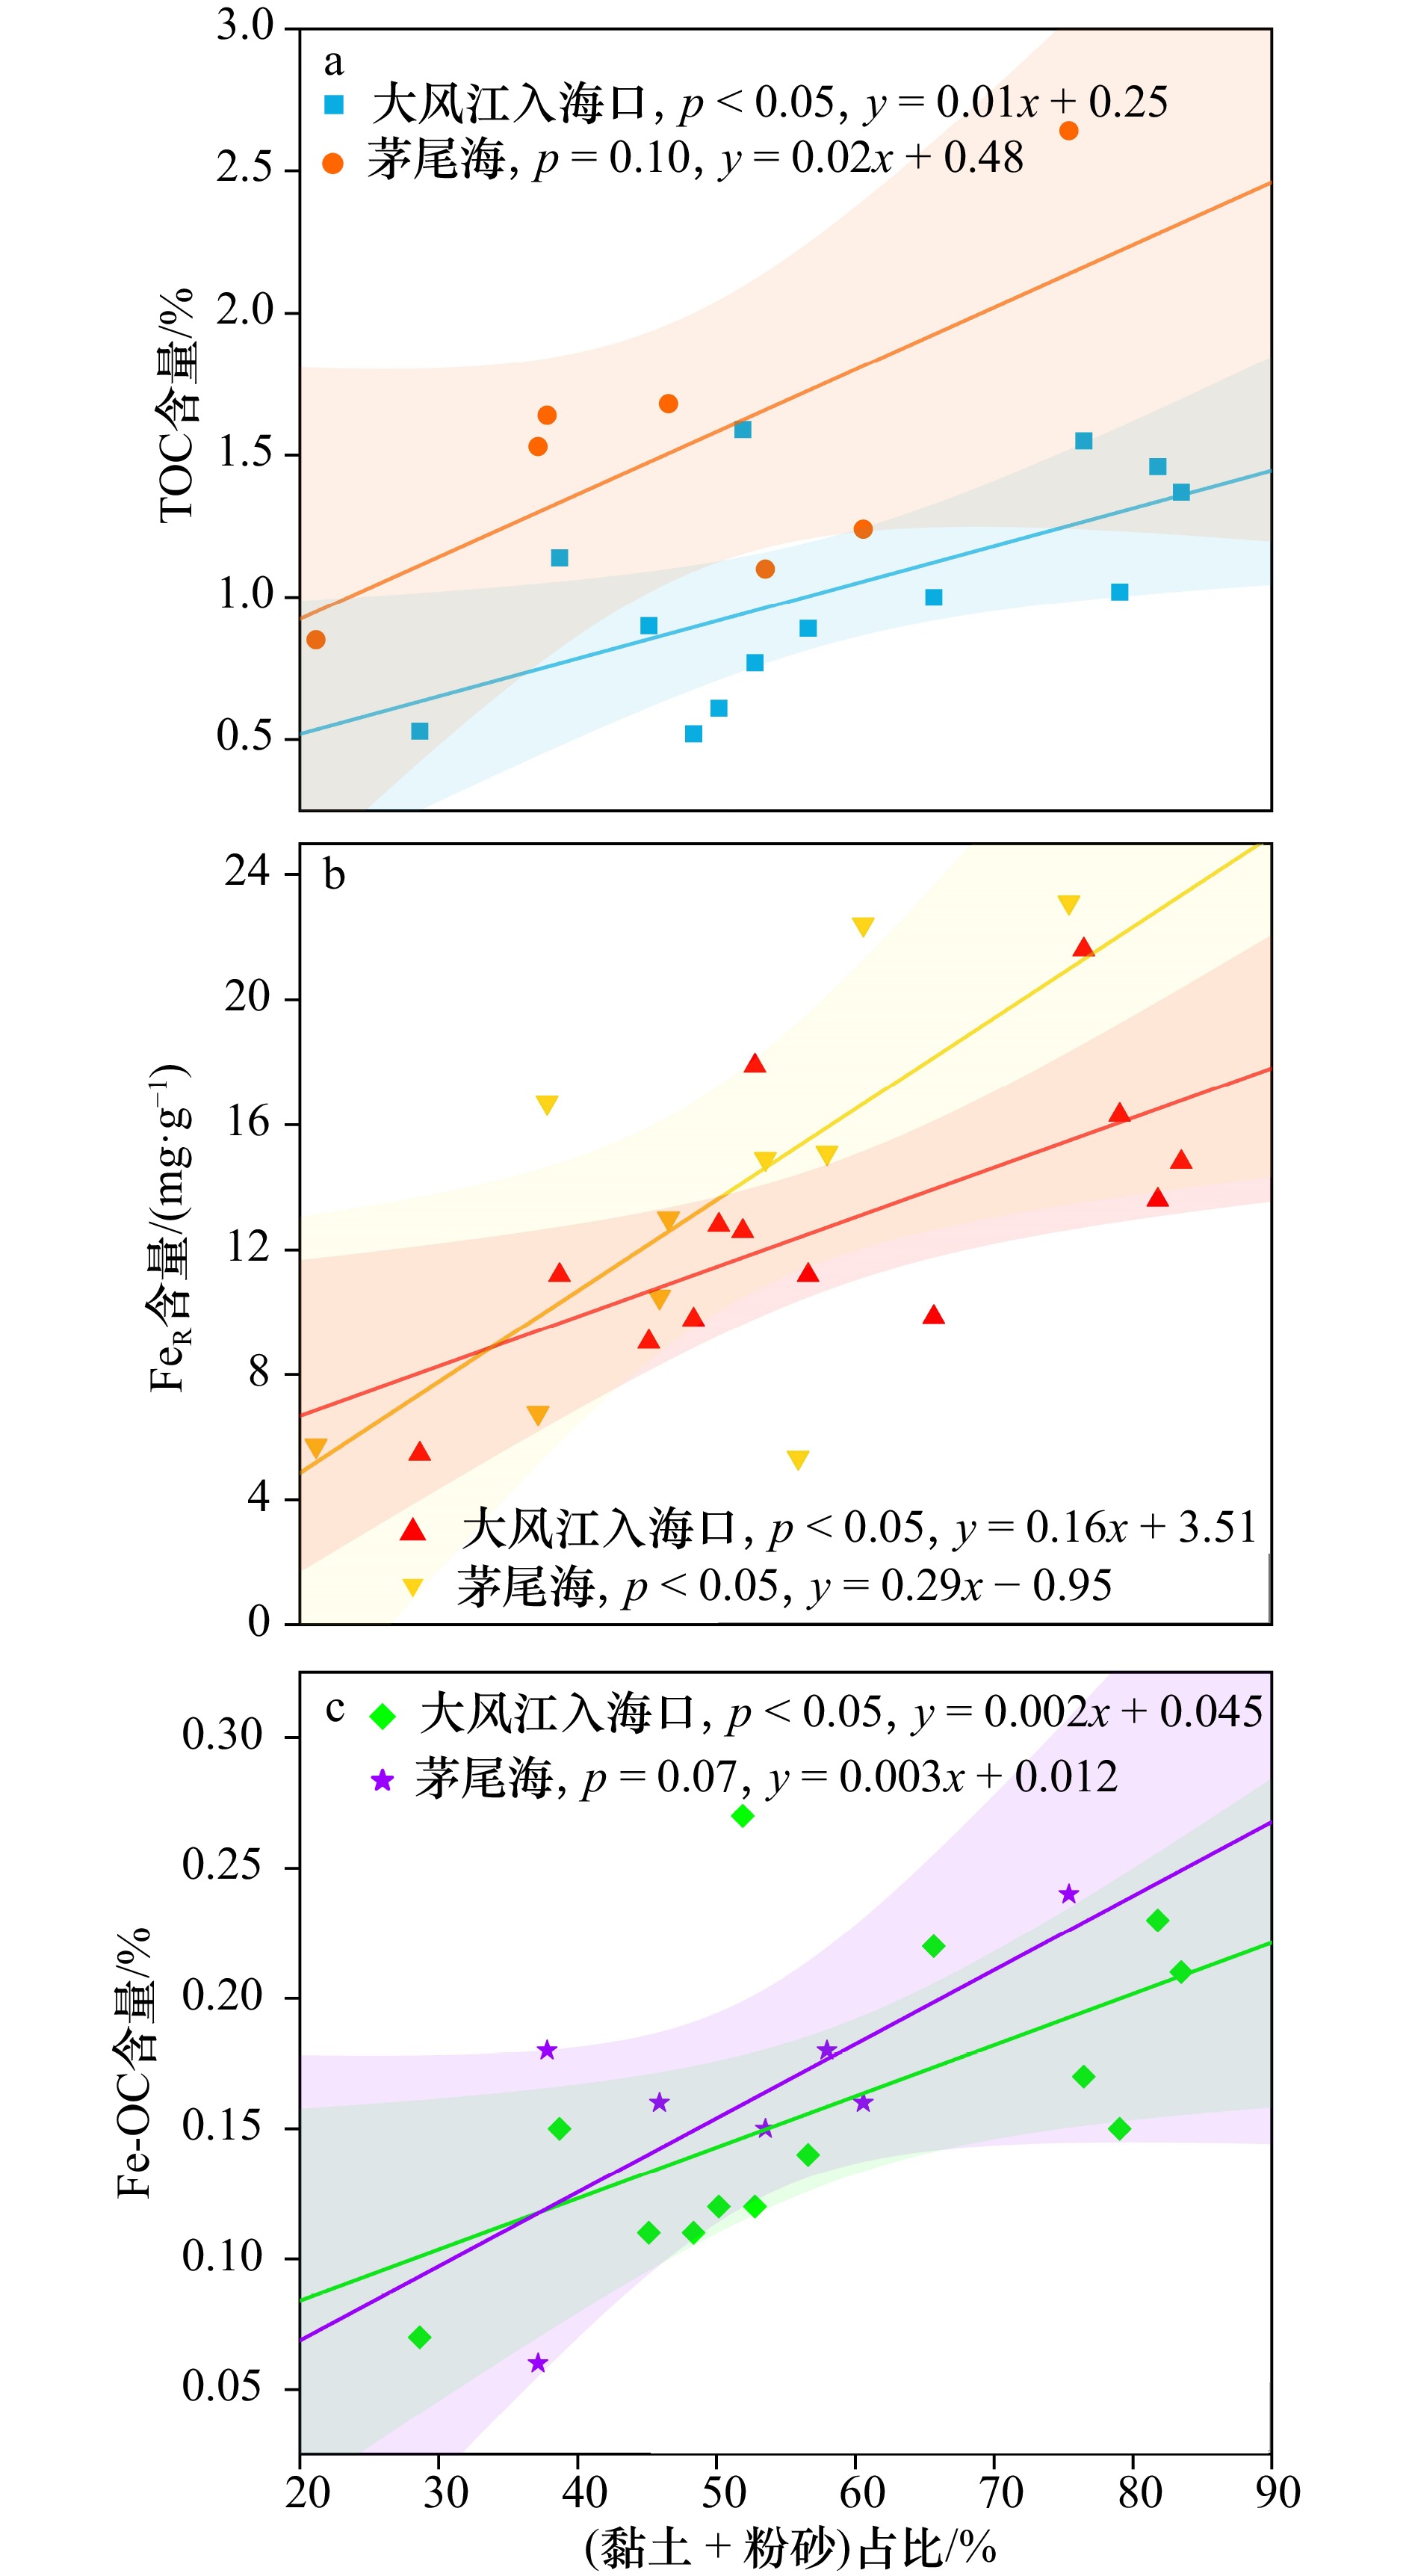
图 10 广西大风江入海口与茅尾海红树林表层沉积物中黏土、粉砂占比与TOC(a)、FeR(b)、Fe-OC(c)含量的相关关系
阴影部分为95%置信带
Fig. 10 The correlation between the proportions of clay and silt and the contents of TOC (a), FeR (b) and Fe-OC (c) insurface sediments in the estuary of Dafeng River and Maowei Sea from Guangxi mangroves
The shaded part is 95% confidence band

图 12 广西红树林表层沉积物中Fe-OC的荧光组分与Fe-OC∶Fe摩尔比的相关关系
a. 大风江入海口, b. 茅尾海。阴影部分为95%置信带
Fig. 12 The correlation between the fluorescent components of Fe-OC and the Fe-OC∶Fe molar ratio in surface sediments from Guangxi mangroves
a. The estuary of Dafeng River, b. Maowei Sea. The shaded part is 95% confidence band

A1 茅尾海与大风江入海口表层沉积物穆斯堡尔谱
A1 Mössbauer spectra of surface sediments in the Maowei Sea and the Dafeng River estuary

A2 广西红树林表层沉积物在DCB处理前后
3500 ~500 cm−1范围内衰减全反射−傅里叶变换红外光谱差异(ATR-FTIR)红线为原始样品,黑线为DCB处理后样品。所有光谱均经过背景校准
A2 Variations in attenuated total reflectance-Fourier transform infrared (ATR-FTIR) spectra in the
3500 ~500 cm−1 range for surface sediments from Guangxi mangroves, before and after DCB treatment.The red line represents the original sample, while the black line represents the sample after DCB treatment. All spectra are background-corrected
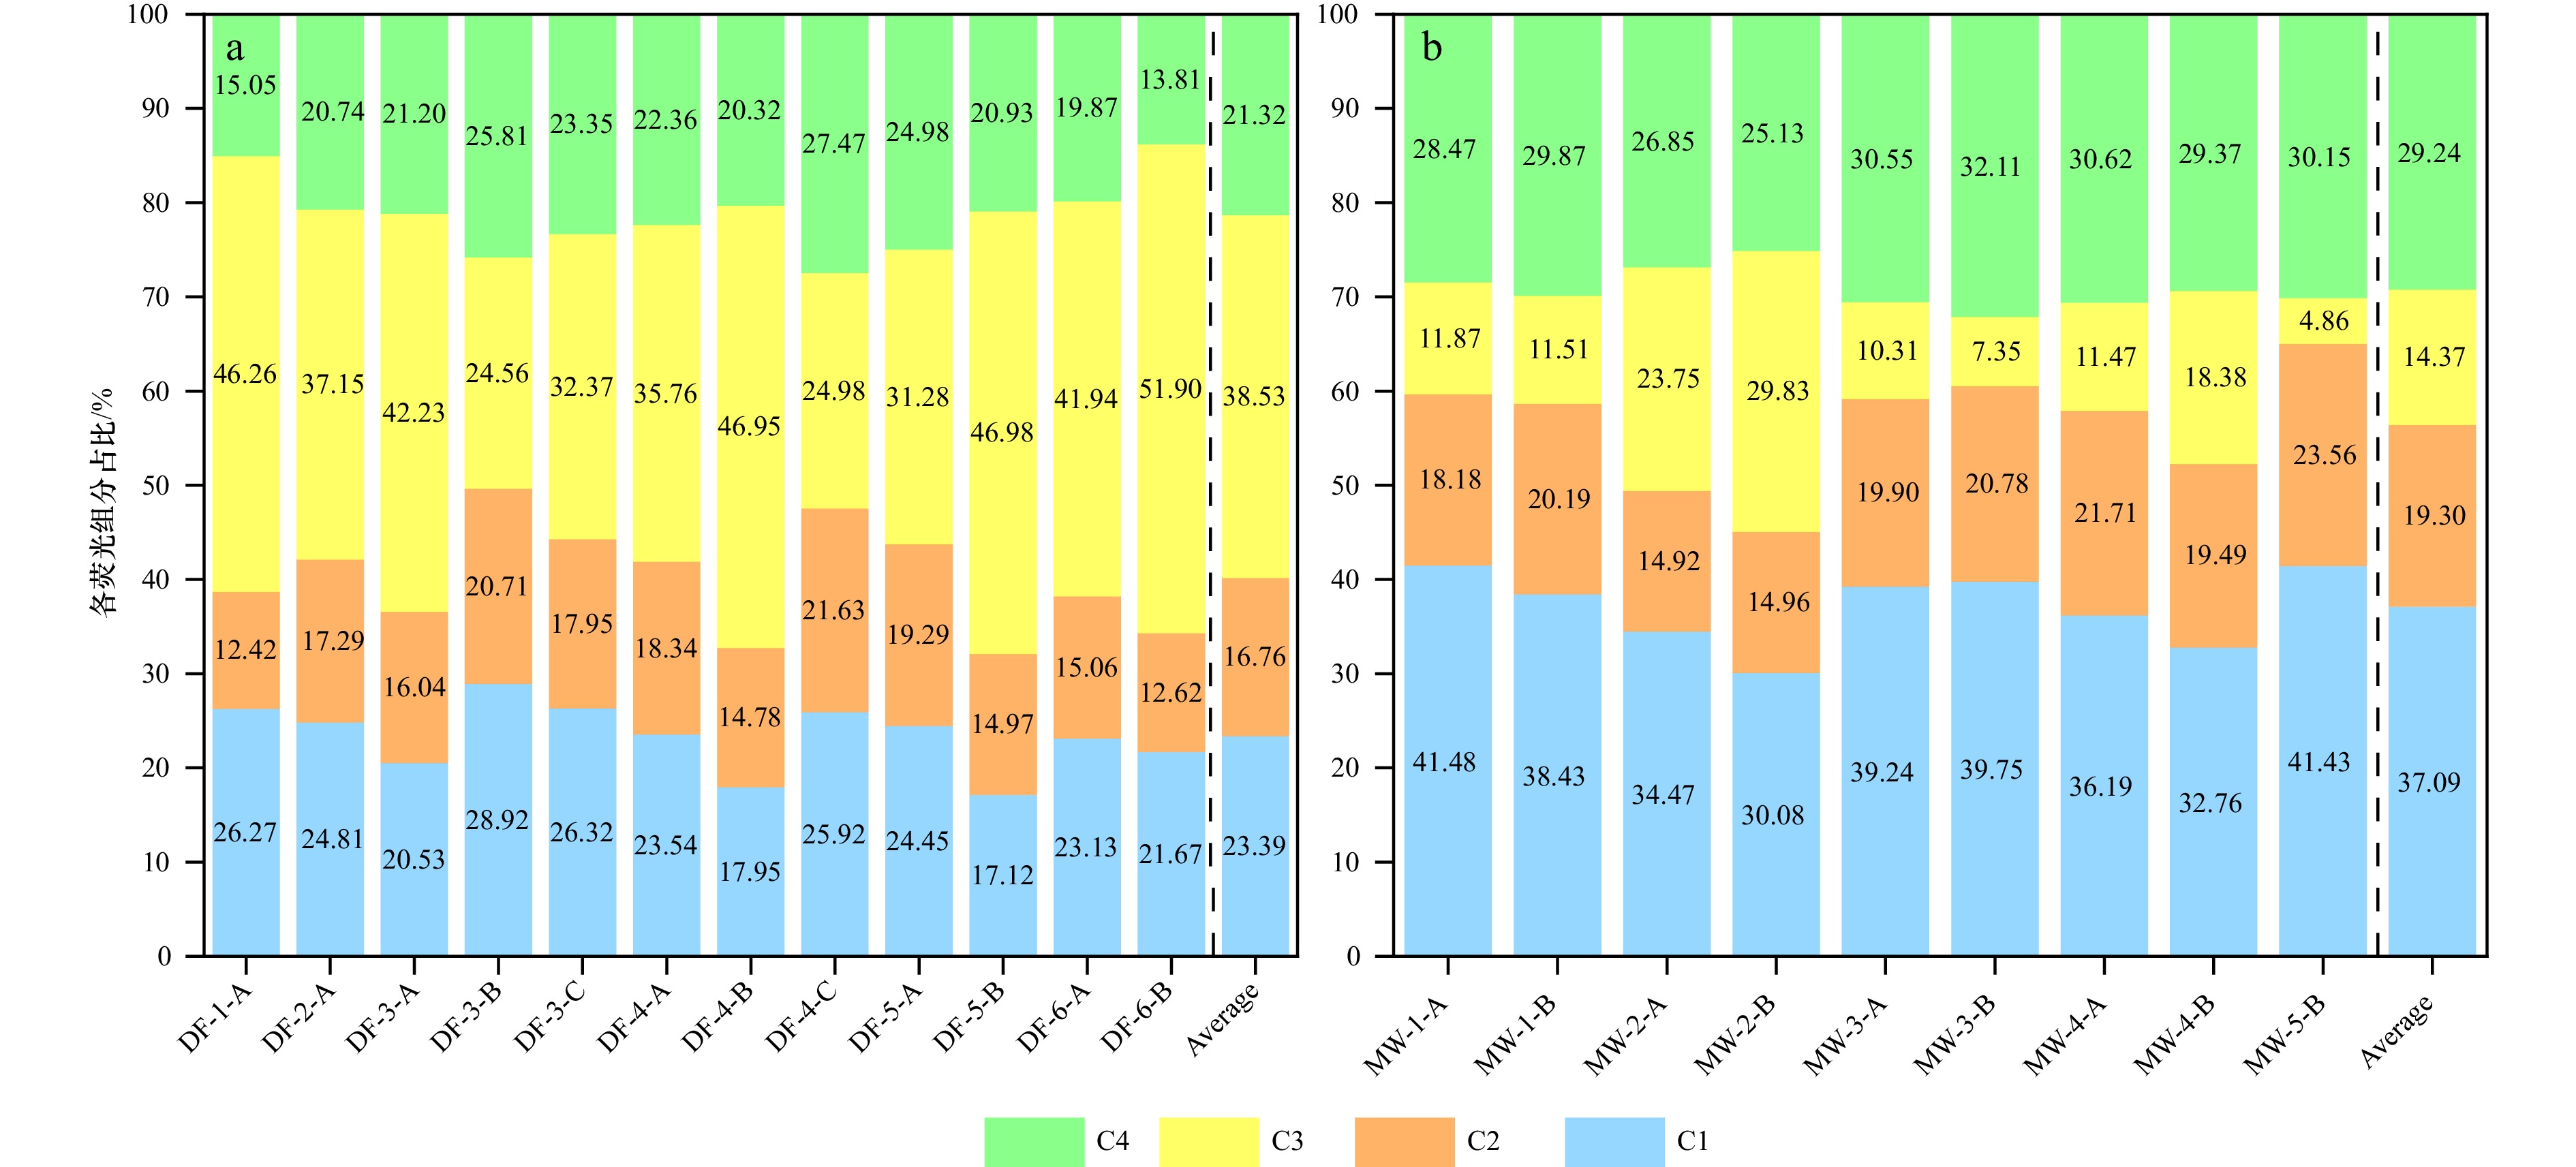
A3 大风江入海口(a)与茅尾海(b)表层沉积物中Fe-OC的荧光组分差异
A3 Differences in the fluorescence composition of Fe-OC in the surface sediments in the estuary of Dafeng River (a) and Maowei Sea (b)
表 1 广西大风江入海口与茅尾海红树林表层沉积物中Fe-OC荧光组分的鉴定
Tab. 1 Identification of fluorescent components of Fe-OC in surface sediments in the estuary of Dafeng River and Maowei Sea from Guangxi mangroves
 下载: 导出CSV
表 2 全球典型湿地类型铁氧化物与有机碳结合情况(改自文献[44])
Tab. 2 The combination of iron oxides with organic carbon in global typical wetland types [44]
站位 站位类型 pH值 占比/% Fe3+/(μmol·g−1) SOC/(mg·g−1) Fe-bound C/(mg·g−1) fOC-Fe/% Fe-OC∶Fe摩尔比 参考文献 全球海洋 河口/海洋沉积物 – – – – – 21.5 ± 8.6 4.0 ± 2.8 Lalonde等[7] 沃斯托克湖,美国 河流沉积物(新生) – – 47.0 ± 23.1 6.2 ± 1.1 0.7 ± 0.6 8.1 ± 3.2 0.5 ± 0.2 Shields等[11] 沃斯托克湖,美国 河流沉积物(成熟) – – 83.5 ± 15.9 31.5 ± 5.2 7.1 ± 5.2 20.2 ± 3.8 5.0 ± 1.7 Shields等[11] 沃斯托克湖,美国 河流沉积物(老化) – – 97.6 ± 12.4 42.2 ± 18.5 8.5 ± 1.3 15.0 ± 4.3 4.9 ± 2.7 Shields等[11] 东英吉利亚,英国 泥碳地 6.2 ± 0.1 – – – – 10.3 ± 2.2 – Wen等[45] 苏比克,菲律宾 红树林湿地 – – – 11.0 ± 4.0 1.7 ± 0.6 15.0 ± 9.0 0.8 ± 0.5 Dicen等[4] 奥布布,菲律宾 红树林湿地 – – – 12.0 ± 2.0 1.4 ± 0.2 12.0 ± 2.0 14.6 ± 3.5 Dicen等[4] 渤海,中国 海岸沉积物 – 17.9 ± 5.4 44.5 ± 10.4 6.2 ± 2.0 0.8 ± 0.7 11.5 ± 8.3 1.6 ± 1.4 Wang等[35] 南黄海,中国 海岸沉积物 – 15.7 ± 7.2 38.0 ± 4.6 7.5 ± 3.5 0.8 ± 0.8 8.8 ± 7.7 1.7 ± 1.8 Ma等[36] 东海,中国 海岸沉积物 – 18.6 ± 7.1 41.9 ± 14.9 5.5 ± 2.0 0.7 ± 0.5 13.2 ± 8.9 1.5 ± 1.3 Ma等[36] 长江口,中国 海岸沉积物 – 24.3 ± 7.4 157.3 ± 39.3 5.4 ± 2.3 – 6.1 ± 2.1 0.2 ± 0.1 Zhao等[10] 长江口,中国 海洋沉积物 – 25.7 ± 17.1 54.6 ± 9.0 3.2 ± 1.6 – 9.4 ± 5.1 0.4 ± 0.3 Zhao等[10] 长江口,中国 河口沉积物 – 7.8 ± 7.2 102.9 ± 14.3 3.2 ± 2.2 – 11.3 ± 3.6 0.3 ± 0.2 Zhao等[10] 神农架,中国 泥碳地 5.1 ± 0.2 – 100.0 ± 96.4 161.1 ± 73.3 – 12.8 ± 4.6 – Zhao等[46] 三江平原,中国 平原湿地(植被区) 6.5 ± 0.3 – 80.4 ± 1.8 44.2 ± 5.5 7.8 ± 0.3 17.8 ± 1.3 – Duan等[47] 三江平原,中国 平原湿地(光滩) 6.8 ± 0.2 – 53.6 ± 21.4 41.6 ± 2.9 2.1 ± 1.1 5.7 ± 2.7 – Duan等[47] 青藏高原,中国 高寒湿地 7.4 ± 0.4 – 30.4 ± 14.3 140.0 ± 15.0 – 8.6 ± 3.2 – Wang等[35] 闽江口,中国 潮间湿地 7.1 ± 0.2 13.5 ± 5.5 105.4 ± 21.4 12.8 ± 2.7 3.0 ± 0.6 24.5 ± 6.0 11.0 ± 4.5 Bai等[44] 茅尾海,中国 红树林湿地 4.8 ± 0.9 17.4 ± 4.6 – 19.2 ± 1.2 1.7 ± 0.7 10.9 ± 5.6 0.7 ± 0.3 本研究 大风江入海口,中国 红树林湿地 6.7 ± 0.9 21.4 ± 7.5 – 10.2 ± 0.5 1.6 ± 0.7 16.2 ± 5.0 0.6 ± 0.3 本研究 注:“−”表示无数据。
下载: 导出CSV
A1 大风江入海口红树林表层沉积物主要理化参数
A1 Main physicochemical parameters of the surface sediments in the mangrove in the estuary of Dafeng River
样品编号 pH值 电导率/(mS·cm−1) 盐度 TN含量/% TOC含量/% 黏土占比/% 粉砂占比/% 砂占比/% C/N摩尔比 DF-1-A 6.18 8.44 6.90 0.14 1.55 27.68 48.79 23.55 12.9 DF-2-A 8.18 2.95 14.3 0.08 0.77 18.98 33.80 47.23 11.2 DF-3-A 6.64 4.47 4.37 0.08 0.90 17.49 27.63 54.89 13.1 DF-3-B 5.73 3.55 17.1 0.12 1.59 18.93 32.97 48.11 15.5 DF-3-C 6.37 3.57 19.3 0.08 1.14 13.62 25.08 61.31 16.6 DF-4-A 6.59 4.51 14.7 0.07 0.61 19.92 30.25 49.85 10.2 DF-4-B 6.38 3.60 21.3 0.05 0.53 10.11 18.52 71.37 12.4 DF-4-C 6.97 4.41 23.4 0.08 0.89 20.94 35.67 40.84 13.0 DF-5-A 5.92 7.02 3.08 0.12 1.02 27.48 51.57 12.52 9.92 DF-5-B 6.53 8.72 5.55 0.12 1.00 26.68 38.98 34.35 9.72 DF-5-C 6.11 5.56 6.70 0.06 0.52 19.04 29.31 51.65 10.1 DF-6-A 7.55 9.28 22.3 0.16 1.37 28.64 54.85 16.52 9.99 DF-6-B 7.64 8.80 20.7 0.15 1.46 28.59 53.20 18.21 11.4 平均 ± SD 6.67 ± 0.85 5.76 ± 3.18 13.8 ± 7.38 0.10 ± 0.04 1.02 ± 0.46 21.39 ± 7.49 36.26 ± 12.06 42.35 ± 18.98 12.0 ± 2.20
下载: 导出CSV
A2 茅尾海红树林表层沉积物主要理化参数
A2 Main physicochemical parameters of the surface sediments in the mangrove of Maowei Sea
样品编号 pH值 电导率/(mS·cm−1) 盐度 TN含量/% TOC含量/% 黏土占比/% 粉砂占比/% 砂占比/% C/N摩尔比 MW-1-A 5.31 2.95 3.65 0.23 4.26 17.76 28.14 54.11 21.6 MW-1-B 4.40 2.14 3.65 0.06 1.53 13.19 23.95 62.87 29.8 MW-2-A 2.88 2.23 3.01 0.04 0.56 20.65 35.24 44.12 16.3 MW-2-B 3.90 1.31 3.01 0.06 0.85 8.11 13.05 78.84 16.5 MW-3-A 5.26 1.43 3.07 0.11 1.64 14.34 23.46 62.20 17.4 MW-3-B 4.74 1.22 3.07 0.06 1.10 19.37 34.16 46.48 21.4 MW-4-A 5.24 3.93 11.4 0.17 3.68 19.49 38.47 42.04 25.3 MW-4-B 6.31 3.53 11.4 0.08 1.68 16.92 29.62 53.45 24.5 MW-5-A 5.16 4.00 20.6 0.07 1.24 19.21 41.37 39.42 20.7 MW-5-B 5.24 5.34 20.6 0.13 2.64 24.55 50.85 24.61 23.7 平均 ± SD 4.84 ± 0.94 2.81 ± 1.38 8.35 ± 7.27 0.10 ± 0.06 1.92 ± 1.23 17.36 ± 4.56 31.83 ± 10.63 50.81 ± 15.04 21.7 ± 4.30
下载: 导出CSV
A3 大风江入海口红树林表层沉积物的FeR、Fe-OC、δ13C等参数
A3 Parameters such as FeR, Fe-OC, δ13C of the surface sediments of mangrove in the estuary of Dafeng River
样品编号 FeR/(mg·g−1) Fe-OC含量/% Fe-OC∶Fe摩尔比 fFe-OC/% δ13Cbulk/‰ δ13Cnon-FeOC/‰ δ13CFe-OC/‰ Δδ13C/‰ DF-1-A 21.6 0.17 0.36 10.7 −23.41 −24.10 −16.36 7.74 DF-2-A 17.9 0.12 0.33 15.9 −25.22 −25.68 −22.47 3.21 DF-3-A 9.05 0.11 0.56 12.4 −24.93 −25.30 −17.70 7.60 DF-3-B 12.6 0.27 0.98 16.9 −27.25 −27.73 −24.88 2.85 DF-3-C 11.2 0.15 0.61 12.9 −26.60 −27.13 −21.25 5.88 DF-4-A 12.8 0.12 0.39 17.6 −24.40 −24.91 −20.68 4.24 DF-4-B 5.47 0.07 0.64 13.6 −25.66 −26.26 −22.80 3.45 DF-4-C 11.2 0.14 0.59 16.6 −25.75 −26.13 −24.09 2.05 DF-5-A 16.3 0.15 0.41 17.4 −24.84 −25.16 −22.41 2.75 DF-5-B 9.86 0.22 1.13 24.0 −25.45 −25.97 −22.40 3.57 DF-5-C 9.77 0.11 0.55 21.2 −25.52 −25.76 −24.68 1.08 DF-6-A 14.8 0.21 0.65 15.1 −24.81 −24.48 −26.07 −1.59 DF-6-B 13.6 0.23 0.79 16.6 −25.05 −24.52 −27.46 −2.94 平均 ± SD 12.8 ± 4.19 0.16 ± 0.07 0.61 ± 0.27 16.2 ± 3.58 −25.30 ± 0.93 −25.63 ± 1.03 −22.56 ± 3.05 3.07 ± 3.03
下载: 导出CSV
A4 茅尾海红树林表层沉积物的FeR、Fe-OC、δ13C等参数
A4 Parameters such as FeR, Fe-OC, δ13C of the surface sediments of mangrove in Maowei Sea
样品编号 FeR/(mg·g−1) Fe-OC含量/% Fe-OC∶Fe摩尔比 fFe-OC/% δ13Cbulk/‰ δ13Cnon-FeOC/‰ δ13CFe-OC/‰ Δδ13C/‰ MW-1-A 10.5 0.16 0.73 3.87 − − − − MW-1-B 6.77 0.06 0.41 3.92 −26.99 −27.41 −25.66 1.75 MW-2-A 5.35 0.07 0.58 12.0 − − − − MW−2-B 5.73 0.18 1.43 20.8 −25.89 −26.60 −23.23 3.37 MW-3-A 16.7 0.18 0.50 11.0 − − − − MW-3-B 14.9 0.15 0.47 13.7 −26.45 −26.75 −24.57 2.18 MW-4-A 15.1 0.18 0.56 4.95 − − − − MW-4-B 13.0 0.29 1.02 16.9 −26.34 −26.79 −24.11 2.68 MW-5-A 22.4 0.16 0.33 12.8 − − − − MW-5-B 23.1 0.24 0.48 9.01 −26.44 −26.38 −27.04 −0.65 平均 ± SD 13.4 ± 6.39 0.17 ± 0.07 0.65 ± 0.33 10.9 ± 5.62 −26.42 ± 0.37 −26.78 ± 0.36 −24.92 ± 1.39 1.87 ± 1.44 注:“−”表示无数据。
下载: 导出CSV
A5 大风江入海口与茅尾海表层沉积物中铁化合物的穆斯堡尔谱参数
A5 Mössbauer spectral parameters of iron compounds in surface sediments in the estuary of Dafeng River and Mawei Sea
样品编号 铁的化学态 相对占比/% IS/(mm·s−1) QS/(mm·s−1) Fe2+/Fe3+ DF-1-A para-Fe2+
para-Fe3+16.20
83.801.099 ± 0.018
0.368 ± 0.0032.922 ± 0.034
0.642 ± 0.0050.193 DF-2-A para-Fe2+
para-Fe3+13.85
86.151.085 ± 0.020
0.368 ± 0.0032.809 ± 0.040
0.621 ± 0.0040.161 DF-3-A para-Fe2+
para-Fe3+13.53
86.471.109 ± 0.020
0.350 ± 0.0022.625 ± 0.039
0.627 ± 0.0030.156 DF-3-B para-Fe2+
para-Fe3+13.19
86.811.062 ± 0.022
0.358 ± 0.0032.534 ± 0.044
0.625 ± 0.0050.152 DF-3-C para-Fe2+
para-Fe3+16.98
83.021.045 ± 0.036
0.354 ± 0.0052.498 ± 0.071
0.591 ± 0.0090.205 DF-4-A para-Fe2+
para-Fe3+12.73
87.271.270 ± 0.015
0.337 ± 0.0032.242 ± 0.031
0.682 ± 0.0060.146 DF-4-B para-Fe2+
para-Fe3+14.67
85.331.066 ± 0.034
0.354 ± 0.0042.634 ± 0.068
0.628 ± 0.0070.172 DF-4-C para-Fe2+
para-Fe3+14.93
85.071.081 ± 0.007
0.356 ± 0.0012.632 ± 0.013
0.633 ± 0.0020.176 DF-5-A para-Fe2+
para-Fe3+17.08
82.921.066 ± 0.027
0.363 ± 0.0042.695 ± 0.054
0.606 ± 0.0070.206 DF-5-B para-Fe2+
para-Fe3+10.39
89.611.253 ± 0.016
0.332 ± 0.0032.228 ± 0.032
0.677 ± 0.0060.116 DF-5-C para-Fe2+
para-Fe3+20.62
79.381.241 ± 0.030
0.336 ± 0.0052.218 ± 0.060
0.653 ± 0.0110.260 DF-6-A para-Fe2+
para-Fe3+12.86
87.141.264 ± 0.008
0.326 ±0.0032.259 ± 0.016
0.704 ± 0.0050.148 DF-6-B para-Fe2+
para-Fe3+10.28
89.721.291 ± 0.009
0.334 ± 0.0032.291 ± 0.018
0.690 ± 0.0050.115 MW-1-A para-Fe2+
para-Fe3+8.44
91.561.293 ± 0.022
0.348 ± 0.0042.282 ± 0.045
0.671 ± 0.0070.092 MW-3-A para-Fe2+
para-Fe3+0.00
100.00未检测到
0.356 ± 0.004未检测到
0.869 ± 0.0060.000 MW-4-A para-Fe2+
para-Fe3+9.17
90.831.055 ± 0.016
0.368 ± 0.0022.647 ± 0.033
0.642 ± 0.0030.101 MW-5-A para-Fe2+
para-Fe3+9.02
90.981.093 ± 0.038
0.350 ± 0.0032.792 ± 0.075
0.645 ± 0.0050.099
下载: 导出CSV
-
[1] Phang V X H, Chou L M, Friess D A. Ecosystem carbon stocks across a tropical intertidal habitat mosaic of mangrove forest, seagrass meadow, mudflat and sandbar[J]. Earth Surface Processes and Landforms, 2015, 40(10): 1387−1400. doi: 10.1002/esp.3745 [2] Donato D C, Kauffman J B, Murdiyarso D, et al. Mangroves among the most carbon-rich forests in the tropics[J]. Nature Geoscience, 2011, 4(5): 293−297. doi: 10.1038/ngeo1123 [3] Sandilyan S, Kathiresan K. Mangrove conservation: a global perspective[J]. Biodiversity and Conservation, 2012, 21(14): 3523−3542. doi: 10.1007/s10531-012-0388-x [4] Dicen G P, Navarrete I A, Rallos R V, et al. The role of reactive iron in long-term carbon sequestration in mangrove sediments[J]. Journal of Soils and Sediments, 2019, 19(1): 501−510. doi: 10.1007/s11368-018-2051-y [5] Alongi D M. Carbon cycling and storage in mangrove forests[J]. Annual Review of Marine Science, 2014, 6(1): 195−219. doi: 10.1146/annurev-marine-010213-135020 [6] McLeod E, Chmura G L, Bouillon S, et al. A blueprint for blue carbon: toward an improved understanding of the role of vegetated coastal habitats in sequestering CO2[J]. Frontiers in Ecology and the Environment, 2011, 9(10): 552−560. doi: 10.1890/110004 [7] Lalonde K, Mucci A, Ouellet A, et al. Preservation of organic matter in sediments promoted by iron[J]. Nature, 2012, 483(7388): 198−200. doi: 10.1038/nature10855 [8] Chen ChunmeiC, Hall S J, Coward E, et al. Iron-mediated organic matter decomposition in humid soils can counteract protection[J]. Nature Communications, 2020, 11(1): 2255. doi: 10.1038/s41467-020-16071-5 [9] Kida M, Fujitake N. Organic carbon stabilization mechanisms in mangrove soils: a review[J]. Forests, 2020, 11(9): 981. doi: 10.3390/f11090981 [10] Zhao B, Yao P, Bianchi T S, et al. The role of reactive iron in the preservation of terrestrial organic carbon in estuarine sediments[J]. Journal of Geophysical Research: Biogeosciences, 2018, 123(12): 3556−3569. doi: 10.1029/2018JG004649 [11] Shields M R, Bianchi T S, Gélinas Y, et al. Enhanced terrestrial carbon preservation promoted by reactive iron in deltaic sediments[J]. Geophysical Research Letters, 2016, 43(3): 1149−1157. doi: 10.1002/2015GL067388 [12] Zhao Bin, Yao Peng, Bianchi T S, et al. Preferential preservation of pre-aged terrestrial organic carbon by reactive iron in estuarine particles and coastal sediments of a large river-dominated estuary[J]. Geochimica et Cosmochimica Acta, 2023, 345: 34−49. doi: 10.1016/j.gca.2023.01.023 [13] Zhao Qian, Poulson S R, Obrist D, et al. Iron-bound organic carbon in forest soils: quantification and characterization[J]. Biogeosciences, 2016, 13(16): 4777−4788. doi: 10.5194/bg-13-4777-2016 [14] 但新球, 廖宝文, 吴照柏, 等. 中国红树林湿地资源、保护现状和主要威胁[J]. 生态环境学报, 2016, 25(7): 1237−1243Dan Xinqiu, Liao Baowen, Wu Zhaobai, et al. Resources, conservation status and main threats of mangrove wetlands in China[J]. Ecology and Environment Sciences, 2016, 25(7): 1237−1243 [15] Zhao Bo, Jia Yunlong, Wu Shengjie, et al. Preservation of soil organic carbon in coastal wetlands promoted by glomalin–iron–organic carbon ternary system[J]. Limnology and Oceanography, 2022, 67(S2): S180−S192. [16] Salvadó J A, Tesi T, Andersson A, et al. Organic carbon remobilized from thawing permafrost is resequestered by reactive iron on the Eurasian Arctic Shelf[J]. Geophysical Research Letters, 2015, 42(19): 8122−8130. doi: 10.1002/2015GL066058 [17] Jing Xia, Zhang Fenfen, Wu Ying. Iron speciation in sediment cores near the Jiulong Methane Reef and its implication[J]. Estuarine, Coastal and Shelf Science, 2019, 224: 253−259. doi: 10.1016/j.ecss.2019.04.015 [18] Hu Yu, Feng Dong, Chen Linying, et al. Using iron speciation in authigenic carbonates from hydrocarbon seeps to trace variable redox conditions[J]. Marine and Petroleum Geology, 2015, 67: 111−119. doi: 10.1016/j.marpetgeo.2015.05.001 [19] Wei Jine, Zhang Fenfen, He Tangrong, et al. Selective associations of organic matter components with ferrihydrite: implications for Fe-organic matter preservation in tidal flat wetlands[J]. Geoderma, 2023, 437: 116574. doi: 10.1016/j.geoderma.2023.116574 [20] De Junet A, Basile-Doelsch I, Borschneck D, et al. Characterisation of organic matter from organo-mineral complexes in an Andosol from Reunion Island[J]. Journal of Analytical and Applied Pyrolysis, 2013, 99: 92−100. doi: 10.1016/j.jaap.2012.10.020 [21] Singh S, D’Sa E J, Swenson E M. Chromophoric dissolved organic matter (CDOM) variability in Barataria Basin using excitation–emission matrix (EEM) fluorescence and parallel factor analysis (PARAFAC)[J]. Science of the Total Environment, 2010, 408(16): 3211−3222. doi: 10.1016/j.scitotenv.2010.03.044 [22] McKnight D M, Boyer E W, Westerhoff P K, et al. Spectrofluorometric characterization of dissolved organic matter for indication of precursor organic material and aromaticity[J]. Limnology and Oceanography, 2001, 46(1): 38−48. doi: 10.4319/lo.2001.46.1.0038 [23] Huguet A, Vacher L, Relexans S, et al. Properties of fluorescent dissolved organic matter in the Gironde Estuary[J]. Organic Geochemistry, 2009, 40(6): 706−719. doi: 10.1016/j.orggeochem.2009.03.002 [24] Stedmon C A, Bro R. Characterizing dissolved organic matter fluorescence with parallel factor analysis: a tutorial: fluorescence-PARAFAC analysis of DOM[J]. Limnology and Oceanography: Methods, 2008, 6(11): 572−579. doi: 10.4319/lom.2008.6.572 [25] Murphy K R, Stedmon C A, Wenig P, et al. OpenFluor– an online spectral library of auto-fluorescence by organic compounds in the environment[J]. AnalyticalAnal. Methods, 2014, 6(3): 658−661. doi: 10.1039/C3AY41935E [26] Zheng Guodong, Fu Bihong, Takahashi Y, et al. Chemical speciation of redox sensitive elements during hydrocarbon leaching in the Junggar Basin, Northwest China[J]. Journal of Asian Earth Sciences, 2010, 39(6): 713−723. doi: 10.1016/j.jseaes.2010.05.006 [27] Dyar M D, Agresti D G, Schaefer M W, et al. Mössbauer spectroscopy of earth and planetary materials[J]. Annual Review of Earth and Planetary Sciences, 2006, 34(1): 83−125. doi: 10.1146/annurev.earth.34.031405.125049 [28] Reeves J B. Mid-infrared spectral interpretation of soils: is it practical or accurate?[J]. Geoderma, 2012, 189-190: 508−513. doi: 10.1016/j.geoderma.2012.06.008 [29] Parikh S J, Goyne K W, Margenot A J, et al. Soil chemical insights provided through vibrational spectroscopy[GJ]//. Advances in Agronomy. Elsevier, 2014, 126: 1−148. [30] Zhuang Wan-E, Chen Wei, Yang Liyang. Effects of photodegradation on the optical indices of chromophoric dissolved organic matter from typical sources[J]. International Journal of Environmental Research and Public Health, 2022, 19(21): 14268. doi: 10.3390/ijerph192114268 [31] Søndergaard M, Stedmon C A, Borch N H. Fate of terrigenous dissolved organic matter (DOM) in estuaries: aggregation and bioavailability[J]. Ophelia, 2003, 57(3): 161−176. doi: 10.1080/00785236.2003.10409512 [32] Yao Yuan, Li Yunzhen, Guo Xujing, et al. Changes and characteristics of dissolved organic matter in a constructed wetland system using fluorescence spectroscopy[J]. Environmental Science and Pollution Research, 2016, 23(12): 12237−12245. doi: 10.1007/s11356-016-6435-5 [33] Catalá T S, Reche I, Fuentes-Lema A, et al. Turnover time of fluorescent dissolved organic matter in the dark global ocean[J]. Nature Communications, 2015, 6(1): 5986. doi: 10.1038/ncomms6986 [34] Yamashita Y, Scinto L J, Maie N, et al. Dissolved organic matter characteristics across a subtropical wetland’s landscape: application of optical properties in the assessment of environmental dynamics[J]. Ecosystems, 2010, 13(7): 1006−1019. doi: 10.1007/s10021-010-9370-1 [35] Wang Di, Zhu Maoxu, Yang Guipeng, et al. Reactive iron and iron-bound organic carbon in surface sediments of the river-dominated Bohai Sea (China) versus the Southern Yellow Sea[J]. Journal of Geophysical Research: Biogeosciences, 2019, 124(1): 79−98. doi: 10.1029/2018JG004722 [36] Ma Weiwei, Zhu Maoxu, Yang Guipeng, et al. Iron geochemistry and organic carbon preservation by iron (oxyhydr) oxides in surface sediments of the East China Sea and the South Yellow Sea[J]. Journal of Marine Systems, 2018, 178: 62−74. doi: 10.1016/j.jmarsys.2017.10.009 [37] Kaiser K, Guggenberger G. The role of DOM sorption to mineral surfaces in the preservation of organic matter in soils[J]. Organic Geochemistry, 2000, 31(7−8): 711−725. [38] Chen Chunmei, Kukkadapu R, Sparks D L. Influence of coprecipitated organic matter on Fe2+(aq)-catalyzed transformation of ferrihydrite: implications for carbon dynamics[J]. Environmental Science & Technology, 2015, 49(18): 10927−10936. [39] Sodano M, Lerda C, Nisticò R, et al. Dissolved organic carbon retention by coprecipitation during the oxidation of ferrous iron[J]. Geoderma, 2017, 307: 19−29. doi: 10.1016/j.geoderma.2017.07.022 [40] Li Chao, Yang Shouye, Lian Ergang, et al. Chemical speciation of iron in sediments from the Changjiang Estuary and East China Sea: iron cycle and paleoenvironmental implications[J]. Quaternary International, 2017, 452: 116−128. doi: 10.1016/j.quaint.2016.07.014 [41] Poulton S W, Raiswell R. Chemical and physical characteristics of iron oxides in riverine and glacial meltwater sediments[J]. Chemical Geology, 2005, 218(3−4): 203−221. [42] Faust J C, Tessin A, Fisher B J, et al. Millennial scale persistence of organic carbon bound to iron in Arctic marine sediments[J]. Nature Communications, 2021, 12(1): 275. doi: 10.1038/s41467-020-20550-0 [43] Longman J, Gernon T M, Palmer M R, et al. Tephra deposition and bonding with reactive oxides enhances burial of organic carbon in the Bering Sea[J]. Global Biogeochemical Cycles, 2021, 35(11): e2021GB007140. doi: 10.1029/2021GB007140 [44] Bai Jing, Luo Min, Yang Yang, et al. Iron-bound carbon increases along a freshwater−oligohaline gradient in a subtropical tidal wetland[J]. Soil Biology and Biochemistry, 2021, 154: 108128. doi: 10.1016/j.soilbio.2020.108128 [45] Wen Yuan, Zang Huadong, Ma Qingxu, et al. Is the ‘enzyme latch’ or ‘iron gate’ the key to protecting soil organic carbon in peatlands?[J]. Geoderma, 2019, 349: 107−113. doi: 10.1016/j.geoderma.2019.04.023 [46] Zhao Yunpeng, Xiang Wu, Ma Ming, et al. The role of laccase in stabilization of soil organic matter by iron in various plant-dominated peatlands: degradation or sequestration?[J]. Plant and Soil, 2019, 443: 575−590. [47] Duan Xun, Yu Xiaofei, Li Zhe, et al. Iron-bound organic carbon is conserved in the rhizosphere soil of freshwater wetlands[J]. Soil Biology and Biochemistry, 2020, 149: 107949. doi: 10.1016/j.soilbio.2020.107949 [48] Schwestermann T, Eglinton T I, Haghipour N, et al. Event-dominated transport, provenance, and burial of organic carbon in the Japan Trench[J]. Earth and Planetary Science Letters, 2021, 563: 116870. doi: 10.1016/j.jpgl.2021.116870 [49] Kristensen E, Bouillon S, Dittmar T, et al. Organic carbon dynamics in mangrove ecosystems: a review[J]. Aquatic Botany, 2008, 89(2): 201−219. doi: 10.1016/j.aquabot.2007.12.005 [50] Zhao Bin, Yao Peng, Bianchi T S, et al. The remineralization of sedimentary organic carbon in different sedimentary regimes of the Yellow and East China Seas[J]. Chemical Geology, 2018, 495: 104−117. doi: 10.1016/j.chemgeo.2018.08.012 [51] Sun Changhong, Zhu Maoxu, Ma Weiwei, et al. Examining bulk and iron-associated organic carbon through depth in margin sea sediments (China) under contrasting depositional settings: Chemical and NEXAFS spectral characterization[J]. Journal of Marine Systems, 2020, 207: 103344. doi: 10.1016/j.jmarsys.2020.103344 [52] 刘良叙, 李朝风, 王嘉伟, 等. 芳香类天然产物的合成生物学研究进展[J]. 生物工程学报, 2021, 37(6): 2010−2025.Liu Liangxu, Li Chaofeng, Wang Jiawei, et al. Synthetic biology for the synthesis of aromatic natural products: a review[J]. Chinese Journal of Biotechnology, 2021, 37(6): 2010−2025. [53] Adhikari D, Yang Yu. Selective stabilization of aliphatic organic carbon by iron oxide[J]. Scientific Reports, 2015, 5(1): 11214. doi: 10.1038/srep11214 [54] Chen Chunmei, Dynes J J, Wang Jian, et al. Properties of Fe-organic matter associations via coprecipitation versus adsorption[J]. Environmental Science & Technology, 2014, 48(23): 13751−13759. [55] Riedel T, Zak D, Biester H, et al. Iron traps terrestrially derived dissolved organic matter at redox interfaces[J]. Proceedings of the National Academy of Sciences of the United States of America, 2013, 110(25): 10101−10105. [56] Riedel T, Biester H, Dittmar T. Molecular fractionation of dissolved organic matter with metal salts[J]. Environmental Science & Technology, 2012, 46(8): 4419−4426. [57] Yamashita Y, Tanoue E. Chemical characterization of protein-like fluorophores in DOM in relation to aromatic amino acids[J]. Marine Chemistry, 2003, 82(3−4): 255−271. -

计量
- 文章访问数: 784
- HTML全文浏览量: 401
- PDF下载量: 81
- 被引次数: 0
