

Real-time internal structure construction of mesoscale eddy based on gradient-dependent Optimal Interpolation method in the Kuroshio-Oyashio confluence region
-
摘要: 伴随涡旋演变运动的内部水体结构的实时变化,一直是深入研究中尺度涡生态效应的重要影响因素之一。本文以黑潮−亲潮交汇区的3个涡旋为例,基于卫星高度计与Argo剖面资料,利用梯度依赖最优插值方法进行了涡旋实时内部结构的构建试验,并通过与卫星观测、现场调查,以及数值模拟等数据的对比验证,系统评估了该方法在构建涡旋实时结构的可靠性和有效性。结果表明,基于构建结果计算的3个涡旋表层地转流的速度量级与卫星观测的速度量级相一致;基于构建结果计算的地转流与ADCP(Acoustic Doppler Current Profiler, ADCP)实测数据相比,发现涡心位置与ADCP观测的速度转向位置一致;构建结果等密度线的起伏形状和振幅均与对应的XCTD(Expendable Conductivity-Temperature-Depth, XCTD)现场观测相吻合;此外,数值模式数据与构建得到的涡心和涡旋平均半径基本一致。故,梯度依赖最优插值方法是一种很有希望表示涡演化过程中实时内部特征的技术。Abstract: The real-time changes of the internal water structure accompanied by the evolution of eddies have always been one of the important influencing factors to further study the ecological effects of mesoscale eddies. In this paper, three eddies in the Kuroshio-Oyashio confluence region are taken as examples. Based on satellite altimeter and Argo profile data, the gradient-dependent optimal interpolation method is used to construct the real-time internal structures of eddies. The reliability and effectiveness of this method in constructing the real-time structures of eddies are systematically evaluated through comparison with satellite observation, in-situ data and numerical simulation data. The results show that the orders of magnitude for the reconstructed surface geostrophic current of three eddies are consistent with satellite altimetry. Compared with the in-situ data of the ADCP (Acoustic Doppler Current Profiler, ADCP), it is found that the locations of the eddy centers are coincident with the velocity turning position of the ADCP observed sections. The fluctuation shapes and amplitudes of the isodensity lines of the three eddies are consistent with the XCTD (Expendable Conductivity-Temperature-Depth, XCTD) observations. In addition, the eddy center and mean radius of the numerical output are basically consistent with the constructed ones. Therefore, the gradient-dependent OI was a hopeful technique for representing the real-time internal features during eddy evolution.
-
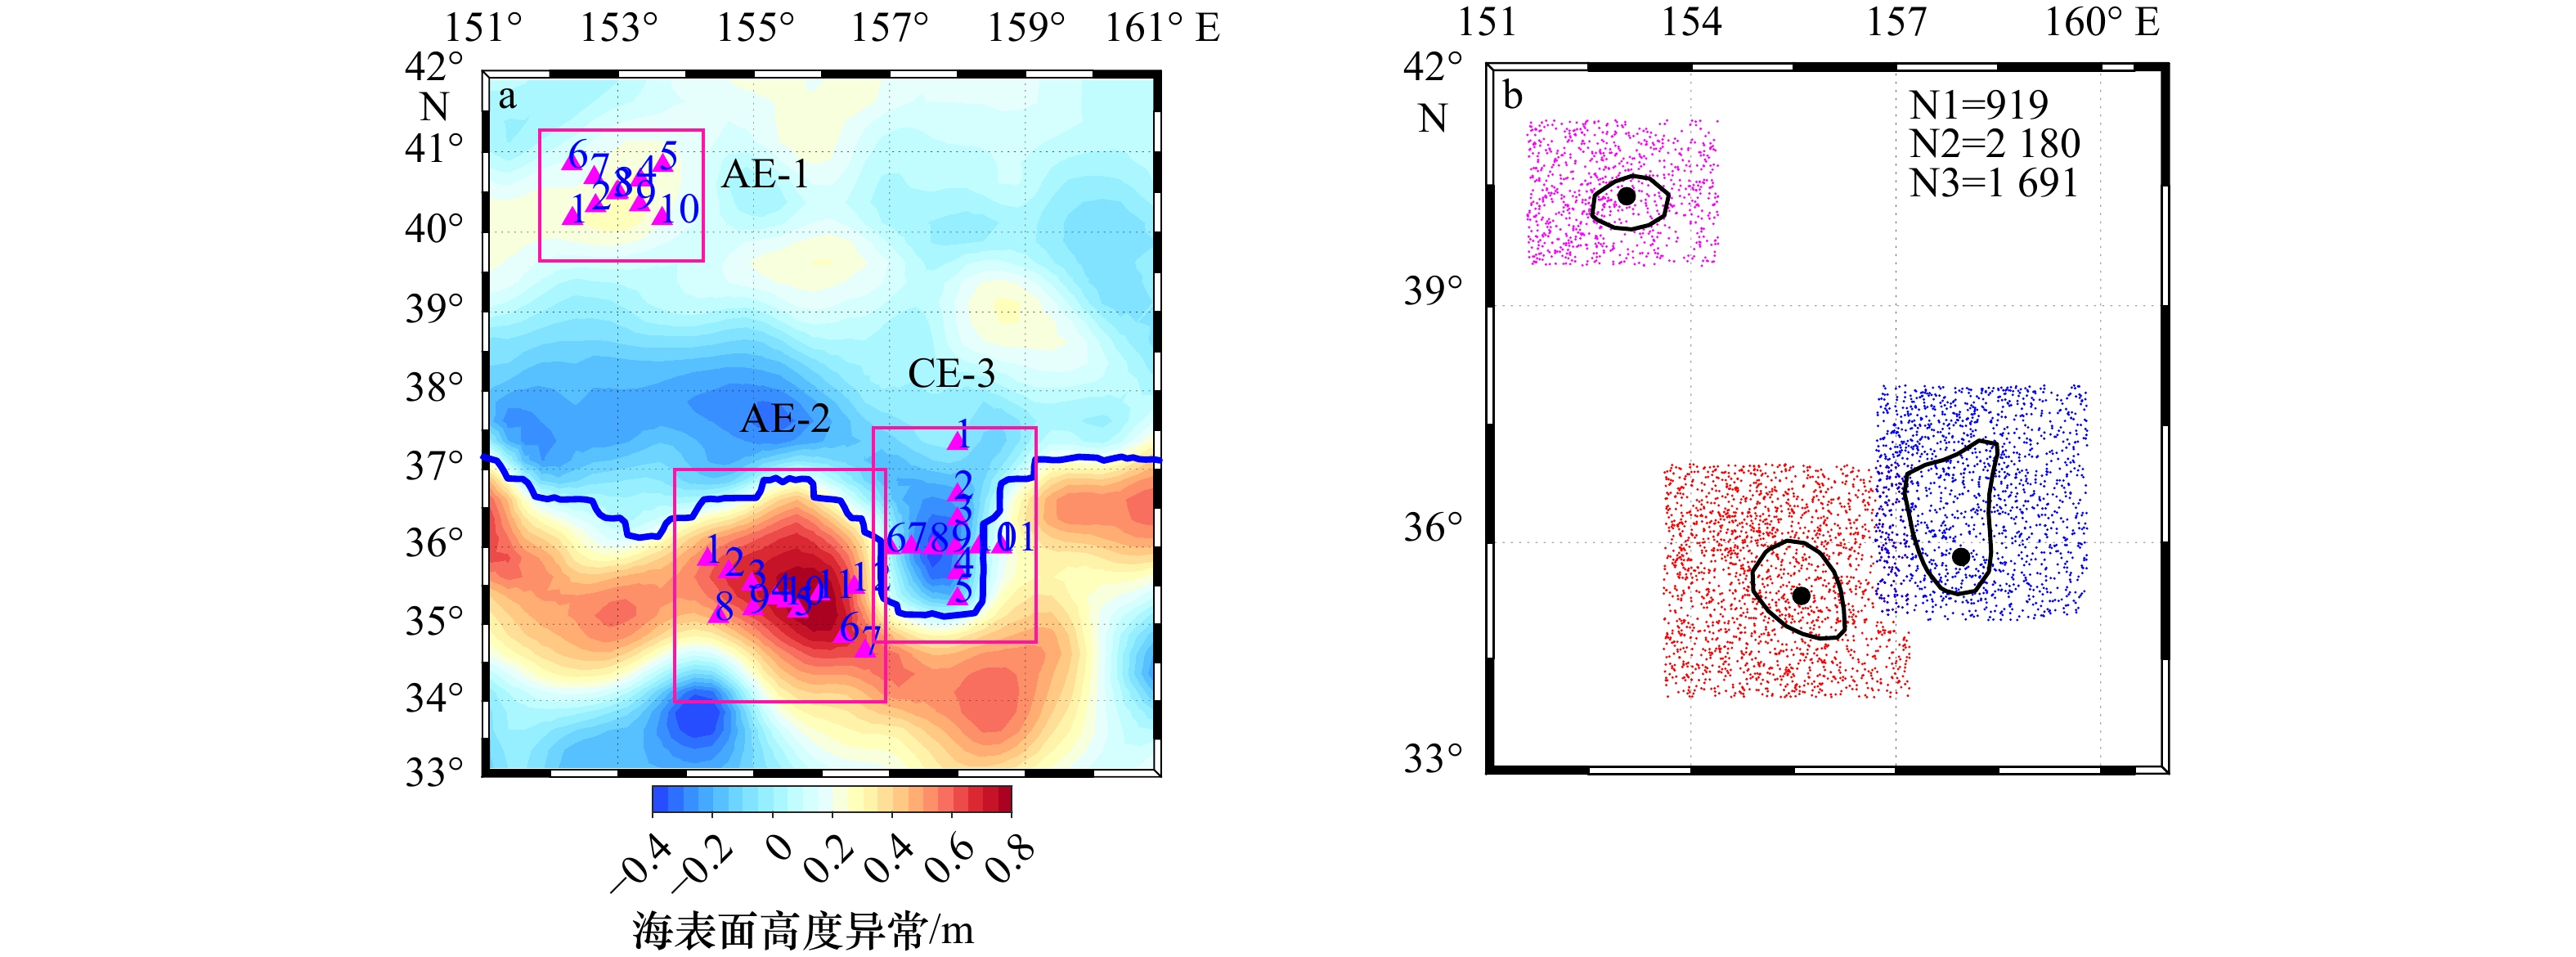
图 1 2022年6月21日海表面高度异常(a)与合成区域内的Argo剖面分布(b)
紫色矩形为选取的3个涡旋个例;紫色三角形为在AE-1、AE-2、CE-3涡旋内的XCTD观测站点;蓝色曲线为黑潮流轴;紫色(919个)、红色(
2180 个)以及蓝色(1691 个)圆点分别表示3个合成区域内用于构建复合结构的Argo剖面;黑色圆点为2022年6月21日3个涡旋个例的涡心位置;黑色曲线为涡旋边界Fig. 1 Sea level anomaly on June 21, 2022 (a) and locations of Argo profiles in composite regions (b)
The purple rectangles are three eddy cases; the purple triangles are the XCTD observations in the AE-1, AE-2 and CE-3 eddies; the blue curve is Kuroshio; the purple (919 profiles in AE-1), red (
2180 profiles in AE-2), and blue (1691 profiles in AE-3) dots are the Argo profiles for constructing compositestructures; the black dots are eddy centers of the three eddy cases on June 21, 2022; the black curve is the eddy edge
图 3 涡旋背景结构与实时结构对比
a1−a3. 三个涡旋区复合位势密度异常断面;b1−d1. 反气旋涡1第7天、第17天和第28天的实时密度异常断面;b2−d2. 反气旋涡2第15天、第24天和第34天的实时密度异常断面;b3−d3. 气旋涡3第9天、第16天和第22天的实时密度异常断面;黄色虚线为涡心位置
Fig. 3 Comparison between background structure and real-time structure of eddy
a1−a3. Composite potential density anomaly sections of three eddy regions; b1−d1. the real-time potential density anomaly on days 7, 17 and 28 of AE-1; b2−d2. the real-time potential density anomaly on days 15, 24 and 34 of AE-2; b3−d3. the real-time potential density anomaly on days 9, 16 and 22 of CE-3; the yellow dot lines are the locations of the eddy centers

图 4 3个涡旋生命周期内由构建结果(上)与卫星观测数据(下)计算的地转流断面
黄色虚线为涡心位置;速度的正方向指垂直平面向里,速度的负方向指垂直平面向外
Fig. 4 Geostrophic cross section calculated from constructed results (upper) and satellite observation data (lower)during the lifetime of three eddies
The yellow dot lines are the locations of the eddy centers. The positive direction of velocities refers to the inward perpendicular to the plane (paper surface). Conversely, the negative direction is the outward perpendicular to the plane

图 5 由构建结果计算的地转流断面(上)与ADCP观测流速(下)对比
黄色虚线为涡心位置;速度的正方向指垂直平面向里,速度的负方向指垂直平面向外
Fig. 5 Comparison of geostrophic current section (upper) calculated from the constructed resultswith the observed velocity of ADCP (lower)
The yellow dot lines are the locations of the eddy centers. The positive direction of velocities refers to the inward perpendicular to the plane (paper surface). Conversely, the negative direction is the outward perpendicular to the plane

图 6 3个涡旋构建密度断面(上)与同期实测密度断面(下)的比较
图a1中白线表示AE-1反演位势密度场中26.31 kg/m3、26.37 kg/m3等密度线;图a2中白线表示AE-2反演位势密度场中25.28 kg/m3、25.4 kg/m3、26.45 kg/m3等密度线;图a3中白线表示CE-3反演位势密度场中26.06 kg/m3、26.45 kg/m3、26.9 kg/m3等密度线;黑线是在相应位置由XCTD观测到的对应等密度线;黄色虚线为涡心位置
Fig. 6 Density section comparison between constructed results (upper) and XCTD observation (lower) of three eddies
The white lines are isodensity lines of 26.31 kg/m3 and 26.37 kg/m3 in AE-1, 25.28 kg/m3, 25.4 kg/m3 and 26.45 kg/m3 in AE-2, and 26.06 kg/m3, 26.45 kg/m3 and 26.9 kg/m3 in CE-3, obtained by reconstruction; the black lines are the isodensity lines at the corresponding locations observed by XCTD; the yellow dot lines are the locations of the eddy centers

图 7 AE-1实时密度异常结构
白色箭头为由模式数据得到的次表层流,黑色虚线为由次表层流计算的涡旋半径,黑色圆点为构建结果的涡心位置,白色三角形为由次表层流计算的涡心位置
Fig. 7 Real-time density anomaly structure of AE-1
The white arrow is the subsurface current from numerical output. The black dotted line is the eddy radius calculated from subsurface current. The black dots are the eddy centers obtained from constructed results. The white triangles are the eddy centers calculated from subsurface current
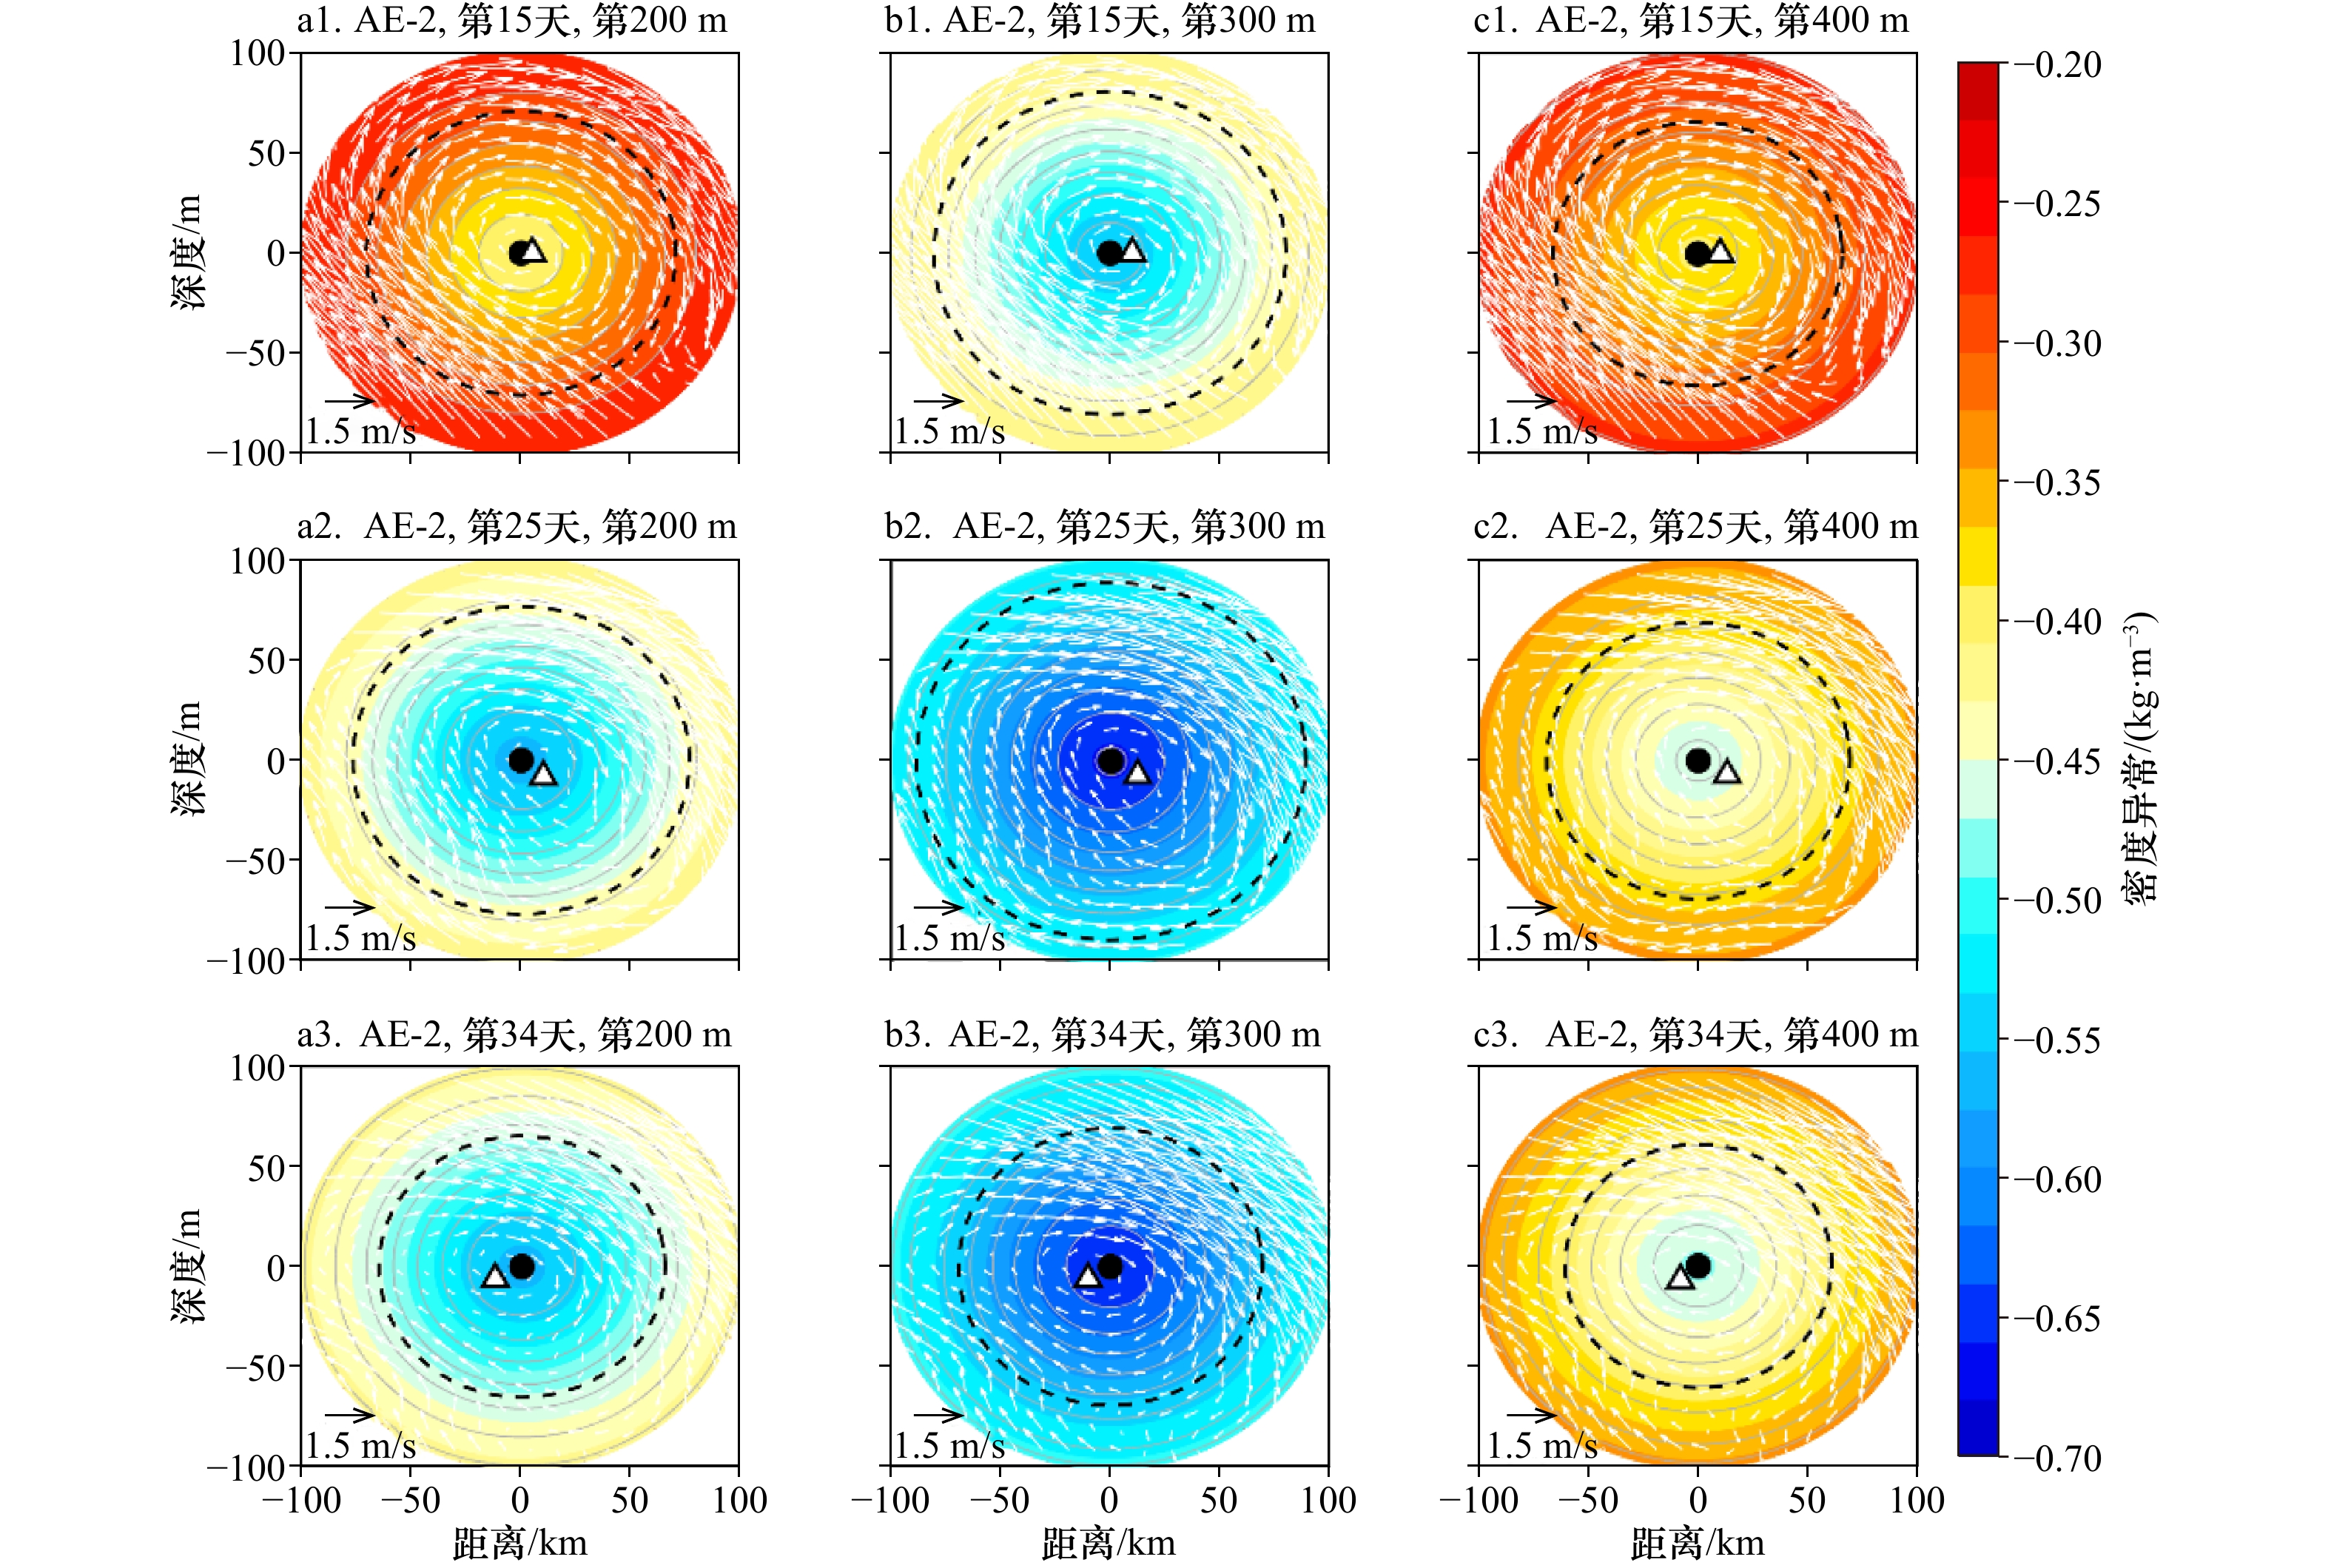
图 8 AE-2实时密度异常结构
白色箭头为由模式数据得到的次表层流,黑色虚线为由次表层流计算的涡旋半径,黑色圆点为构建结果的涡心位置,白色三角形为由次表层流计算的涡心位置
Fig. 8 Real-time density anomaly structure of AE-2
The white arrow is the subsurface current from numerical output. The black dotted line is the eddy radius calculated from subsurface current. The black dots are the eddy centers obtained from constructed results. The white triangles are the eddy centers calculated from subsurface current

图 9 CE-3实时密度异常结构
白色箭头为由模式数据得到的次表层流,黑色虚线为由次表层流计算的涡旋半径,黑色圆点为构建结果的涡心位置,白色三角形为由次表层流计算的涡心位置
Fig. 9 Real-time density anomaly structure of CE-3
The white arrow is the subsurface current from numerical output. The black dotted line is the eddy radius calculated from subsurface current. The black dots are the eddy centers obtained from constructed results. The white triangles are the eddy centers calculated from subsurface current
-
[1] Siegel D A, Peterson P, McGillicuddy D J, et al. Bio-optical footprints created by mesoscale eddies in the Sargasso Sea[J]. Geophysical Research Letters, 2011, 38(13): L13608. [2] Chen Gengxin, Hou Yijun, Chu Xiaoqing. Mesoscale eddies in the South China Sea: mean properties, spatiotemporal variability, and impact on thermohaline structure[J]. Journal of Geophysical Research: Oceans, 2011, 116(C6): C06018. [3] Chen Gengxin, Hou Yijun, Zhang Qilong, et al. The eddy pair off eastern Vietnam: interannual variability and impact on thermohaline structure[J]. Continental Shelf Research, 2010, 30(7): 715−723. doi: 10.1016/j.csr.2009.11.013 [4] 何忠杰. 西北太平洋副热带逆流区及其邻近海域中尺度涡研究[D]. 青岛: 中国海洋大学, 2007.He Zhongjie. Study of mesoscale eddies in the subtropical ocean of the Northwest-Pacific and adjacent area[D]. Qingdao: Ocean University of China, 2007. [5] Yang Guang, Wang Fan, Li Yuanlong, et al. Mesoscale eddies in the northwestern subtropical Pacific Ocean: statistical characteristics and three‐dimensional structures[J]. Journal of Geophysical Research: Oceans, 2013, 118(4): 1906−1925. doi: 10.1002/jgrc.20164 [6] Bibby T S, Moore C M. Silicate: nitrate ratios of upwelled waters control the phytoplankton community sustained by mesoscale eddies in sub-tropical North Atlantic and Pacific[J]. Biogeosciences, 2011, 8(3): 657−666. doi: 10.5194/bg-8-657-2011 [7] Chelton D B, Schlax M G, Samelson R M. Global observations of nonlinear mesoscale eddies[J]. Progress in Oceanography, 2011, 91(2): 167−216. doi: 10.1016/j.pocean.2011.01.002 [8] Chaigneau A, Le Texier M, Eldin G, et al. Vertical structure of mesoscale eddies in the eastern South Pacific Ocean: a composite analysis from altimetry and Argo profiling floats[J]. Journal of Geophysical Research: Oceans, 2011, 116(C11): C11025. [9] 胡冬, 陈希, 毛科峰, 等. 南印度洋中尺度涡统计特征及三维合成结构研究[J]. 海洋学报, 2017, 39(9): 1−14. doi: 10.3969/j.issn.0253-4193.2017.09.001Hu Dong, Chen Xi, Mao Kefeng, et al. Statistical characteristics and composed three dimensional structures of mesoscale eddies in the South Indian Ocean[J]. Haiyang Xuebao, 2017, 39(9): 1−14. doi: 10.3969/j.issn.0253-4193.2017.09.001 [10] 谢旭丹, 王静, 储小青, 等. 南海中尺度涡温盐异常三维结构[J]. 海洋学报, 2018, 40(4): 1−14. doi: 10.3969/j.issn.0253-4193.2018.04.001Xie Xudan, Wang Jing, Chu Xiaoqing, et al. Three-dimensional thermohaline anomaly structures of mesoscale eddies in the South China Sea[J]. Haiyang Xuebao, 2018, 40(4): 1−14. doi: 10.3969/j.issn.0253-4193.2018.04.001 [11] 张正光. 中尺度涡[D]. 青岛: 中国海洋大学, 2014.Zhang Zhengguang. Mesoscale eddy[D]. Qingdao: Ocean University of China, 2014. [12] Lin Xiayan, Dong Changming, Chen Dake, et al. Three-dimensional properties of mesoscale eddies in the South China Sea based on eddy-resolving model output[J]. Deep Sea Research Part I: Oceanographic Research Papers, 2015, 99: 46−64. doi: 10.1016/j.dsr.2015.01.007 [13] Sun Wenjin, Dong Changming, Wang Ruyun, et al. Vertical structure anomalies of oceanic eddies in the Kuroshio Extension region[J]. Journal of Geophysical Research: Oceans, 2017, 122(2): 1476−1496. doi: 10.1002/2016JC012226 [14] Zhang Chunling, Xu Jianping, Bao Xianwen, et al. An effective method for improving the accuracy of Argo objective analysis[J]. Acta Oceanologica Sinica, 2013, 32(7): 66−77. doi: 10.1007/s13131-013-0333-1 [15] Cressman G P. An operational objective analysis system[J]. Monthly Weather Review, 1959, 87(10): 367−374. doi: 10.1175/1520-0493(1959)087<0367:AOOAS>2.0.CO;2 [16] Evensen G. Sequential data assimilation with a nonlinear quasi‐geostrophic model using Monte Carlo methods to forecast error statistics[J]. Journal of Geophysical Research: Oceans, 1994, 99(C5): 10143−10162. doi: 10.1029/94JC00572 [17] Evensen G. The Ensemble Kalman Filter: theoretical formulation and practical implementation[J]. Ocean Dynamics, 2003, 53(4): 343−367. doi: 10.1007/s10236-003-0036-9 [18] Zhang Chunling, Wang Zhenfeng, Liu Yu. An argo-based experiment providing near-real-time subsurface oceanic environmental information for fishery data[J]. Fisheries Oceanography, 2021, 30(1): 85−98. doi: 10.1111/fog.12504 [19] Nencioli F, Dong Changming, Dickey T, et al. A vector geometry-based eddy detection algorithm and its application to a high-resolution numerical model product and high-frequency radar surface velocities in the southern California bight[J]. Journal of Atmospheric and Oceanic Technology, 2010, 27(3): 564−579. doi: 10.1175/2009JTECHO725.1 [20] Hosoda S, Ohira T, Nakamura T. A monthly mean dataset of global oceanic temperature and salinity derived from Argo float observations[J]. JAMSTEC Report of Research and Development, 2008, 8: 47−59. doi: 10.5918/jamstecr.8.47 [21] Li Z Q, Liu Zenghong, Lu S L. Global Argo data fast receiving and post-quality-control system[J]. IOP Conference Series: Earth and Environmental Science, 2020, 502(1): 012012. doi: 10.1088/1755-1315/502/1/012012 [22] Akima H. A new method of interpolation and smooth curve fitting based on local procedures[J]. Journal of the ACM, 1970, 17(4): 589−602. doi: 10.1145/321607.321609 [23] Zhang Chunling, Wang Danyang, Liu Zenghong, et al. Global gridded Argo dataset based on gradient-dependent optimal interpolation[J]. Journal of Marine Science and Engineering, 2022, 10(5): 650. doi: 10.3390/jmse10050650 [24] Kalnay E. Atmospheric Modeling, Data Assimilation and Predictability[M]. Cambridge: Cambridge University Press, 2003. [25] Li Hong, Xu Fanghua, Wang Guihua, et al. A multi-layer linear rossby wave dispersion relation for vertical tilt of mesoscale eddies[J]. Journal of Geophysical Research: Oceans, 2022, 127(12): e2022JC018703. doi: 10.1029/2022JC018703 [26] Pond S, Pickard G L. Introductory Dynamical Oceanography[M]. 2nd ed. Oxford: Butterworth-Heinemann, 1983. [27] Martin M, Dash P, Ignatov A, et al. Group for High Resolution Sea Surface temperature (GHRSST) analysis fields inter-comparisons. Part 1: a GHRSST multi-product ensemble (GMPE)[J]. Deep Sea Research Part II: Topical Studies in Oceanography, 2012, 77−80: 21−30. doi: 10.1016/j.dsr2.2012.04.013 -

 下载:
下载:
计量
- 文章访问数: 387
- HTML全文浏览量: 215
- PDF下载量: 35
- 被引次数: 0
