

Study on pore structure characteristics of sea ice based on CT observation
-
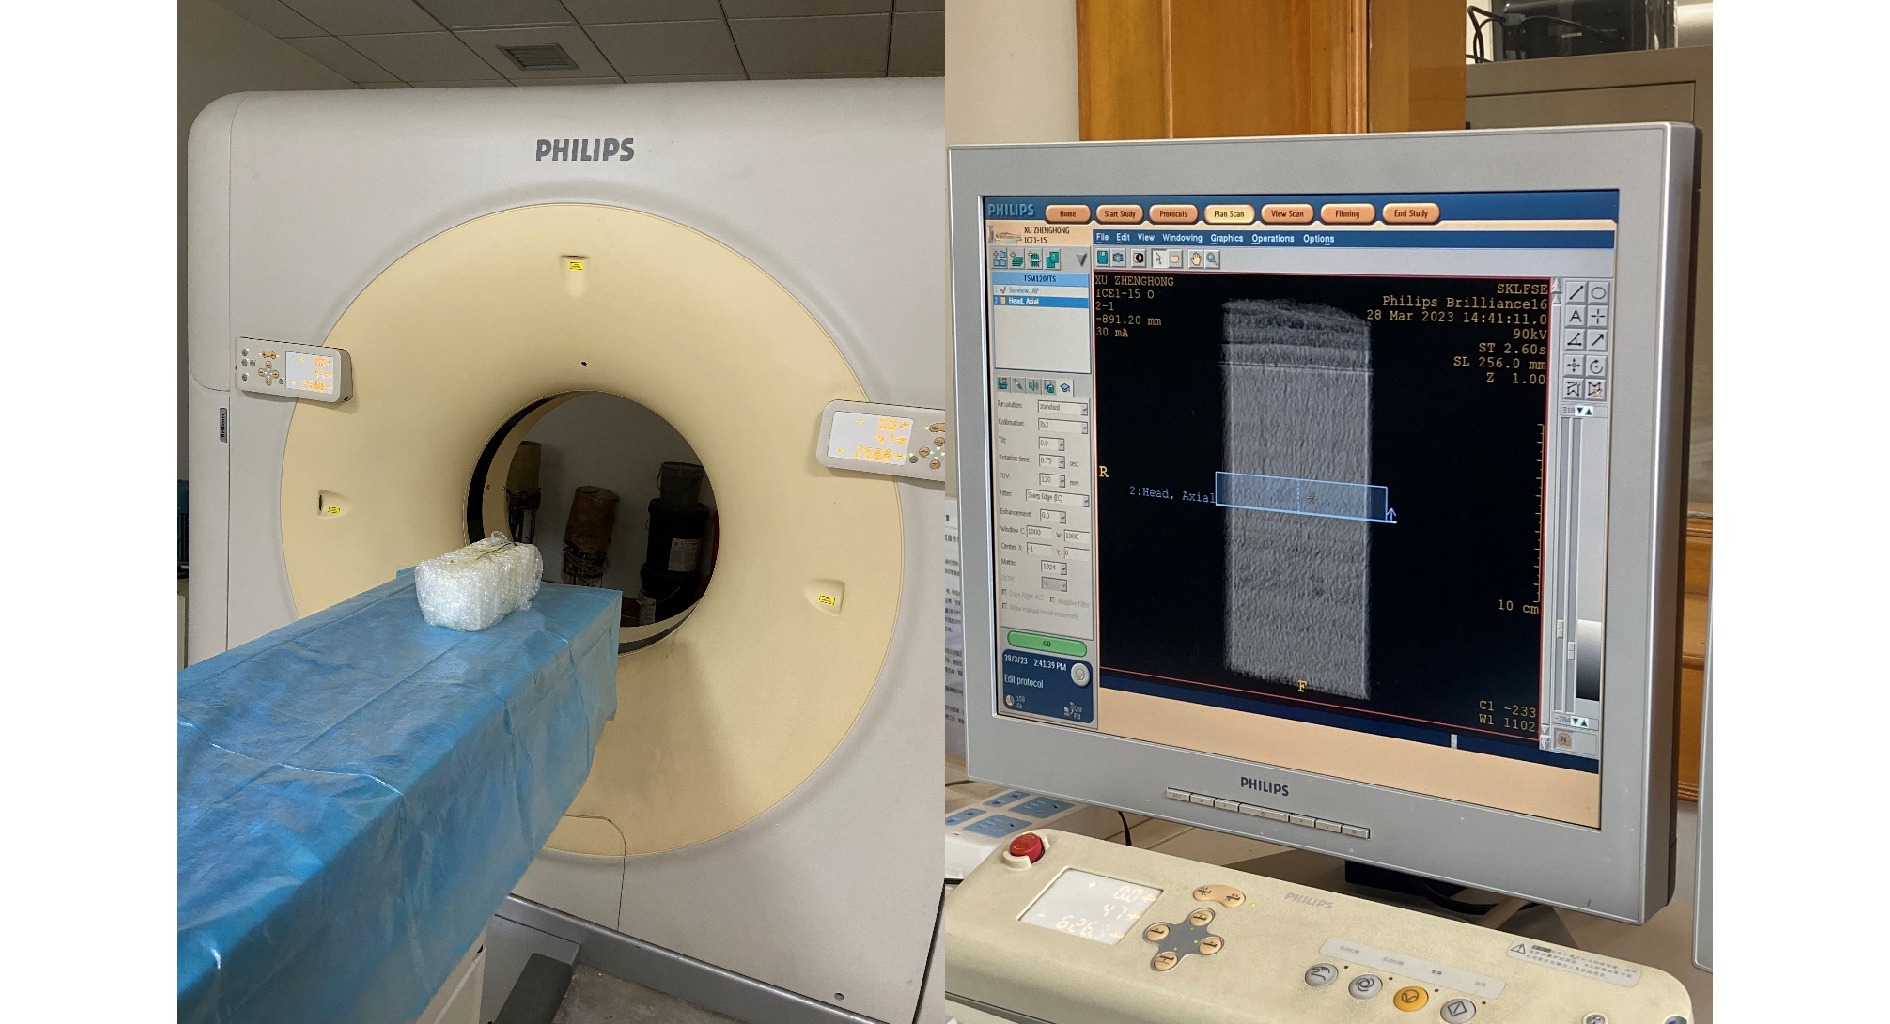
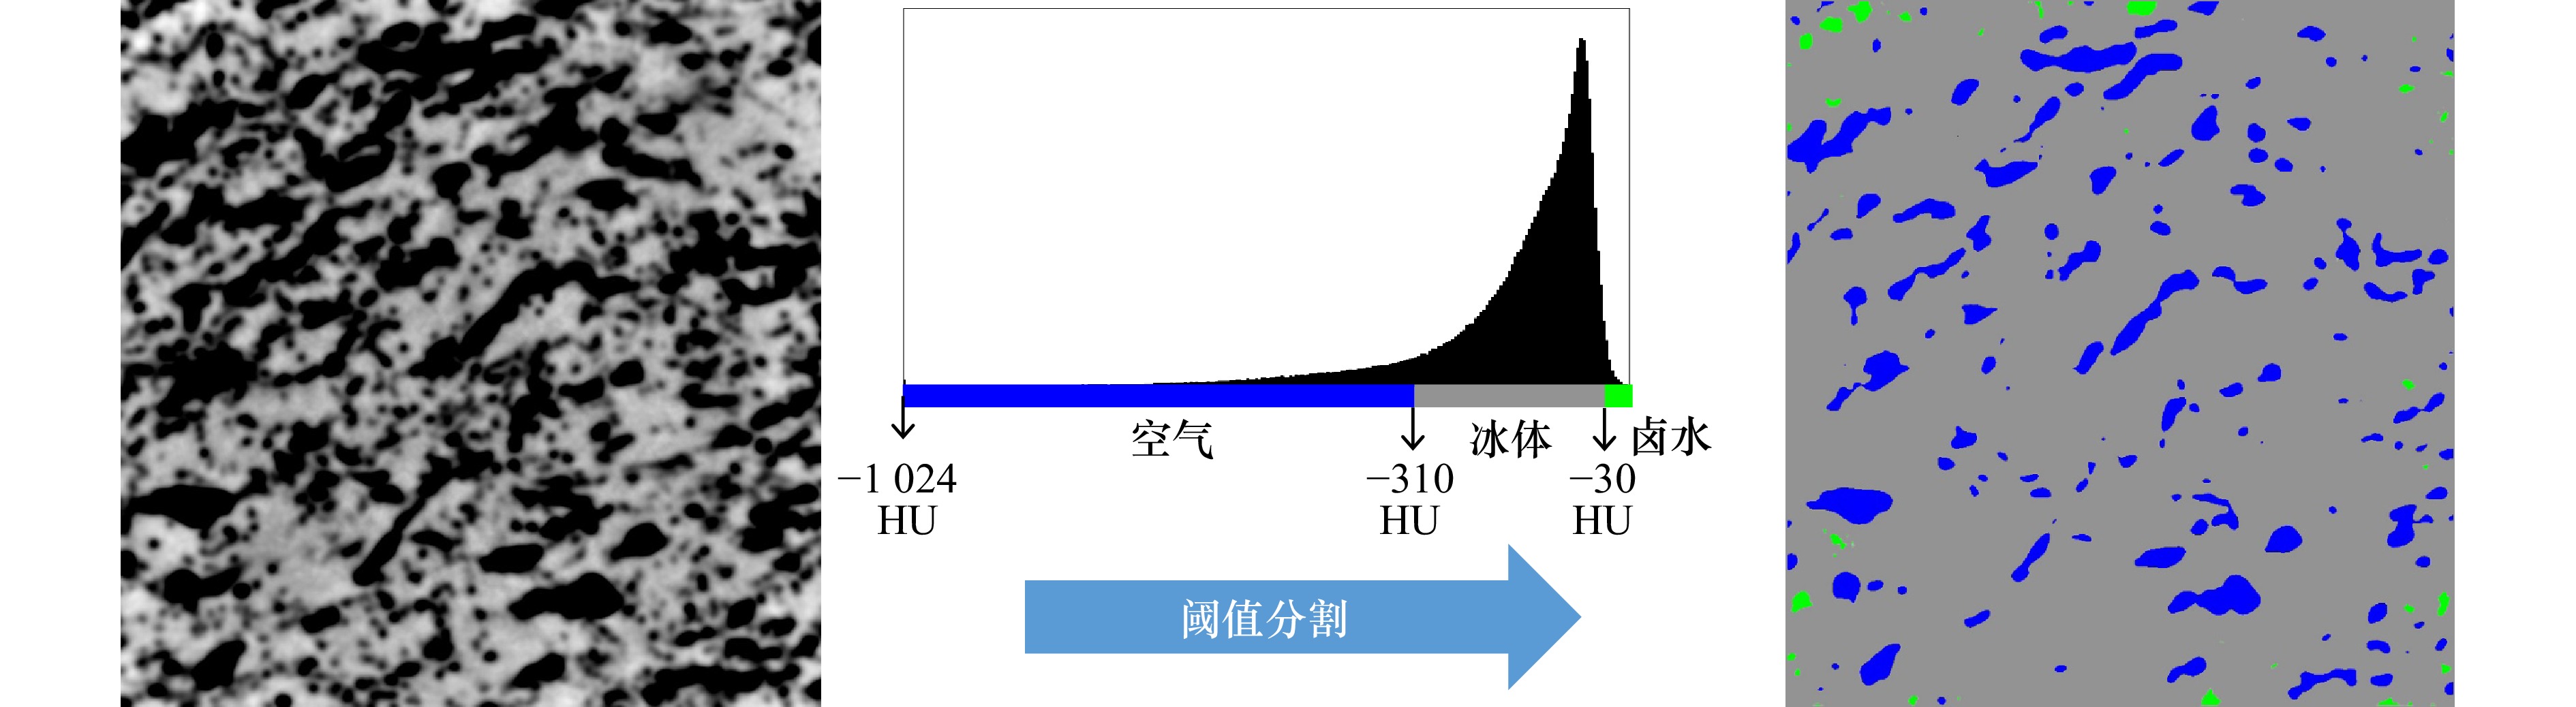
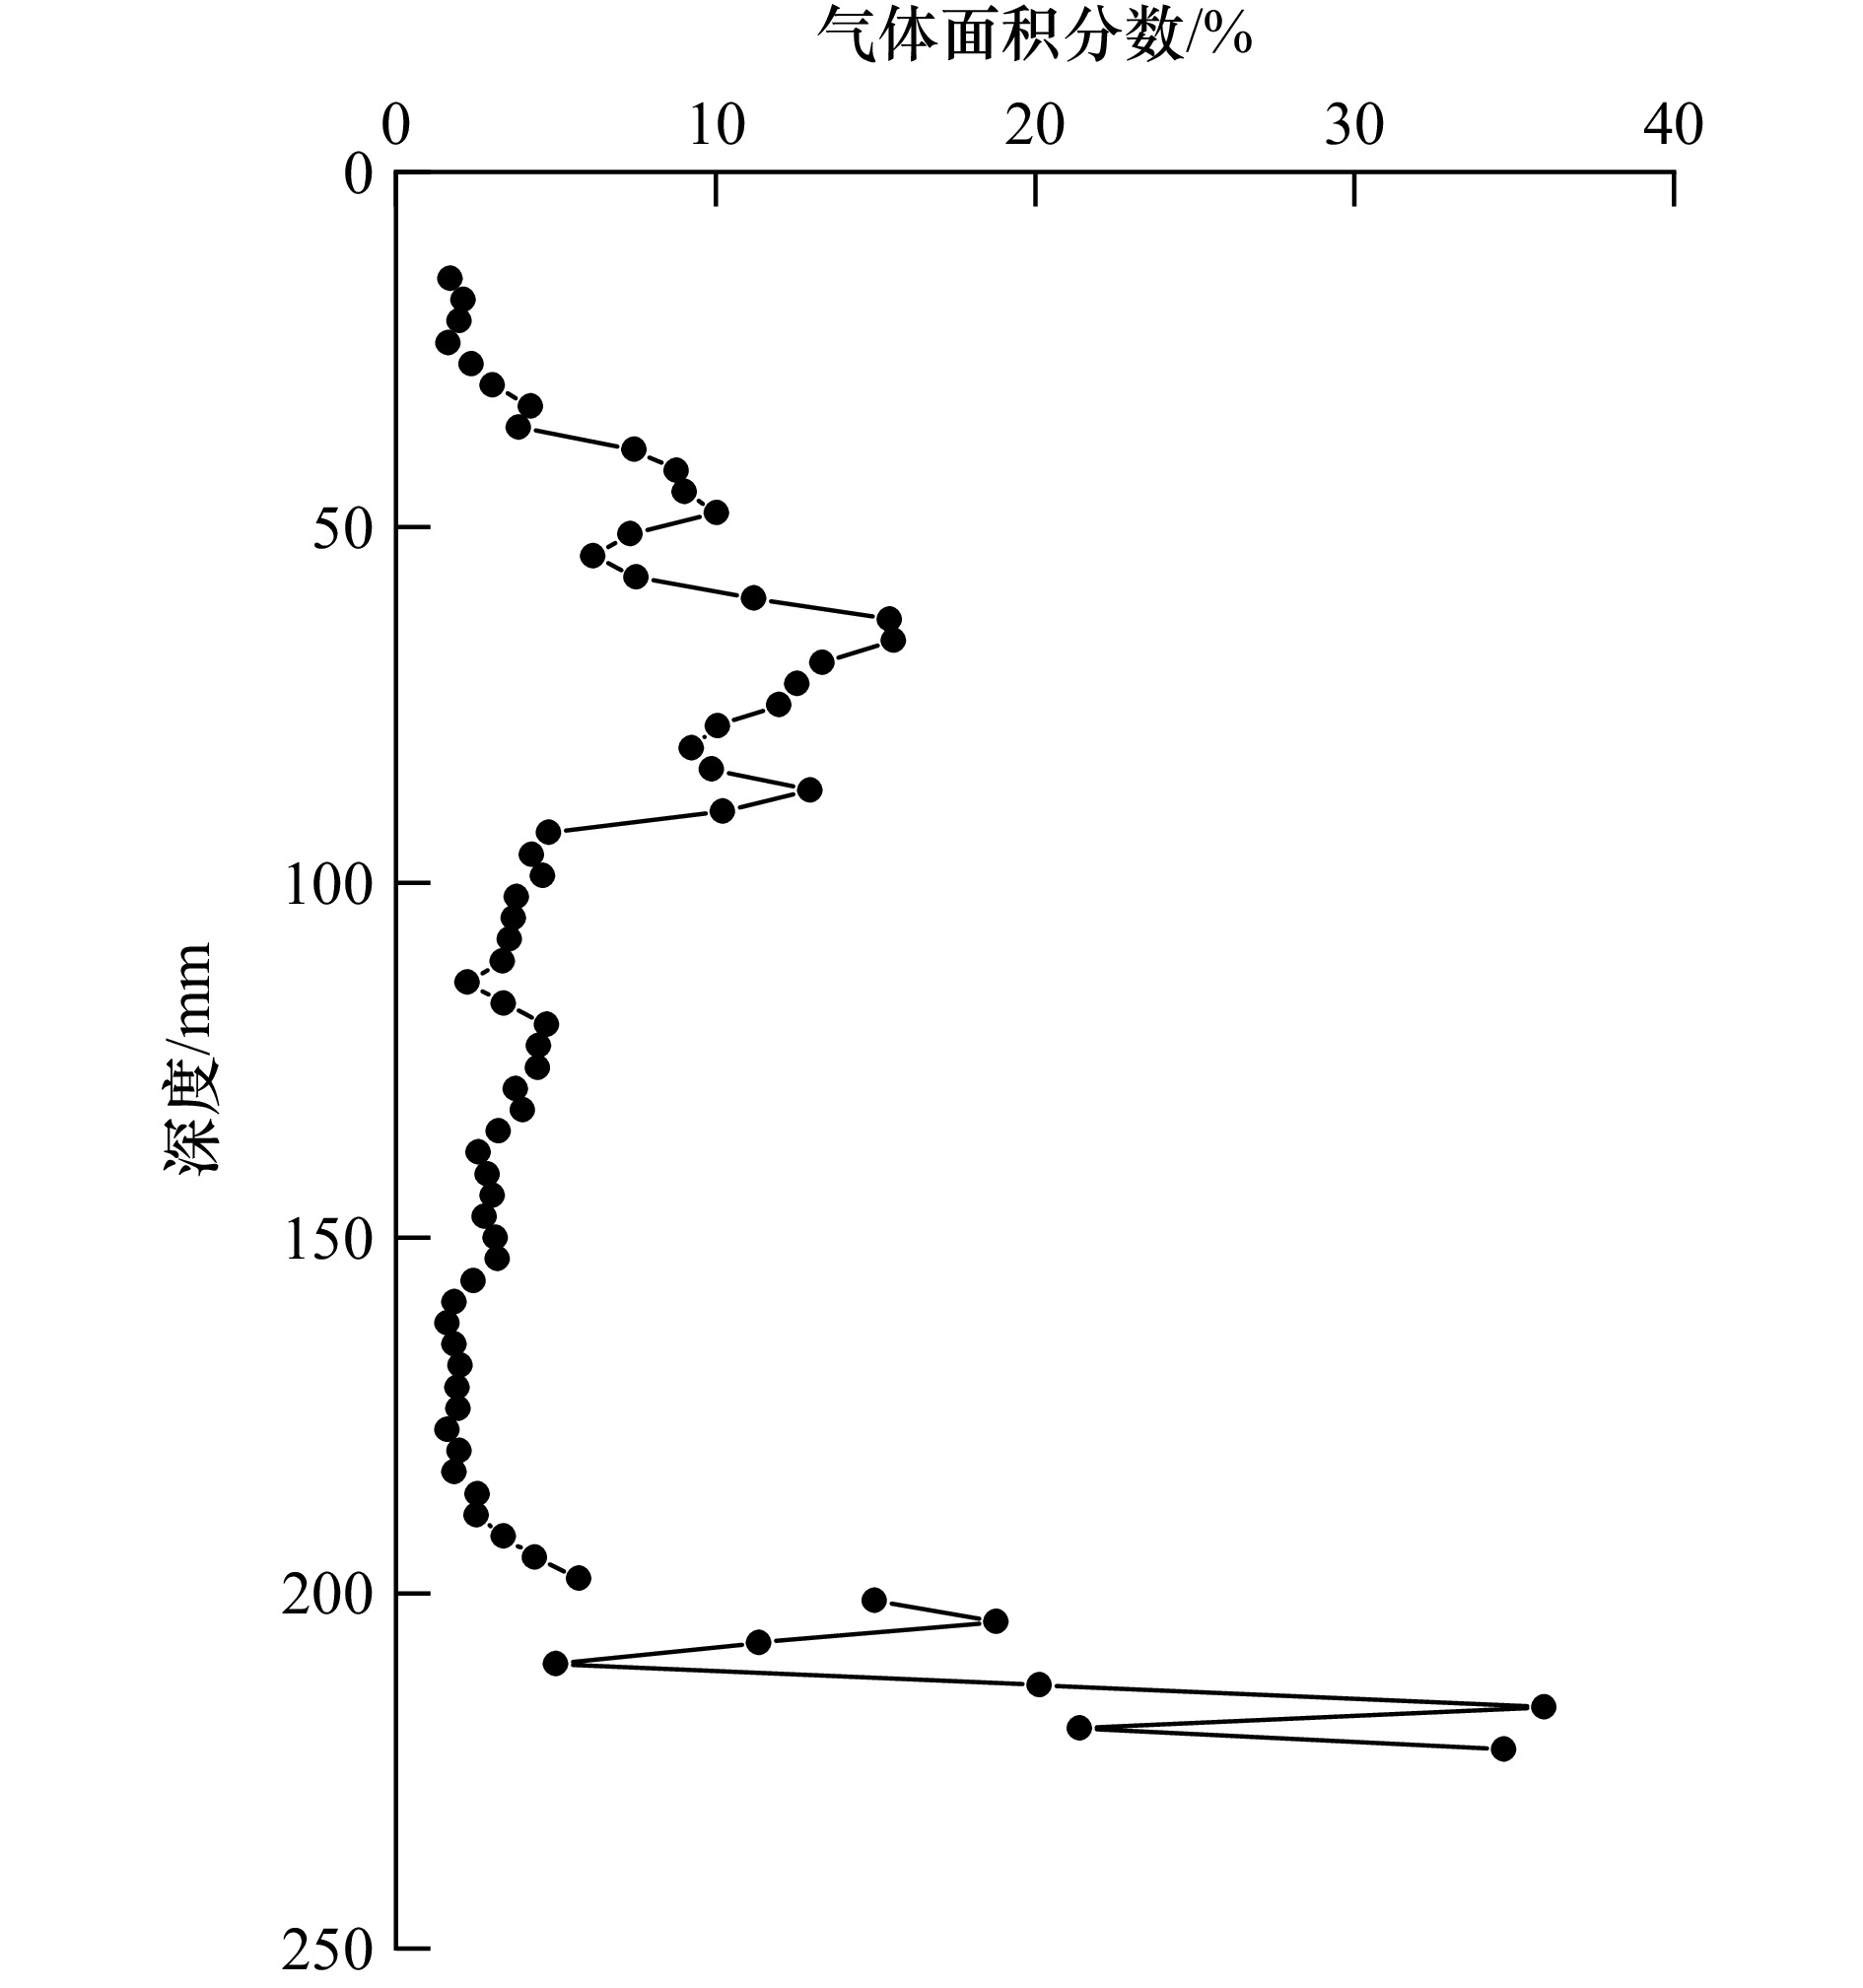
摘要: 孔隙结构是影响海冰力学性质的重要细观物理特征。为探究融化海冰的细观结构,在渤海盛冰期采集平整冰,并置于低温恒温环境(−1.0℃)内恒温48 h,进行CT扫描观测。确定气体−冰体−卤水的CT值阈值为−310 HU和−30 HU,对冰样CT图像进行三值化分割,识别气体和卤水孔隙,分析孔隙的二维形态特征;在此基础上进行冰样孔隙的三维重构,分析孔隙的三维形态特征。观测发现沿冰厚方向,冰样扫描断面气体面积分数为5.00%~35.93%,卤水分布不连续,面积分数最大为0.06%。气体和卤水孔隙平行冰面方向的截面形状近似圆形,圆度大于0.60。扫描断面内气体孔隙等效圆直径为1.1~3.2 mm,卤水孔隙等效圆直径为0.2~2.0 mm,且发现孔隙等效圆直径与面积分数呈正相关,与圆度呈负相关。三维结构上,根据孔隙球度(Rsph)将气体孔隙分为4种典型形态:冠状孔隙(Rsph ≤ 0.25)、不规则孔隙(0.25 < Rsph ≤ 0.45)、条状孔隙(0.45 < Rsph ≤ 0.60)和球形孔隙(0.60 < Rsph ≤ 1.00)。其中,冠状孔隙单体体积最大[平均体积(
11522.8 ±5610.2 )mm3]且数量最少,球形孔隙尺寸最小[平均直径(2.0 ± 1.1)mm]且数量最多。卤水孔隙分为卤水通道(0.45 < Rsph ≤ 0.60)和卤水胞(0.60 < Rsph ≤ 1.00)。卤水通道平均长度(17.1 ± 12.1)mm,卤水胞平均直径(1.5 ± 0.9)mm;卤水通道数量较少,但体积占比与卤水胞相当。Abstract: Pore structure is an important mesoscopic feature of sea ice affecting its mechanical properties. In order to investigate the mesoscopic structure of melting sea ice, a sea ice block was collected during severe ice period in the Bohai Sea. The ice block was put in a low temperature environment (−1.0℃) for 48 h, which was then observed using a CT scanner. The thresholds of CT values between air, ice and brine were set to −310 HU and −30 HU for segmentation of the CT image, respectively. The air and brine pores were able to be identified in the CT image, and the two-dimensional morphological characteristics of the pores in ice were analyzed. On the basis of image segmentation, the three-dimensional reconstruction of the ice pores was carried out, and the three-dimensional morphological characteristics of the pores were analyzed. It was found that along the ice thickness, the air area fraction was 5.00%~35.93%, and the brine distribution was discontinuous with maximum area fraction of 0.06%. The cross-sectional shape of the air and brine pores parallel to the ice surface was approximately circular, with a roundness more than 0.60. The equivalent circle diameter of air pore was 1.1~3.2 mm, and that of brine was 0.2~2.0 mm. The equivalent circle diameter of pores was positively correlated with the area fraction and negatively correlated with the roundness. In terms of three-dimensional structure, 4 types of air pores were divided according to sphericity (Rsph) into coronary pores (Rsph ≤ 0.25), irregular pores (0.25 < Rsph ≤ 0.45), strip pores (0.45 < Rsph ≤ 0.60), and spherical bubbles (0.60 < Rsph ≤ 1.00). The coronary pore was the largest (average volume (11522.8 ±5610.2 ) mm3) with smallest amount, and the spherical bubble was the smallest (average diameter (2.0 ± 1.1) mm) with the largest amount. The brine pores were divided into brine channels (0.45 < Rsph ≤ 0.60) and brine cells (0.60 < Rsph ≤ 1.00). The average length of the brine channel was (17.1 ± 12.1) mm, and the average diameter of the brine cell was (1.5 ± 0.9) mm. The amount of brine channels was less, but the volume proportion was comparable to that of brine cells.-
Key words:
- sea ice /
- pore /
- structure characteristics /
- CT scanning /
- 3D reconstruction
-

图 5 不同深度位置冰样断面CT图像(左)、阈值分割图像(中)和CT值分布(右)
Fig. 5 CT images of ice sections at different depth (left), corresponding images after segmentation (middle) and the distributions of CT values (right)
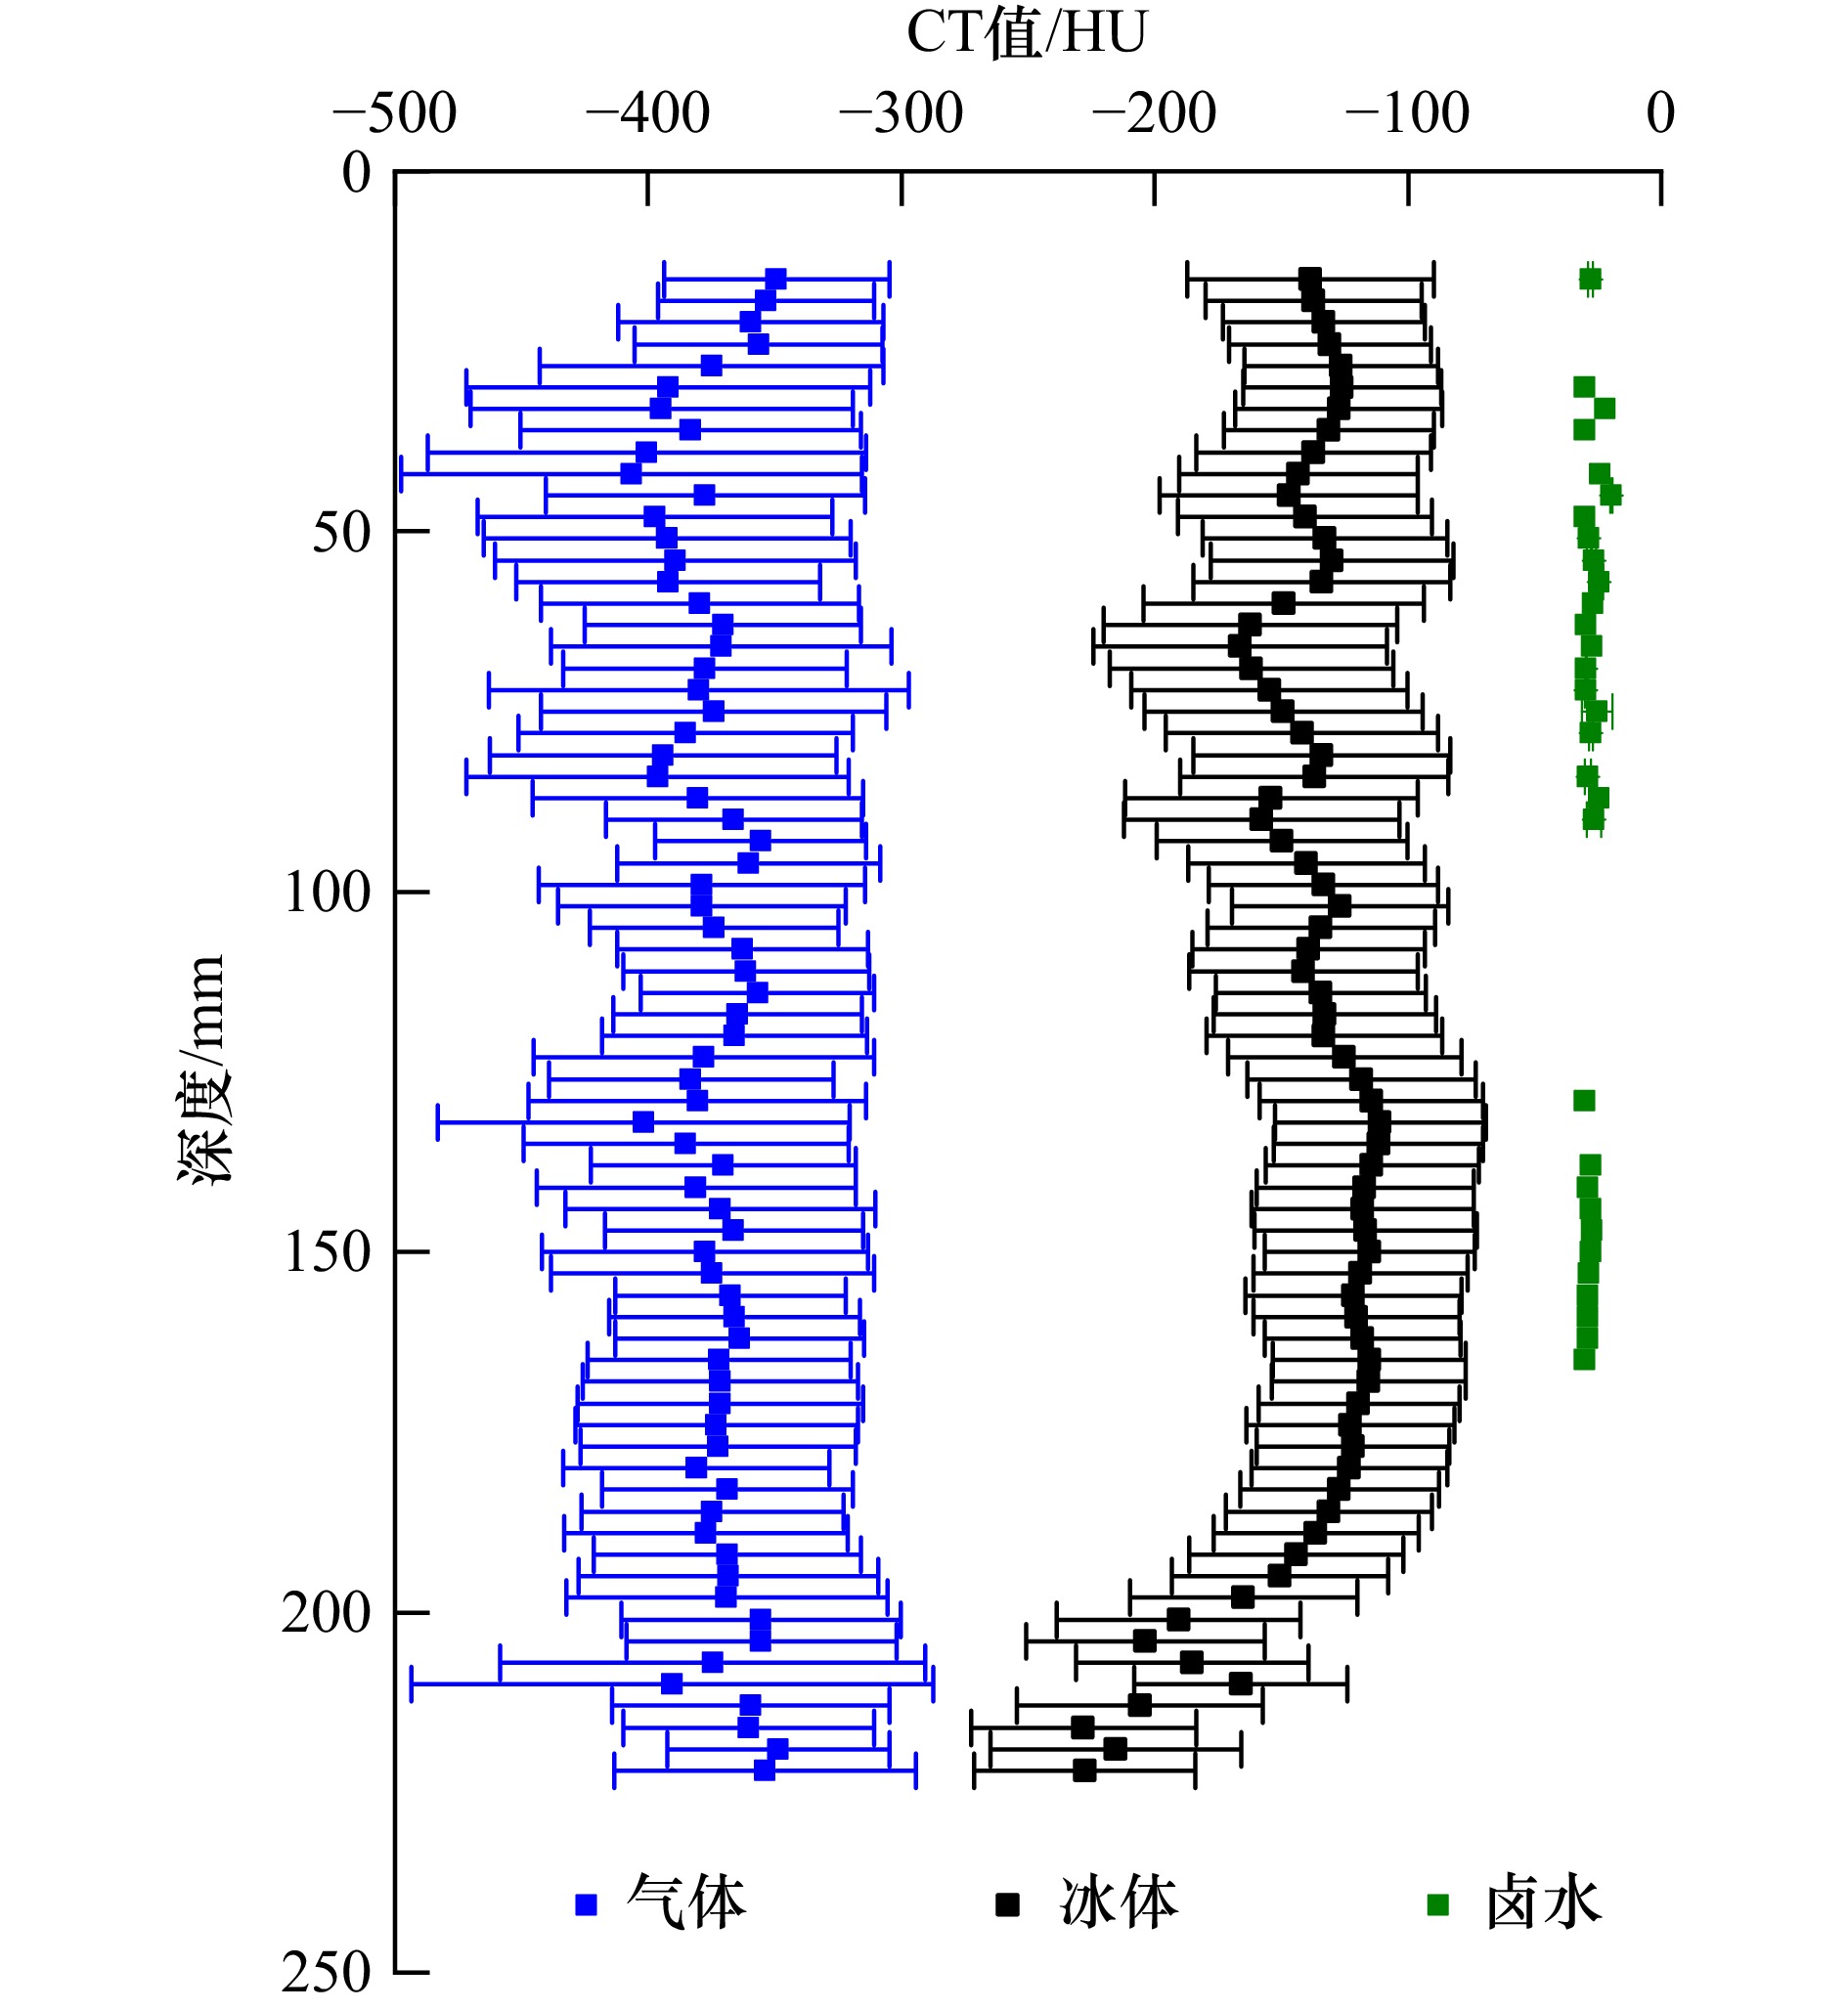
图 6 海冰扫描断面各组分CT值沿冰厚的变化(误差线为标准差)
Fig. 6 Profile of CT values of air, ice, and brine in the scanning sections along ice thickness (the error bar represents the standard deviation)

图 8 冰样扫描断面CT均值与面孔隙率的关系(a),粒状冰层(b)、柱状冰层(c)扫描断面CT均值与面孔隙率的关系
Fig. 8 The relationships between mean CT values and porosities of scanning sections in the whole ice sample (a), granular ice (b) and columnar ice (c)

图 9 气体与卤水孔隙的圆度(a)和等效圆直径(b)沿冰厚的变化(误差线为标准差)
Fig. 9 Profiles of roundness (a) and equivalent diameter (b) of air and brine pores along ice thickness(the error bar represents the standard deviation)
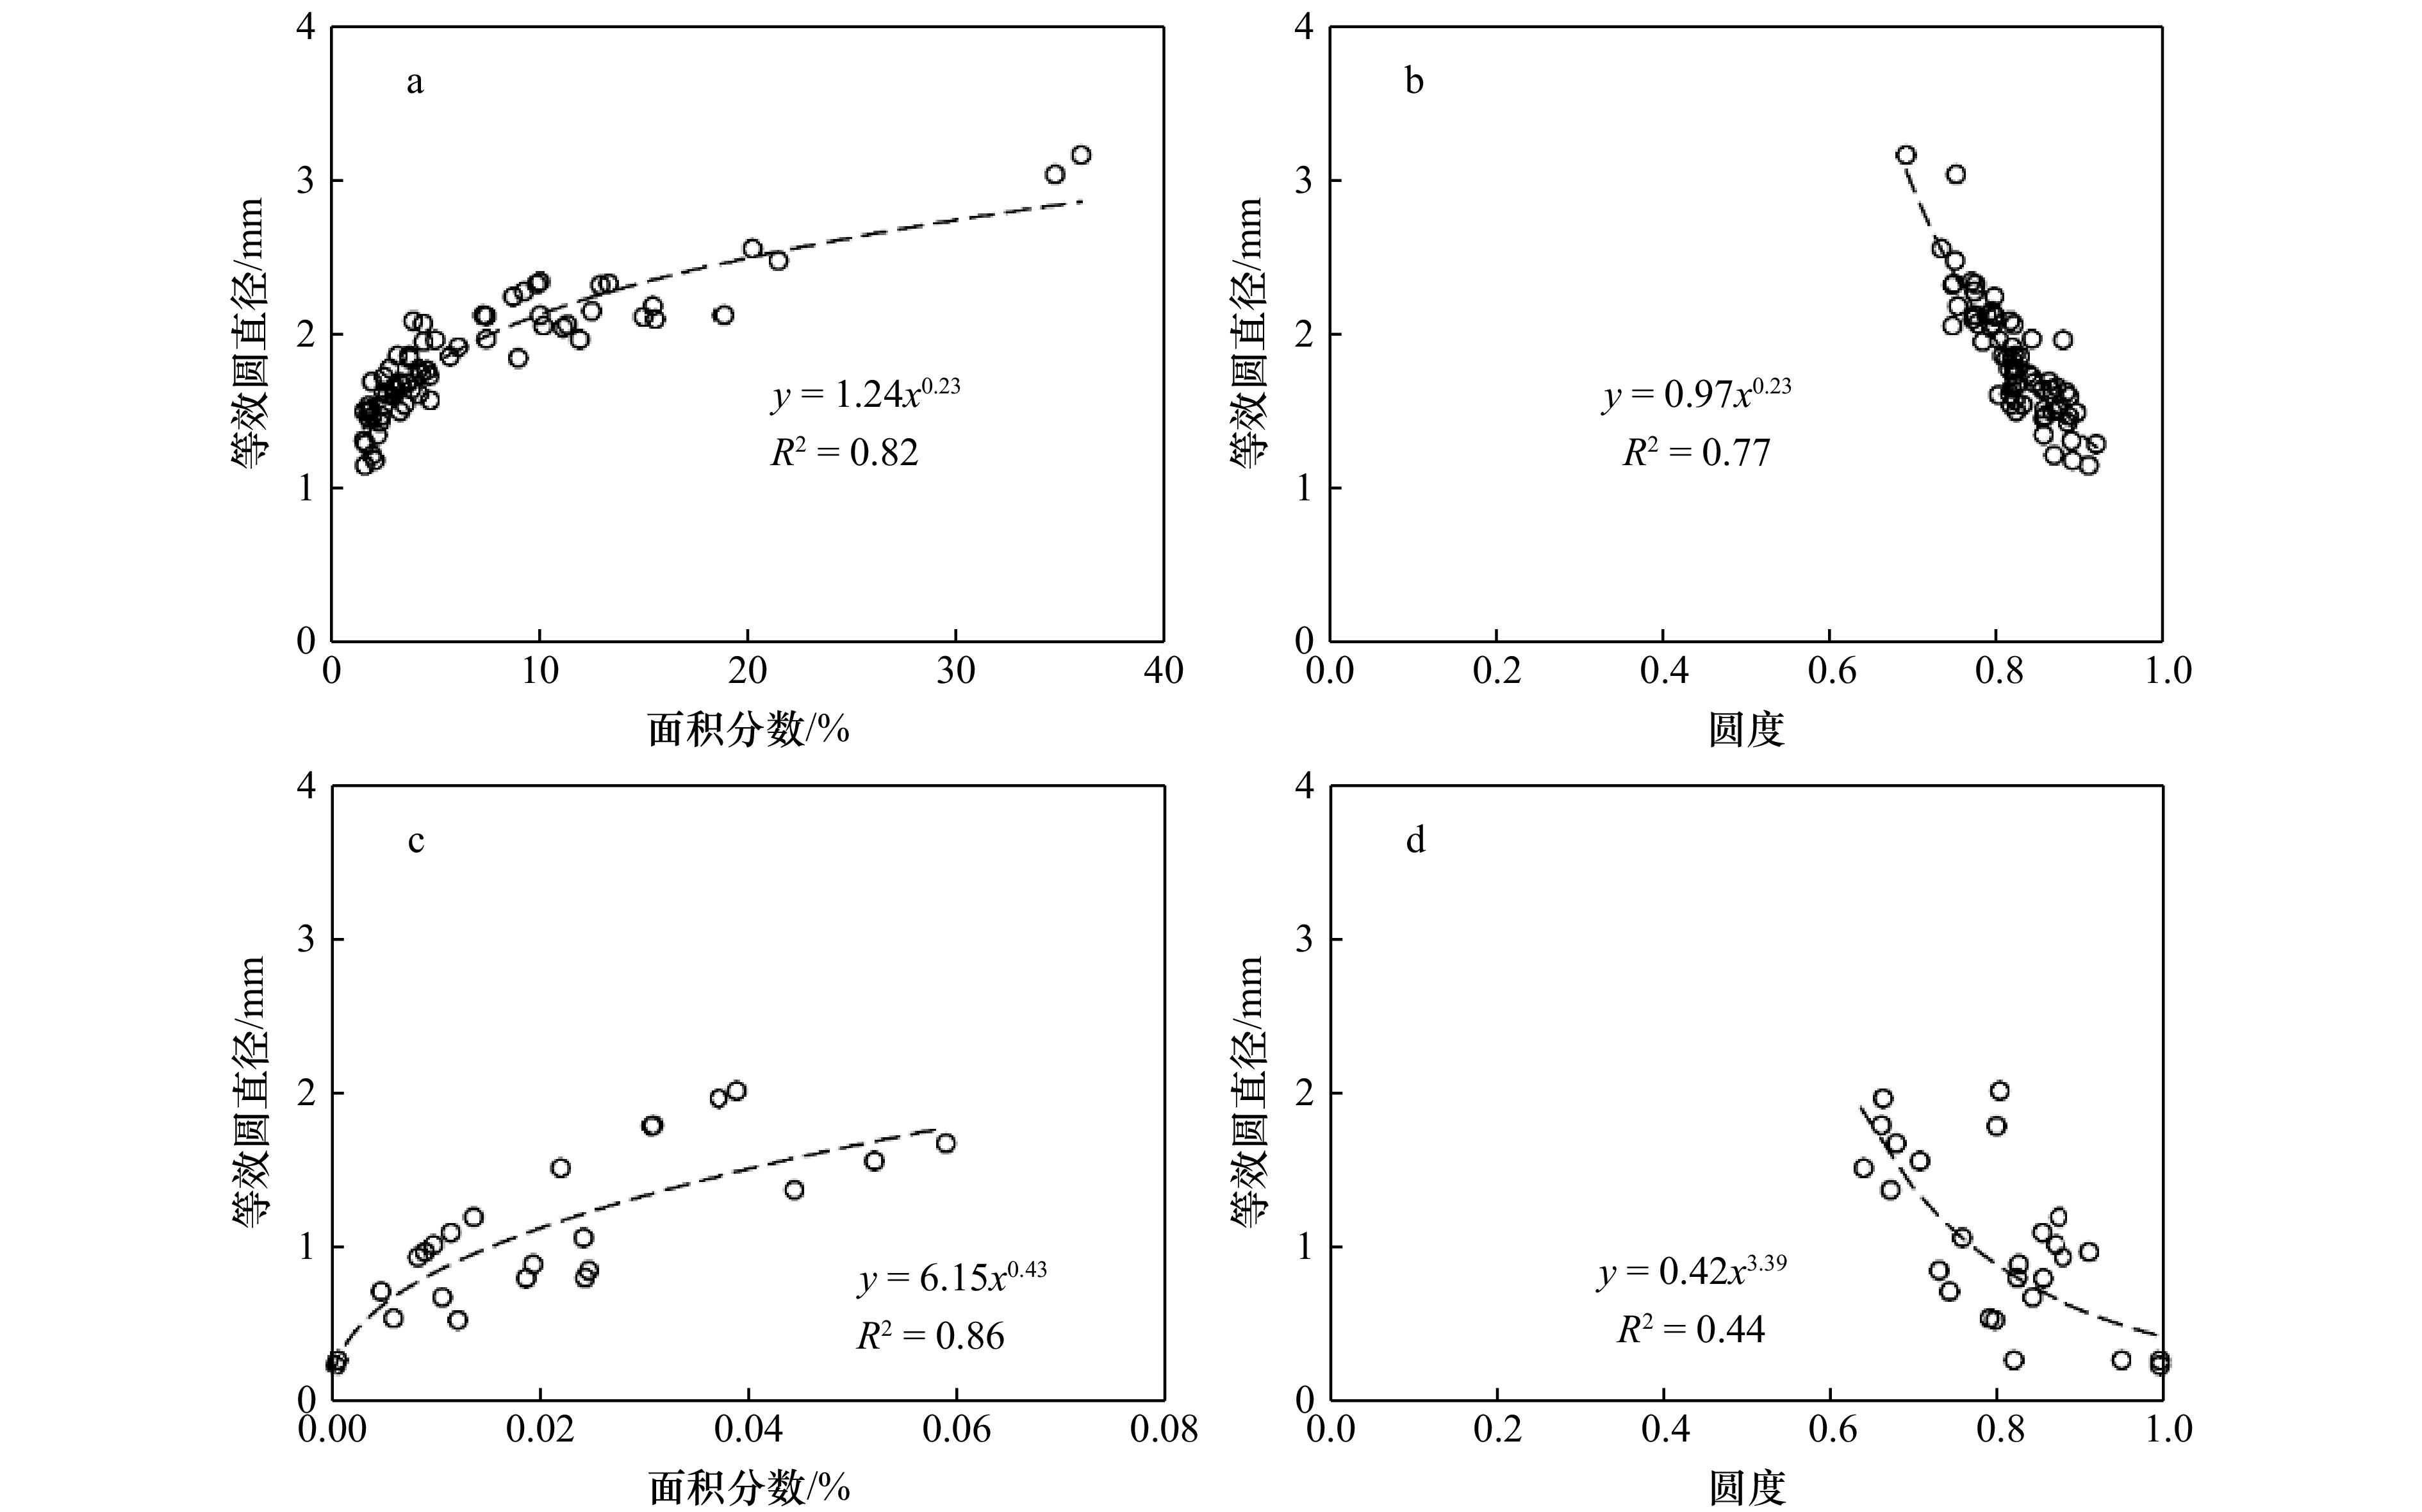
图 10 气体孔隙等效圆直径随面积分数(a)和圆度(b)的变化;卤水孔隙等效圆直径随面积分数(c)和圆度(d)的变化
Fig. 10 Variations of equivalent diameters of air pores with area fraction (a) and roundness (b), and of brine pores with area fraction (c) and roundness (d)
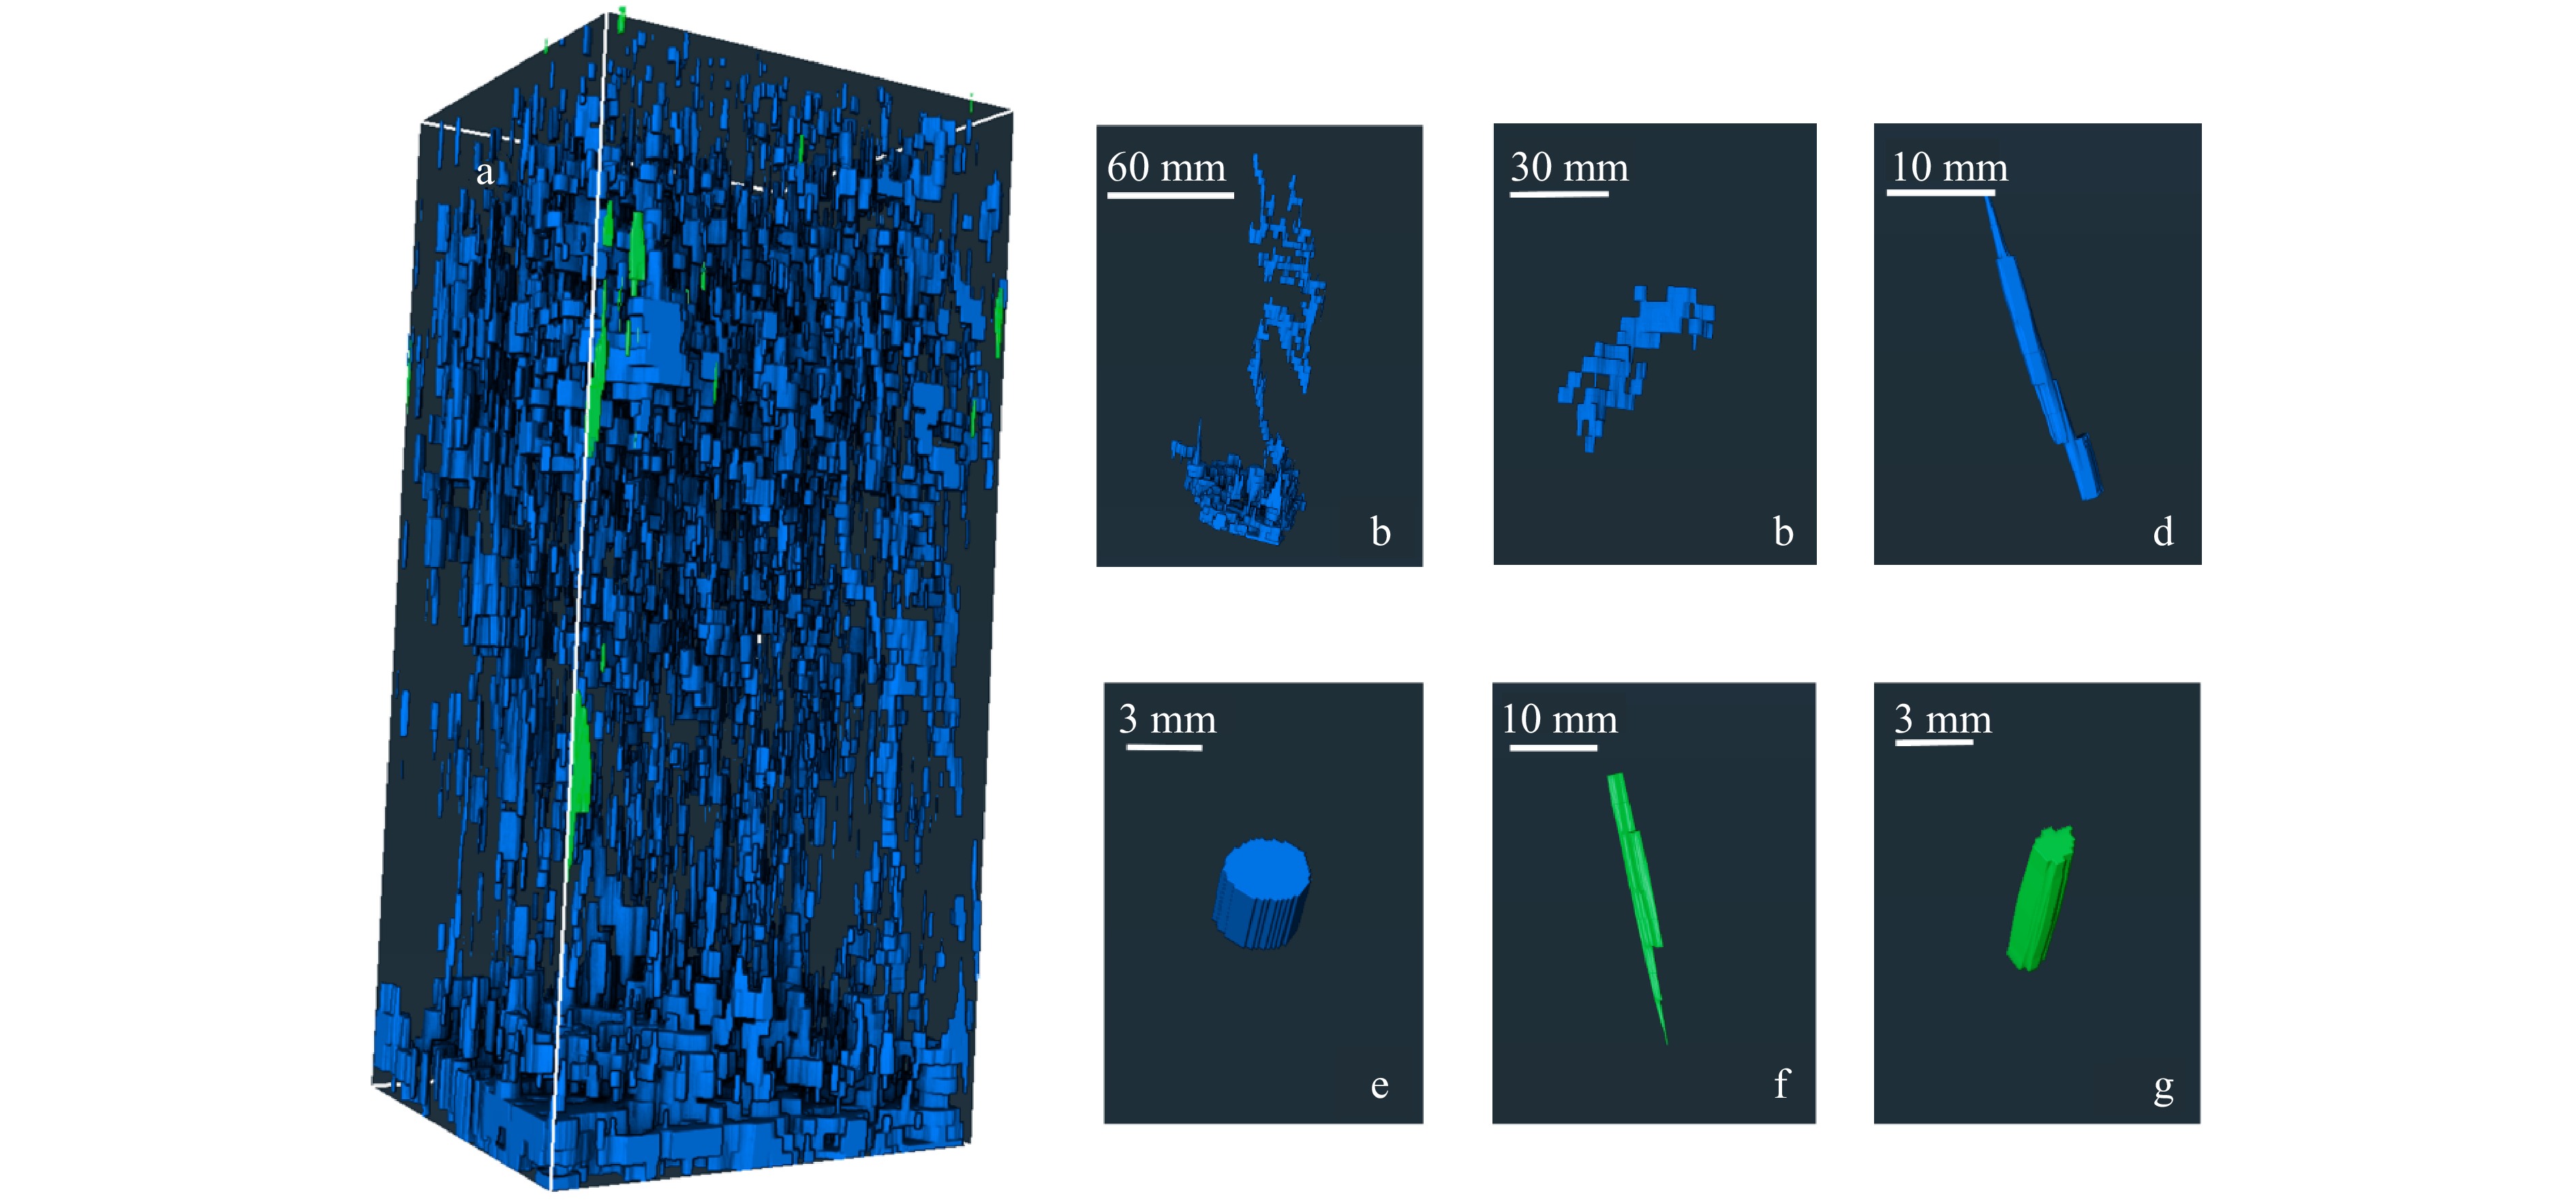
图 11 冰样三维孔隙结构(a)、典型气体孔隙(b−e)和典型卤水孔隙(f−g)
Fig. 11 Three-dimensional pore structure of the ice sample (a), typical air pore structure (b−e) and typical brine pore structure (f−g)
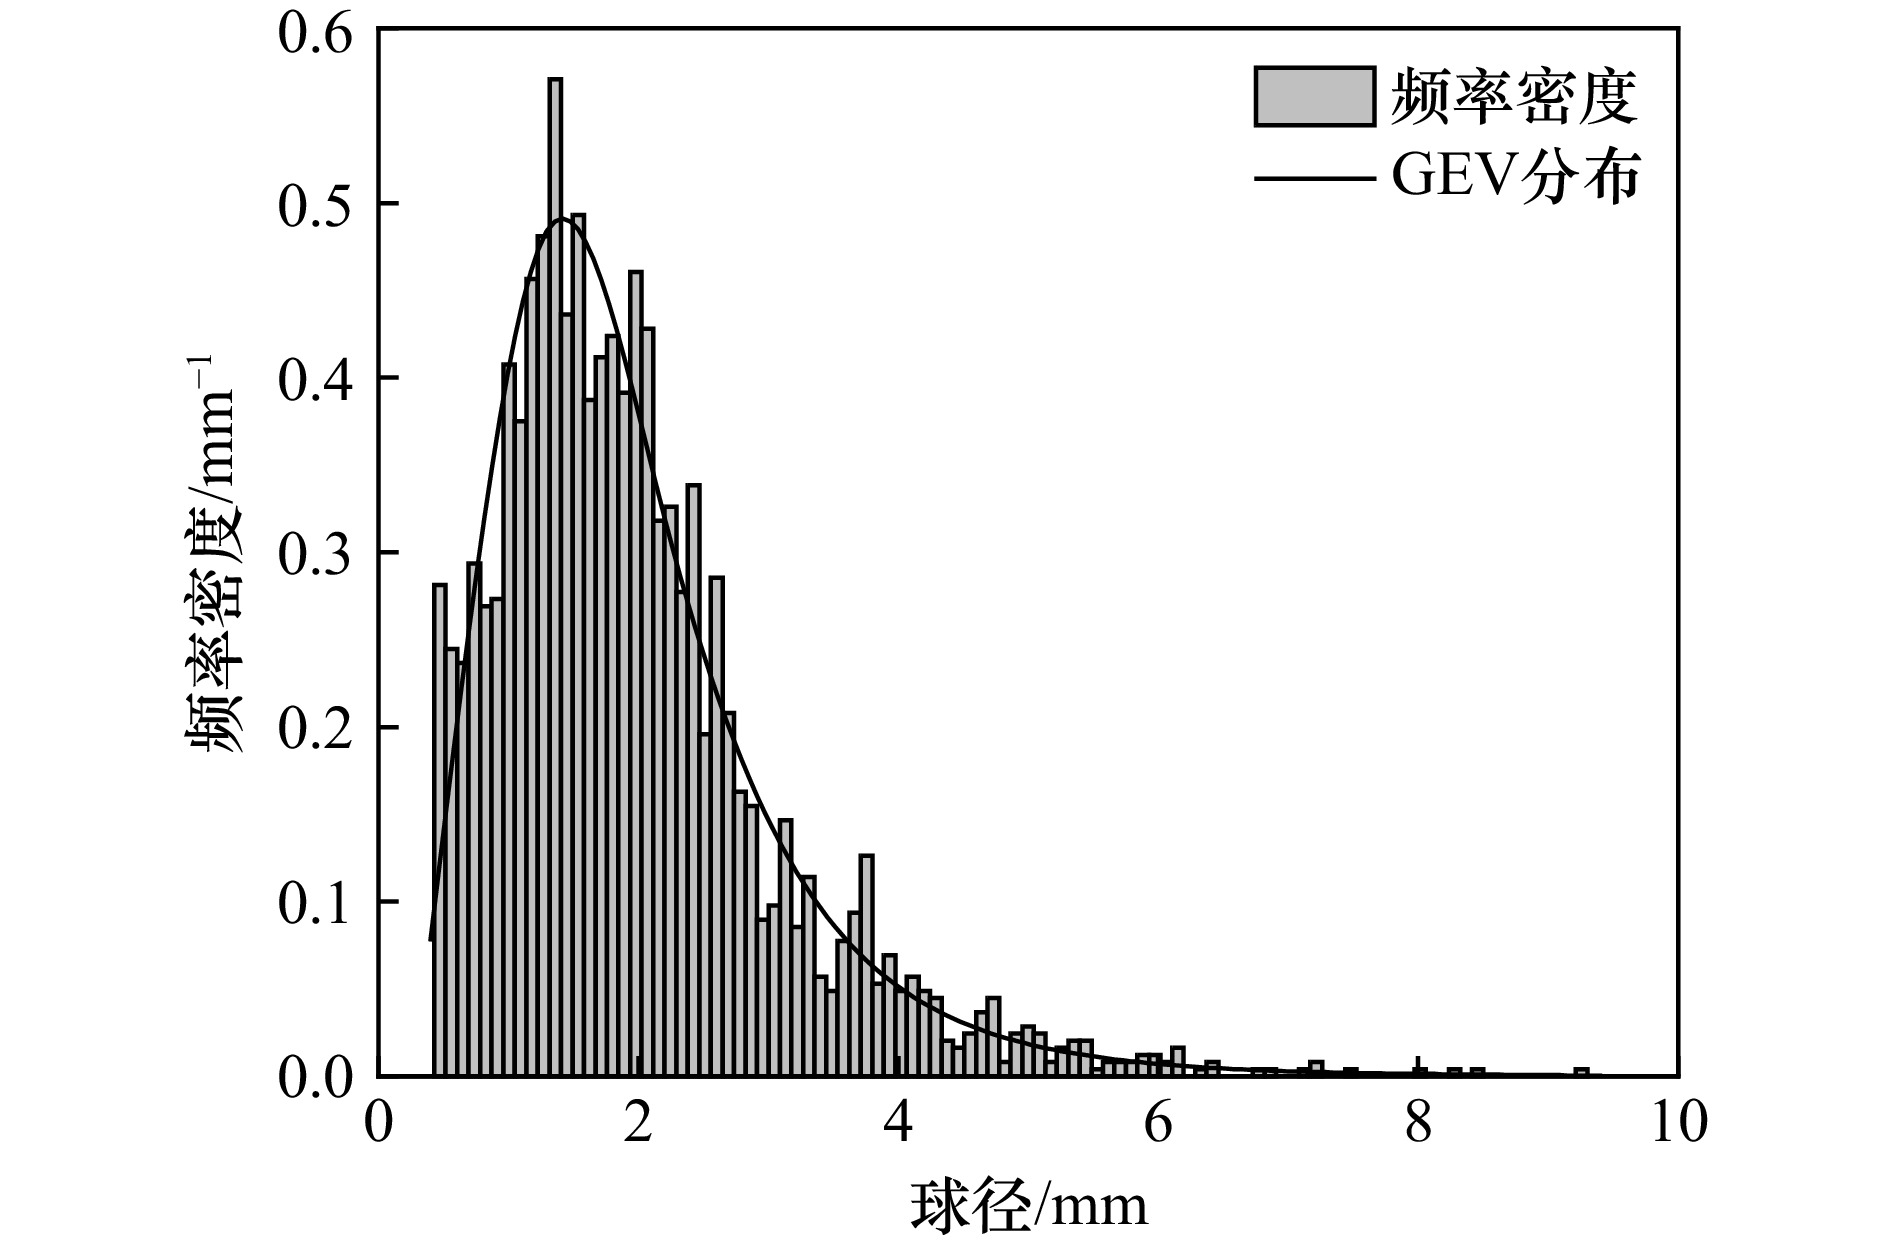
图 12 球形气泡等效球直径频率密度分布
Fig. 12 The probability density distribution of equivalent diameter of spherical air bubbles

图 13 球形气泡(a)和卤水胞(b)等效球直径与球度的关系(红色虚线为包络线)
Fig. 13 The relationships between equivalent diameters and sphericities of spherical air bubbles (a) and brine cells (b) (the red dashed lines are envelopes)
表 1 粒状冰层和柱状冰层二维孔隙特征平均值
Tab. 1 Mean values of two-dimensional characteristics of pores in the granular ice and columnar ice
气体面积分数/% 卤水面积分数/% 气体孔隙圆度 卤水孔隙圆度 气体孔隙等效圆直径/mm 卤水孔隙等效圆直径/mm 粒状冰层 7.43 ± 4.24 0.02 ± 0.02 0.81 ± 0.05 0.82 ± 0.09 1.9 ± 0.4 1.0 ± 0.5 柱状冰层 6.59 ± 8.59 0.02 ± 0.01 0.83 ± 0.05 0.72 ± 0.18 1.8 ± 0.4 1.2 ± 0.6  下载: 导出CSV
表 2 冰样孔隙分类和特征
Tab. 2 Classification and characteristics of pores in the ice sample
气体孔隙 特征 卤水孔隙 特征 冠状孔隙 结构复杂,单体体积最大 卤水通道 呈细长形,长度为6.1~30.0 mm 不规则孔隙 形态各异,单体体积小于冠状孔隙,但比其余两种气体孔隙大 条状孔隙 呈细长形,长度为0.7~41.6 mm,数量较多 卤水胞 近似球体,直径为0.4~4.1 mm 球形气泡 近似球体,直径为0.4~9.3 mm,数量最多
下载: 导出CSV
表 3 粒状冰层与柱状冰层孔隙参数比较
Tab. 3 Comparison of pore characteristics between the granular ice and the columnar ice
参数 粒状冰层 柱状冰层 体积占比/% 平均体积/mm3 平均长度/mm 平均直径/mm 体积占比/% 平均体积/mm3 平均长度/mm 平均直径/mm 卤水通道 23.3 7.0 10.6 2.3 76.7 46.4 30.0 4.5 卤水胞 100 3.8 2.6 1.5 / / / / 冠状孔隙 / / / / 16.5 11420.8 74.8 27.9 不规则孔隙 39.5 553.5 34.9 9.7 27.0 521.0 41.9 8.8 条状孔隙 52.2 71.4 13.5 4.0 42.7 62.6 13.3 3.7 球形气泡 52.4 8.9 3.3 2.0 43.3 9.0 3.5 1.9 注:“/”为无资料。
下载: 导出CSV
-
[1] Vancoppenolle M, Madec G, Thomas M, et al. Thermodynamics of sea ice phase composition revisited[J]. Journal of Geophysical Research: Oceans, 2019, 124(1): 615−634. doi: 10.1029/2018JC014611 [2] Nicolaus M, Perovich D K, Spreen G, et al. Overview of the MOSAiC expedition: Snow and sea ice[J]. Elementa: Science of the Anthropocene, 2022, 10(1): 000046. doi: 10.1525/elementa.2021.000046 [3] Wang Q, Lu P, Leppäranta M, et al. Physical properties of summer sea ice in the Pacific sector of the Arctic during 2008−2018[J]. Journal of Geophysical Research: Oceans, 2020, 125(9): e2020JC016371. doi: 10.1029/2020JC016371 [4] Moslet P O. Field testing of uniaxial compression strength of columnar sea ice[J]. Cold Regions Science and Technology, 2007, 48(1): 1−14. doi: 10.1016/j.coldregions.2006.08.025 [5] Wang Qingkai, Li Zhaoquan, Lu Peng, et al. Flexural and compressive strength of the landfast sea ice in the Prydz Bay, East Antarctic[J]. The Cryosphere, 2022, 16(5): 1941−1961. doi: 10.5194/tc-16-1941-2022 [6] Hectors K, De Waele W. Influence of weld geometry on stress concentration factor distributions in tubular joints[J]. Journal of Constructional Steel Research, 2021, 176: 106376. doi: 10.1016/j.jcsr.2020.106376 [7] Cox G F N, Weeks W F. Equations for determining the gas and brine volumes in sea-ice samples[J]. Journal of Glaciology, 1983, 29(102): 306−316. doi: 10.3189/S0022143000008364 [8] Leppäranta M, Manninen T. The brine and gas content of sea ice with attention to low salinities and high temperatures[R]. Helsinki: Finnish Institute of Marine Research, 1988. [9] Cole D M, Eicken H, Frey K, et al. Observations of banding in first-year Arctic sea ice[J]. Journal of Geophysical Research: Oceans, 2004, 109(C8): C08012. [10] Light B, Maykut G A, Grenfell T C. Effects of temperature on the microstructure of first-year Arctic sea ice[J]. Journal of Geophysical Research: Oceans, 2003, 108(C2): 3051. [11] 李志军, 康建成. 北极生长的多年海冰晶体结构分析[J]. 冰川冻土, 2001, 23(4): 383−388.Li Zhijun, Kang Jiancheng. Crystals and fabrics of an Arctic multi-year ice sample[J]. Journal of Glaciology and Geocryology, 2001, 23(4): 383−388. [12] Kawamura T. Observations of the internal structure of sea ice by X ray computed tomography[J]. Journal of Geophysical Research: Oceans, 1988, 93(C3): 2343−2350. doi: 10.1029/JC093iC03p02343 [13] Golden K M, Eicken H, Heaton A L, et al. Thermal evolution of permeability and microstructure in sea ice[J]. Geophysical Research Letters, 2007, 34(16): L16501. [14] Pringle D J, Miner J E, Eicken H, et al. Pore space percolation in sea ice single crystals[J]. Journal of Geophysical Research: Oceans, 2009, 114(C12): C12017. [15] Crabeck O, Galley R, Delille B, et al. Imaging air volume fraction in sea ice using non-destructive X-ray tomography[J]. The Cryosphere, 2016, 10(3): 1125−1145. doi: 10.5194/tc-10-1125-2016 [16] Oggier M, Eicken H, Wilkinson J, et al. Crude oil migration in sea-ice: laboratory studies of constraints on oil mobilization and seasonal evolution[J]. Cold Regions Science and Technology, 2020, 174: 102924. doi: 10.1016/j.coldregions.2019.102924 [17] Maus S, Huthwelker T, Enzmann F, et al. Synchrotron-based X-ray micro-tomography: insights into sea ice microstructure[C]//Proceedings of the Sixth Workshop on Baltic Sea Ice Climate. Helsinki, Finland: University of Helsinki, 2009. [18] Obbard R W, Troderman G, Baker I. Imaging brine and air inclusions in sea ice using micro-X-ray computed tomography[J]. Journal of Glaciology, 2009, 55(194): 1113−1115. doi: 10.3189/002214309790794814 [19] Lieb-Lappen R M, Golden E J, Obbard R W. Metrics for interpreting the microstructure of sea ice using X-ray micro-computed tomography[J]. Cold Regions Science and Technology, 2017, 138: 24−35. doi: 10.1016/j.coldregions.2017.03.001 [20] Salomon M L, Maus S, Petrich C. Microstructure evolution of young sea ice from a Svalbard fjord using micro-CT analysis[J]. Journal of Glaciology, 2022, 68(269): 571−590. doi: 10.1017/jog.2021.119 [21] Maus S, Schneebeli M, Wiegmann A. An X-ray micro-tomographic study of the pore space, permeability and percolation threshold of young sea ice[J]. The Cryosphere, 2021, 15(8): 4047−4072. doi: 10.5194/tc-15-4047-2021 [22] 蒲毅彬, 李志军. 海冰的CT扫描和分析计算[C]//中国地理学会冰川冻土分会. 第五届全国冰川冻土学大会论文集(上册). 兰州: 甘肃文化出版社, 1996: 586−590. Pu Yibin, Li Zhijun. CT scanning and calculation analysis of sea ice[C]//Glacier and Frozen Soil Branch of the Chinese Geographical Society. Proceedings of the 5th National Conference on Glaciology and Permafrost (Volume I). Lanzhou: Gansu Culture Publishing House, 1996: 586−590. [23] Li Zhijun, Pu Yibin. Some applications of computerized tomography scanner to sea ice[C]//Proceedings of the 12th International Offshore and Polar Engineering Conference. Kitakyushu, Japan, 2002. -


计量
- 文章访问数: 333
- HTML全文浏览量: 121
- PDF下载量: 44
- 被引次数: 0
