Interannual variability of Arctic multi-year ice transport and its interruption in the Beaufort Gyre zone
-
摘要: 受全球变暖的影响,近年来北冰洋大量多年冰被季节冰取代。本文基于冰龄、密集度和冰速卫星遥感数据,对波弗特海北断面(NB断面)、W150°断面、楚科奇海东断面(EC断面)和北极中部断面(CA断面)几个北冰洋代表断面的多年冰通量进行估算,结合大气再分析数据研究影响各断面1984-2021年冰通量变化的主要因素,并对多年冰输运中断发生的时间和原因进行了分析。结果显示,波弗特高压(BH)减弱对应着NB断面多年冰输运减弱和穿极漂流区(CA断面)的多年冰输运增强。在大气环流北极偶极子(DA)模态负位相时期,反气旋风场减弱,使东西伯利亚的南风减弱,导致EC断面的多年冰面积通量减小,经向风减弱使CA断面通量减小。但在2004年之后,波弗特环流区断面(NB和W150°断面)海冰通量和CA断面海冰通量与DA指数的相关性均减少。这主要是由于多年冰范围的不断内缩,使得断面多年冰通量呈现减小趋势,甚至出现中断现象,这使得多年冰面积通量周期发生改变。同时,冰速年际变化也可导致波弗特环流多年冰输运的中断。本研究发现这种情况通常发生在BH指数和DA指数负位相时期,但并不是所有BH指数和DA指数低于负标准差的月份都对应着发生多年冰输运中断的时间,当中断发生时,与普通BH负位相情形相比,风场距平的中心点更靠近北极点,与普通DA负位相情形相比,海平面气压正、负距平空间分布更加对称。Abstract: Due to global warming, a significant amount of multi-year ice(MYI) has been replaced by seasonal ice in recent years. In this study, the multi-year ice flux of representative sections(Northern Beaufort (NB) section, W150° Section, Eastern Chukchi (EC) Section and Central Arctic (CA) Section) of the Arctic Ocean is calculated based on ice age, ice concentration and ice velocity data. The main factors affecting ice fluxes at each section from 1984 to 2021 were investigated in the context of atmospheric reanalysis data. The occurrence time and reasons for theMYI transport interruptions were analyzed. The results show that the weakening of the Beaufort High (BH) corresponds to a reduction in MYI transport in the NB section and an increase in the CA Section along Transpolar Drift region. During the negative phase of the Arctic Dipole (DA), the anticyclonic wind field weak, which reduced the south winds in East Siberia, leading to a decrease in the MYI flux in the EC Section. The decrease in meridional wind has reduced the flux in the CA Section. However, after 2004, the correlation between sea ice flux in the Beaufort gyre region and the Transpolar drift region sections with the DA index decreased. This is mainly due to the continuous contraction of the MYI extent, which has resulted in a decreasing trend in section and even interruptions. The contraction also changes the periodicity of the MYI flux. At the same time, interannual variations of ice velocity can also cause interruptions of multi-year ice transport in the Beaufort gyre. The results indicate that interruptions usually occur during the negative phase periods of the BH index and DA index. However, it is noteworthy that not all months with BH and DA index below the negative standard deviation correspond to the time oftransport interruption. When an interruption occurs, the wind field anomaly center is closer to the North Pole than in the normal of the negative phase of the BH. Furthermore, the spatial distribution of positive and negative sea level pressure anomalies is more symmetrical, compared to the normal negative phase of the DA.
-
Key words:
- multi-year ice transport /
- interruption /
- Beaufort High /
- Arctic dipole
-
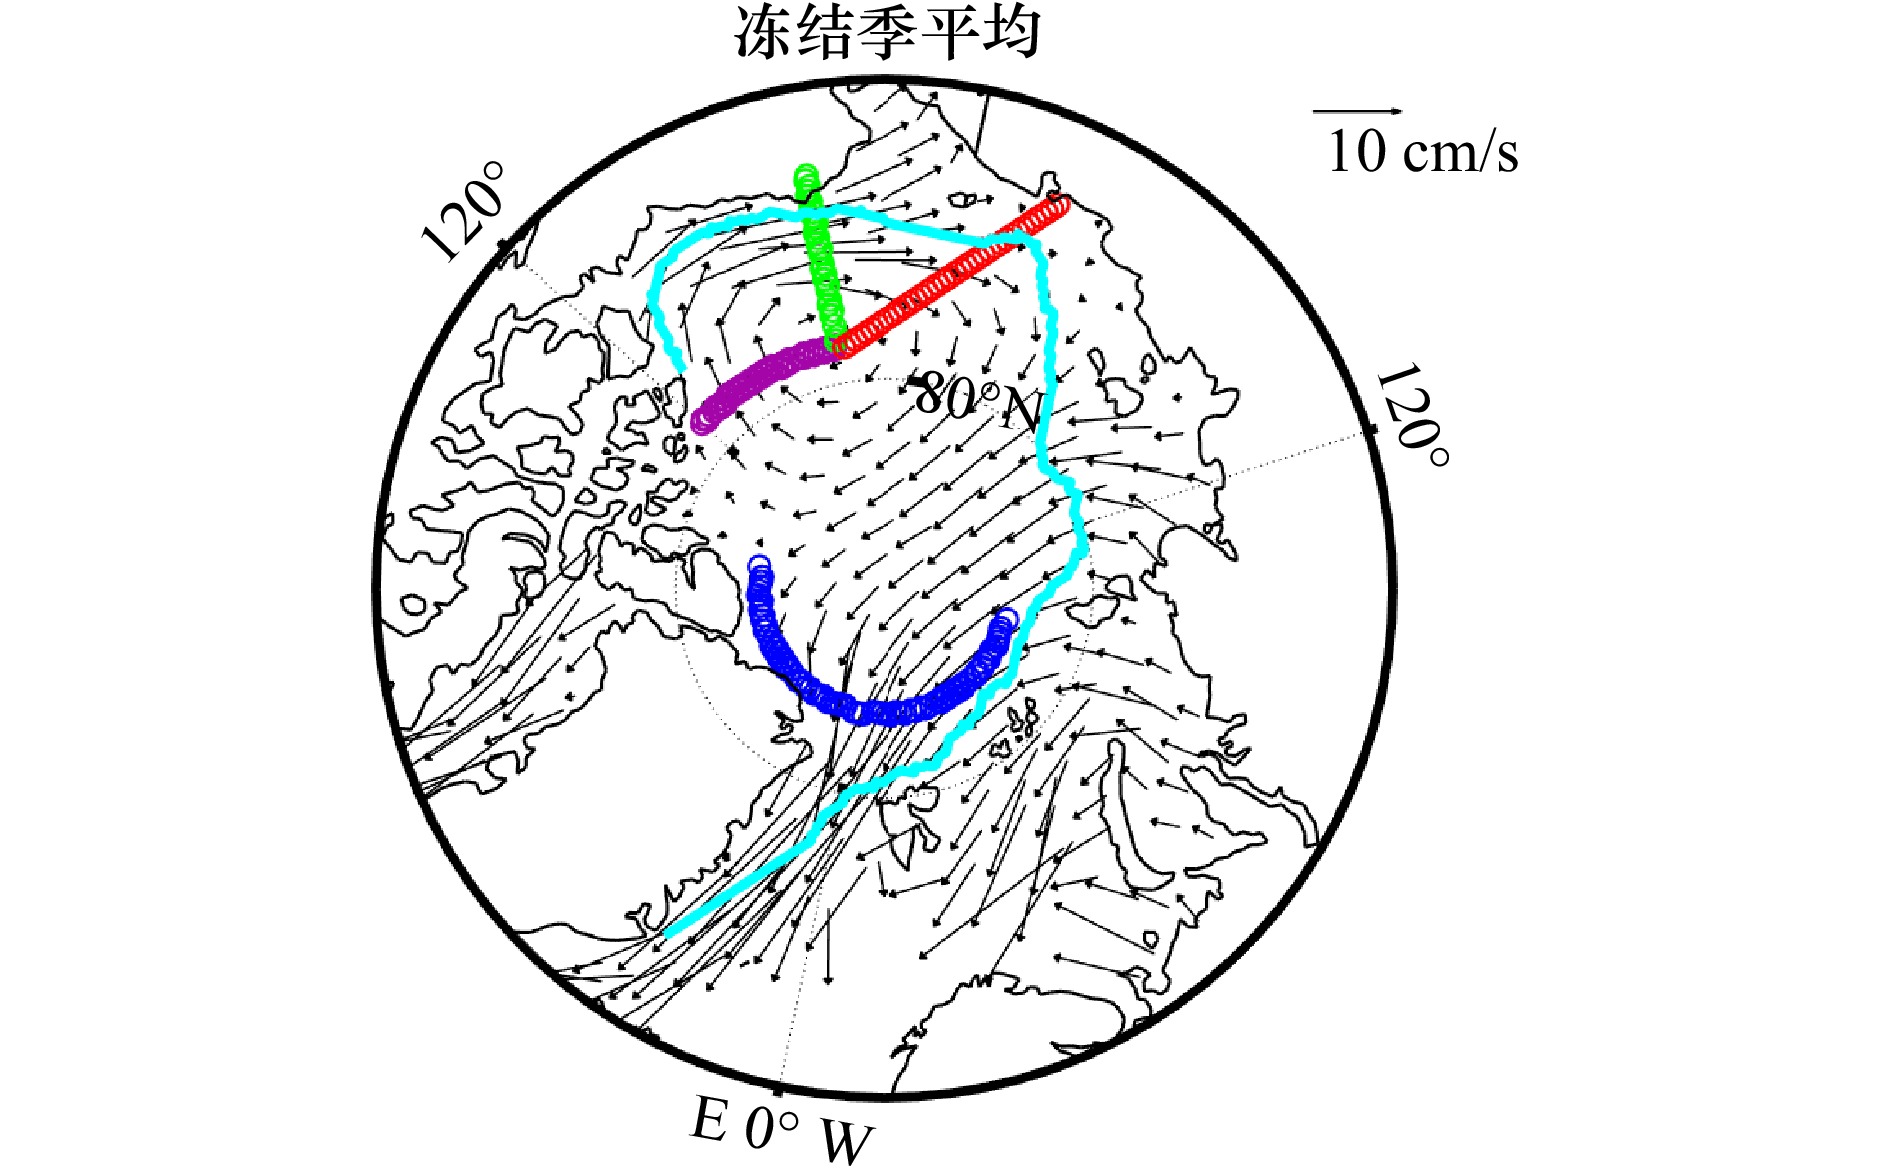
图 1 1984–2021年冻结季(10−4月)气候态冰速分布和海冰外缘线位置,其中紫色线为NB断面,经向断面为W150°断面(绿色),红色断面为EC断面,蓝色线为CA断面
Fig. 1 The climatological ice velocity distribution and ice edge position during the freezing season (October to April) from 1984 to 2021, with the purple line representing the NB Section, the meridional section indicated by the W150° Section (green), the red line representing the EC Section, and the blue line representing the CA Section
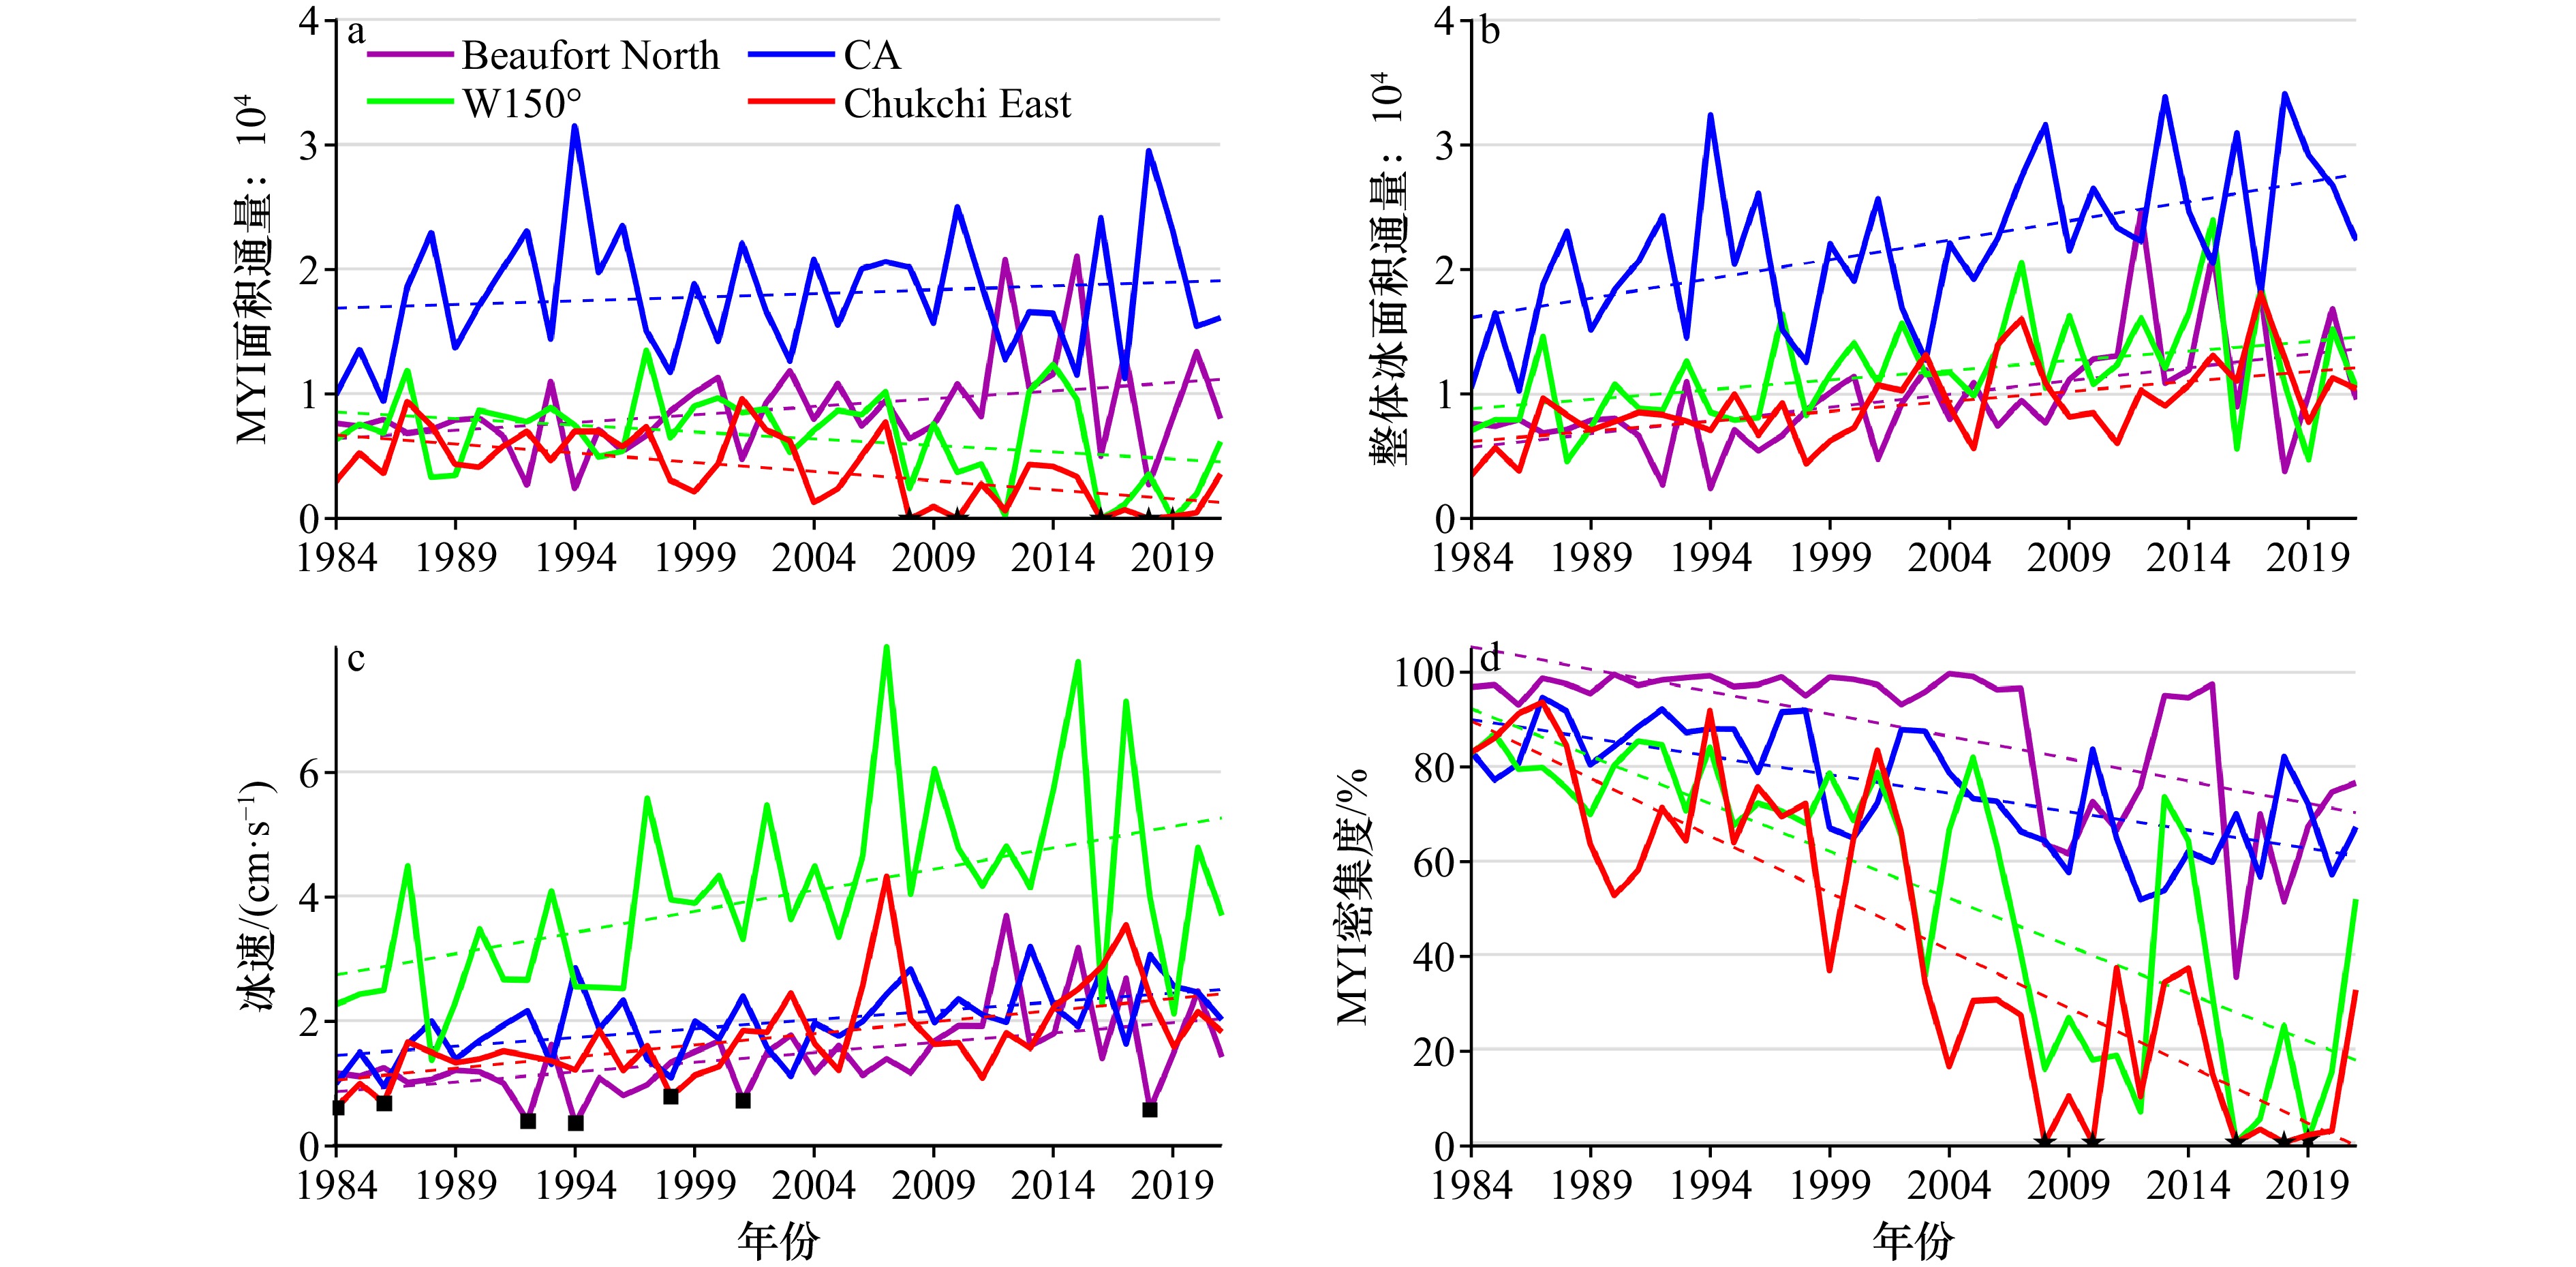
图 4 1984–2021年冻结季通过4个断面的MYI面积通量(星型标识为断面MYI通量为0的年份)(a),冻结季通过4个断面的整体冰面积通量(b);4个断面的冰速的均值变化(正方形框为断面冰速低于负标准差的年份,断面冰速和通量的值只考虑向东或向南的方向)(c),4个断面MYI密集度的均值变化 (星型标识为断面MYI密集度为0的年份)(d)
Fig. 4 MYI area flux through the four sections during the freezing season from 1984 to 2021 (star markers indicate years when the section MYI flux was zero) (a); All ice area flux through the four sections (b); Mean variation of ice velocity across the four sections (square boxes indicate years when the section ice velocity was below the negative standard deviation; values for section ice speed and flux only consider the eastward or southward direction) (c); Mean variation of MYI concentration across the four sections (star markers indicate years when the section MYI concentration was zero) (d)
图 5 NB断面(a)、W150°断面(b)、EC断面(c)、CA断面(d)MYI通量的小波分析(图中黑色实线为90%的置信区间,白色虚线为影响锥,受数据长度影响)
Fig. 5 Wavelet analysis of MYI flux for the NB Section (a) , W150° Section (b), EC Section (c), CA Section (d) (the black solid lines represent the 90% confidence interval, and the white dashed lines indicate the cone of influence, which is affected by the length of the data)
图 6 1984–2021年冻结季BH指数的时间序列(相应的黑色虚线为正负标准差) (a),BH指数小波分析(b),不同断面MYI通量和BH指数的关系(c),不同断面整体冰通量和BH指数的关系(d)(图c和d中相应的黑色虚线为90%置信区间)
Fig. 6 Time series of the BH index during the freezing season from 1984 to 2021 (corresponding black dashed lines represent the positive and negative standard deviations) (a); wavelet analysis of the BH index (b); relationship between MYI flux for different sections and the BH index (c); relationship between All ice flux for different sections and the BH index (d) (the corresponding black dashed lines represent the 90% confidence interval in Fig.6c, d)
图 7 超过正标准差和负标准差BH指数年份的海平面气压、10 m风速(a),冰速的合成(超过标准差的负位相减去正位相)(b),气候态海平面气压和10 m风速空间分布(绿色实线为波弗特高压的区域)(c)
Fig. 7 Composite fields of sea level pressure, 10 m wind speed (a); ice velocity for years when the BH index exceeds the positive and negative standard deviations (negative phase exceeding the standard deviation minus the positive phase) (b); spatial distribution of climatological sea level pressure and 10 m wind speed (the green solid line indicates the region of the Beaufort High) (c)
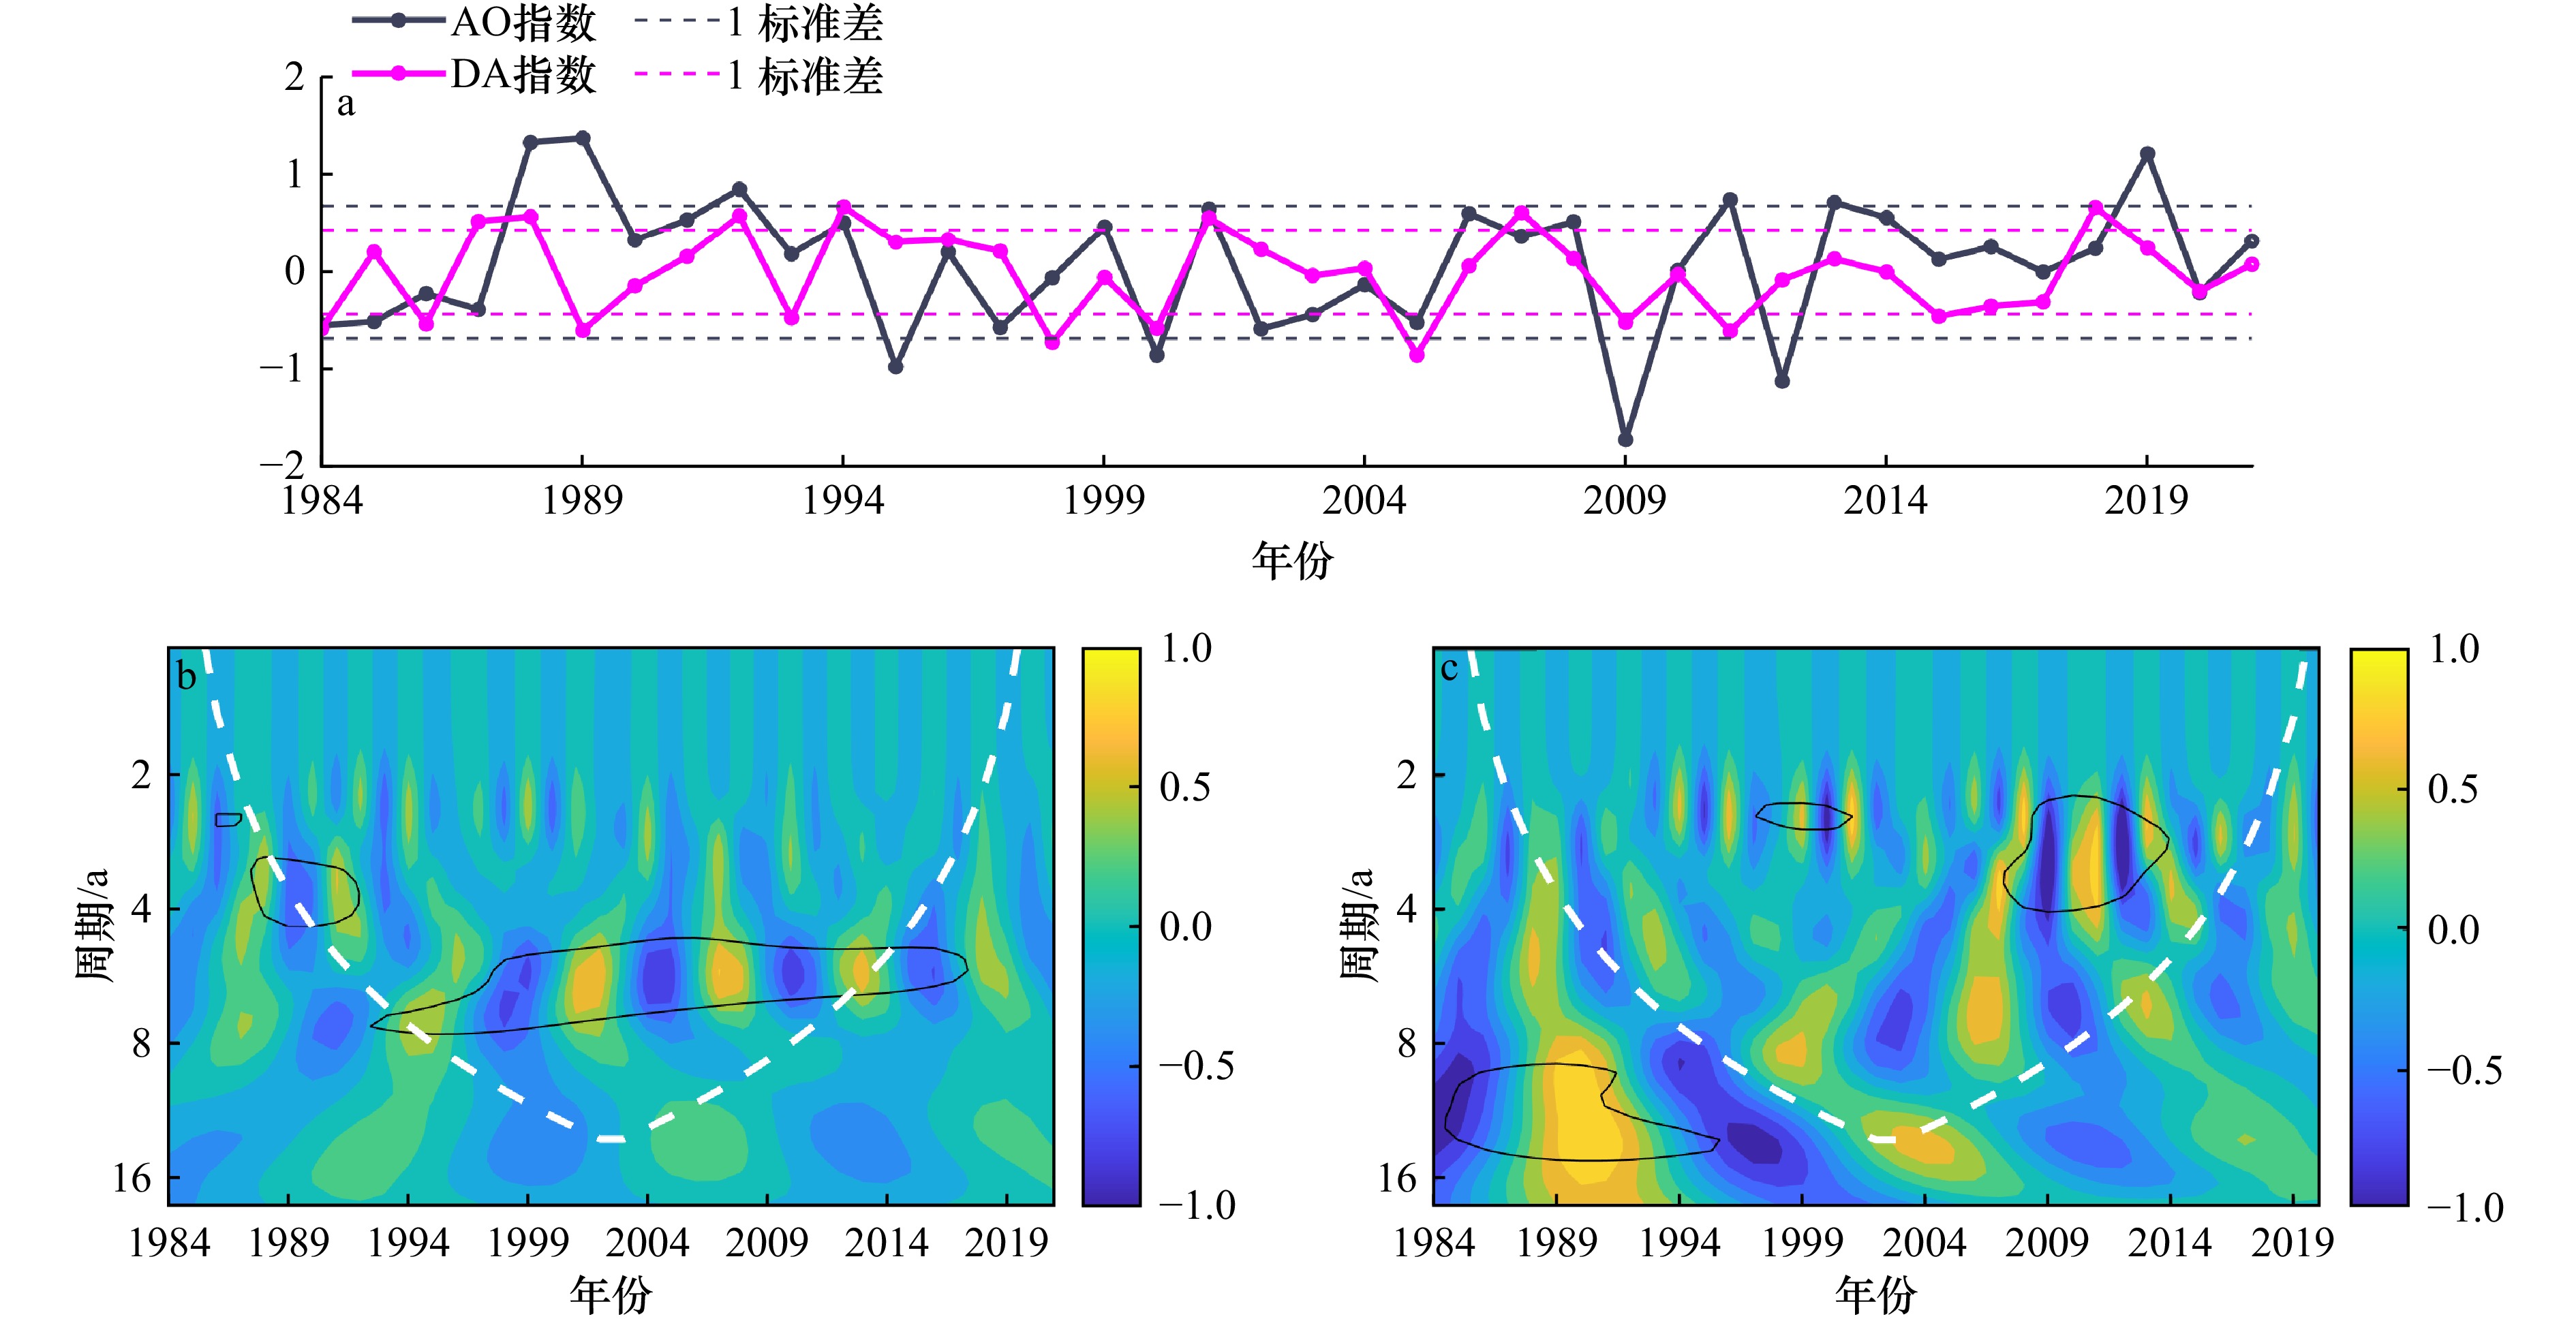
图 9 1984–2021年各个断面MYI通量与DA指数的滑动相关(a);MYI通量与AO的滑动相关(b);整体冰通量与DA的相关(c);整体冰通量与AO的相关(d)(图中相应的黑色虚线为90%置信区间)
Fig. 9 Sliding correlation between MYI flux of various sections and DA index from 1984 to 2021 (a); sliding correlation analysis between MYI flux and AO index (b); correlation between all ice flux and DA (c); correlation between all ice flux and AO (d) (the corresponding black dashed lines represent the 90% confidence interval)
图 12 1984–2021年NB断面月平均MYI面积输运量(a)、冰速(d)和MYI密集度(g)时间序列,b、e和h为W150°断面,c、f和i为EC断面(黑色点为面积输运量、冰速和密集度等于0的年份)
Fig. 12 Monthly mean time series from 1984 to 2021 for the NB Section: MYI area transport (a), ice velocity (d), and MYI concentration (g); b, e and h represent the EC Section; c, f and i represent the W150° Section (black dots indicate years where area transport, ice velocity and concentration are equal to zero)
图 13 a、b、e、f中BH指数低于负标准差的月份中,发生中断月份和未发生中断月份的海平面气压及风速和冰速的合成;c、d、g、h中DA低于负标准差的月份中,发生中断月份和未发生中断月份的海平面气压及风速和冰速的合成变化
Fig. 13 Composite fields of a, b, e, f sea level pressure, wind velocity, and ice velocity during months with BH index below one standard deviation, comparing months with and without transport interruptions; composite fields of c, d, g, h sea level pressure, wind velocity, and ice velocity during months with DA below one standard deviation, comparing months with and without transport interruptions
图 14 3个断面月平均冰速异常与BH指数的滑动相关(a),3个断面月平均冰速异常与DA指数的滑动相关(b)(图中相应的黑色虚线为90%置信区间);以DA指数、BH指数为x、y轴,NB断面(c)和EC断面(d)MYI发生中断时的冰速异常为z轴绘制的图像
Fig. 14 Sliding correlation between the monthly mean ice velocity anomalies between three sections and BH index (a) ; sliding correlation between the monthly mean ice velocity anomalies between three sections and DA index (b) (the corresponding black dashed lines represent the 90% confidence interval); plot with DA index and BH index as the x and y axes, and ice velocity anomalies during MYI transport interruptions at the NB Section as the z-axis (c); Similar plot for the EC Section (d)
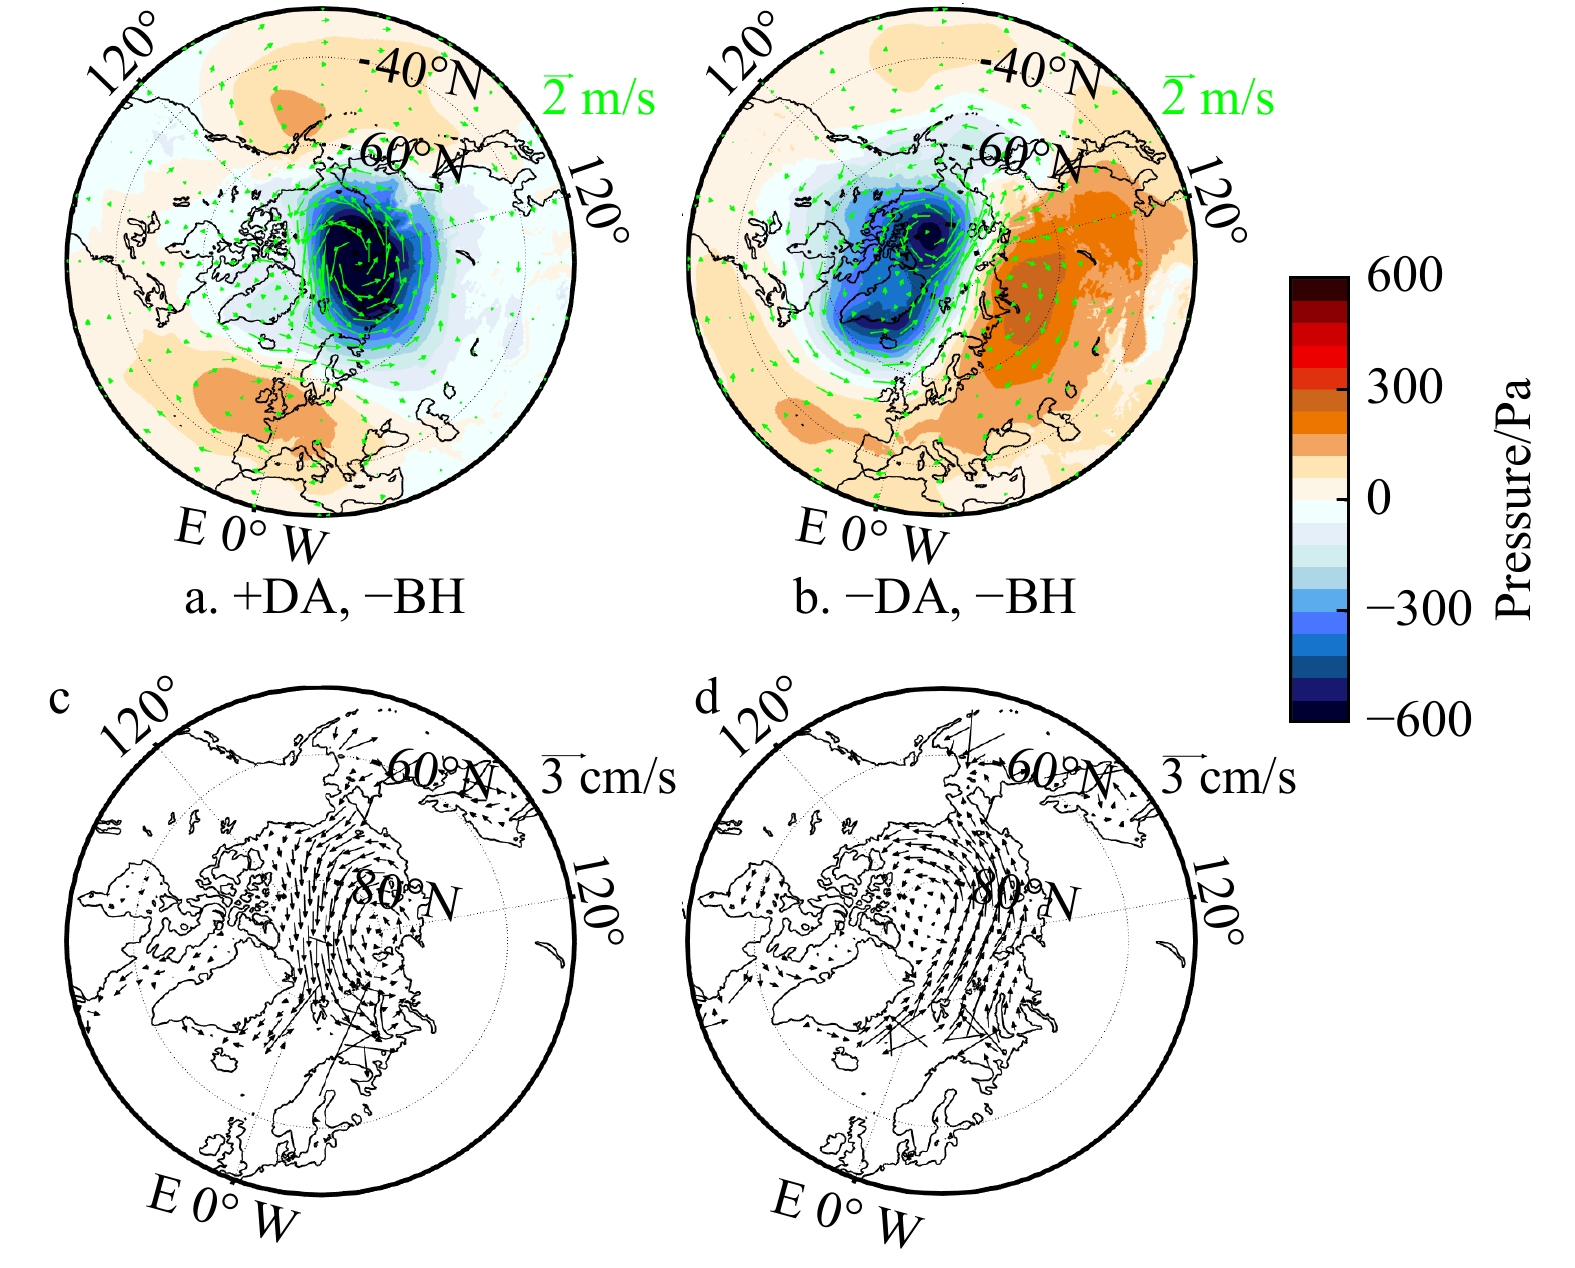
图 15 DA(+)指数、 BH(−)指数背景下海平面气压、10 m风速距平(a)和冰速距平的合成(c); DA(−)指数、BH(−)指数背景下海平面气压、10 m风速距平(b)和冰速距平的合成(d)
Fig. 15 Composite variations under DA (+) index and BH (−) index conditions: sea level pressure, 10 m wind velocity anomalies (a); ice velocity anomalies (c). Composite variations under DA (−) index and BH (−) index conditions: sea level pressure, 10 m wind velocity anomalies (b); ice velocity anomalies (d)
表 1 北极冻结季各断面冰速为0引起的MYI输运中断时间
Tab. 1 Duration of MYI transport interruptions caused by zero ice speed across different sections during the Arctic freezing season.
MYI输运中断发生时间 BH指数低于标准差 DA指数低于标准差 NB断面
(25,占比73%)1985.03;1988.12;1989.01;1989.02;1990.03;1991.04;1991.12;1992.10;1993.01;1994.12;1996.02;1996.03+;1997.04*;1998.03;1999.01;2000.10; 2005.04;2006.02+;2007.03;2009.02;2010.01;2011.03;2019.02;2020.03;2020.04 1985.03;1986.03;1987.01;1988.12;1989.01;1989.02;1990.02;1990.03;1990.04;1991.04;1991.12;1992.12;1993.01;1993.03;1993.11;1994.11;1994.12;1996.02+;1997.11;2003.12;2005.10+;2006.01+;2006.12;2008.10;2009.11;2011.02;2011.03;2011.04;2013.11;2014.04;2015.11;2017.01+;2017.03;2018.12;2019.02;2019.03;2020.02;2020.03;2020.04;2020.11;2021.03 1984.10;1985.02;1986.03;1986.10;1986.12;1987.04;1990.01;1990.02;1991.03;1992.04;1993.11;1994.03;1997.03*;1998.11;1999.01;1999.03;2000.01;2000.10;2000.11;2001.01;2002.12;2003.11;2004.03;2004.12*;2005.12;2006.01;2006.04;2007.03;2009.11;2010.02;2010.04;2011.02;2011.04;2012.01;2012.03;2014.01;2014.02;2015.10;2015.11;2016.01;2016.10;2016.11;2018.02;2020.11 W150°断面
(15,占比27%)1986.03;1989.01;1989.02;1990.03;1990.04;1993.01;1993.11;1996.03+;2005.01*;2007.03;2010.01;2011.03;2012.11;2017.03;2020.03 EC断面
(16,占比21%)1987.04;1990.02;1993.01;1993.11;1994.03;1999.01;2000.01;2001.12;2003.11;2005.01*;2005.11+;2006.01;2006.04;2012.01;2017.02+;2020.02 注:斜体字为BH指数低于标准差与MYI输运中断重合的时间,标注(+)为MYI输运中断的月份在BH指数低于标准差的月份之后1个月的时间,加粗字为DA指数低于标准差与MYI输运中断重合的时间,标注(*)为MYI输运中断的月份在DA指数低于标准差的月份之后1个月的时间。 -
[1] Kwok R. Arctic sea ice thickness, volume, and multiyear ice coverage: losses and coupled variability (1958−2018)[J]. Environmental Research Letters, 2018, 13(10): 105005. doi: 10.1088/1748-9326/aae3ec [2] Fowler C, Emery W J, Maslanik J. Satellite-derived evolution of Arctic sea ice age: October 1978 to March 2003[J]. IEEE Geoscience and Remote Sensing Letters, 2004, 1(2): 71−74. doi: 10.1109/LGRS.2004.824741 [3] Tschudi M, Fowler C, Maslanik J, et al. Tracking the movement and changing surface characteristics of Arctic sea ice[J]. IEEE Journal of Selected Topics in Applied Earth Observations and Remote Sensing, 2010, 3(4): 536−540. doi: 10.1109/JSTARS.2010.2048305 [4] Tschudi M A, Stroeve J C, Stewart J S. Relating the age of Arctic sea ice to its thickness, as measured during NASA’s ICESat and IceBridge campaigns[J]. Remote Sensing, 2016, 8(6): 457. doi: 10.3390/rs8060457 [5] Notz D, Community S. Arctic sea ice in CMIP6[J]. Geophysical Research Letters, 2020, 47(10): e2019GL086749. doi: 10.1029/2019GL086749 [6] Dyke A S, England J, Reimnitz E, et al. Changes in driftwood delivery to the Canadian arctic archipelago: the hypothesis of postglacial oscillations of the transpolar drift[J]. Arctic, 1997, 50(1): 1−16. [7] Perovich D K, Richter-Menge J A, Jones K F, et al. Sunlight, water, and ice: extreme Arctic sea ice melt during the summer of 2007[J]. Geophysical Research Letters, 2008, 35(11): L11501. [8] Proshutinsky A, Krishfield R, Timmermans M L, et al. Beaufort gyre freshwater reservoir: state and variability from observations[J]. Journal of Geophysical Research: Oceans, 2009, 114(C1): C00A10. [9] Nghiem S V, Rigor I G, Perovich D K, et al. Rapid reduction of Arctic perennial sea ice[J]. Geophysical Research Letters, 2007, 34(19): L19504. [10] Maslanik J, Stroeve J, Fowler C, et al. Distribution and trends in Arctic sea ice age through spring 2011[J]. Geophysical Research Letters, 2011, 38(13): L13502. [11] Kwok R. Sea ice convergence along the arctic coasts of Greenland and the Canadian arctic archipelago: variability and extremes (1992-2014)[J]. Geophysical Research Letters, 2015, 42(18): 7598−7605. doi: 10.1002/2015GL065462 [12] Babb D G, Galley R J, Kirillov S, et al. The stepwise reduction of multiyear sea ice area in the Arctic Ocean since 1980[J]. Journal of Geophysical Research: Oceans, 2023, 128(10): e2023JC020157. doi: 10.1029/2023JC020157 [13] Bi Haibo, Liang Yu, Wang Yunhe, et al. Arctic multiyear sea ice variability observed from satellites: a review[J]. Journal of Oceanology and Limnology, 2020, 38(4): 962−984. doi: 10.1007/s00343-020-0093-7 [14] Mahoney A R, Hutchings J K, Eicken H, et al. Changes in the thickness and circulation of multiyear ice in the Beaufort Gyre determined from pseudo-Lagrangian methods from 2003−2015[J]. Journal of Geophysical Research: Oceans, 2019, 124(8): 5618−5633. doi: 10.1029/2018JC014911 [15] Kwok R, Cunningham G F. Contribution of melt in the Beaufort Sea to the decline in Arctic multiyear sea ice coverage: 1993−2009[J]. Geophysical Research Letters, 2010, 37(20): L20501. [16] Babb D G, Galley R J, Howell S E L, et al. Increasing multiyear sea ice loss in the Beaufort Sea: a new export pathway for the diminishing multiyear ice cover of the Arctic Ocean[J]. Geophysical Research Letters, 2022, 49(9): e2021GL097595. doi: 10.1029/2021GL097595 [17] Kwok R, Spreen G, Pang S. Arctic sea ice circulation and drift speed: decadal trends and ocean currents[J]. Journal of Geophysical Research: Oceans, 2013, 118(5): 2408−2425. doi: 10.1002/jgrc.20191 [18] Sumata H, De Steur L, Divine D V, et al. Regime shift in Arctic Ocean sea ice thickness[J]. Nature, 2023, 615(7952): 443−449. doi: 10.1038/s41586-022-05686-x [19] Wang Xiaoyu, Zhao Jinping. Seasonal and inter-annual variations of the primary types of the Arctic sea-ice drifting patterns[J]. Advances in Polar Science, 2012, 23(2): 72−81. [20] Serreze M C, Barrett A P. Characteristics of the Beaufort Sea high[J]. Journal of Climate, 2011, 24(1): 159−182. doi: 10.1175/2010JCLI3636.1 [21] Kwok R. Exchange of sea ice between the Arctic Ocean and the Canadian arctic archipelago[J]. Geophysical Research Letters, 2006, 33(16): L16501. [22] Proshutinsky A Y, Johnson M A. Two circulation regimes of the wind-driven Arctic Ocean[J]. Journal of Geophysical Research: Oceans, 1997, 102(C6): 12493−12514. doi: 10.1029/97JC00738 [23] Mysak L A. Patterns of Arctic circulation[J]. Science, 2001, 293(5533): 1269−1270. doi: 10.1126/science.1064217 [24] Rigor I G, Wallace J M, Colony R L. Response of sea ice to the Arctic Oscillation[J]. Journal of Climate, 2002, 15(18): 2648−2663. doi: 10.1175/1520-0442(2002)015<2648:ROSITT>2.0.CO;2 [25] Wu Bingyi, Wang Jia, Walsh J E. Dipole anomaly in the winter Arctic atmosphere and its association with sea ice motion[J]. Journal of Climate, 2006, 19(2): 210−225. doi: 10.1175/JCLI3619.1 [26] Vihma T, Tisler P, Uotila P. Atmospheric forcing on the drift of Arctic sea ice in 1989−2009[J]. Geophysical Research Letters, 2012, 39(2): L02501. [27] 施骞. Fram海峡海冰面积通量估算及变化研究[D]. 山东: 中国海洋大学, 2018. Shi Qian. Study on the estimation and variability of Sea Ice Flux in the Fram strait[D]. Ocean University of China, 2018: 1−95. [28] Wang Yunhe, Bi Haibo, Liang Yu. A satellite-observed substantial decrease in multiyear ice area export through the Fram Strait over the last decade[J]. Remote Sensing, 2022, 14(11): 2562. doi: 10.3390/rs14112562 [29] Woodgate R A, Weingartner T, Lindsay R. The 2007 Bering Strait oceanic heat flux and anomalous Arctic sea-ice retreat[J]. Geophysical Research Letters, 2010, 37(1): L01602. [30] Serreze M C, Crawford A D, Stroeve J C, et al. Variability, trends, and predictability of seasonal sea ice retreat and advance in the Chukchi Sea[J]. Journal of Geophysical Research: Oceans, 2016, 121(10): 7308−7325. doi: 10.1002/2016JC011977 [31] Lukovich J V, Barber D G. Atmospheric controls on sea ice motion in the southern Beaufort Sea[J]. Journal of Geophysical Research: Atmospheres, 2006, 111(D18): D18103. [32] Tschudi M, Meier W N, Stewart J S, et al. EASE-grid sea ice age, version 4[R]. Colorado: NASA National Snow and Ice Data Center Distributed Active Archive Center, 2019. [33] DiGirolamo N E, Parkinson C L, Cavalieri D J, et al. Sea ice concentrations from nimbus-7 SMMR and DMSP SSM/I-SSMIS passive microwave data, version 2[R]. Colorado: NASA National Snow and Ice Data Center Distributed Active Archive Center, 2022. [34] Steffen K, Schweiger A. NASA team algorithm for sea ice concentration retrieval from defense meteorological satellite program special sensor microwave imager: comparison with Landsat satellite imagery[J]. Journal of Geophysical Research: Oceans, 1991, 96(C12): 21971−21987. doi: 10.1029/91JC02334 [35] Tschudi M, Meier W N, Stewart J S, et al. Polar pathfinder daily 25 km EASE-Grid sea ice motion vectors6, version 4[R]. Colorado: NASA National Snow and Ice Data Center Distributed Active Archive Center, 2019. [36] Zhang Minghong, Perrie W, Long Zhenxia. Decadal variations in the winter Beaufort high and the stratospheric polar vortex[J]. Geophysical Research Letters, 2019, 46(9): 4933−4941. doi: 10.1029/2018GL081426 [37] 王维波, 苏洁. 基于形态学的海冰外缘线自动提取[J]. 遥感学报, 2015, 19(6): 983−997.Wang Weibo, Su Jie. Sea ice edge automatic retrieval based on morphology[J]. Journal of Remote Sensing, 2015, 19(6): 983−997. [38] Tschudi M A, Meier W N, Stewart J S. An enhancement to sea ice motion and age products at the National Snow and Ice Data Center (NSIDC)[J]. The Cryosphere, 2020, 14(5): 1519−1536. doi: 10.5194/tc-14-1519-2020 [39] Zhao Yunhe, Liu A K. Arctic sea-ice motion and its relation to pressure field[J]. Journal of Oceanography, 2007, 63(3): 505−515. doi: 10.1007/s10872-007-0045-2 [40] Chang Xiaomin, Yan Tongliang, Zuo Guangyu, et al. Changes in Beaufort high and their impact on sea ice motion in the western arctic during the winters of 2001−2020s[J]. Journal of Marine Science and Engineering, 2024, 12(1): 165. doi: 10.3390/jmse12010165 [41] Kenigson J S, Timmermans M L. Arctic cyclone activity and the Beaufort high[J]. Journal of Climate, 2021, 34(10): 4119−4127. doi: 10.1175/JCLI-D-20-0771.1 [42] Wang Jia, Zhang Jinlun, Watanabe E, et al. Is the dipole anomaly a major driver to record lows in Arctic summer sea ice extent?[J]. Geophysical Research Letters, 2009, 36(5): L05706. -


 下载:
下载:


