

Effects of a subsurface abnormal anticyclonic eddy on sound propagation in the northwest continental slope of the South China Sea
-
摘要: 基于2018年4月温盐流断面观测、卫星遥感和模式再分析数据,本文分析了南海西北部陆坡海区一个异常反气旋涡的声场特性与声传播效应。结果表明,该反气旋具有透镜式温盐结构、表层冷核和更浅的混合层深度,流速次表层强化。不同于正常反气旋涡声速等值线的下凹,异常反气旋涡声速分布呈现上凸下凹的透镜式结构。涡心表层声速小于涡外,呈现负异常(<−2 m/s),次表层则为正异常(>11 m/s),这使得原有海区声速双跃层厚度上下延伸共47 m。当声源位于涡外陆架向外海传播时,与正常反气旋涡旋相反,异常反气旋涡破坏表面声道,减小声传播距离;声源在涡外深海向陆架传播时,异常反气旋涡则与正常反气旋涡类似,声能汇聚区的位置相比无涡旋时后移和下移,最大距离分别超过24 km和0.3 km。声源位于涡旋内部向外海传播时,异常反气旋涡使得声线反转深度加深,声能汇聚区间距加大1倍,正常反气旋涡中则未见这一现象。Abstract: Using temperature-salinity profiles and current measurements, satellite data and reanalysis data in April 2018, this study analyses the acoustic field characteristics and effects of an abnormal anticyclonic eddy (AAE) on acoustic propagation on the continental slope area in the northwestern South China Sea (SCS). The results show that the AAE has a lens-shaped structure with a surface cold core, a shallower mixed layer, and subsurface intensified velocities. Unlike the concave sound-speed contours in the normal anticyclonic eddy (NAE), the sound-speed distribution in the abnormal anticyclonic eddy (AAE) exhibits a lens-shaped structure with an upward convexity and downward concavity. The surface sound speed within the eddy is lower than that outside, showing a negative anomaly (<−2 m/s). Conversely, the sound speed in the subsurface layer of the eddy is higher than that outside, showing a positive anomaly (>11 m/s). This results in the thickness of the original double thermocline extending up and down by a total of 47 meters in the presence of the eddy. As the sound propagates from the eddy outside on the shelf to the deep sea, the surface sound channel disappears as the propagation distances decreasing in the AAE, contrast to the increased distance in the NAE. As the sound propagates from the eddy outside in the deep ocean to the shelf, the location of the sound energy convergence zone moves backward and downward in the AAE, with the maximum distance exceeding 24 km and 0.3 km, respectively. This is similar to the situation in the NAE. As the sound propagates from the eddy core to outside in the deep sea, the turning depth of the sound deepens and the distance between the sound energy convergence zones doubles in the AAE, while no changes in the NAE.
-

图 1 2018年4月22日(a)、4月19日(b)、4月24日(c)海面高度异常分布(黑色实线,单位为cm)与海面地转流场分布(橙色箭头,单位为m/s)、2018年4月19日至24日观测站位(红色圆点为站位,B、D为断面名称)、南海西北部地形图(图中颜色,水深单位为m)以及HYCOM数据(黄色虚线表示来自HYCOM数据的连续断面)
Fig. 1 Topography (color, unit in m) and sea level anomaly (black solid line, unit in cm) on April 22 (a) , April 19 (b), and April 24 (c) , 2018 in the northwestern South China Sea. Orange arrows represent the surface geostrophic currents (unit in m/s). Observationstations on sections B and D conducted on 19−24 April 2018 are shown as red dots. Dashed yellow line representsthe continuous section from HYCOM data
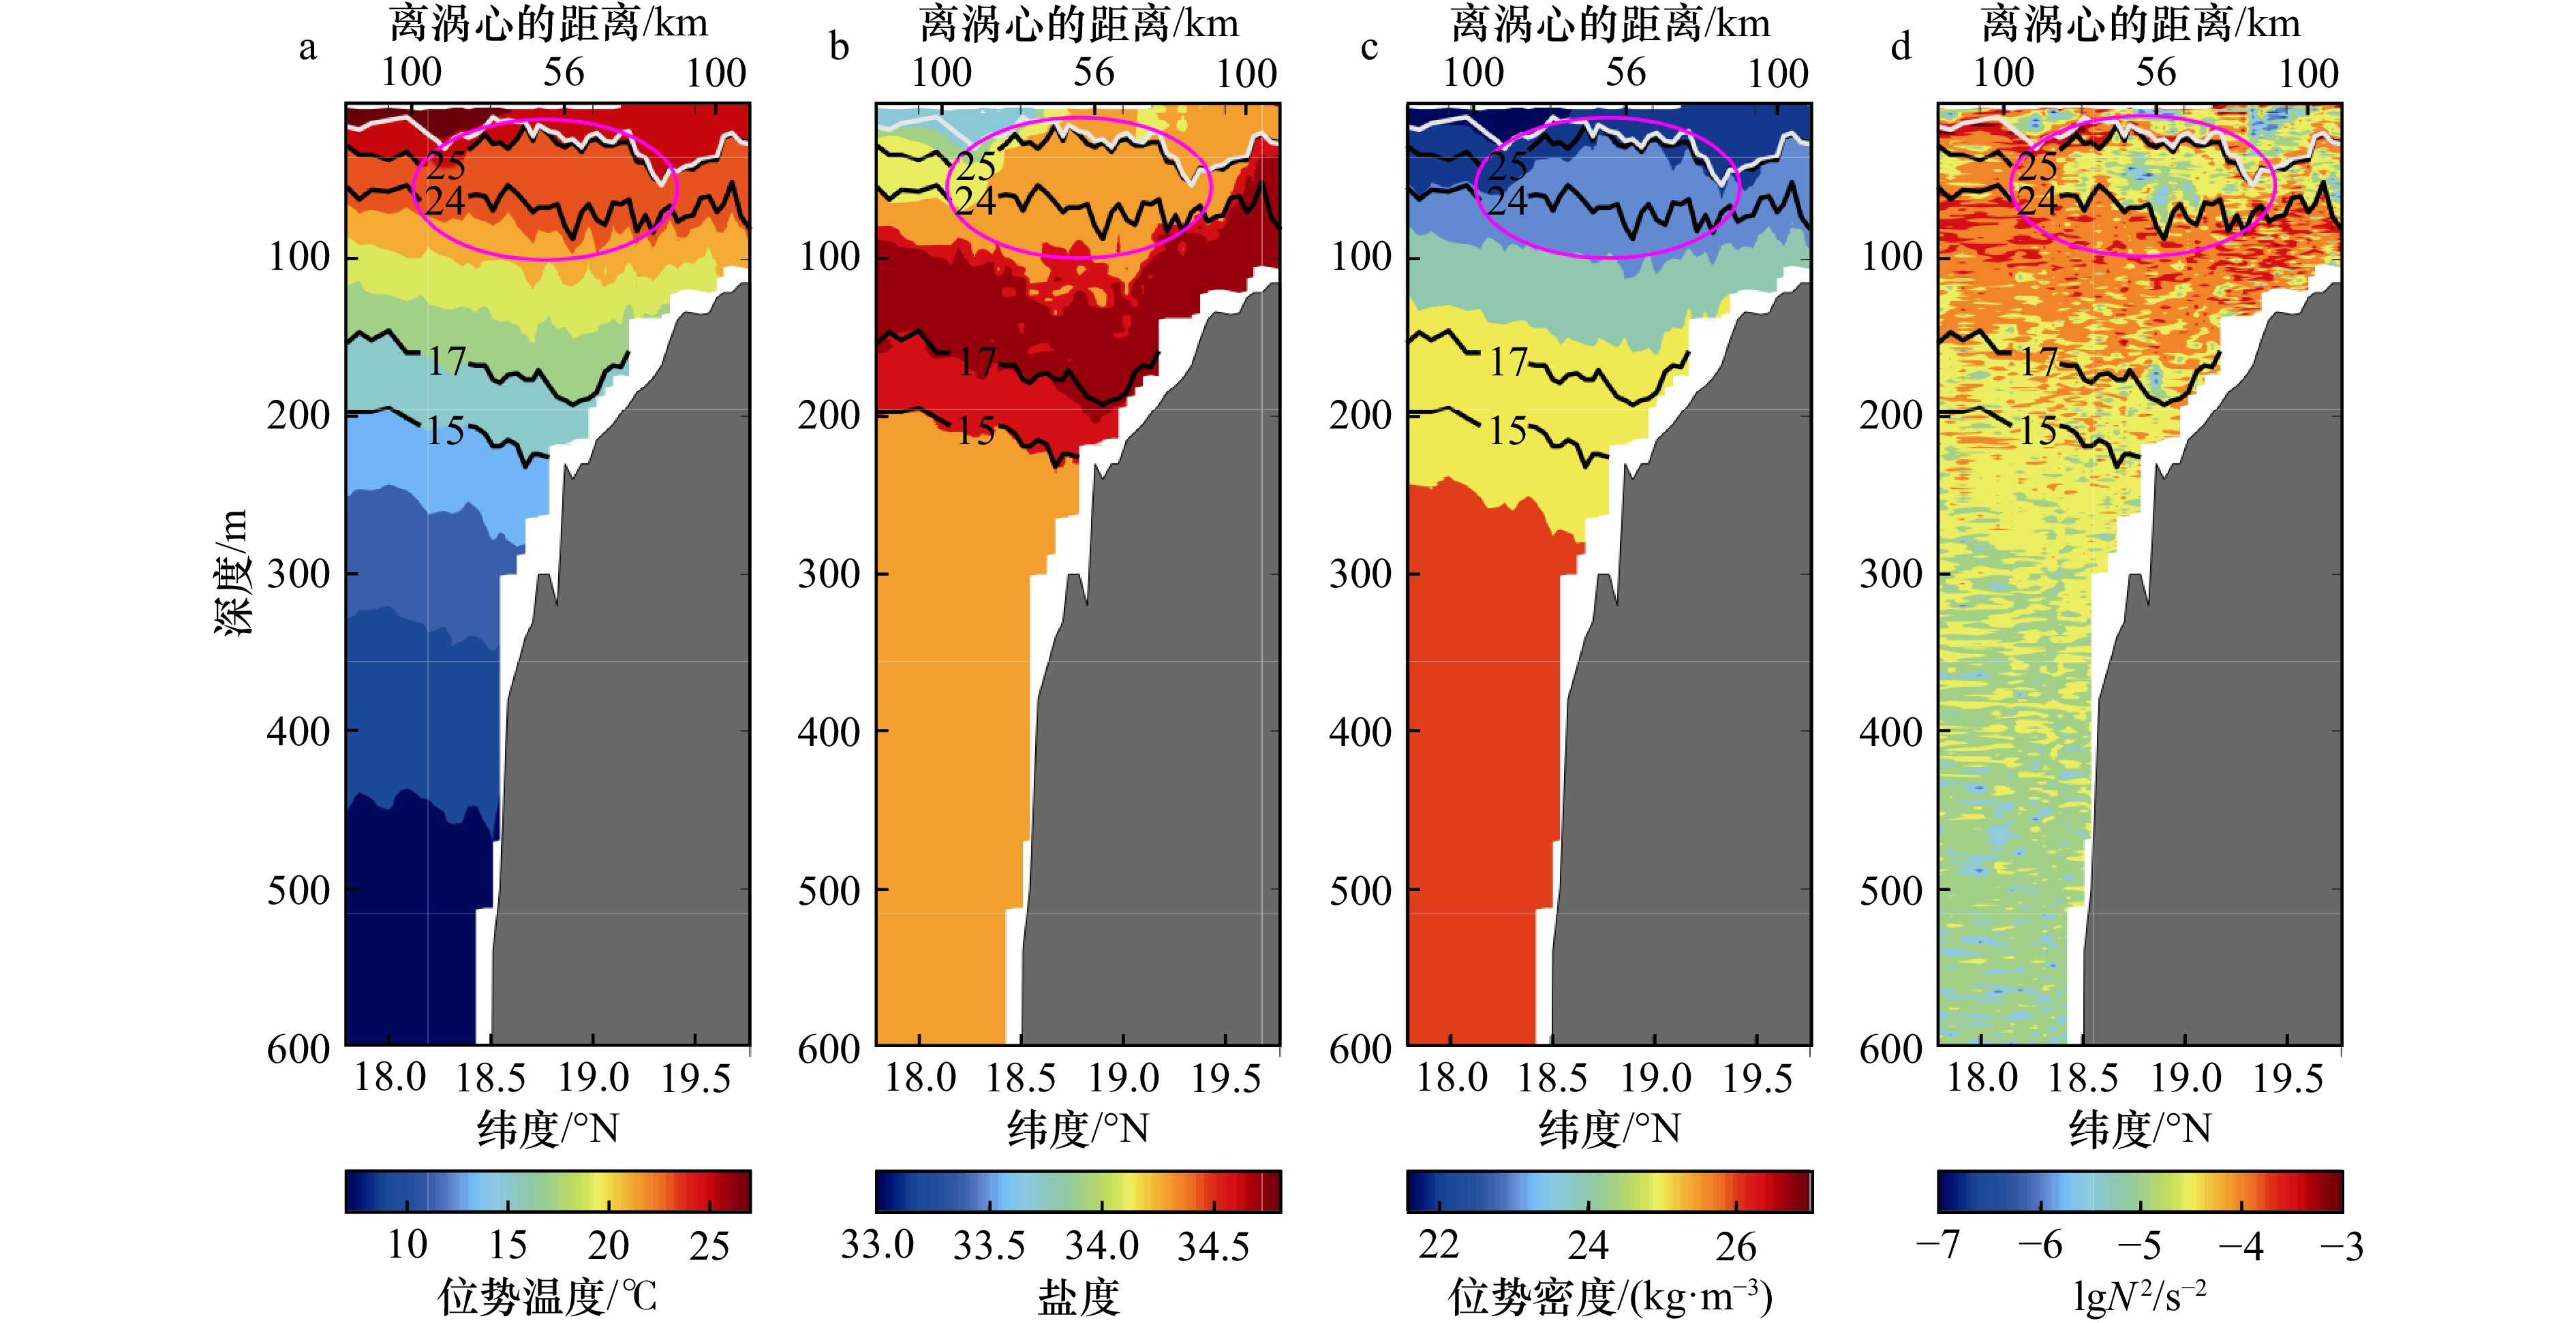
图 2 B断面上位势温度(a)、盐度(b) 、位势密度(c)、浮力频率(对数,lgN2)(d)分布
白色线为混合层深度,黑色实线分别为25℃,24℃,17℃和15℃等温线,紫色椭圆示出透镜结构所在位置
Fig. 2 Distribution of potential temperature (a), salinity (b) , potential density (c) and buoyancy frequency (lgN2) (d) along Section B
White lines indicate the mixed-layer depth. Black solid lines represent isotherm contours of 25℃, 24℃, 17℃, and 15℃. Purple ellipse shows the location of the lens structure
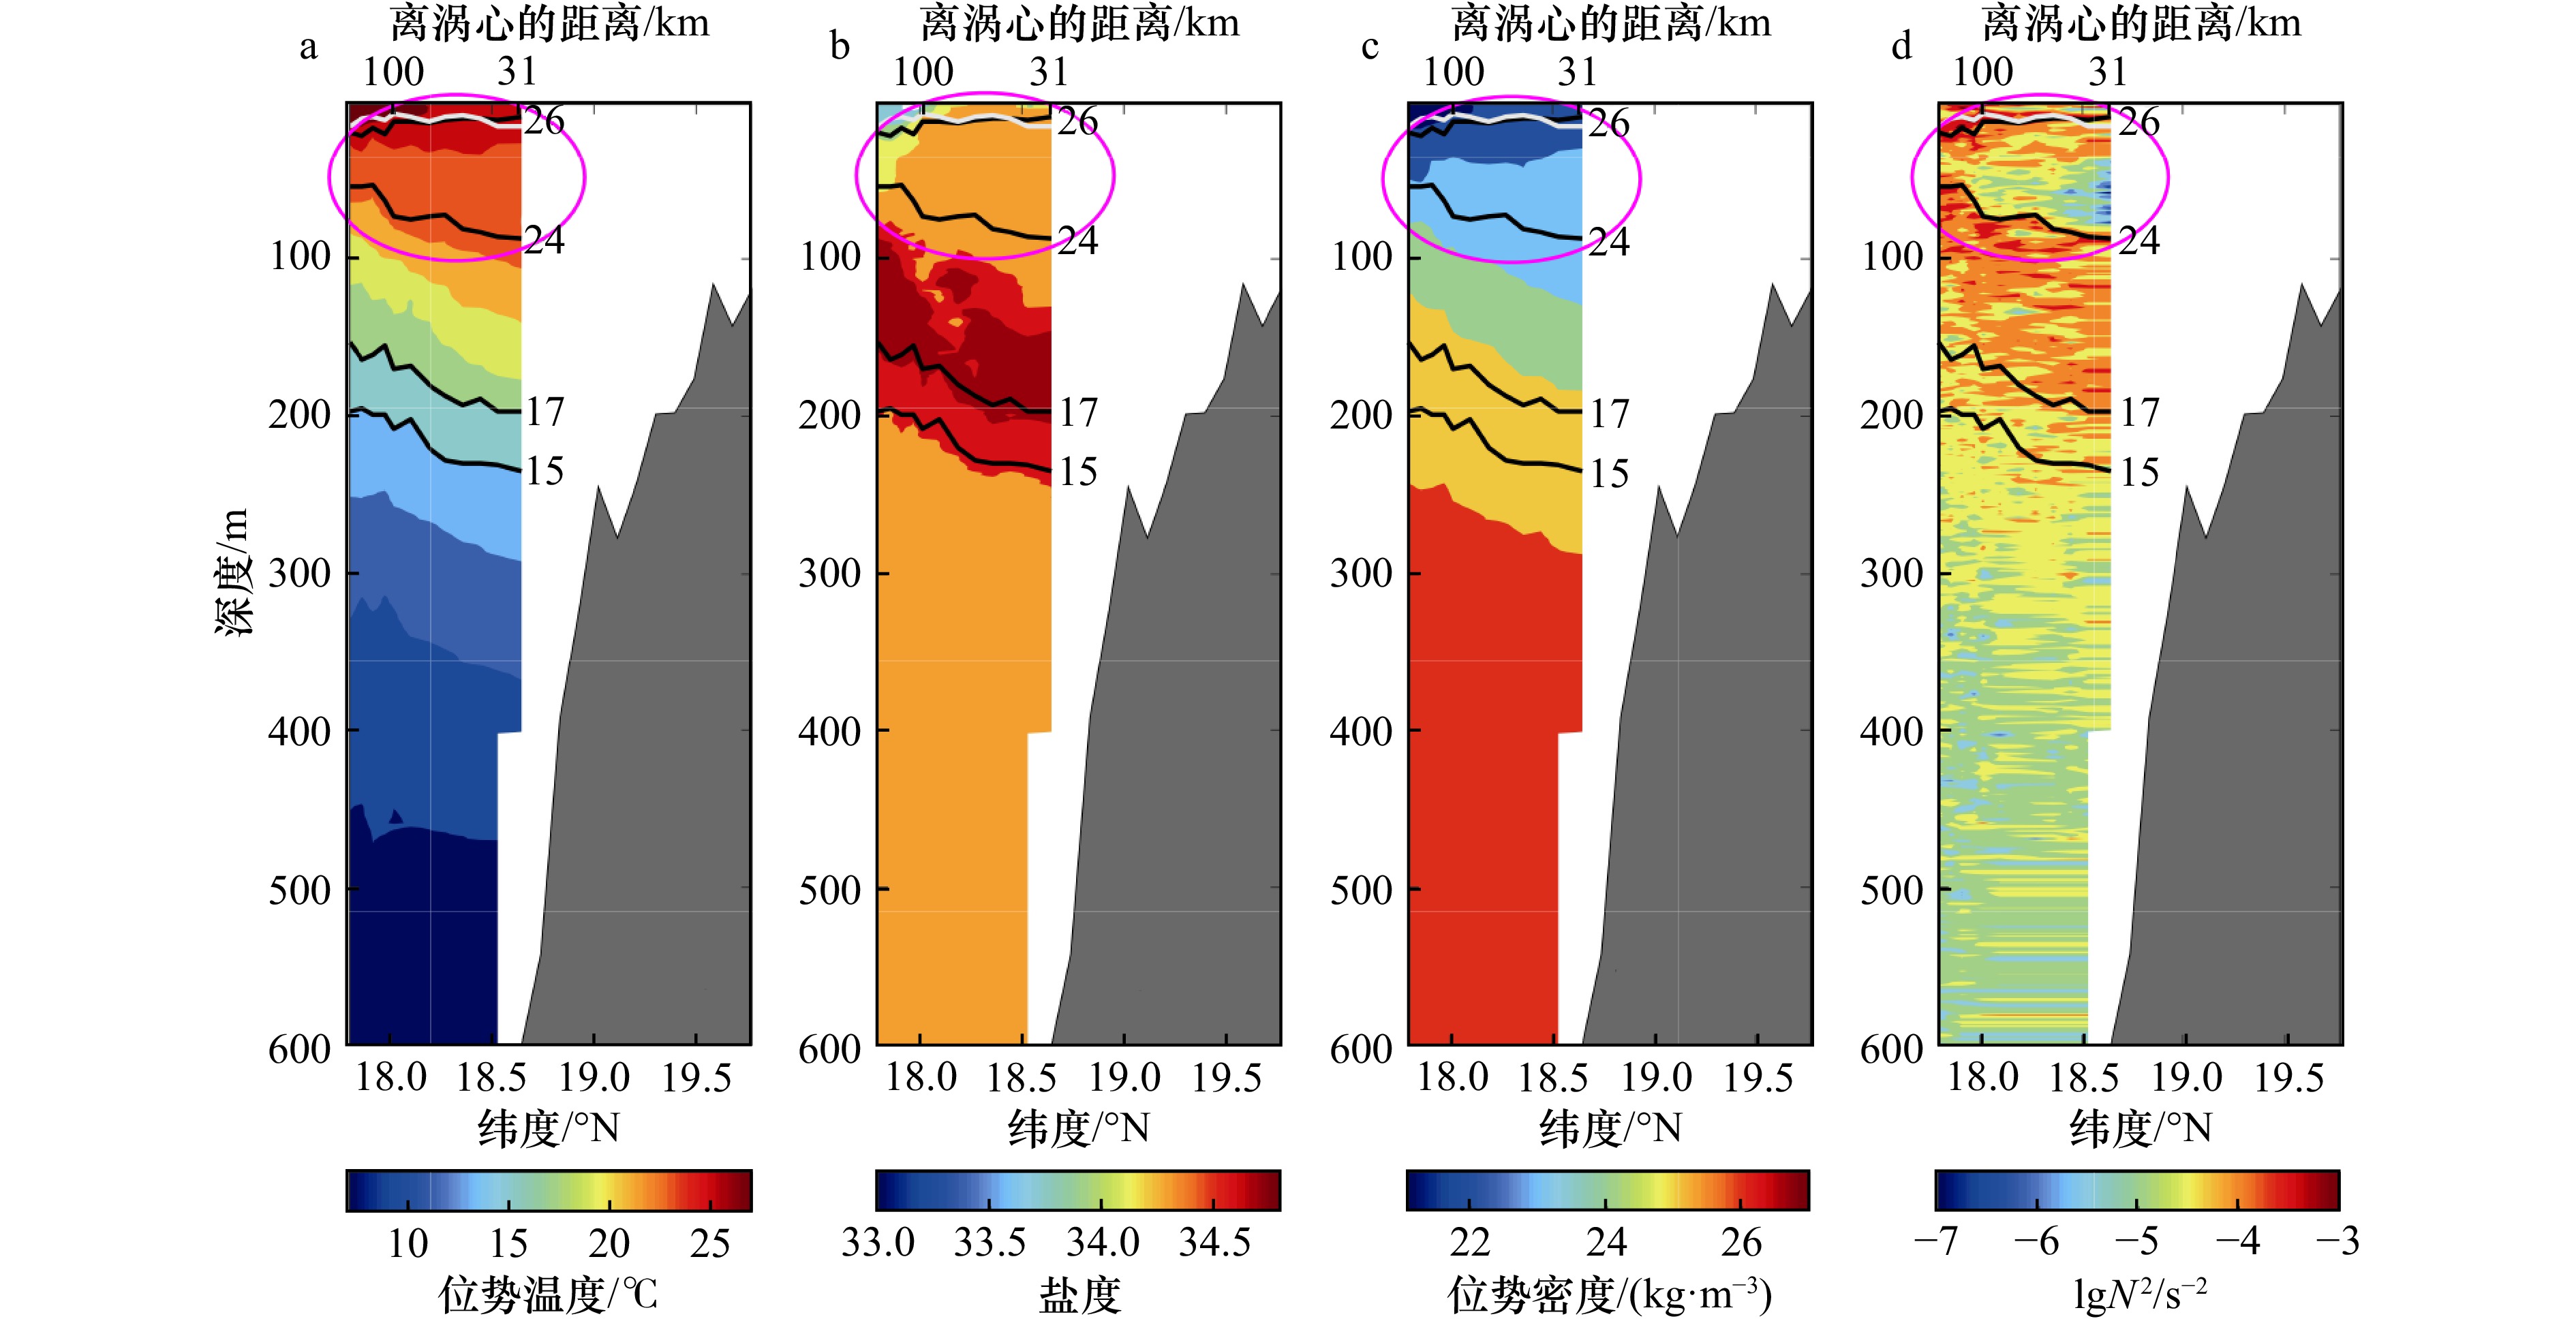
图 3 D断面上位势温度(a)、盐度(b) 、位势密度(c)、浮力频率(对数,lgN2)(d)分布
白色线为混合层深度,黑色实线分别为26℃,24℃,17℃和15℃等温线,紫色椭圆示出透镜结构所在位置
Fig. 3 Distribution of potential temperature (a), salinity (b) , potential density (c) and buoyancy frequency (lgN2) (d) along Section D
White lines indicate the mixed-layer depth. Black solid lines represent isotherm contours of 26℃, 24℃, 17℃, and 15℃. Purple ellipse shows the location of the lens structure

图 4 2018年4月15−22日,南海西北部海面温度异常(SSTA)8天复合卫星图(图中颜色,单位为℃)、 2018年4月22日海面高度异常分布(黑色实线,单位为cm)、2018年4月19−24日观测站位(黑色圆点为站位,B、D为断面名称)
Fig. 4 Composite satellite-observed sea surface temperature anomaly (SSTA) in the northwest of South China Sea for 8 days from April 15 to 22, 2018 (color, unit: ℃). Black contours represent sea level anomaly on April 22, 2018 (unit: cm), and observation stations are indicate by black dots with section B and D
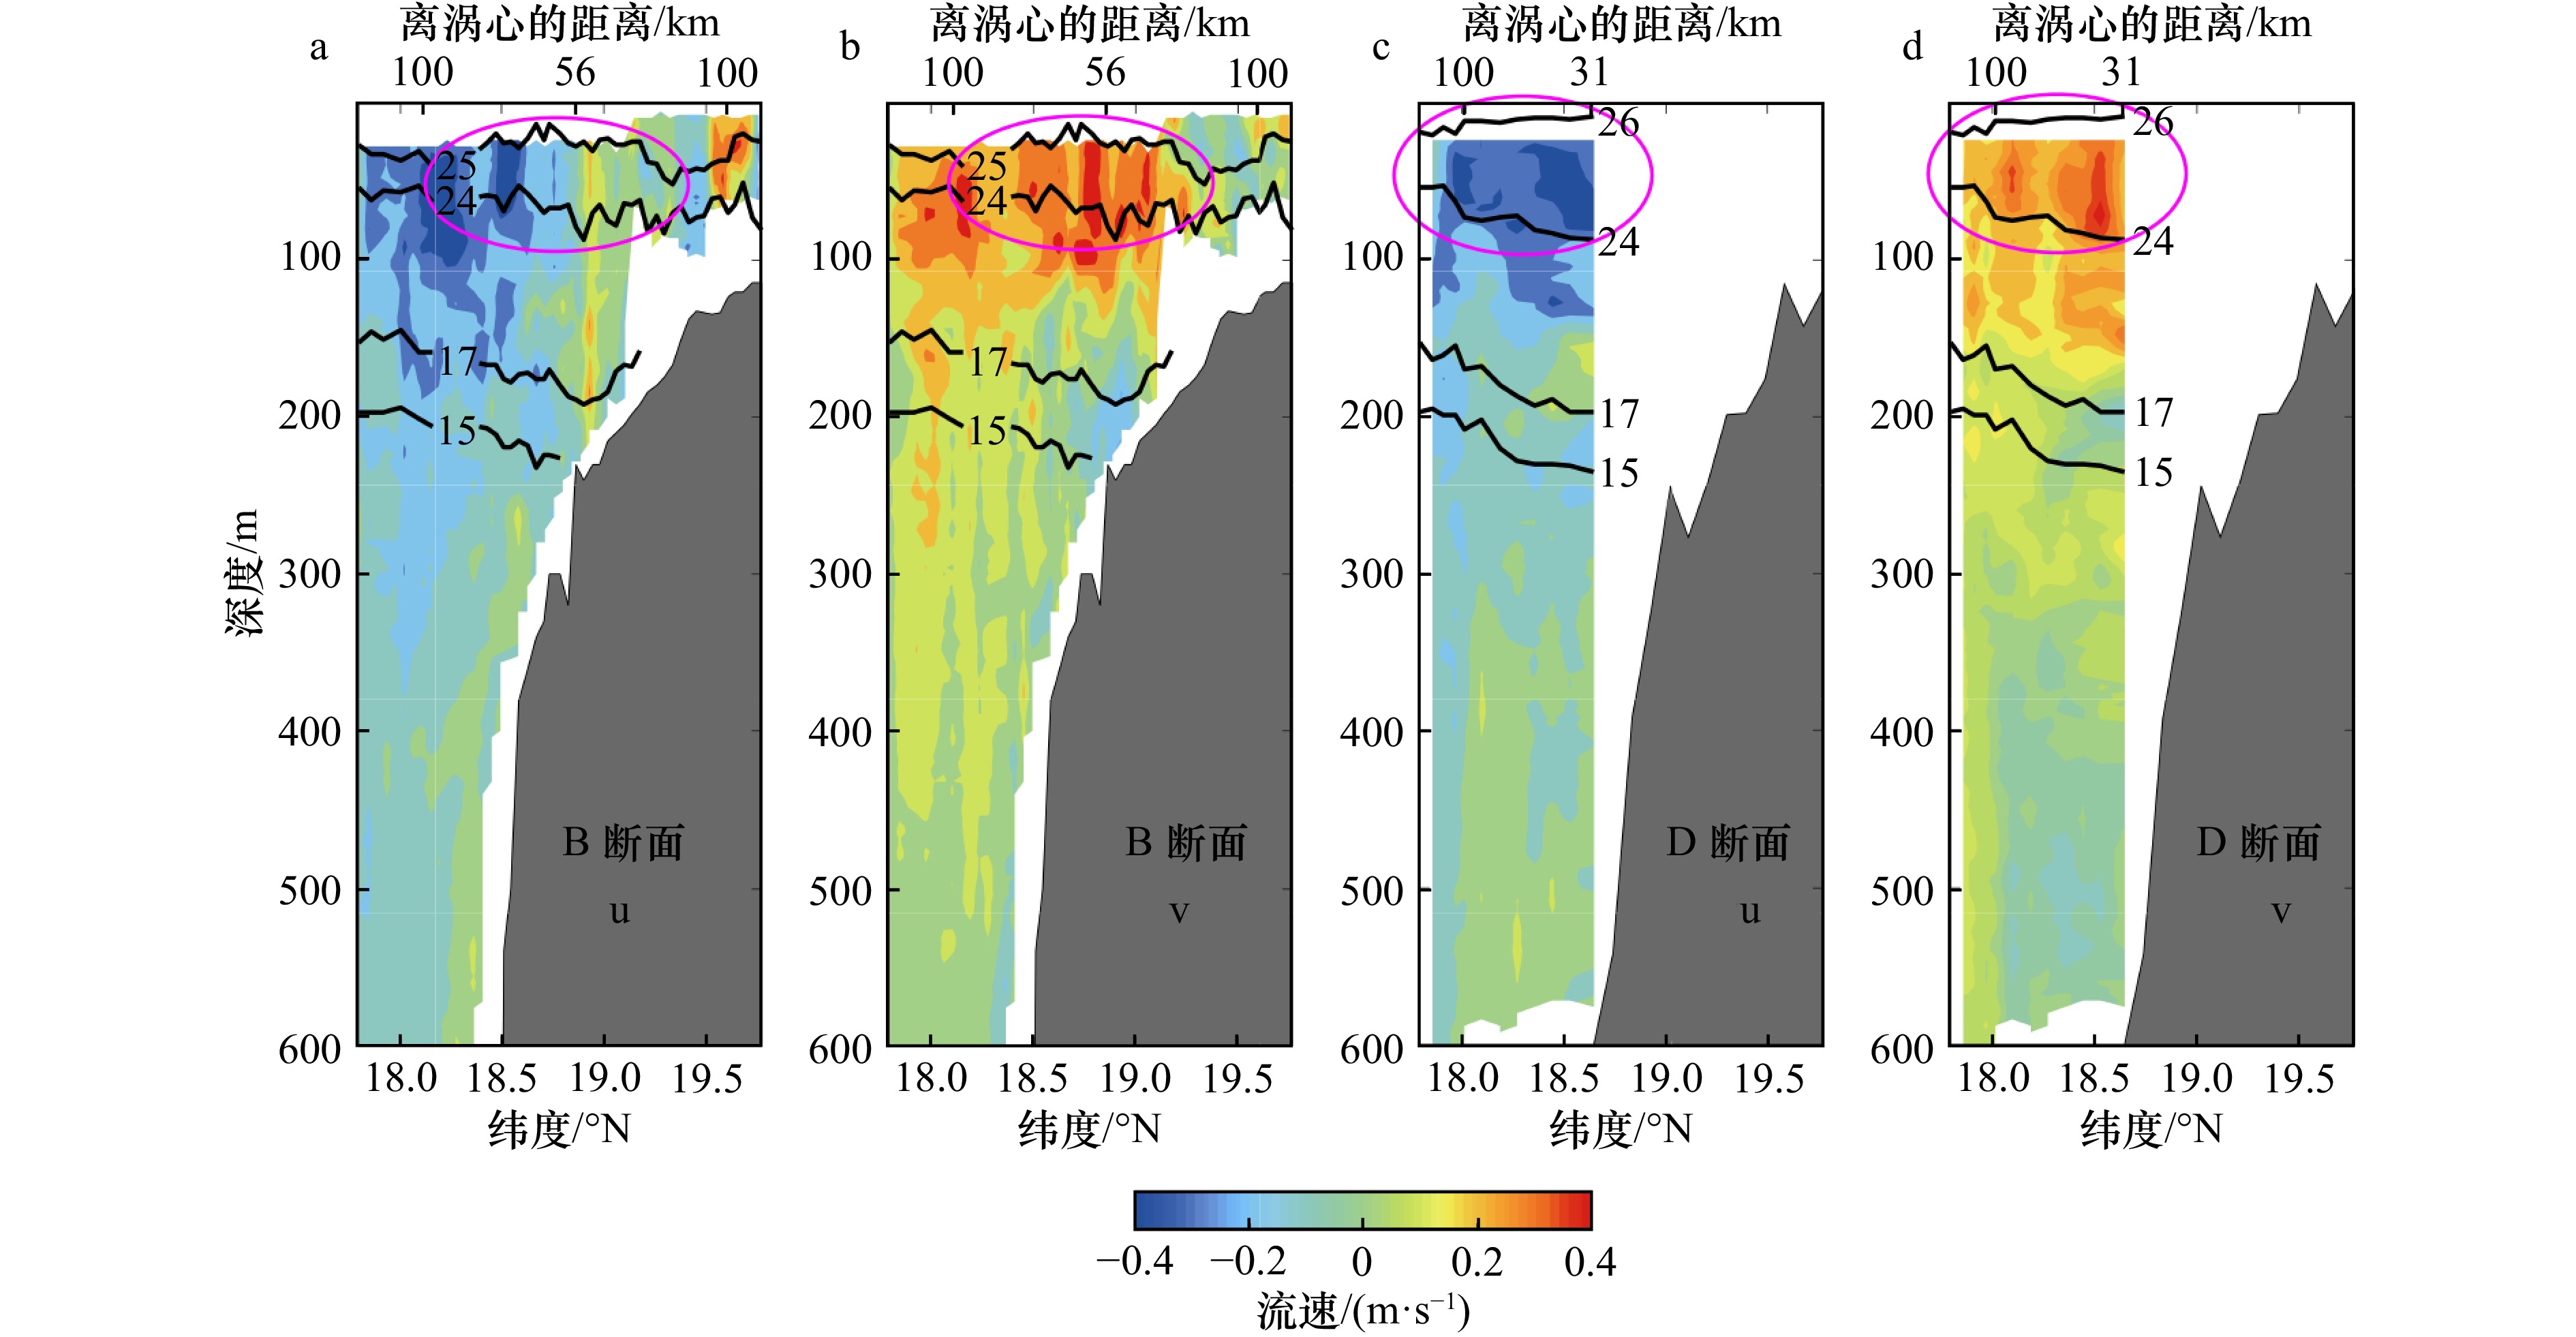
图 5 B、D断面上纬向流速(a、c)、经向流速(b、d)
黑色线为等温线,分别为26℃,24℃,17℃和15℃,紫色椭圆示出透镜结构所在位置
Fig. 5 Distribution of zonal velocity (a, c) and meridional velocity (b, d) along sections B (a, b) and D (c, d)
Black lines represent isotherms at 26℃, 24℃, 17℃ and 15℃. Purple ellipse shows the location of the lens structure
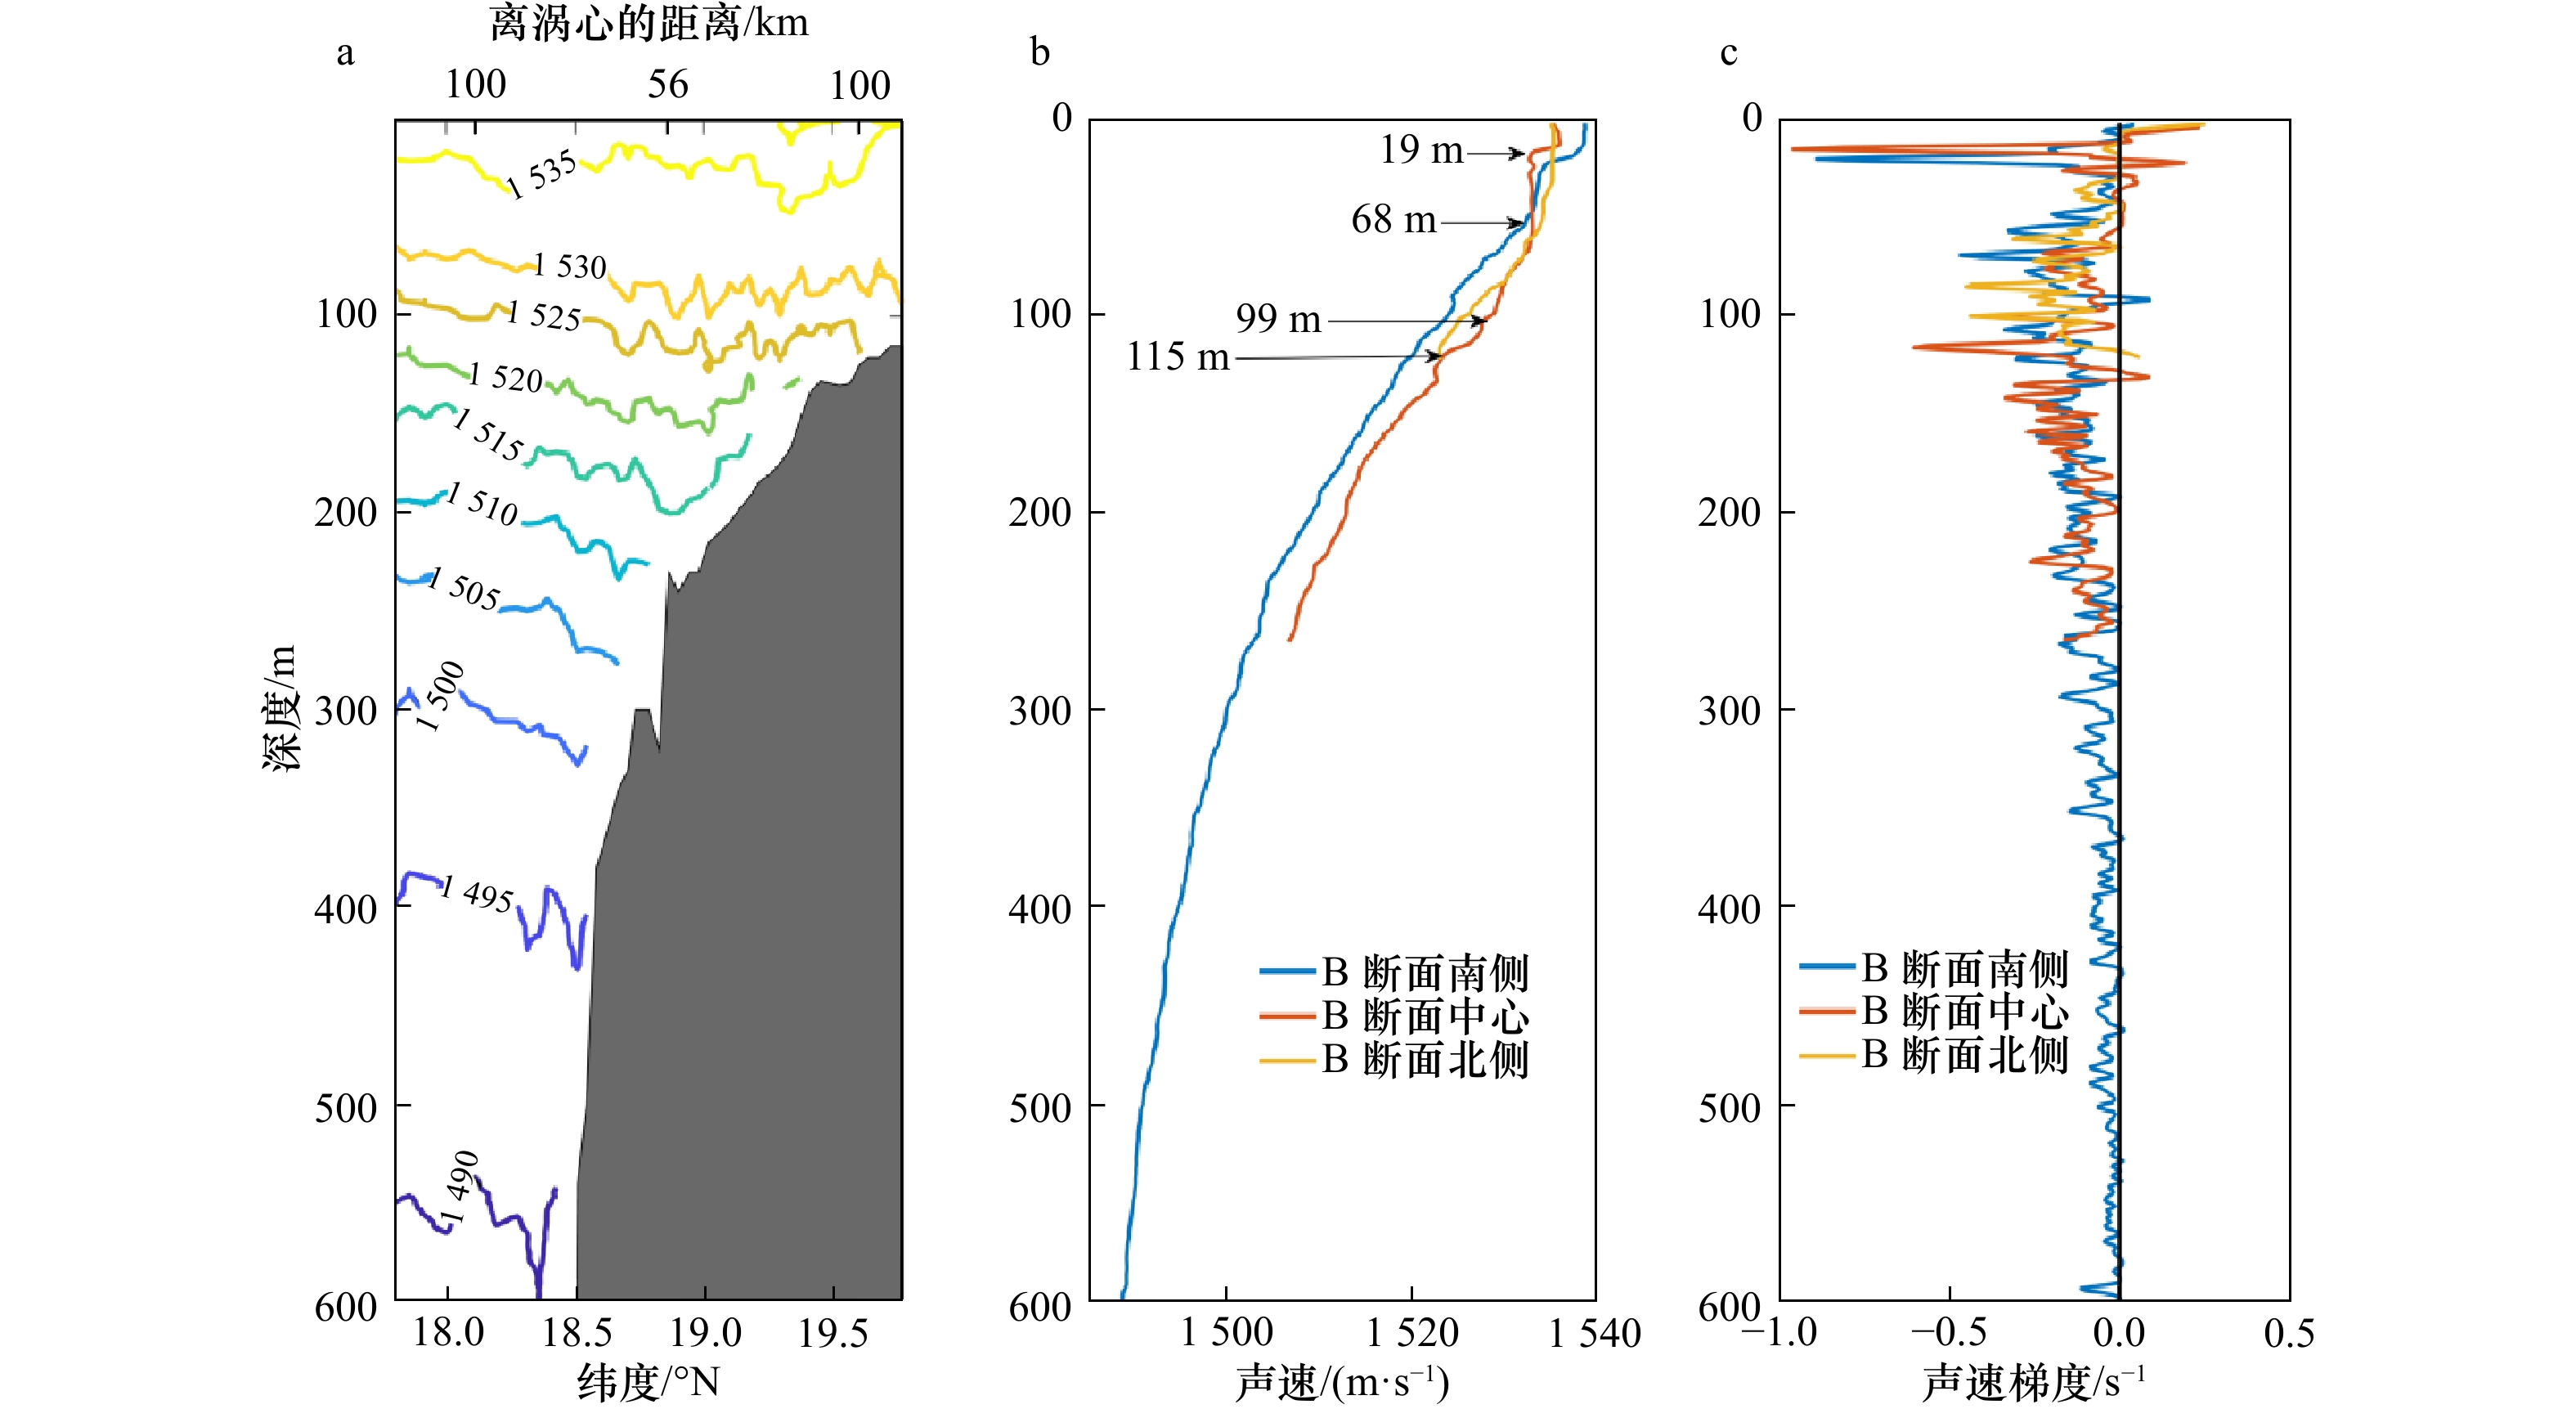
图 6 B断面上声速场(a)、声速剖面(b)、声速梯度(c)
图c中黑色实线为声速梯度等于0 s−1
Fig. 6 Sound speed section (a) , sound speed profiles (b) and sound speed gradient profiles (c) on section B
Black solid line in panel c) indicates a sound speed gradient of 0 s−1
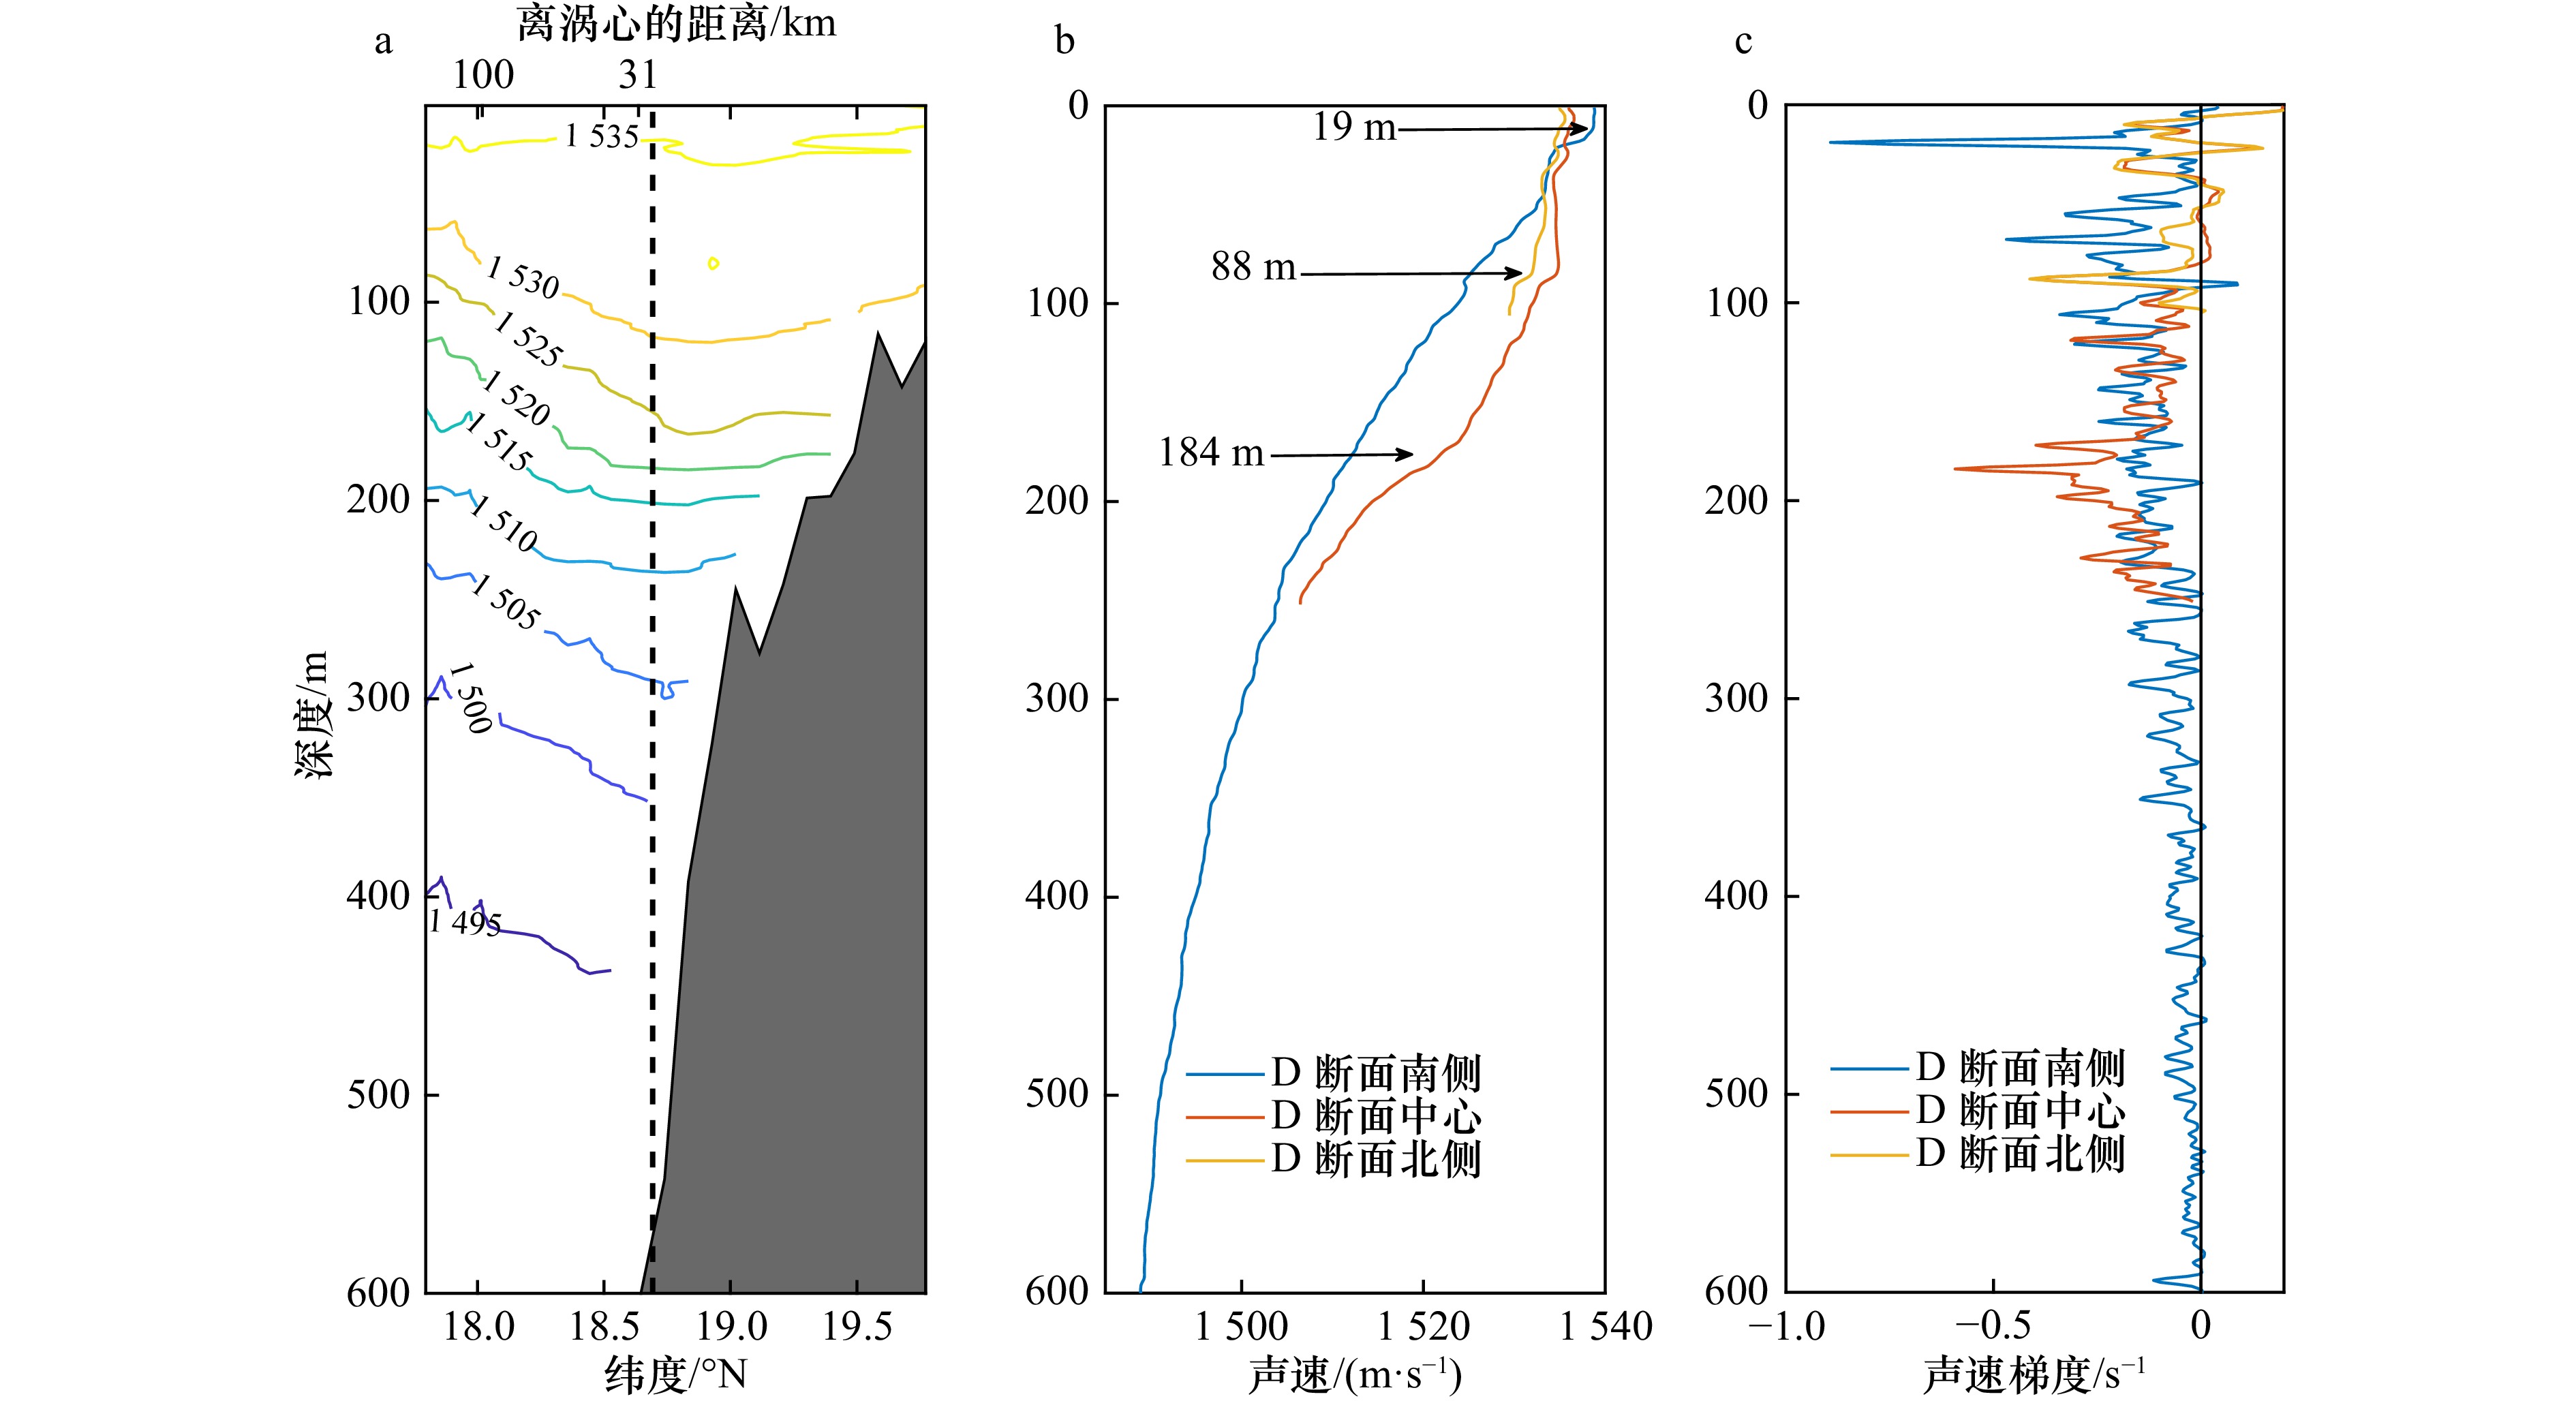
图 7 D断面上声速场(a)、声速剖面(b)、声速梯度(c)
图a中黑色虚线左侧为实测数据,右侧为模式数据,图c中黑色实线为声速梯度等于0 s−1
Fig. 7 Sound speed section (a), sound speed profiles (b) and sound speed gradient profiles (c) on Section D
Black dashed line in panel a seperates the measured data on the left side and the model data on the right side. Black solid line in panel c indicates a sound speed gradient of 0 s−1
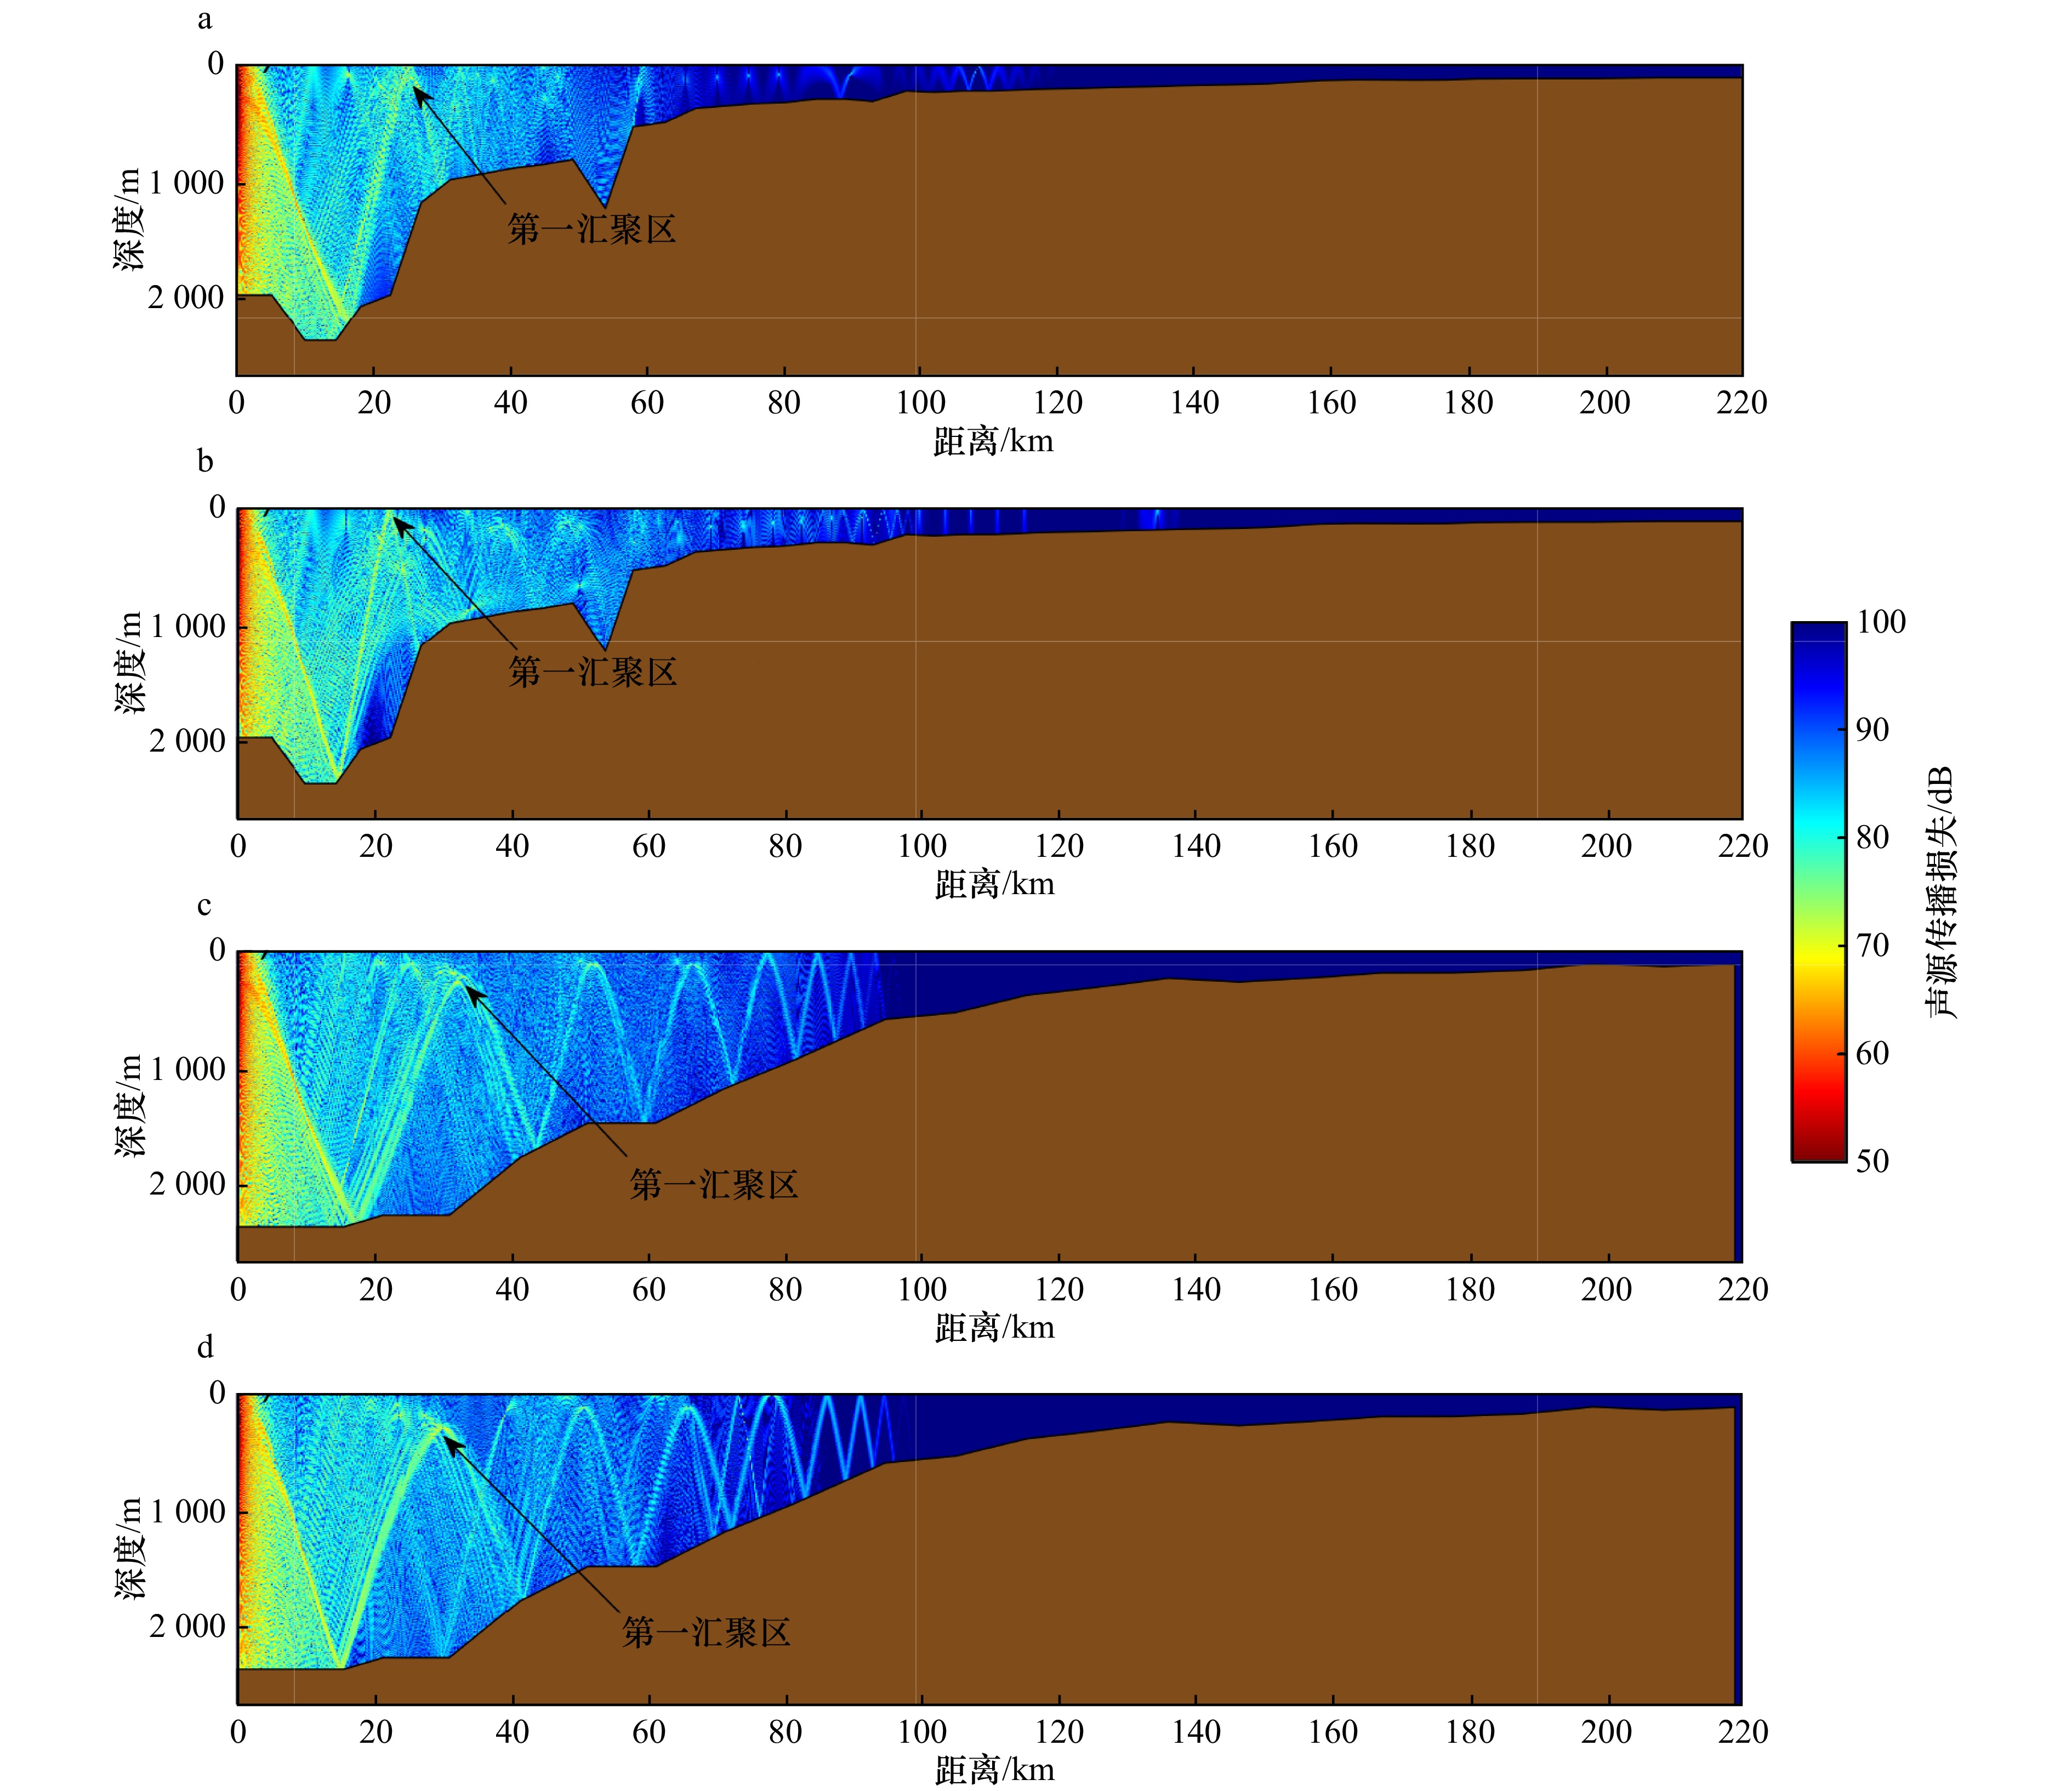
图 8 声源位于异常涡旋外侧深海区300 m深度时的传播损失
a,b. 穿过B断面,c,d. 穿过D断面;a,c. 有涡,b,d. 无涡
Fig. 8 Transmission loss as sound source located at 300 m in the deep-water side
a, b. Along Section B, c, d. along Section D. a, c. With the abnormal anticyclonic eddy, b, d. without the abnormal anticyclonic eddy

图 9 声源位于异常涡旋外侧深海区水深500 m时的传播损失
a,b. 穿过B断面,c,d. 穿过D断面;a,c. 有涡,b,d. 无涡
Fig. 9 Transmission loss as sound source located at 500 m in the deep-water side
a, b. Along Section B, c, d. along Section D. a, c. With the abnormal anticyclonic eddy, b, d. without the abnormal anticyclonic eddy
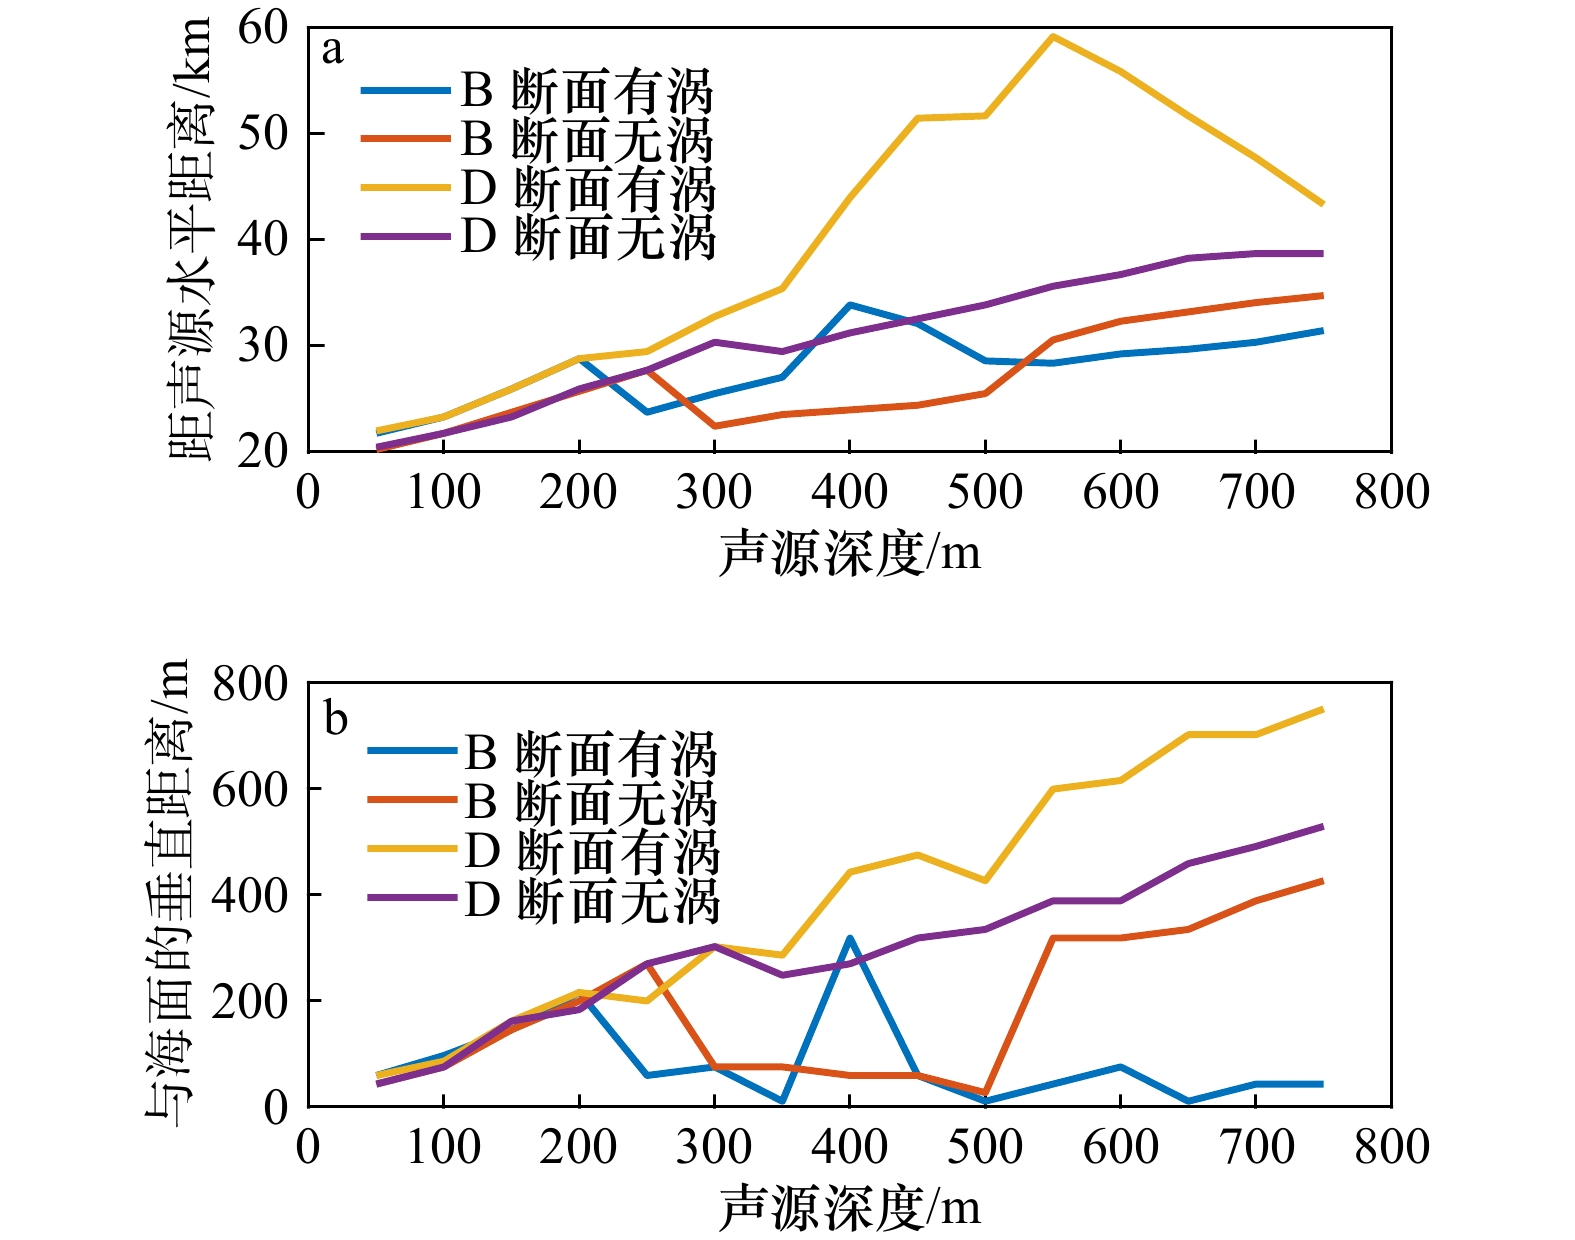
图 10 不同声源深度下第一汇聚区距离声源
Fig. 10 Distance of the first convergence zone from the sound source at different depths
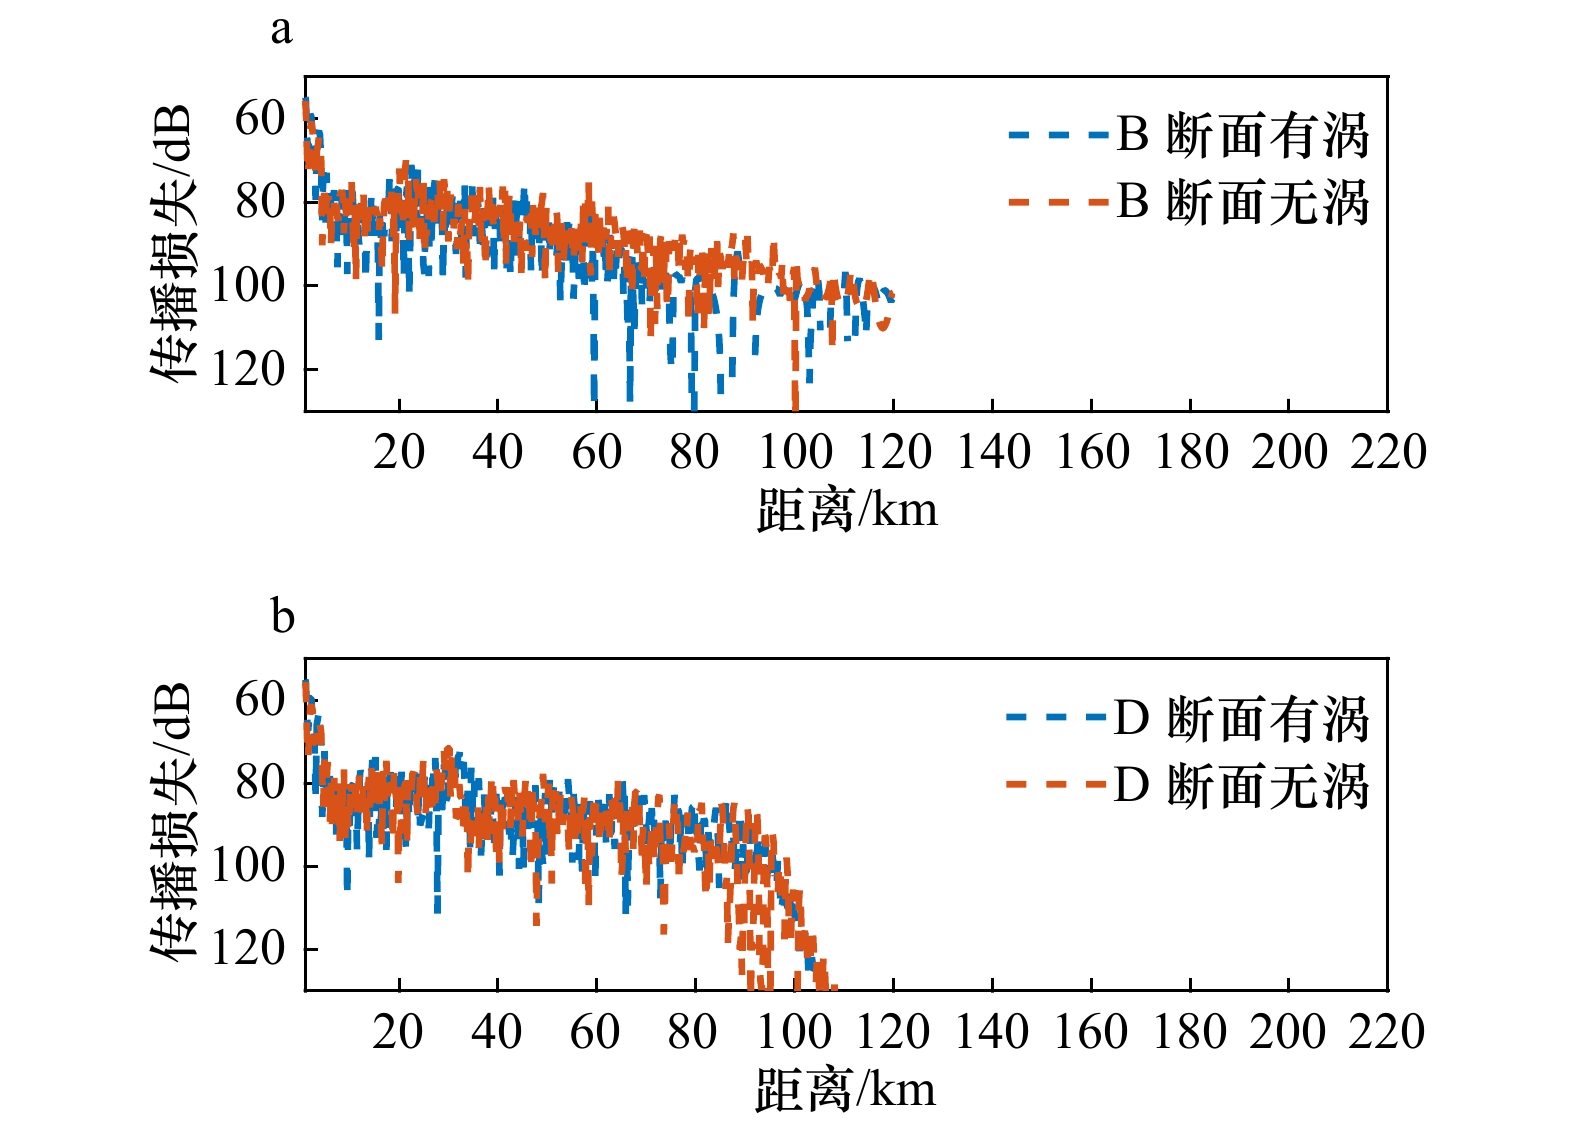
图 11 声源位于异常涡旋外深海侧300 m深度、接收深度300 m时的传播损失
a. B断面,b. D断面
Fig. 11 Transmission loss as sound source located at 300 m in the deep-water side of the abnormal anticyclonic eddy and receiver at 300 m in the deep-water side
a. Passing through Section B, b. passing through Section D
图 12 不同声源深度下水平距离15~40 km、垂直距离0.01~0.90 km范围内的传播损失标准差
Fig. 12 Standard deviation of transmission loss within a zone horizontally 15−40 km and vertically 0.01−0.90 km from the sound source
图 13 声源位于异常涡旋外侧陆架区水深50 m时的传播损失
a, b.穿过B 断面,c, d.穿过D 断面;a, c.有涡,b, d无涡
Fig. 13 Transmission loss as sound source located at 50 m in the shallow-water side
a, b. Along Section B, c, d. along Section D. a, c. With the abnormal anticyclonic eddy, b, d. without the abnormal anticyclonic eddy
图 14 声源位于异常涡旋外陆架浅水侧50 m深度、接收深度70 m时的传播损失
a. B断面,b. D断面
Fig. 14 Transmission loss as sound source located at 50 m in the shallow-water side of the abnormal anticyclonic eddy and receiver at 70 m in the shallow-water side
a. Passing through Section B, b. passing through Section D

图 15 声源在异常涡旋内侧100 m深度向外海传播时的传播损失
a, b.穿过B 断面,c, d.穿过D 断面;a, c.有涡,b, d无涡
Fig. 15 Transmission loss as sound source located at 100 m in the middle of section and sound propagating toward the deep water
a, b. Along Section B, c, d. Section D. a, c. With the abnormal anticyclonic eddy. b, d. without the abnormal anticyclonic eddy.
图 16 声源位于涡旋内100 m深度向外海传播、接收深度100 m时的传播损失
a. B断面,b. D断面
Fig. 16 Transmission loss as sound source located at 50 m inside the abnormal anticyclonic eddy and receiverat 100 m in the deep-water side
a. Passing through Section B, b. passing through Section D

图 17 声源在涡旋内100 m深度向陆坡传播时的传播损失
a, b.穿过B 断面,c, d.穿过D 断面;a, c.有涡,b, d无涡
Fig. 17 Transmission loss as sound source located at 100 m in the middle of section and sound propagating toward the shallow water
a, b. Along Section B, c, d. Section D. a, c. With the abnormal anticyclonic eddy. b, d. without the abnormal anticyclonic eddy
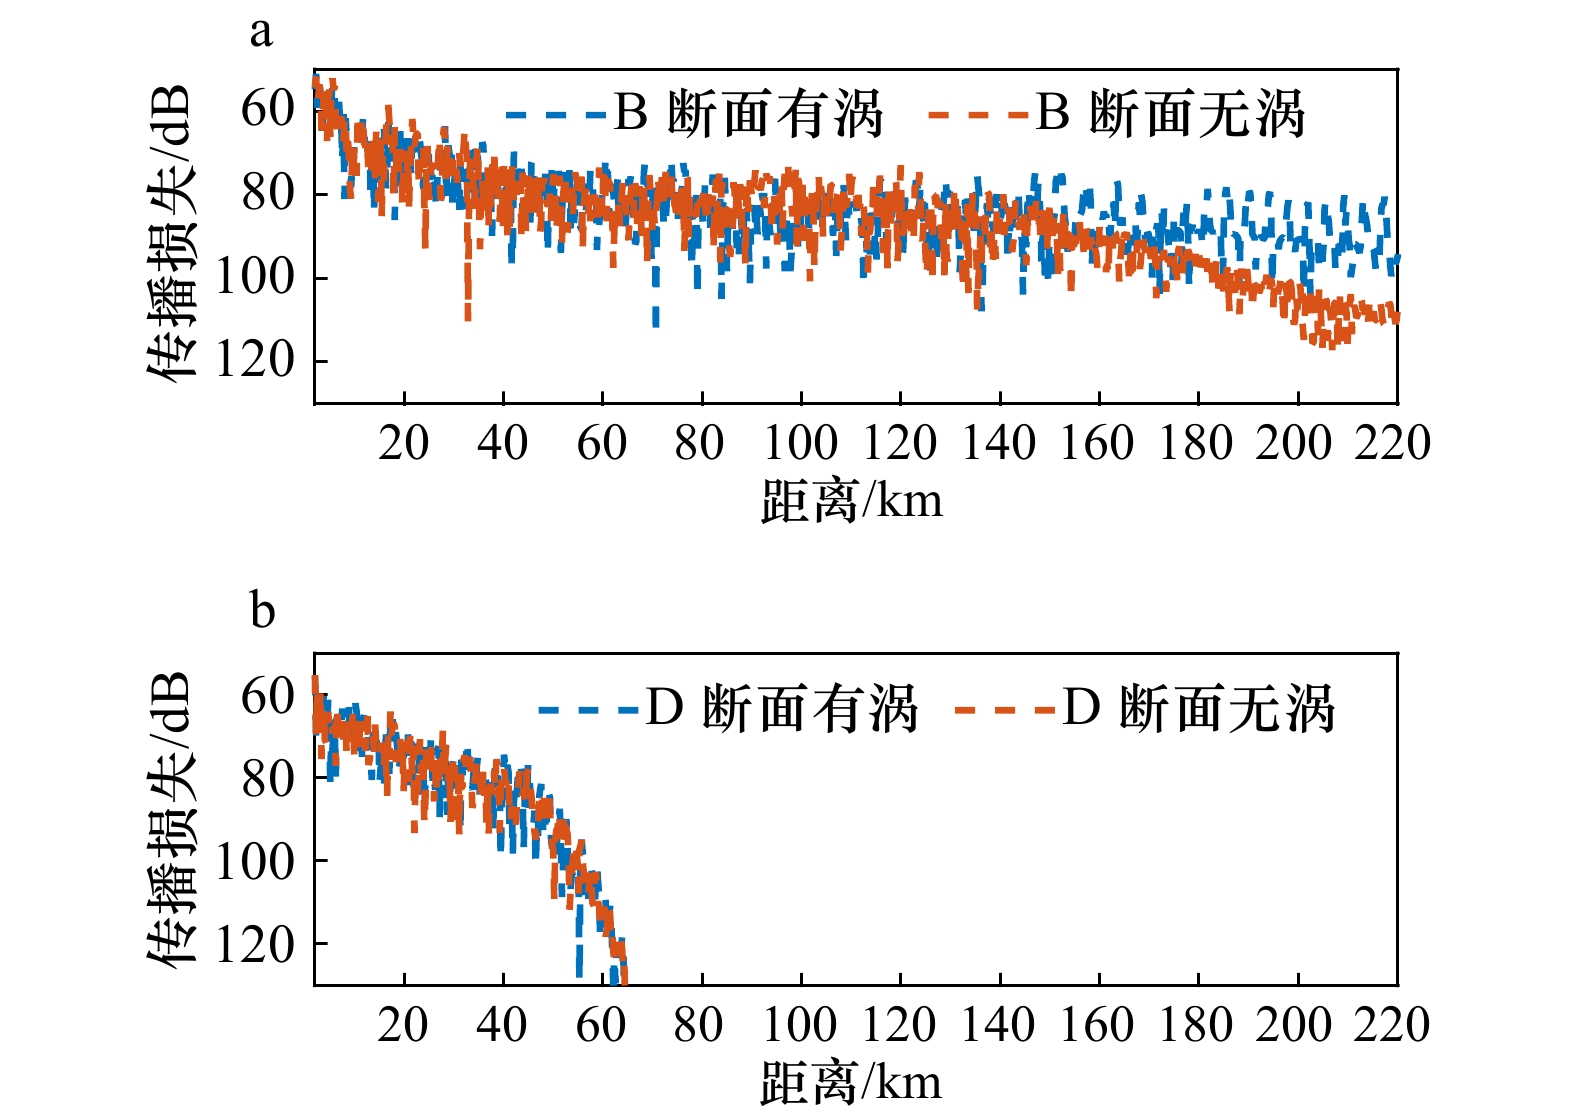
图 18 声源位于涡旋内侧水深100 m、接收深度100 m时向陆坡传播的传播损失
a. B断面,b. D断面
Fig. 18 Transmission loss as sound source located at 100 m inside the abnormal anticyclonic eddy and receiverat 100 m in the shallow-water side
a. Passing through Section B, b. passing through Section D
表 1 异常反气旋涡对不同声源位置的声传播的影响
Tab. 1 Impacts of the observed abnormal anticyclonic eddy on sound propagation emitting on different locations
声源位置 主要影响 声跃层位置/强度 声传播损失/传播距离 汇聚区位置 表面声道 声道轴深度 在异常反气旋涡
外侧深海区上跃层水深19 m/声速梯度−0.89 s−1,
下跃层水深68 m/声速梯度−0.47 s−1传播损失标准差减小2 dB /
声传播距离无显著差异第一汇聚区位置后移和
下移,最大距离分别超过
24 km和0.3 km在异常反气旋涡
外侧陆架区相较涡外深海区,上跃层水深加深64 m/声速
梯度值减小0.45 s−1,下跃层水深加深31 m/
声速梯度值基本不变传播损失增大10 dB/声传播
距离减小60 km表面声道
被破坏在异常反气旋涡
内向外海传播相较涡外深海区,上跃层水深加深69 m/声速
梯度方向相反,量值减小0.74 s−1,下跃层
水深加深116 m/声速梯度值增加0.10 s−1传播损失增大,最大差值
超过30 dB;声传播的距离
减小60 km汇聚区间距加大1倍 加深400 m 在异常反气旋涡
内向陆坡传播相较涡外深海区,上跃层水深加深69 m/声速
梯度方向相反,量值减小0.74 s−1,下跃层
水深加深116 m/声速梯度值增加0.10 s−1水深200 m以下传播损失
减小20 dB/声传播距离
增大30 km 下载: 导出CSV
表 2 前人关于正常反气旋暖涡对声传播影响
Tab. 2 Effects of normal anticyclonic warm eddies on sound propagation in previous studies
作者 研究对象及研究区域水深 涡旋主要特征与研究结论 卢晓亭等[42] 选取特定涡区HOOM模型的三维声场进行分析
水深4 000 m以上(1)反气旋暖旋内部只存在声速正异常
(2)声源在涡外,深海环境,反气旋暖涡区的会聚区距离比周围海区的会聚区距离大
(3)当声由反气旋暖涡向外传播时,随会聚区号数的增大会聚区距离缓慢减小Jian等[43] 以南海大面观测到的一个反气旋暖涡为对象
水深5 000 m(1)反气旋暖旋内部只存在声速正异常
(2)声源在涡外,穿过反气旋暖涡,有涡和无涡传播损失差可达20 dB张旭等[9] 以南海西部大面观测到的一个反气旋暖涡为例
水深2 600~4 000 m(1)反气旋暖旋内部水深100−600 m存在声速正异常
(2)当声波从反气旋暖涡外侧向涡旋中心传播,汇聚区距离变大
(3)当声波从反气旋暖涡中心向涡旋外侧传播,汇聚区距离变小
(4)海区水深大于声线反转的临界深度,反气旋暖涡引起的环境变化起主要作用李佳讯等[44] 构建高斯涡模型作为研究对象
水深1 000 m(1)反气旋暖旋内部只存在声速正异常
(2)声源在涡外时,反气旋暖涡使得汇聚区宽度增大,汇聚区位置后退
(3)当反气旋暖涡处于汇聚区时,减弱汇聚增益效应朱凤芹等[10] 以南海北部大面观测到的一个反气旋暖涡为例
水深2 500 m(1)反气旋暖旋内部只存在声速正异常
(2)声源在涡中心时,反气旋暖涡改变声道轴深度,会聚区宽度减小,
位置前移,有涡和无涡传播损失差30 dBSartajKhan[5] 2021 构建高斯涡模型作为研究对象
水深5 000 m以上(1)反气旋暖旋内部只存在声速正异常
(2)声源在反气旋暖涡外,涡旋使得会聚区向远离声源的方向移动,会聚区宽度增加Liu等[45] 对涡旋的声学实测与高斯涡模型相结合
水深2 200 m以上声源在反气旋暖涡外侧,汇聚区向远离声源的方向移动,汇聚区宽度增大
下载: 导出CSV
-
[1] Zhang Zhengguang, Wang Wei, Qiu Bo. Oceanic mass transport by mesoscale eddies[J]. Science, 2014, 345(6194): 322−324. doi: 10.1126/science.1252418 [2] Frenger I, Gruber N, Knutti R, et al. Imprint of southern ocean eddies on winds, clouds and rainfall[J]. Nature Geoscience, 2013, 6(8): 608−612. doi: 10.1038/ngeo1863 [3] Gaube P, Chelton D B, Samelson R M, et al. Satellite observations of mesoscale eddy-induced Ekman pumping[J]. Journal of Physical Oceanography, 2015, 45(1): 104−132. doi: 10.1175/JPO-D-14-0032.1 [4] Hausmann U, Czaja A. The observed signature of mesoscale eddies in sea surface temperature and the associated heat transport[J]. Deep Sea Research Part I: Oceanographic Research Papers, 2012, 70: 60−72. doi: 10.1016/j.dsr.2012.08.005 [5] Khan S, Song Yang, Huang Jian, et al. Analysis of underwater acoustic propagation under the influence of mesoscale ocean vortices[J]. Journal of Marine Science and Engineering, 2021, 9(8): 799. doi: 10.3390/jmse9080799 [6] Henrick R F, Siegmann W L, Jacobson M J. General analysis of ocean eddy effects for sound transmission applications[J]. The Journal of the Acoustical Society of America, 1977, 62(4): 860−870. doi: 10.1121/1.381606 [7] Mellberg L E, Robinson A R, Botseas G. Azimuthal variation of low-frequency acoustic propagation through asymmetric Gulf Stream eddies[J]. The Journal of the Acoustical Society of America, 1991, 89(5): 2157−2167. doi: 10.1121/1.400909 [8] Baer R N. Calculations of sound propagation through an eddy[J]. The Journal of the Acoustical Society of America, 1980, 67(4): 1180−1185. doi: 10.1121/1.384178 [9] 张旭, 张健雪, 张永刚, 等. 南海西部中尺度暖涡环境下汇聚区声传播效应分析[J]. 海洋工程, 2011, 29(2): 83−91. doi: 10.3969/j.issn.1005-9865.2011.02.012Zhang Xu, Zhang Jianxue, Zhang Yonggang, et al. Effect of acoustic propagation in convergence zone under a warm eddy environment in the western South China Sea[J]. The Ocean Engineering, 2011, 29(2): 83−91. doi: 10.3969/j.issn.1005-9865.2011.02.012 [10] 朱凤芹, 张海刚, 屈科. 南海东北部中尺度暖涡对声传播的影响[J]. 哈尔滨工程大学学报, 2021, 42(10): 1496−1502. doi: 10.11990/jheu.202007077Zhu Fengqin, Zhang Haigang, Qu Ke. Influence of mesoscale warm eddies on sound propagation in the northeastern South China Sea[J]. Journal of Harbin Engineering University, 2021, 42(10): 1496−1502. doi: 10.11990/jheu.202007077 [11] Qi Yongfeng, Mao Huabin, Du Yan, et al. A lens-shaped, cold-core anticyclonic surface eddy in the northern South China Sea[J]. Frontiers in Marine Science, 2022, 9: 976273. doi: 10.3389/fmars.2022.976273 [12] Sun Wenjin, Dong Changming, Tan Wei, et al. Statistical characteristics of cyclonic warm-core eddies and anticyclonic cold-core eddies in the North Pacific based on remote sensing data[J]. Remote Sensing, 2019, 11(2): 208. doi: 10.3390/rs11020208 [13] Timmermans ML, Toole J, Proshutinsky A, et al. Eddies in the Canada Basin, Arctic Ocean, observed from ice-tethered profilers[J]. Journal of Physical Oceanography, 2008, 38(1): 133−145. doi: 10.1175/2007JPO3782.1 [14] Sun Wenjin, Liu Yu, Chen Gengxin, et al. Three-dimensional properties of mesoscale cyclonic warm-core and anticyclonic cold-core eddies in the South China Sea[J]. Acta Oceanologica Sinica, 2021, 40(10): 17−29. doi: 10.1007/s13131-021-1770-x [15] Yang Xiao, Xu Guangjun, Liu Yu, et al. Multi-source data analysis of mesoscale eddies and their effects on surface chlorophyll in the Bay of Bengal[J]. Remote Sensing, 2020, 12(21): 3485. doi: 10.3390/rs12213485 [16] Everett J D, Baird M E, Oke P R, et al. An avenue of eddies: Quantifying the biophysical properties of mesoscale eddies in the Tasman Sea[J]. Geophysical Research Letters, 2012, 39(16): L16608. [17] Hao Ji, Yang Jie, Chen Ge. The effect of normal and abnormal eddies on the mixed layer depth in the global ocean[J]. Frontiers in Marine Science, 2023, 9: 981505. doi: 10.3389/fmars.2022.981505 [18] Nan Feng, Xue Huijie, Xiu Peng, et al. Oceanic eddy formation and propagation southwest of Taiwan[J]. Journal of Geophysical Research: Oceans, 2011, 116(C12): C12045. doi: 10.1029/2011JC007386 [19] Xie Lingling, Tian Jiwei, Zhang Shuwen, et al. An anticyclonic eddy in the intermediate layer of the Luzon Strait in Autumn 2005[J]. Journal of Oceanography, 2011, 67(1): 37−46. doi: 10.1007/s10872-011-0004-9 [20] 林鹏飞, 王凡, 陈永利, 等. 南海中尺度涡的时空变化规律Ⅰ. 统计特征分析[J]. 海洋学报, 2007, 29(3): 14−22. doi: 10.3321/j.issn:0253-4193.2007.03.002Lin Pengfei, Wang Fan, Chen Yongli, et al. Temporal and spatial variation characteristics on eddies in the South China SeaⅠ. Statistical analyses[J]. Haiyang Xuebao, 2007, 29(3): 14−22. doi: 10.3321/j.issn:0253-4193.2007.03.002 [21] 林宏阳, 胡建宇, 郑全安. 吕宋海峡附近中尺度涡特征的统计分析[J]. 海洋学报, 2012, 34(1): 1−7.Lin Hongyang, Hu Jianyu, Zheng Quanan. Statistical analysis of the features of meso-scale eddies near the Luzon Strait[J]. Haiyang Xuebao, 2012, 34(1): 1−7. [22] Liu Yuji, Jing Zhiyou. In trathermocline eddy with lens-shaped low potential vorticity and diabatic forcing mechanism in the South China Sea[J]. Journal of Physical Oceanography, 2024, 54(3): 929−948. doi: 10.1175/JPO-D-23-0149.1 [23] Wang Xiangpeng, Du Yan, Zhang Yuhong, et al. Subsurface anticyclonic eddy transited from Kuroshio shedding eddy in the northern South China Sea[J]. Journal of Physical Oceanography, 2023, 53(3): 841−861. doi: 10.1175/JPO-D-22-0106.1 [24] Frenger I, Münnich M, Gruber N, et al. Southern Ocean eddy phenomenology[J]. Journal of Geophysical Research: Oceans, 2015, 120(11): 7413−7449. doi: 10.1002/2015JC011047 [25] Dillon T M. Vertical overturns: a comparison of Thorpe and Ozmidov length scales[J]. Journal of Geophysical Research: Oceans, 1982, 87(C12): 9601−9613. doi: 10.1029/JC087iC12p09601 [26] Qi Yongfeng, Shang Chenjing, Mao Huabin, et al. Spatial structure of turbulent mixing of an anticyclonic mesoscale eddy in the northern South China Sea[J]. Acta Oceanologica Sinica, 2020, 39(11): 69−81. doi: 10.1007/s13131-020-1676-z [27] Lin Hongyang, Hu Jianyu, Liu Zhiyu, et al. A peculiar lens-shaped structure observed in the South China Sea[J]. Scientific Reports, 2017, 7(1): 478. doi: 10.1038/s41598-017-00593-y [28] Liu Yingjie, Yu Lisan, Chen Ge. Characterization of sea surface temperature and air-sea heat flux anomalies associated with mesoscale eddies in the South China Sea[J]. Journal of Geophysical Research: Oceans, 2020, 125(4): e2019JC015470. doi: 10.1029/2019JC015470 [29] Zhang Zhisheng, Xie Lingling, Zheng Quanan, et al. Coherence of eddy kinetic Energy variation during eddy life span to low-frequency ageostrophic energy[J]. Remote Sensing, 2022, 14(15): 3793. doi: 10.3390/rs14153793 [30] 邹颖俊, 王晓春, 何贤强. 基于统计学方法的HYCOM海洋预报结果评价[J]. 湘潭大学自然科学学报, 2018, 40(3): 104−108.Zou Yingjun, Wang Xiaochun, He Xianqiang. Evaluation of HYCOM ocean forecasting fields based on statistical method[J]. Natural Science Journal of Xiangtan University, 2018, 40(3): 104−108. [31] 吴碧, 陈长安, 林龙. 声速经验公式的适用范围分析[J]. 声学技术, 2014, 33(6): 504−507.Wu Bi, Chen Chang’an, Lin Long. Analysis of applicable scope of empirical equation for sound velocity[J]. Technical Acoustics, 2014, 33(6): 504−507. [32] Jensen F B, Kuperman W A, Porter M B, et al. Computational Ocean Acoustics[M]. New York: Springer, 2011. [33] 刘昭蜀. 南海地质[M]. 北京: 科学出版社, 2002.Liu Zhaoshu. Geologyof the South China Sea[M]. Beijing: SciencePress, 2002. [34] Hamilton E L. Geoacoustic modeling of the sea floor[J]. The Journal of the Acoustical Society of America, 1980, 68(5): 1313−1340. doi: 10.1121/1.385100 [35] 代伟. 基于BELLHOP声线模型的水声信道特性研究[J]. 舰船电子工程, 2023, 43(8): 212−215. doi: 10.3969/j.issn.1672-9730.2023.08.041Dai Wei. Investigation of underwater acoustic channel properties based on Bellhoprays model[J]. Ship Electronic Engineering, 2023, 43(8): 212−215. doi: 10.3969/j.issn.1672-9730.2023.08.041 [36] Qi Yongfeng, Mao Huabin, Wang Xia, et al. Suppressed thermocline mixing in the center of anticyclonic eddy in the north South China Sea[J]. Journal of Marine Science and Engineering, 2021, 9(10): 1149. doi: 10.3390/jmse9101149 [37] Evans D G, Frajka-Williams E, Naveira Garabato A C. Dissipation of mesoscale eddies at a western boundary via a direct energy cascade[J]. Scientific Reports, 2022, 12(1): 887. doi: 10.1038/s41598-022-05002-7 [38] 侍茂崇, 高郭平, 鲍献文. 海洋调查方法[M]. 青岛: 青岛海洋大学出版社, 2000.Shi Maochong, Gao Guoping, Bao Xianwen. Oceanographic Investigation Mehtods[M]. Qiangdao: Ocean University of Qingdao Press, 2000. [39] Hassantabar Bozroudi S H, Ciani D, Mohammad Mahdizadeh M, et al. Effect of subsurface Mediterranean water eddies on sound propagation using ROMS output and the Bellhop Model[J]. Water, 2021, 13(24): 3617. doi: 10.3390/w13243617 [40] Xiao Yao, Li Zhenglin, Li Jun, et al. Influence of warm eddies on sound propagation in the Gulf of Mexico[J]. Chinese Physics B, 2019, 28(5): 054301. doi: 10.1088/1674-1056/28/5/054301 [41] Chen Wen, Zhang Yongchui, Liu Yuyao, et al. Parametric model for eddies-induced sound speed anomaly in five active mesoscale eddy regions[J]. Journal of Geophysical Research: Oceans, 2022, 127(8): e2022JC018408. doi: 10.1029/2022JC018408 [42] 卢晓亭, 胡均川, 李玉阳. 海洋涡中的三维声传播分析[C]//中国声学学会1999年青年学术会议[CYCA’99]论文集. 武汉: 同济大学出版社, 1999: 2.Lu Xiaoting, Hu Junchuan, Li Yuyang. 3-Dimensional analysis of souns transmission in ocean eddy[C]//Acoustical Society of China 1999 Youth Academic Meeting. Wuhan: Tongji University Press, 1999: 2. [43] Jian Y J, Zhang J, Liu Q S, et al. Effect of mesoscale eddies on underwater sound propagation[J]. Applied Acoustics, 2009, 70(3): 432−440. doi: 10.1016/j.apacoust.2008.05.007 [44] 李佳讯, 张韧, 陈奕德, 等. 海洋中尺度涡建模及其在水声传播影响研究中的应用[J]. 海洋通报, 2011, 30(1): 37−46. doi: 10.3969/j.issn.1001-6392.2011.01.007Li Jiaxun, Zhang Ren, Chen Yide, et al. Ocean mesoscale eddy modeling and its application in studying the effect on underwater acoustic propagation[J]. Marine Science Bulletin, 2011, 30(1): 37−46. doi: 10.3969/j.issn.1001-6392.2011.01.007 [45] Liu Jiaqi, Piao Shengchun, Gong Lijia, et al. The effect of mesoscale eddy on the characteristic of sound propagation[J]. Journal of Marine Science and Engineering, 2021, 9(8): 787. doi: 10.3390/jmse9080787 -

计量
- 文章访问数: 590
- HTML全文浏览量: 205
- PDF下载量: 72
- 被引次数: 0
