

Simulation of the impact of black carbon on snow and sea ice in the Arctic Ocean
-
摘要: 当黑碳沉降到冰雪表面时,可使冰雪表面反照率降低,对短波辐射的吸收增加,黑碳的变化对海冰融化过程的影响值得研究。本文利用CICE 海冰模式进行数值模拟,并定量分析北冰洋冰雪中黑碳造成的影响。研究表明,在不同黑碳数据源的强迫下,1980−2014 年间,模拟结果给出的夏季北冰洋反照率平均下降为0.82%~1.71%,最终造成海冰面积下降了0.97%~1.93%,而在巴伦支海、喀拉海以及拉普捷夫海,夏季黑碳造成的海冰面积下降约为北冰洋整体的2−3 倍。不同黑碳沉降强迫下的模拟结果均显示,1980−1995 年,北冰洋区域黑碳对反照率的影响呈现减小趋势,但在1996−2014 年,黑碳影响转为增加趋势。在低纬度海区,由于海冰的消退,黑碳的辐射效应呈现减小趋势,而在高纬度海区,由于多年冰内黑碳的累积效应,黑碳的辐射影响呈现增强效应。Abstract: When black carbon deposits on snow/ice surface, it can reduce the albedo and increase the absorption of shortwave radiation. The changes in black carbon and their impact on the sea ice melting process are worth investigating. Study of the influence of black carbon in the Arctic Ocean was conducted using the CICE sea ice model. The results indicates that under the impact of black carbon deposition from different sources, from 1980 to 2014, the simulated summer albedo of the Arctic Ocean decreased by 0.82% to 1.71%, ultimately causing a decrease in sea ice extent by 0.97%−1.93%. In the Barents Sea, Kara Sea, and Laptev Sea, the summer sea ice area reduction caused by black carbon is approximately 2–3 times greater than the overall reduction in the Arctic Ocean. The simulation results under different black carbon deposition all show that from 1980 to 1995, the impact of black carbon on albedo in the Arctic exhibited a decreasing trend. However, from 1996 to 2014, the black carbon effect shifted to an increasing trend. In low-latitude regions, due to the retreat of sea ice, the effect of black carbon showed a decreasing trend, while in high-latitude regions, due to the cumulative effect of black carbon in multi-year ice, the radiative impact of black carbon showed an enhancing effect.
-
Key words:
- black carbon /
- Arctic Ocean /
- CICE model /
- albedo /
- sea ice area
-

图 1 CMIP6及MERRA2黑碳沉降数据分布、季节变化以及年际变化(70°N以北,北冰洋)
a. 1980−2014年的黑碳沉降分布;b. 1980−2014年间黑碳沉降的气候态季节变化;c. 黑碳沉降的年际变化,图中灰色实线为CMIP6各模式的结果,CMIP6-MEM为CMIP6多模式平均结果,粉色和蓝色实线分别为CMIP6模式中黑碳沉降最高和最低的模拟结果;d1−d4. 1980−2014年间对应数据的北极黑碳总沉降空间分布
Fig. 1 Distribution, seasonal and interannual variation of black carbon deposition data from CMIP6 and MERRA2 (north of 70°N, Arctic Ocean)
a. Black carbon deposition distribution from 1980 to 2014; b. seasonal variation of black carbon deposition from 1980 to 2014; c. interannual variation of black carbon deposition, where the gray solid lines represent the results of each CMIP6 model, CMIP6-MEM represents the multi-model mean result of CMIP6, and the pink and blue solid lines represent the highest and lowest black carbon deposition simulation results among the CMIP6 models; d1−d4. spatial distribution of total Arctic black carbon deposition data from 1980 to 2014
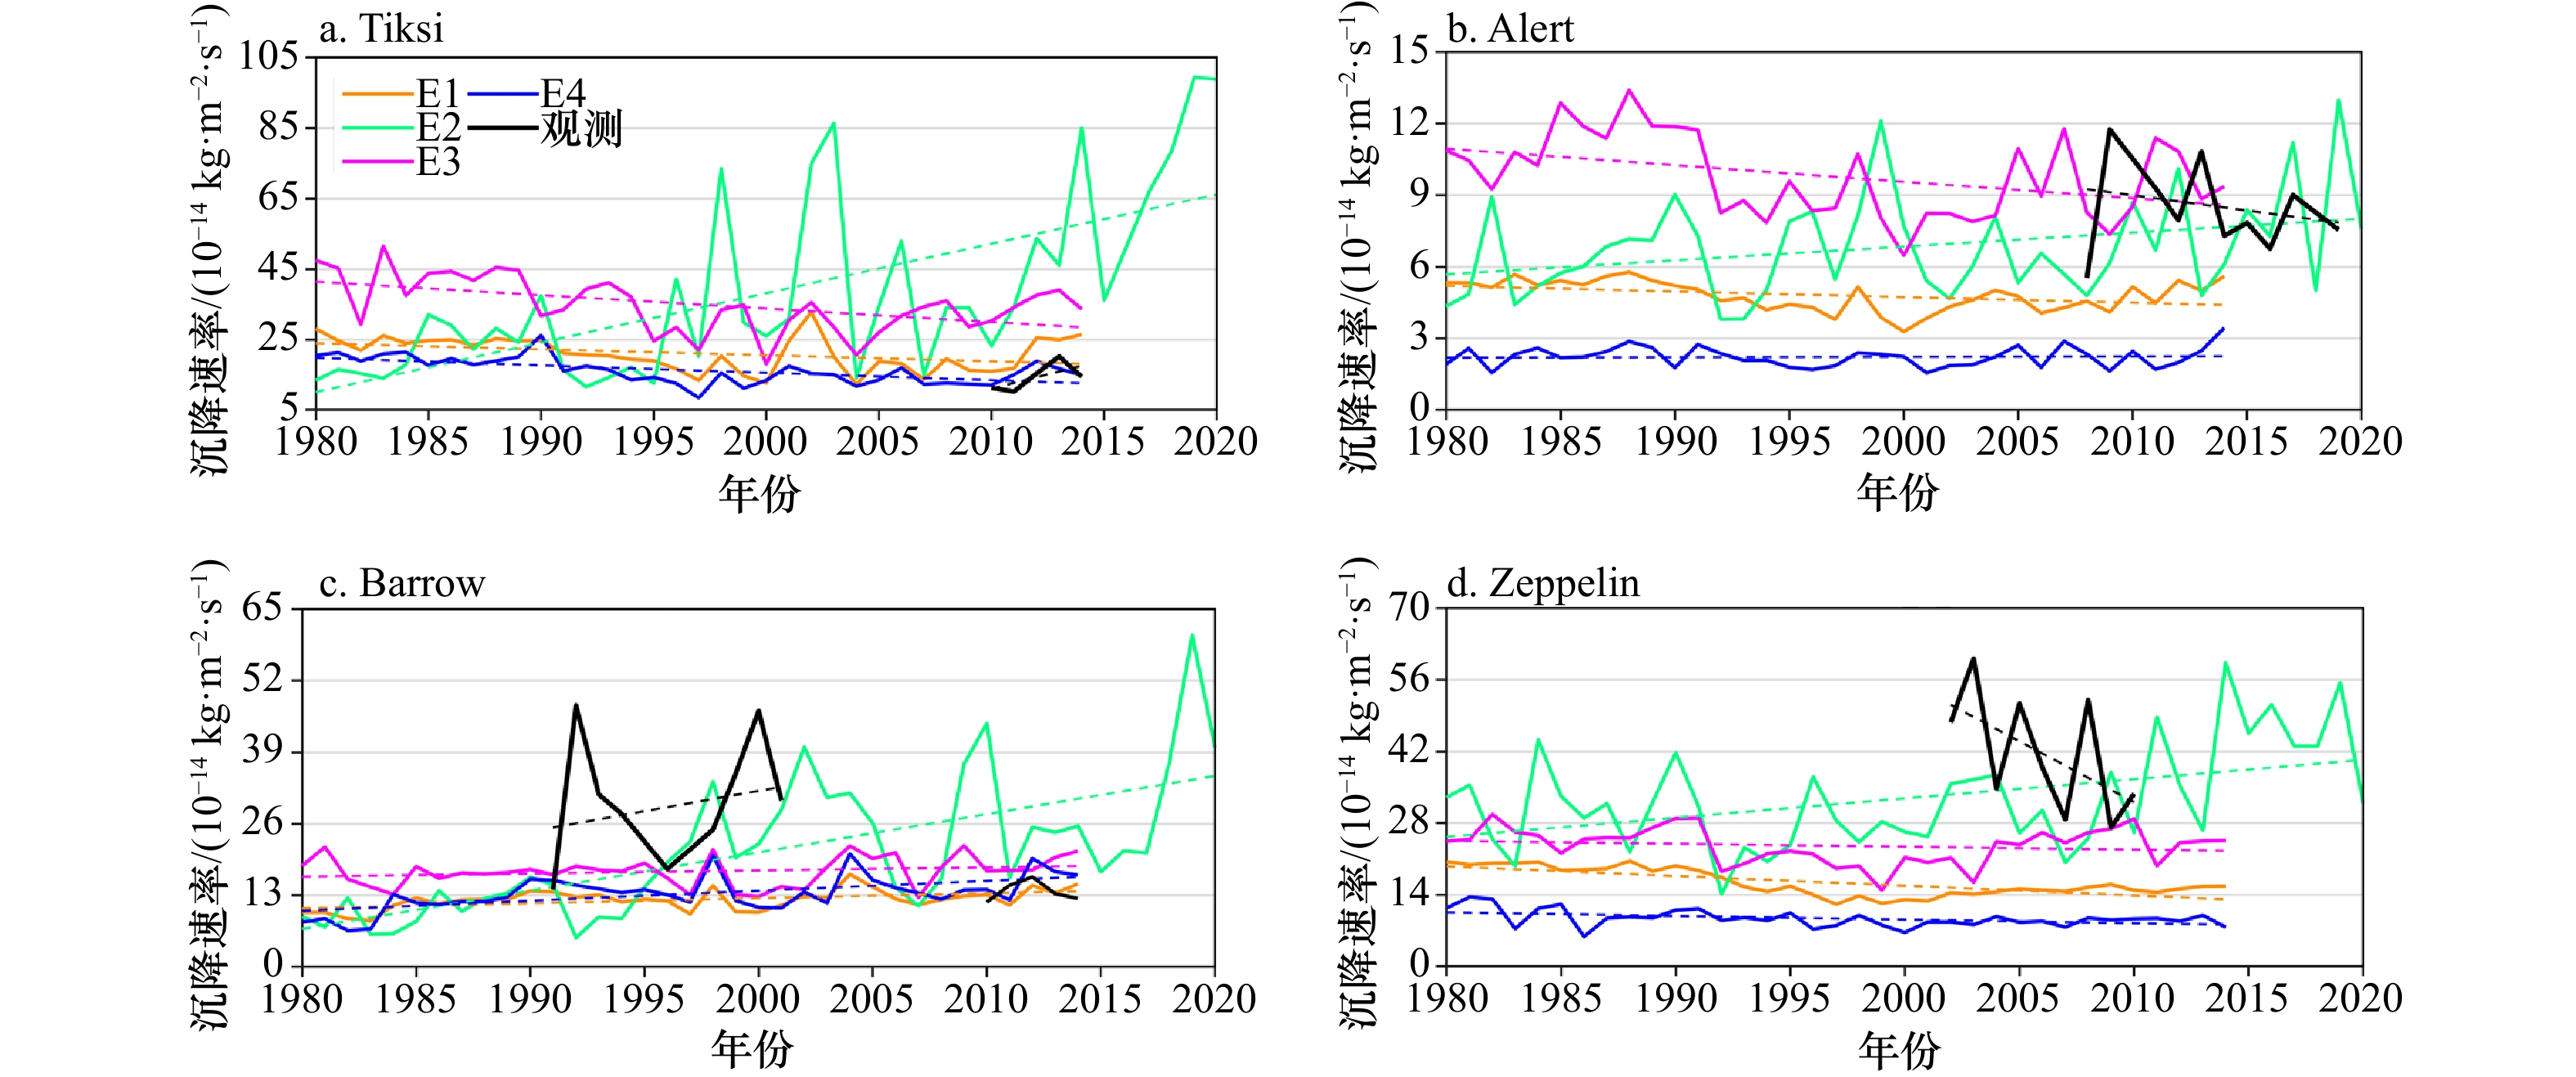
图 2 北极各站点黑碳沉降观测数据与模拟所用黑碳沉降强迫数据对比
Fig. 2 Comparison of observed black carbon deposition data at various Arctic sites with the black carbon deposition forcing data used in simulations
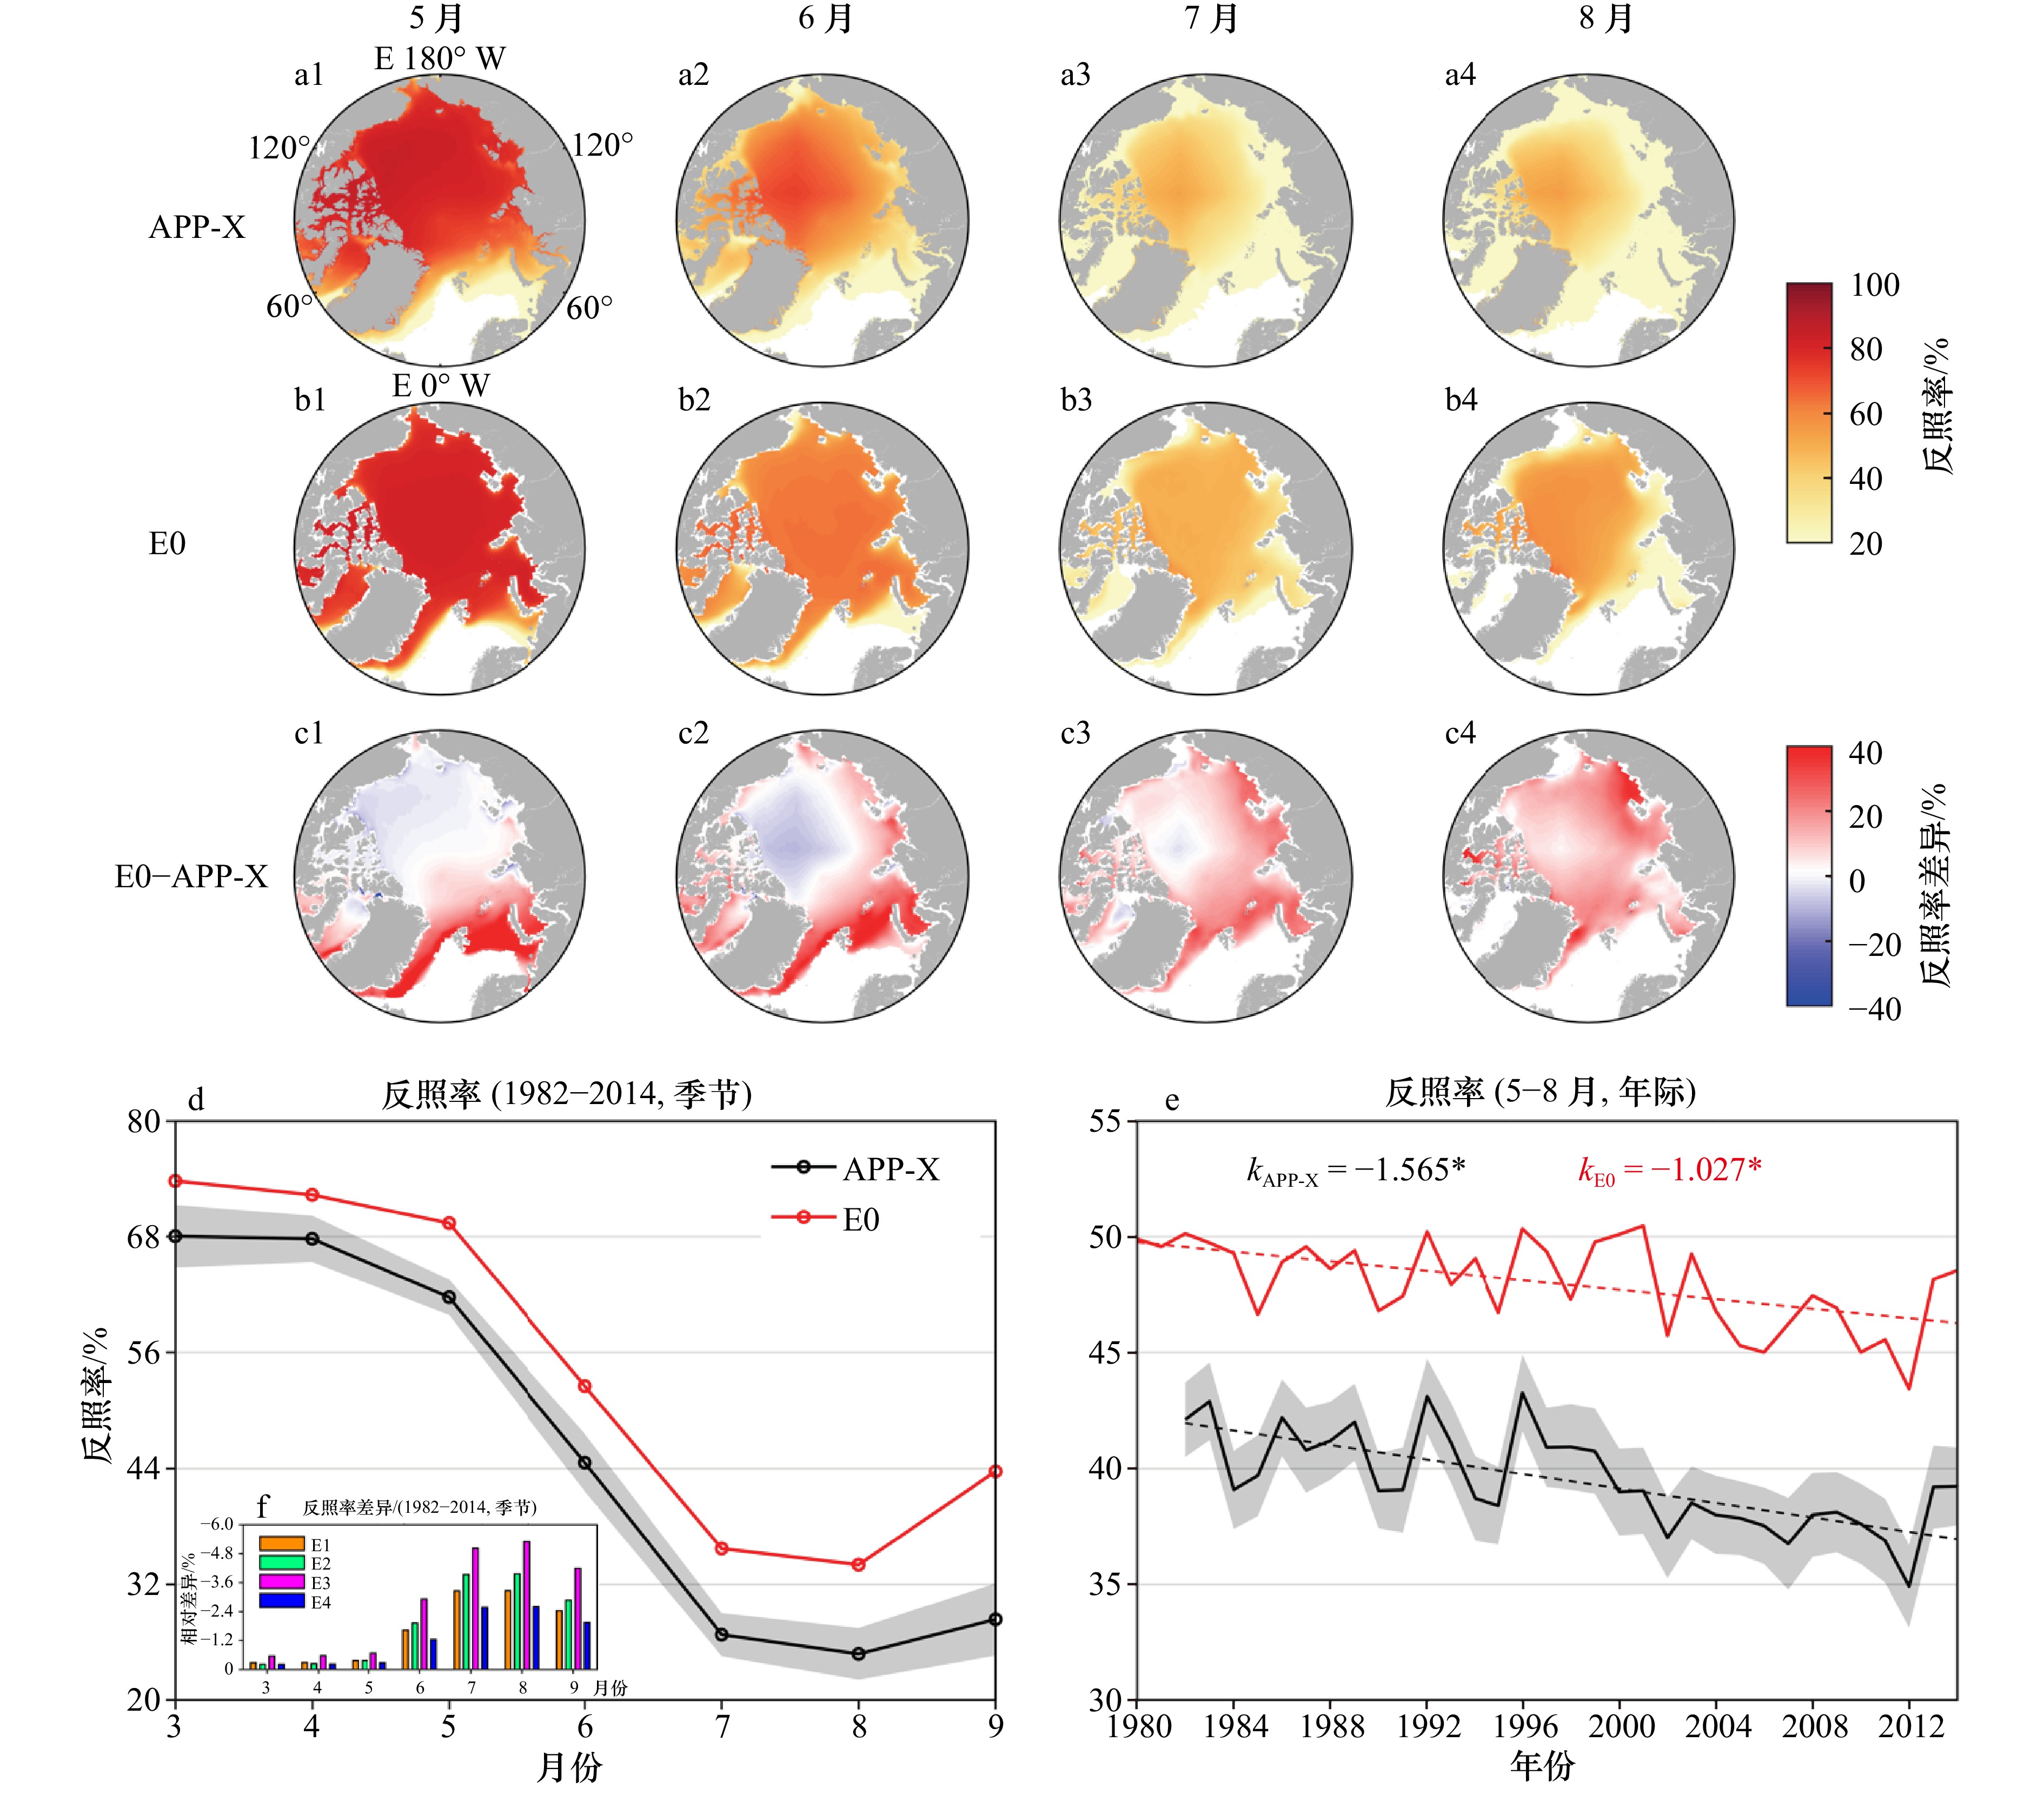
图 3 APP-X及CICE模拟的北极地区反照率的空间分布(1982−2014年气候态),以及季节及年际变化
a1−a4. APP-X遥感数据;b1−b4. E0情形下模拟的北极反照率空间分布;c1−c4. 模拟与遥感反照率差异的空间分布;d. 北冰洋(70°N以北)平均反照率季节变化,灰色阴影为标准差;e. 5−8月平均北极反照率年际变化,灰色阴影为10%标准差,k为年际变化趋势,*表示通过95%显著性检验;f. E1−E4试验模拟反照率相较于E0试验的相对差异
Fig. 3 Spatial distribution of Arctic albedo simulated by APP-X and CICE 1982−2014 climatology, as well as seasonal and interannual variations
a1−a4. APP-X remote sensing data; b1−b4. spatial distribution of Arctic albedo simulated by E0; c1−c4. spatial distribution of differences between simulated and obesrved; d. seasonal variation of mean Arctic Ocean (north of 70°N) albedo, with gray shading representing the standard deviation; e. interannual variation of average Arctic albedo from May to August, with gray shading representing the 10% standard deviation, k indicating the trend of interannual variation, and * denoting significance at the 95% confidence level; f. relative differences in simulated albedo for experiments E1−E4 compared to the E0 experiment

图 4 黑碳影响下,融化季(5−8月)CICE模拟的北极地区反照率相较于无黑碳情形时(E0)的空间差异分布(1982−2014年气候态平均)
Fig. 4 Spatial distribution of the difference in Arctic albedo during the melt season (May-August) simulated by CICE under the influence of black carbon compared to the no black carbon scenario (E0) (climatological average for 1982−2014)

图 5 APP-X及CICE模拟的5−8月北极(70°N以北)平均海冰反照率年际变化
a1−d1. 5−8月反照率年际变化,图中灰色阴影为反照率标准差;a2−d2. 反照率相对差异年际变化,k为年际变化趋势(%dec−1),*表示通过95%显著性检验
Fig. 5 Interannual variation of May-August average sea ice albedo in the Arctic (north of 70°N) simulated by APP-X and CICE
a1−d1. Interannual variation of albedo form May to August , with gray shading representing the standard deviation of albedo; a2−d2. interannual variation of relative differences in albedo, with k indicating the trend of interannual variation (%dec−1), and * denoting significance at the 95% confidence level

图 6 SSM/I及CICE模拟的北极地区海冰密集度空间分布(1980−2014年气候态),以及季节及年际变化
a1−a4. SSM/I遥感数据,b1−b4. CICE模拟数据,c1−c4. 模拟相较于遥感的海冰密集度差异,d. 海冰面积季节变化,e. 海冰面积年际变化,f. E1−E4试验模拟的季节海冰面积相较于E0试验的差异,g. E1−E4试验模拟年际海冰面积相较于E0试验的相对差异,k为年际变化趋势,*表示通过95%显著性检验,剔除海冰密集度小于15%的海域
Fig. 6 Spatial distribution of Arctic sea ice concentration from SSM/I and CICE (1980−2014 climatology), as well as seasonal and interannual variations
a1−a4. SSM/I; b1−b4. CICE simulatios; c1−c4. differences in sea ice concentration between simulations and observeed; d. seasonal variation of sea ice extent; e. interannual variation of sea ice extent; f. differences in seasonal sea ice extent between the E1−E4 and the E0 experiment; g. relative differences in interannual sea ice extent between the E1−E4 experiments and the E0 experiment, with k indicating the trend of interannual variation, * denoting significance at the 95% confidence level, and excluding areas with sea ice concentration less than 15%

图 7 黑碳影响下,融化季(5−8月)CICE模拟的北极地区海冰密集度相较于无黑碳情形时的空间差异分布(1980−2014年气候态平均)
Fig. 7 Spatial distribution of the difference in Arctic sea ice concentration during the melt season (May-August) simulated by CICE under the influence of black carbon compared to the no black carbon scenario (climatological average for 1980−2014)

图 8 CICE模拟的北极地区海冰面积季节变化
a1−c1. 分别为巴伦支海、喀拉海以及拉普捷夫海海冰面积气候态季节变化(1980−2014),a2−c2. 模拟的相较于无黑碳情形时的海冰面积差异季节变化
Fig. 8 Seasonal variation of Arctic sea ice extent simulated by CICE
a1−c1. Seasonal variation of sea ice extent in the Barents Sea, Kara Sea and Laptev Sea (climatological average for 1980−2014); a2−c2. seasonal variation of sea ice extent differences between the simulations with and without black carbon

图 9 CICE模拟的北极地区海冰面积年际变化
a1−c1. 分别为巴伦支海、喀拉海以及拉普捷夫海海冰面积年际变化变化(1980−2014);a2−c2. 模拟的相较于无黑碳情形时的海冰面积差异年际变化,k为年际变化趋势,*表示通过95%显著性检验
Fig. 9 Interannual variation of Arctic sea ice extent simulated by CICE
a1−c1. Interannual variation of sea ice extent in the Barents Sea, Kara Sea and Laptev Sea (1980−2014); a2−c2. interannual variation of sea ice extent differences between simulations with and without black carbon. k indicates the trend of interannual variation, with * denoting significance at the 95% confidence level
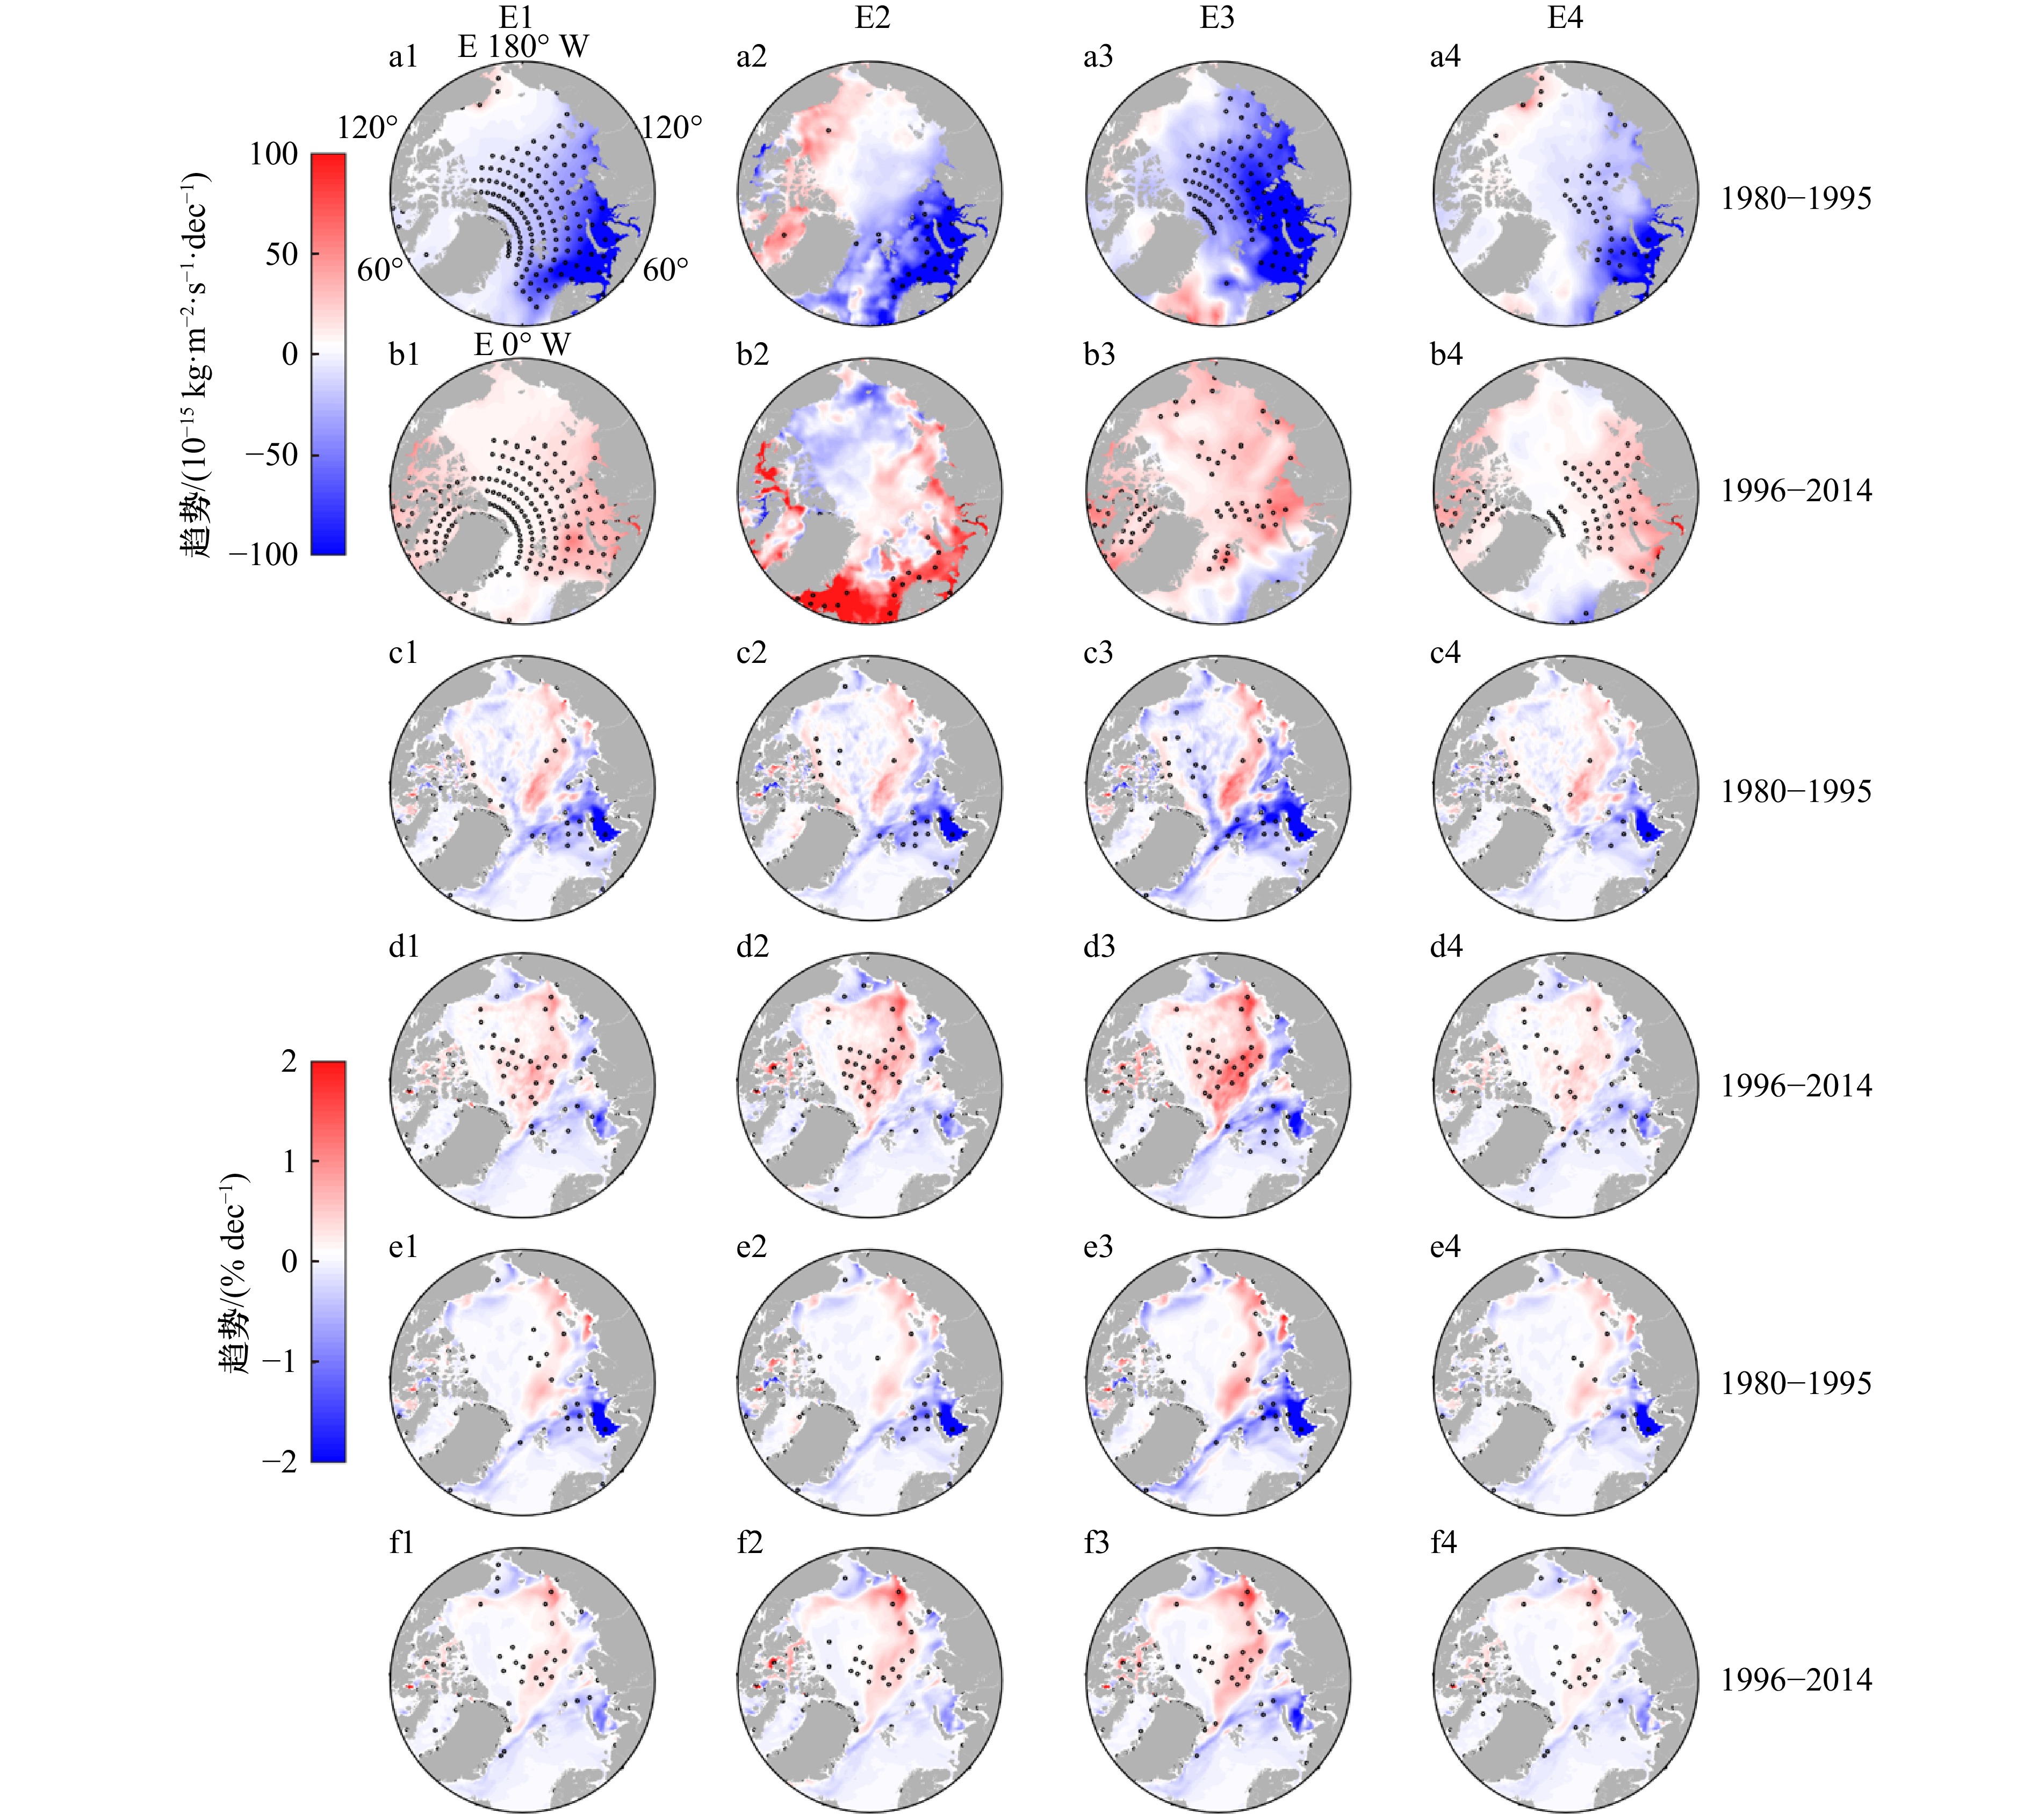
图 10 1980−1995和1996−2014年北冰洋黑碳沉降通量趋势(a−b)、反照率差异趋势(c−d)以及海冰面积差异趋势(e−f)
图中黑点为通过95%显著性检验区域
Fig. 10 Trends in black carbon deposition flux (a−b), albedo differences (c−d) and sea ice extent differences (e−f) in the Arctic Ocean for the periods of 1980−1995 and 1996−2014
Black dots on the figures indicate regions where trends are significant at the 95% confidence level
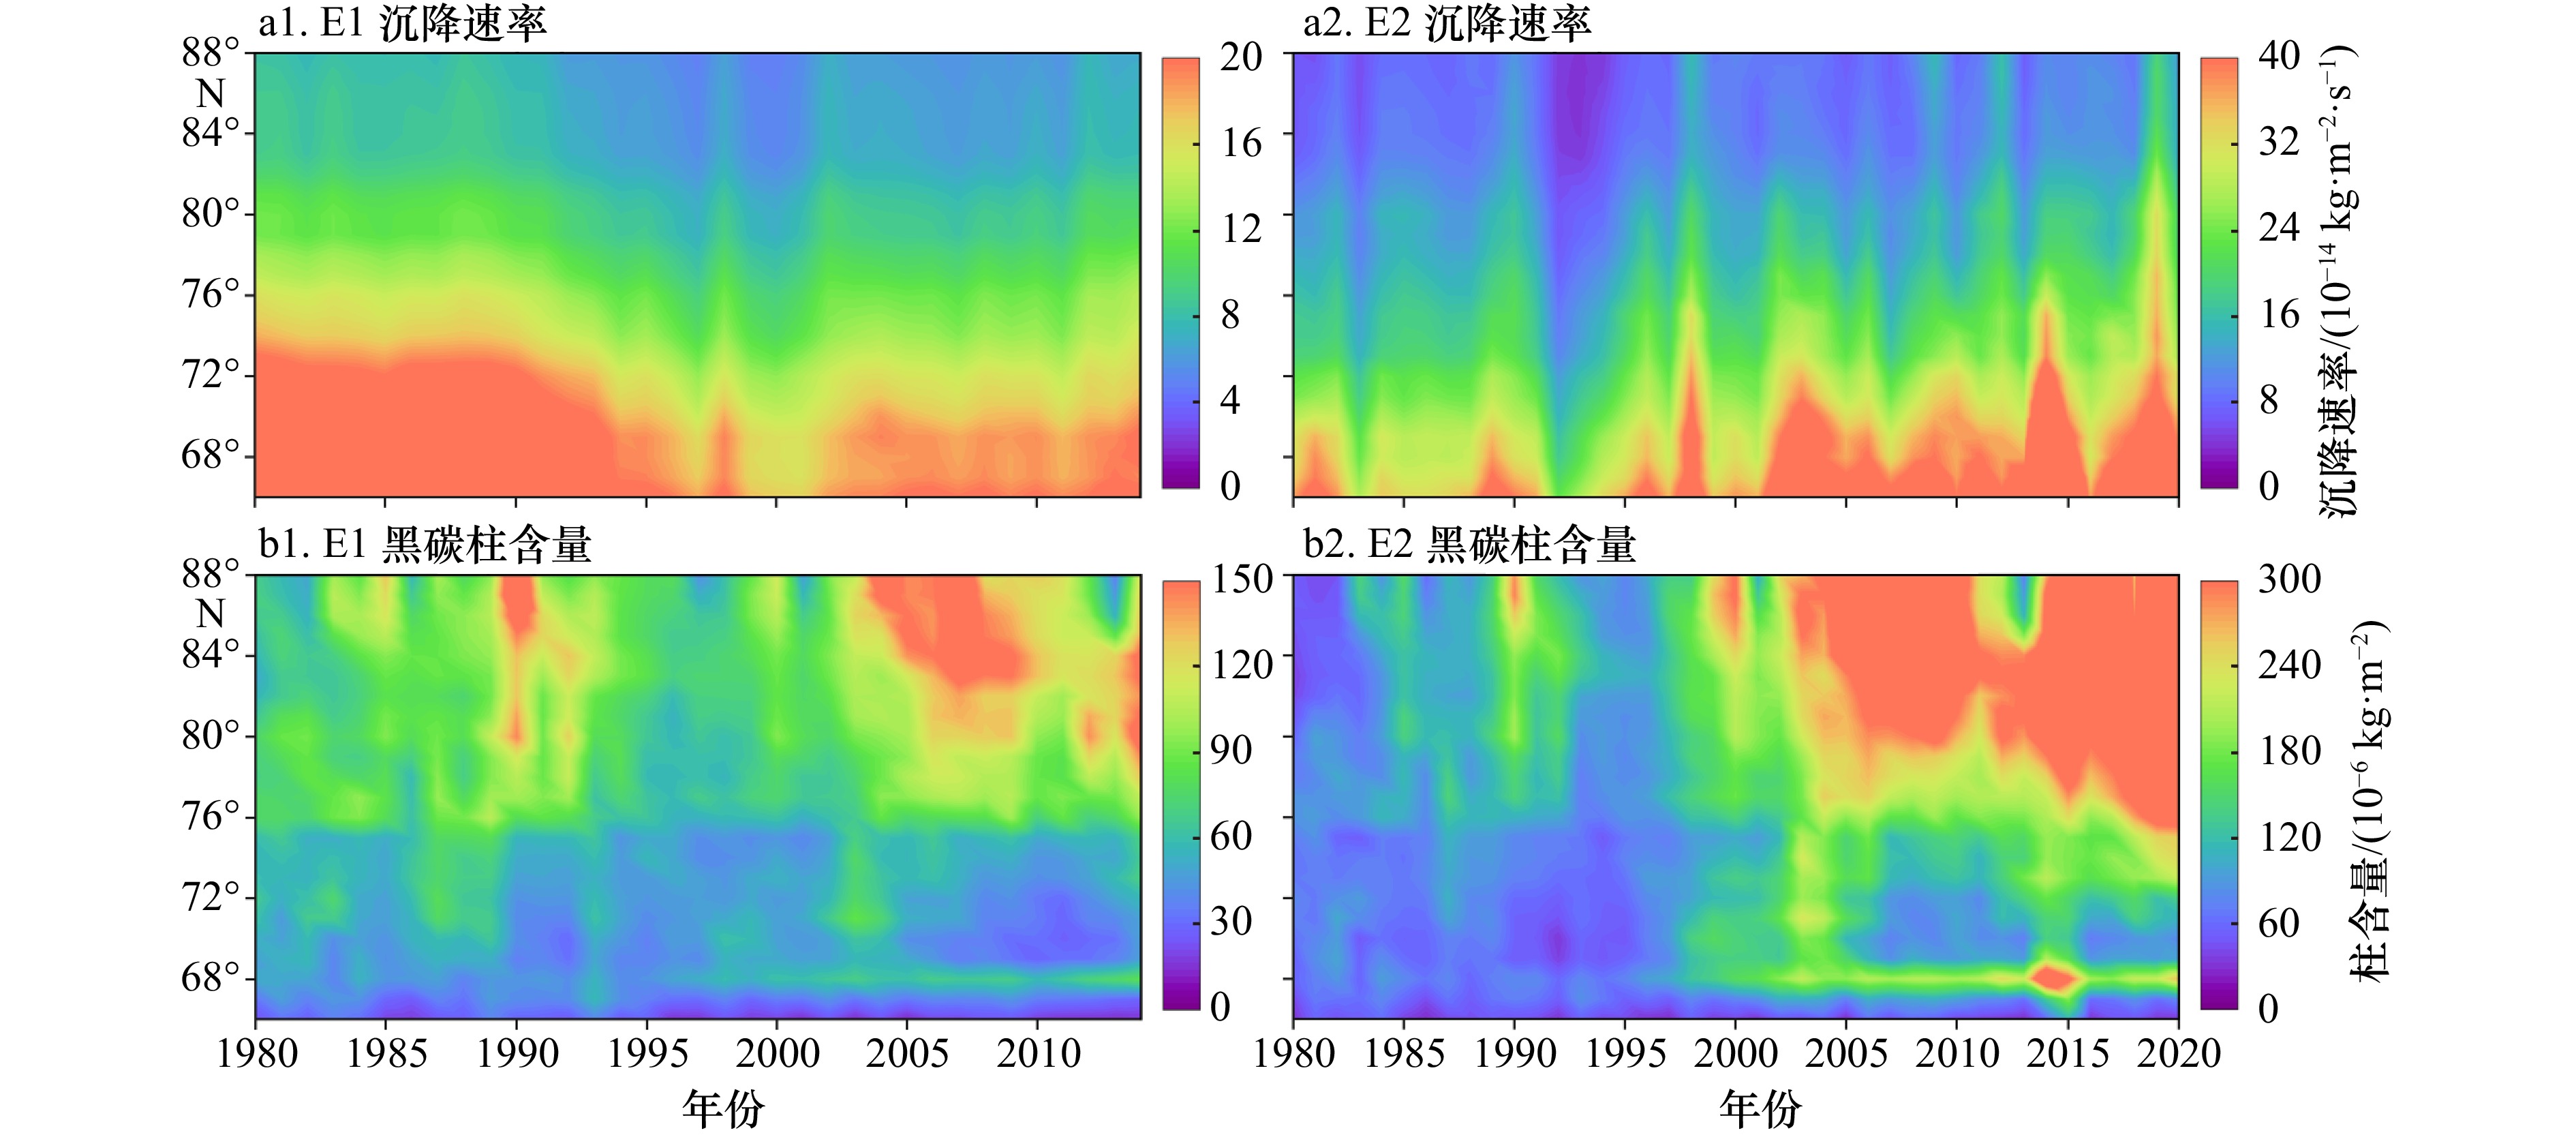
图 11 E1和E2试验北极黑碳沉降速率及冰雪黑碳柱含量年际变化
Fig. 11 Interannual variation of Arctic black carbon deposition rate and snow and ice black carbon column content for experiments E1 and E2
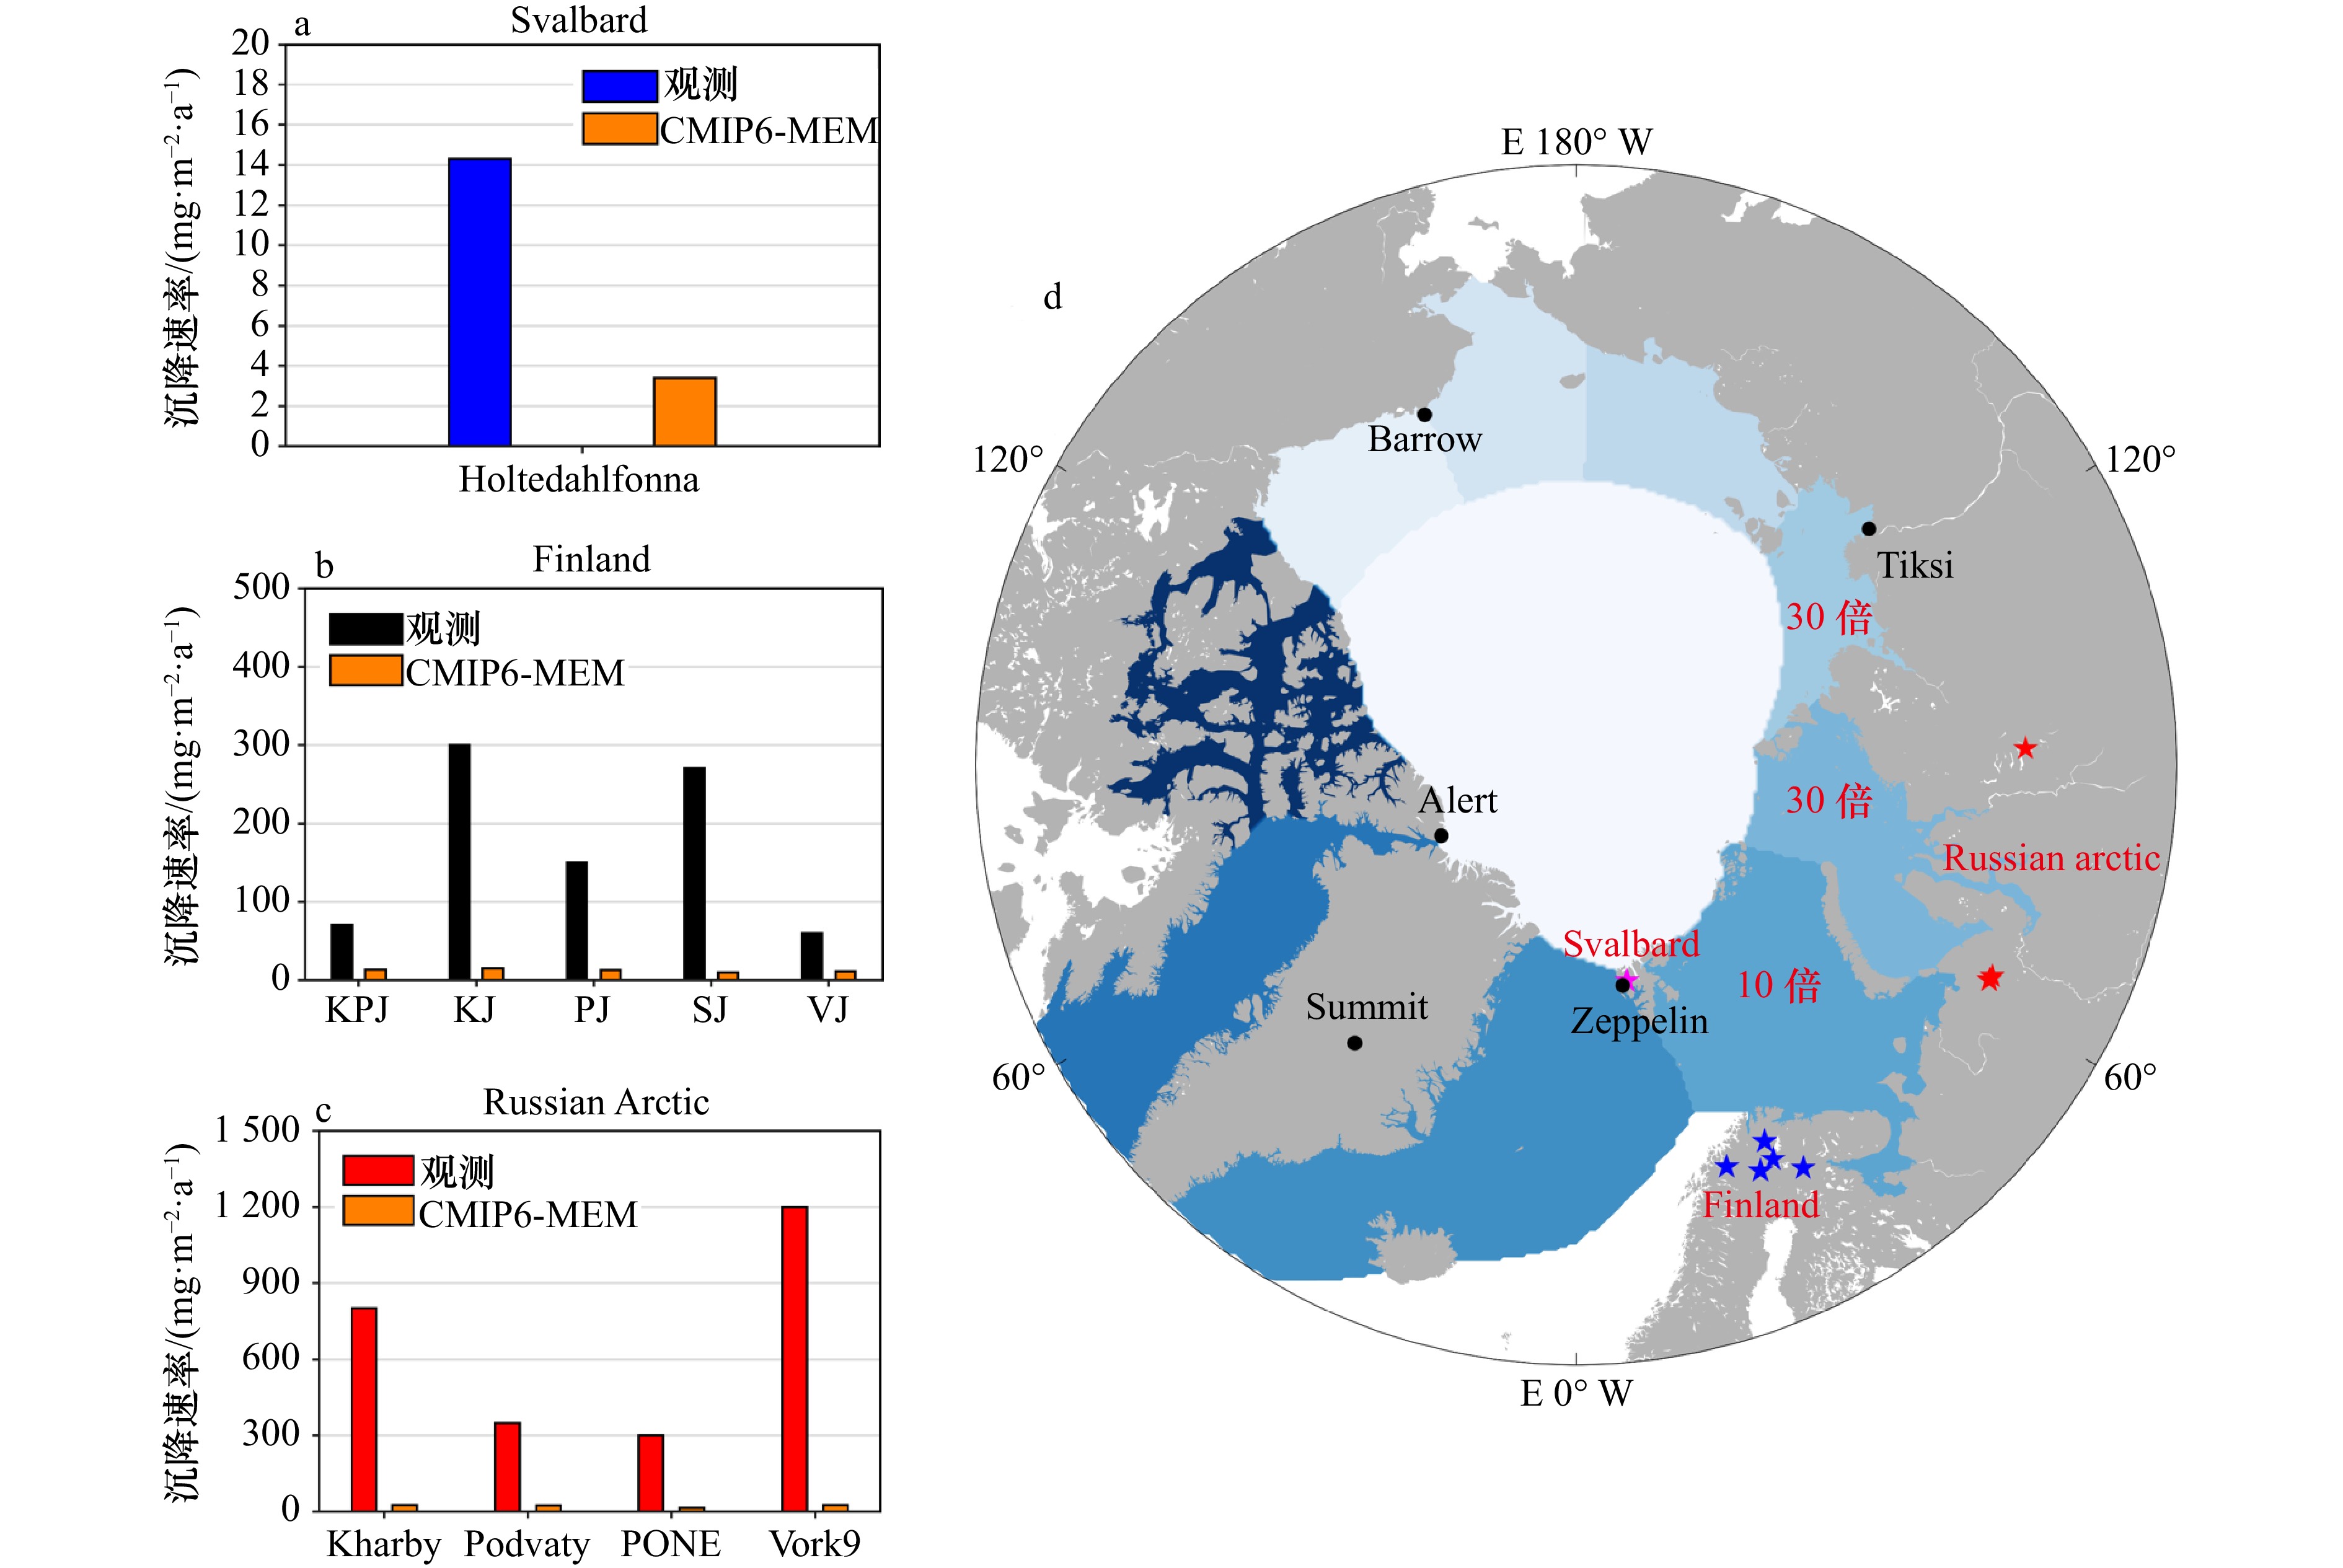
图 12 北极黑碳沉降通量及黑碳大气浓度观测站点的位置分布
a, b, c. 黑碳沉降通量长期观测数据与CMIP6-MEM沉降通量对比[9,40–41];d. 观测数据站点分布,其中星形标记为沉降观测地点,圆形标记为大气黑碳浓度观测站点
Fig. 12 Distribution of observation sites for Arctic black carbon deposition flux and atmospheric black carbon concentration
a, b, c. Comparison of long-term black carbon deposition flux observation data with CMIP6-MEM deposition flux [9, 40–41]; d. distribution of observation sites, with star symbols indicating deposition observation locations and circle symbols indicating atmospheric black carbon concentration observation sites

图 13 北极地区黑碳沉降以及海冰面积的模拟与观测对比
a1, a2. 30°N以北海冰面积的季节及年际变化,b−d. 分别为巴伦支海、喀拉海以及拉普捷夫海的海冰面积变化
Fig. 13 Comparison of simulated and observed black carbon deposition and sea ice extent in the Arctic
a1, a2. Seasonal and interannual variation of sea ice extent north of 30°N; b−d. sea ice extent changes in the Barents Sea, Kara Sea, and Laptev Sea
表 1 本文所使用CMIP耦合模式结果及再分析黑碳沉降数据
Tab. 1 Black carbon deposition data from the CMIP6 coupled model results and MERRA2 reanalysis data used in this study
数据 研究单位 平均分辨率/km 参考文献 MERRA2 NASA 50 Shen等[15] CESM2-FV2 NCAR 250 Danabasoglu等[16] CESM2-WACCM-FV2 NCAR 250 Danabasoglu等[16] CESM2-WACCM NCAR 100 Danabasoglu等[16] CESM2 NCAR 100 Danabasoglu等[16] CanESM5 CCCma 500 Swart等[17] CanESM5-1 CCCma 500 Swart等[17] MIROC MIROC6 250 Kataoka等[18] MRI-ESM2-0 MRI 100 Yukimoto等[19] INM-CM4-8 INM 100 Volodin[20] INM-CM5-0 INM 100 Volodin[20] IPSL-CM5A2-INCA IPSL 500 Boucher等[21] IPSL-CM6A-LR-INCA IPSL 250 Boucher等[21] NorESM2-LM NCC 250 Seland等[22] EC-Earth3-AerChem EC-Earth 100 Döscher等[23] GFDL-ESM4 NOAA-GFDL 100 Dunne等[24] 注:MERRA2为再分析数据,其余数据来自CMIP6的r1i1p1f1历史试验数据集。  下载: 导出CSV
表 2 北冰洋冰雪表面黑碳影响的模拟试验设置
Tab. 2 Simulation setup for the impact of black carbon on the Arctic sea ice and snow
试验
名称有无黑
碳强迫黑碳沉降强迫 试验描述及模拟时间范围 E0 无 无 无黑碳情形,1975−2020 E1 有 CMIP6 MEM (11.89) 标准试验,1975−2014 E2 有 MERRA2 (17.09) 再分析强迫,1975−2020 E3 有 EC-Earth3 (19.84) CMIP6最大黑碳沉降,1975−2014 E4 有 CESM2-WACCM-
FV2 (8.29)CMIP6最小黑碳沉降,1975−2014 注:括号内数字为北极(70°以北)1980−2014的气候态年平均黑碳沉降通量,单位为10−14 kg/(m2·s)
下载: 导出CSV
表 3 北冰洋区域积雪黑碳含量观测数据与模式模拟值对比(括号内为观测与模拟的平均值)
Tab. 3 Comparison of observed and simulated snow black carbon content in the Arctic Ocean (values in parentheses represent the mean of observations and simulations)
序号 纬度 经度 时间 观测值/(ng·g−1) 模拟值/(ng·g−1) 参考文献 北极中央区(6.28, 9.32~28.32) 1 84.182°N 47.507°E 2008.5 6.7 13.1~35.3 Doherty等[35] 2 84.7°N 63.48°W 2008.4−2008.5 6 5.8~12.3 Doherty等[35] 3 86.142°N 45.342°E 2008.4 7.1 13.2~34.5 Doherty等[35] 4 88.133°N 90.717°W 2007春季 4.6 6.6~26.5 Doherty等[35] 5 82.88°N 154.45°W 2006.4−2006.5 7 7.9~33 NPEO (Field campaign) 波弗特海 (8.445, 12.3~28.3) 6 73°N 145°W 2007.4 8.89 ± 0.08 15~32.3 Doherty等[35] 7 75.34°N 135.657°W 2007.4 8 9.6~24.3 APLIS/SEDNA campaign 加拿大北极 (7.56, 8.73~26.9) 8 67.878°N 76.47°W 2009春季 5.23 ± 0.33 16.4~40.9 Doherty等[35] 9 69.28°N 77.046°W 2009春季 5.82 ± 0.22 7.63~22.63 Doherty等[35] 10 70.067°N 124.973°W 2009春季 11.57 ± 0.34 8.1~28.3 Doherty等[35] 11 70.067°N 124.973°W 2009春季 6.65 ± 0.43 8.1~28.3 Doherty等[35] 12 75.497°N 96.145°W 2009春季 9.51 ± 0.04 5.9~19.5 Doherty等[35] 13 76.555°N 104.732°W 2009春季 8.78 ± 0.04 8.1~23.9 Doherty等[35] 14 76.633°N 96.212°W 2009春季 5.37 ± 0.5 6.9~24.5 Doherty等[35] 阿拉斯加 (9, 11.2~23.6) 15 71.325°N 156.433°W 2009春季 9 11.2~23.6 Doherty等[35] 东西伯利亚 (15.012, 10.22~37.8) 16 74.065°N 128.872°E 2008春季 23.42 ± 0.83 16.7~43.4 Doherty等[35] 17 69.33°N 170.856°E 2008春季 14.55 ± 0.24 8.6~36.4 Doherty等[35] 18 69.119°N 170.858°E 2008春季 11.59 ± 0.19 8.6~36.4 Doherty等[35] 19 69.022°N 170.918°E 2008春季 13.26 ± 0.79 8.6~36.4 Doherty等[35] 20 69.195°N 170.946°E 2008春季 12.24 ± 0.08 8.6~36.4 Doherty等[35] 斯瓦尔巴群岛 (6.5, 2.85~15.95) 21 78.91°N 11.72°E 2007.3−2007.4 3.2 3.1~18.1 Forsstrom等[36] 22 77.897°N 18.302°E 2007.3 9.8 2.6~13.8 Forsstrom等[36]
下载: 导出CSV
表 4 2014年相较于1980年各试验海冰面积减小值
Tab. 4 Reduction in sea ice extent for each experiment in 2014 compared to 1980
试验名称 黑碳造成的海冰面积减小/km2 总海冰面积减小/ km2 黑碳贡献占比/ % E1 0.038 × 10⁶ 0.700 × 10⁶ 5.43 E2 0.047 × 10⁶ 0.705 × 10⁶ 6.67 E3 0.058 × 10⁶ 0.688 × 10⁶ 8.43 E4 0.029 × 10⁶ 0.704 × 10⁶ 4.12 融化季(5−8月) E1 0.058× 10⁶ 0.609× 10⁶ 9.52 E2 0.072× 10⁶ 0.610× 10⁶ 11.80 E3 0.087× 10⁶ 0.586× 10⁶ 14.85 E4 0.045× 10⁶ 0.617× 10⁶ 7.29
下载: 导出CSV
-
[1] Bond T C, Doherty S J, Fahey D W, et al. Bounding the role of black carbon in the climate system: a scientific assessment[J]. Journal of Geophysical Research: Atmospheres, 2013, 118(11): 5380−5552. doi: 10.1002/jgrd.50171 [2] Irannezhad M, Liu Junguo, Ahmadi B, et al. The dangers of Arctic zombie wildfires[J]. Science, 2020, 369(6508): 1171. [3] 谷玥, 陆志波, 姚俊兰. 基于CiteSpace的近30年北极环境研究热点图谱分析[J]. 极地研究, 2021, 33(3): 432−450.Gu Yue, Lu Zhibo, Yao Junlan. Atlas analysis of 30 years of arctic environmental research trends using CiteSpace[J]. Chinese Journal of Polar Research, 2021, 33(3): 432−450. [4] Wiscombe W J, Warren S G. A model for the spectral albedo of snow. I: pure snow[J]. Journal of the Atmospheric Sciences, 1980, 37(12): 2712−2733. doi: 10.1175/1520-0469(1980)037<2712:AMFTSA>2.0.CO;2 [5] Warren S G, Wiscombe W J. A model for the spectral albedo of snow. II: snow containing atmospheric aerosols[J]. Journal of the Atmospheric Sciences, 1980, 37(12): 2734−2745. doi: 10.1175/1520-0469(1980)037<2734:AMFTSA>2.0.CO;2 [6] Hansen J, Nazarenko L. Soot climate forcing via snow and ice albedos[J]. Proceedings of the National Academy of Sciences of the United States of America, 2004, 101(2): 423−428. [7] Sharma S, Andrews E, Barrie L A, et al. Variations and sources of the equivalent black carbon in the high Arctic revealed by long-term observations at alert and Barrow: 1989−2003[J]. Journal of Geophysical Research: Atmospheres, 2006, 111(D14): D14208. [8] Sharma S, Ishizawa M, Chan D, et al. 16-year simulation of Arctic black carbon: transport, source contribution, and sensitivity analysis on deposition[J]. Journal of Geophysical Research: Atmospheres, 2013, 118(2): 943−964. doi: 10.1029/2012JD017774 [9] Ruppel M M, Eckhardt S, Pesonen A, et al. Observed and modeled black carbon deposition and sources in the western Russian Arctic 1800−2014[J]. Environmental Science & Technology, 2021, 55(8): 4368−4377. [10] Xian Peng, Zhang Jianglong, O'Neill N T, et al. Arctic spring and summertime aerosol optical depth baseline from long-term observations and model reanalyses – part 1: climatology and trend[J]. Atmospheric Chemistry and Physics, 2022, 22(15): 9915−9947. doi: 10.5194/acp-22-9915-2022 [11] Dou T, Xiao Cheche, Shindell D T, et al. The distribution of snow black carbon observed in the Arctic and compared to the GISS-PUCCINI model[J]. Atmospheric Chemistry and Physics, 2012, 12(17): 7995−8007. doi: 10.5194/acp-12-7995-2012 [12] Goldenson N, Doherty S J, Bitz C M, et al. Arctic climate response to forcing from light-absorbing particles in snow and sea ice in CESM[J]. Atmospheric Chemistry and Physics, 2012, 12(17): 7903−7920. doi: 10.5194/acp-12-7903-2012 [13] Li Yang, Flanner M G. Investigating the impact of aerosol deposition on snowmelt over the Greenland ice sheet using a large-ensemble kernel[J]. Atmospheric Chemistry and Physics, 2018, 18(21): 16005−16018. doi: 10.5194/acp-18-16005-2018 [14] Chen Yang, Li Xuejing, Xing Yuxuan, et al. Historical changes of black carbon in snow and its radiative forcing in CMIP6 models[J]. Atmosphere, 2022, 13(11): 1774. doi: 10.3390/atmos13111774 [15] Shen S, Ostrenga D M, Zeng Jian, et al. Studying diurnal variations of aerosols with NASA MERRA-2 reanalysis data[C]//Annual American Meteorological Society (AMS) Meeting 2018. Austin: American Meteorological Society, 2018. [16] Danabasoglu G, Lamarque J F, Bacmeister J, et al. The community earth system model version 2 (CESM2)[J]. Journal of Advances in Modeling Earth Systems, 2020, 12(2): e2019MS001916. doi: 10.1029/2019MS001916 [17] Swart N C, Cole J N S, Kharin V V, et al. The Canadian earth system model version 5 (CanESM5.0. 3)[J]. Geoscientific Model Development, 2019, 12(11): 4823−4873. doi: 10.5194/gmd-12-4823-2019 [18] Kataoka T, Tatebe H, Koyama H, et al. Seasonal to decadal predictions with MIROC6: description and basic evaluation[J]. Journal of Advances in Modeling Earth Systems, 2020, 12(12): e2019MS002035. doi: 10.1029/2019MS002035 [19] Yukimoto S, Kawai H, Koshiro T, et al. The meteorological research institute earth system model version 2.0, MRI-ESM2.0: description and basic evaluation of the physical component[J]. Journal of the Meteorological Society of Japan, 2019, 97(5): 931−965. [20] Volodin E. The mechanisms of cloudiness evolution responsible for equilibrium climate sensitivity in climate model INM-CM4-8[J]. Geophysical Research Letters, 2021, 48(24): e2021GL096204. doi: 10.1029/2021GL096204 [21] Boucher O, Servonnat J, Albright A L, et al. Presentation and evaluation of the IPSL-CM6A-LR climate model[J]. Journal of Advances in Modeling Earth Systems, 2020, 12(7): e2019MS002010. doi: 10.1029/2019MS002010 [22] Seland Ø, Bentsen M, Olivié D, et al. Overview of the Norwegian Earth System Model (NorESM2) and key climate response of CMIP6 DECK, historical, and scenario simulations[J]. Geoscientific Model Development, 2020, 13(12): 6165-6200. [23] Döscher R, Acosta M, Alessandri A, et al. The EC-Earth3 Earth system model for the coupled model intercomparison project 6[J]. Geoscientific Model Development, 2022, 15(7): 2973−3020. doi: 10.5194/gmd-15-2973-2022 [24] Dunne J P, Horowitz L W, Adcroft A J, et al. The GFDL Earth system model version 4.1 (GFDL-ESM 4.1): overall coupled model description and simulation characteristics[J]. Journal of Advances in Modeling Earth Systems, 2020, 12(11): e2019MS002015. doi: 10.1029/2019MS002015 [25] Hersbach H, Bell B, Berrisford P, et al. ERA5 monthly averaged data on single levels from 1940 to present[EB/OL]. https://cds.climate.copernicus.eu/cdsapp#!/dataset/reanalysis-era5-single-levels-monthly-means%3Ftab=form?tab=overview, 2019-04-18. [26] Key J, Wang X, Liu Y. NOAA Climate Data Record of AVHRR Polar Pathfinder Extended (APP-X), Version 1.0[J]. NOAA National Centers for Environmental Information, 2014. [27] DiGirolamo N E, Parkinson C L, Cavalieri D J, et al. Sea ice concentrations from nimbus-7 SMMR and DMSP SSM/I-SSMIS passive microwave data, version 2[R]. Boulder: NASA National Snow and Ice Data Center Distributed Active Archive Center, 2022. [28] Hunke E, Lipscomb W, Jones P, et al. CICE, the Los Alamos sea ice model[R]. Los Alamos: Los Alamos National Laboratory (LANL), 2017. [29] Briegleb P, Light B. A delta-eddington mutiple scattering parameterization for solar radiation in the sea ice component of the community climate system model[R]. Boulder: National Center for Atmospheric Research, 2007. [30] Holland M M, Bailey D A, Briegleb B P, et al. Improved sea ice shortwave radiation physics in CCSM4: the impact of melt ponds and aerosols on Arctic sea ice[J]. Journal of Climate, 2012, 25(5): 1413−1430. doi: 10.1175/JCLI-D-11-00078.1 [31] Flanner M G, Zender C S, Randerson J T, et al. Present‐day climate forcing and response from black carbon in snow[J]. Journal of Geophysical Research: Atmospheres, 2007, 112(D11): D11202. [32] 赵玉娇, 高坛光, 张玉兰, 等. 典型冰冻圈区域河流黑碳研究进展[J]. 冰川冻土, 2023, 45(2): 327−340.Zhao Yujiao, Gao Tanguang, Zhang Yulan, et al. Research progress of riverine black carbon in typical cryospheric regions[J]. Journal of Glaciology and Geocryology, 2023, 45(2): 327−340. [33] Jurado E, Dachs J, Duarte C M, et al. Atmospheric deposition of organic and black carbon to the global oceans[J]. Atmospheric Environment, 2008, 42(34): 7931−7939. doi: 10.1016/j.atmosenv.2008.07.029 [34] Jurado E, Jaward F, Lohmann R, et al. Wet deposition of persistent organic pollutants to the global oceans[J]. Environmental Science & Technology, 2005, 39(8): 2426−2435. [35] Dou Tingfeng, Xiao Cunde. An overview of black carbon deposition and its radiative forcing over the Arctic[J]. Advances in Climate Change Research, 2016, 7(3): 115−122. doi: 10.1016/j.accre.2016.10.003 [36] Zhang Zilu, Zhou Libo, Zhang Meigen. A progress review of black carbon deposition on Arctic snow and ice and its impact on climate change[J]. Advances in Polar Science, 2024, 35(2): 178−191. [37] Doherty S J, Warren S G, Grenfell T C, et al. Light-absorbing impurities in Arctic snow[J]. Atmospheric Chemistry and Physics, 2010, 10(23): 11647−11680. doi: 10.5194/acp-10-11647-2010 [38] Forsström S, Ström J, Pedersen C A, et al. Elemental carbon distribution in Svalbard snow[J]. Journal of Geophysical Research: Atmospheres, 2009, 114(D19): D19112. [39] 曹淑涛, 苏洁, 李涛, 等. 基于Icepack海冰柱模式的融池反照率模拟研究[J]. 海洋学报, 2021, 43(7): 63−74.Cao Shutao, Su Jie, Li Tao, et al. Study on melt pond albedo based on Icepack sea ice column model[J]. Haiyang Xuebao, 2021, 43(7): 63−74. [40] Ruppel M M, Isaksson E, Ström J, et al. Increase in elemental carbon values between 1970 and 2004 observed in a 300-year ice core from Holtedahlfonna (Svalbard)[J]. Atmospheric Chemistry and Physics, 2014, 14(20): 11447−11460. doi: 10.5194/acp-14-11447-2014 [41] Ruppel M M, Gustafsson Ö, Rose N L, et al. Spatial and temporal patterns in black carbon deposition to dated Fennoscandian Arctic lake sediments from 1830 to 2010[J]. Environmental Science & Technology, 2015, 49(24): 13954−13963. [42] Du Jiao, Ma Jianmin, Huang Tao, et al. Response of arctic black carbon contamination and climate forcing to global supply chain relocation[J]. Environmental Science & Technology, 2023, 57(23): 8691−8700. [43] Zhao Che, Hu Zhiyuan, Qian Y, et al. Simulating black carbon and dust and their radiative forcing in seasonal snow: a case study over North China with field campaign measurements[J]. Atmospheric Chemistry and Physics, 2014, 14(20): 11475−11491. doi: 10.5194/acp-14-11475-2014 [44] Chen Xintong, Kang Shichang, Yang Junhua, et al. Investigation of black carbon climate effects in the Arctic in winter and spring[J]. Science of the Total Environment, 2021, 751: 142145. doi: 10.1016/j.scitotenv.2020.142145 -

计量
- 文章访问数: 412
- HTML全文浏览量: 208
- PDF下载量: 73
- 被引次数: 0
