Investigation methods of submesoscale fronts at the edge of mesoscale eddies in the ocean
-
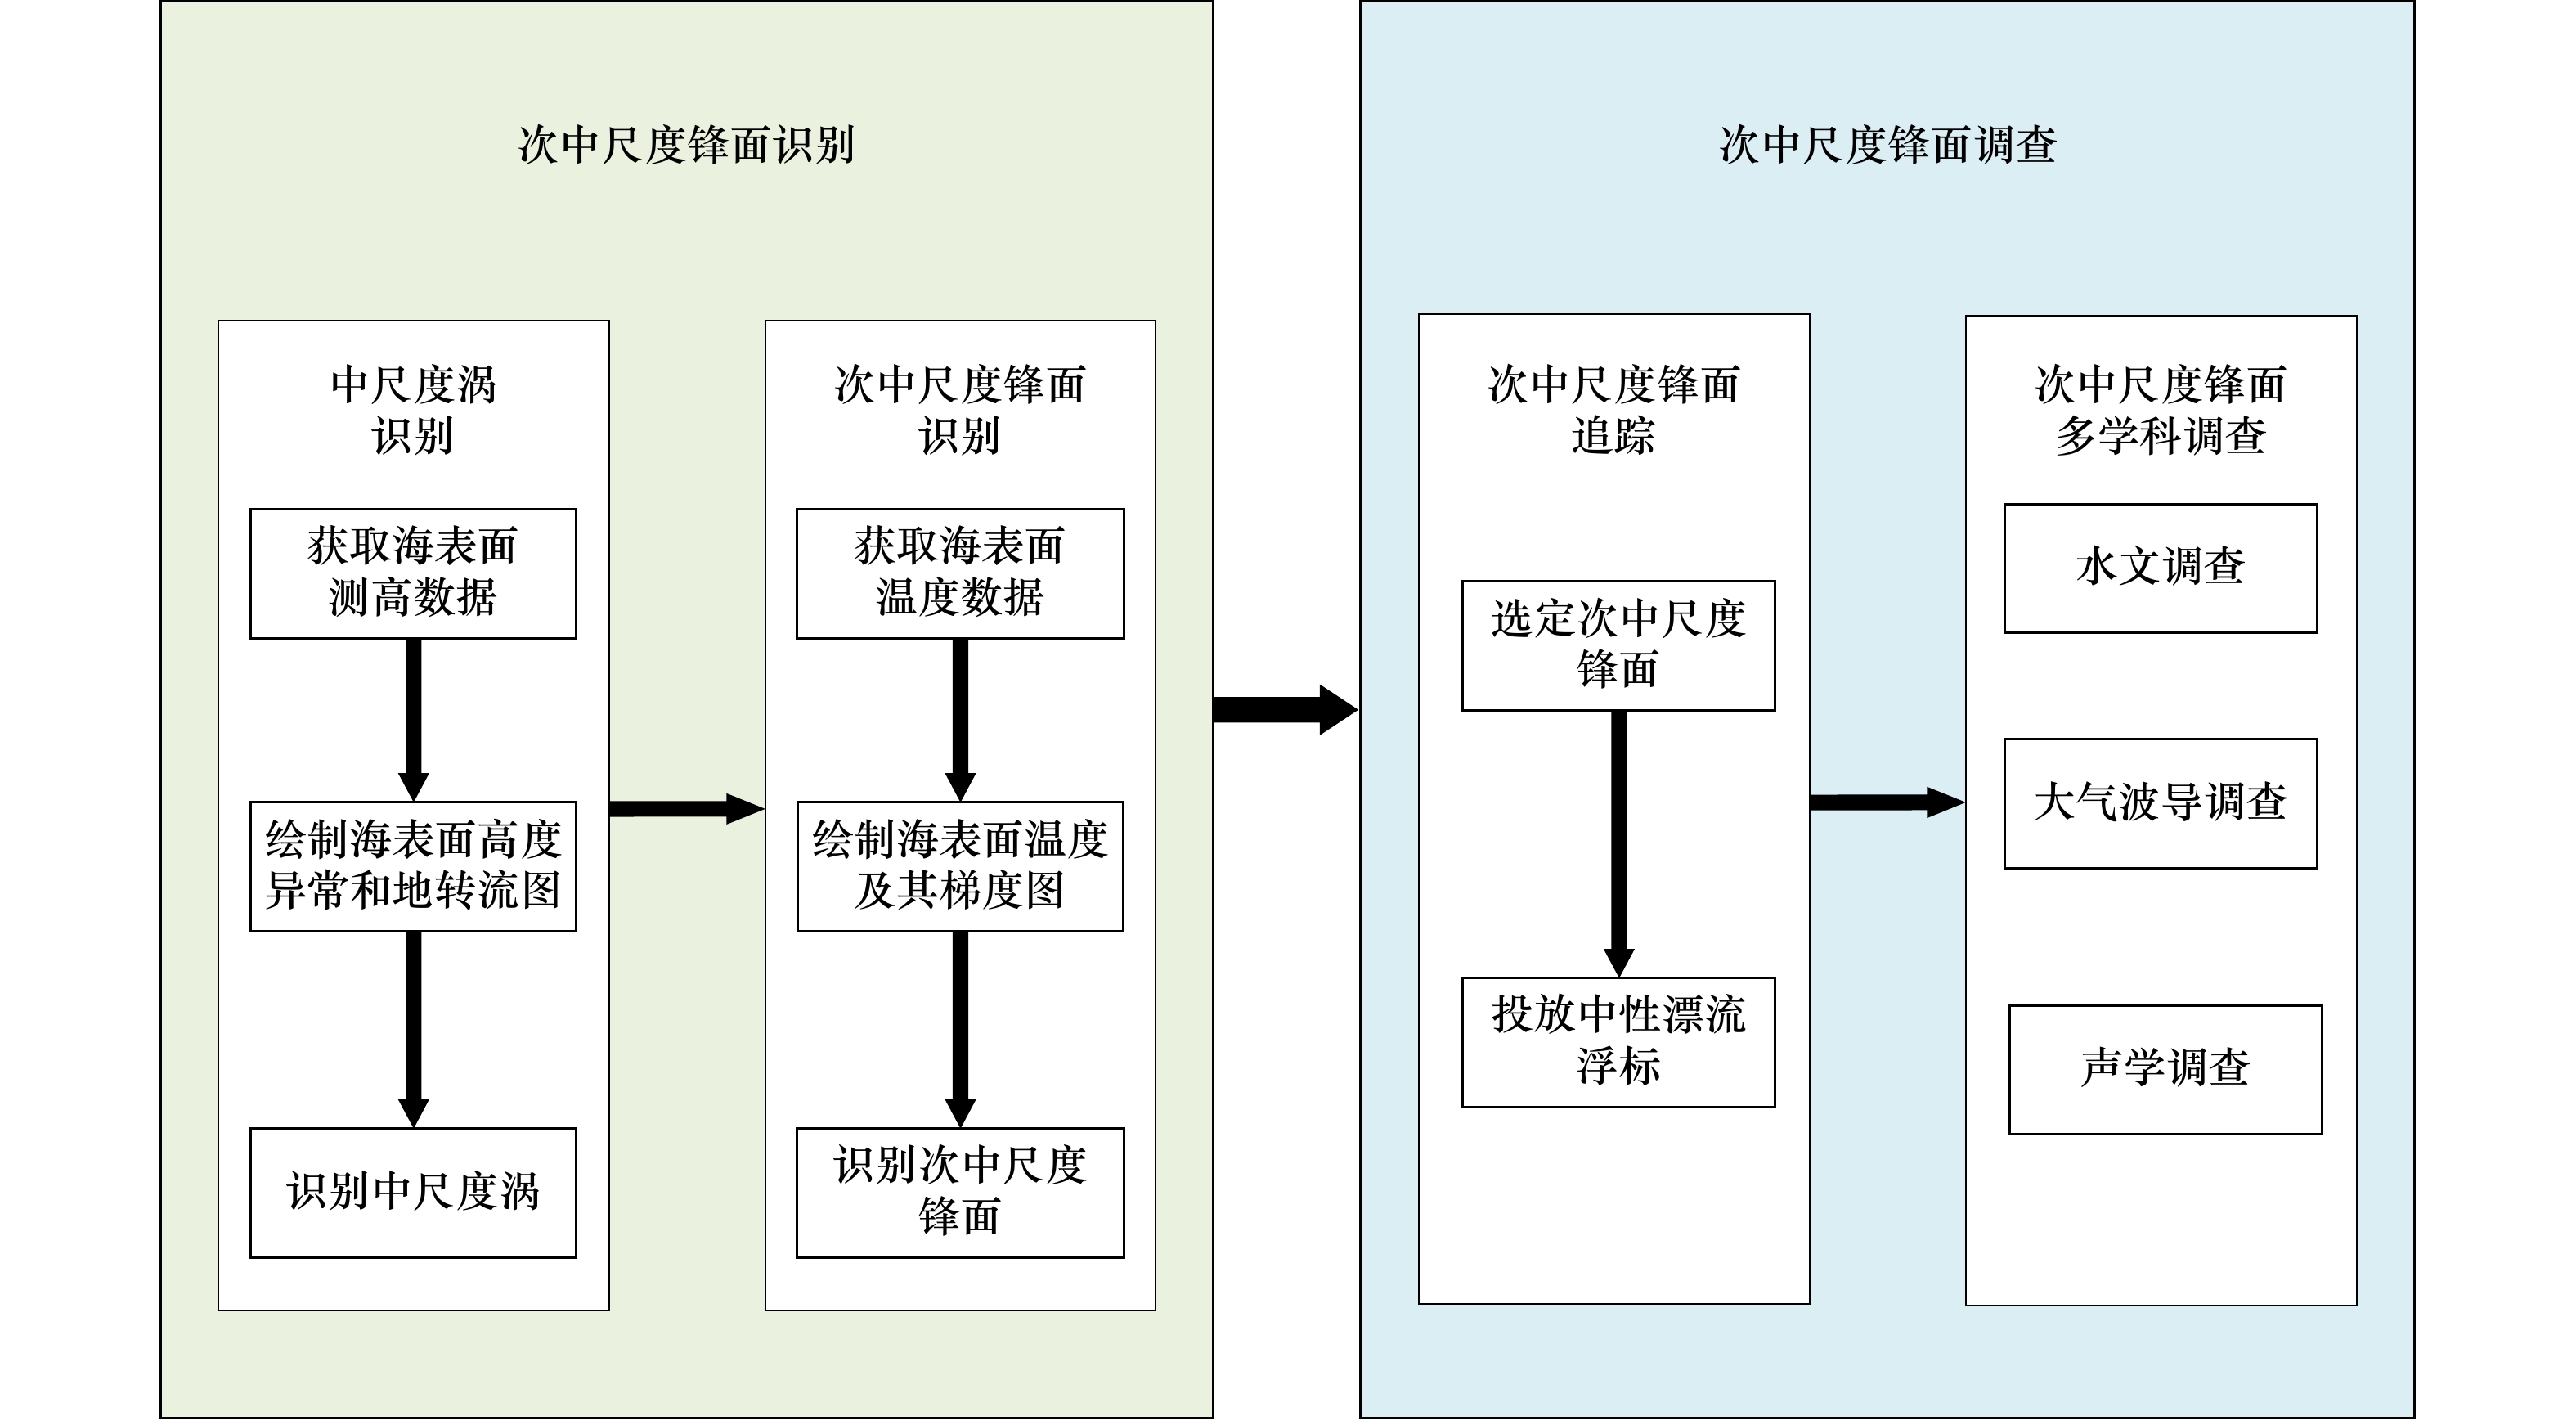
摘要: 海洋中尺度涡旋与其边缘的次中尺度锋面之间存在强烈的物质和能量交换以及复杂的动力过程。目前,对中尺度涡旋的调查研究已经日趋成熟,但由于次中尺度锋面的空间尺度小、时间变化快,对其三维结构的调查存在较大挑战。本文提出一种海洋中尺度涡旋边缘次中尺度锋面的调查方法。首先利用多源卫星遥感数据对中尺度涡旋及其边缘的次中尺度锋面进行识别,然后使用多型船载调查设备进行多学科综合调查。利用该方法对2023年8月21日至8月25日黑潮延伸体海域一个典型涡旋边缘次中尺度锋面进行调查方案设计。本文提出的调查方法可以有效地实现对中尺度涡旋边缘次中尺度锋面的识别、追踪与调查。Abstract: There are strong exchange of matter and energy and complex dynamic processes between mesoscale eddies and submesoscale fronts at their edges. At present, the investigation of mesoscale eddies has become more and more mature, but because of the small spatial scale and rapid time change of the submesoscale front, it is a great challenge to investigate its three-dimensional structure. In this paper, a new method is proposed to investigate the submesoscale front at the edge of the ocean mesoscale eddy. Firstly, the submesoscale front at the edge of the mesoscale eddies is identified using multi-source satellite remote sensing data, and then the multi-type shipborne survey equipment is used for multidisciplinary investigation. A submesoscale front at the edge of typical eddies in the Kuroshio Extension area from August 21 to August 25, 2023 is investigated by using this method. The survey method proposed in this paper can effectively identify, track and investigate the submesoscale front at the edge of mesoscale eddies.
-
Key words:
- submesoscale process /
- ocean front /
- investigation method /
- Kuroshio Extension
-
图 3 CMEMS卫星高度计2023年8月21日海表面高度异常及涡旋识别结果
红色闭合等值线表示反气旋涡,蓝色闭合等值线表示气旋涡,黑色箭头表示地转流,红色星号表示反气旋涡强度中心,蓝色星号表示气旋涡强度中心,绿色方框区域为涡旋边缘的一条典型次中尺度锋面附近海域
Fig. 3 Results of sea level anomaly and eddies identified on August 21, 2023 by CMEMS satellite altimeter
The red closed isoline represents the anticyclonic eddy, the blue closed isoline represents the cyclonic eddy, the black arrow represents the geostrophic current, the red asterisk represents the intensity center of the anticyclonic eddy, and the blue asterisk represents the intensity center of the cyclonic eddy. The green box area is the sea area near a typical submesoscale front at the edge of the eddies
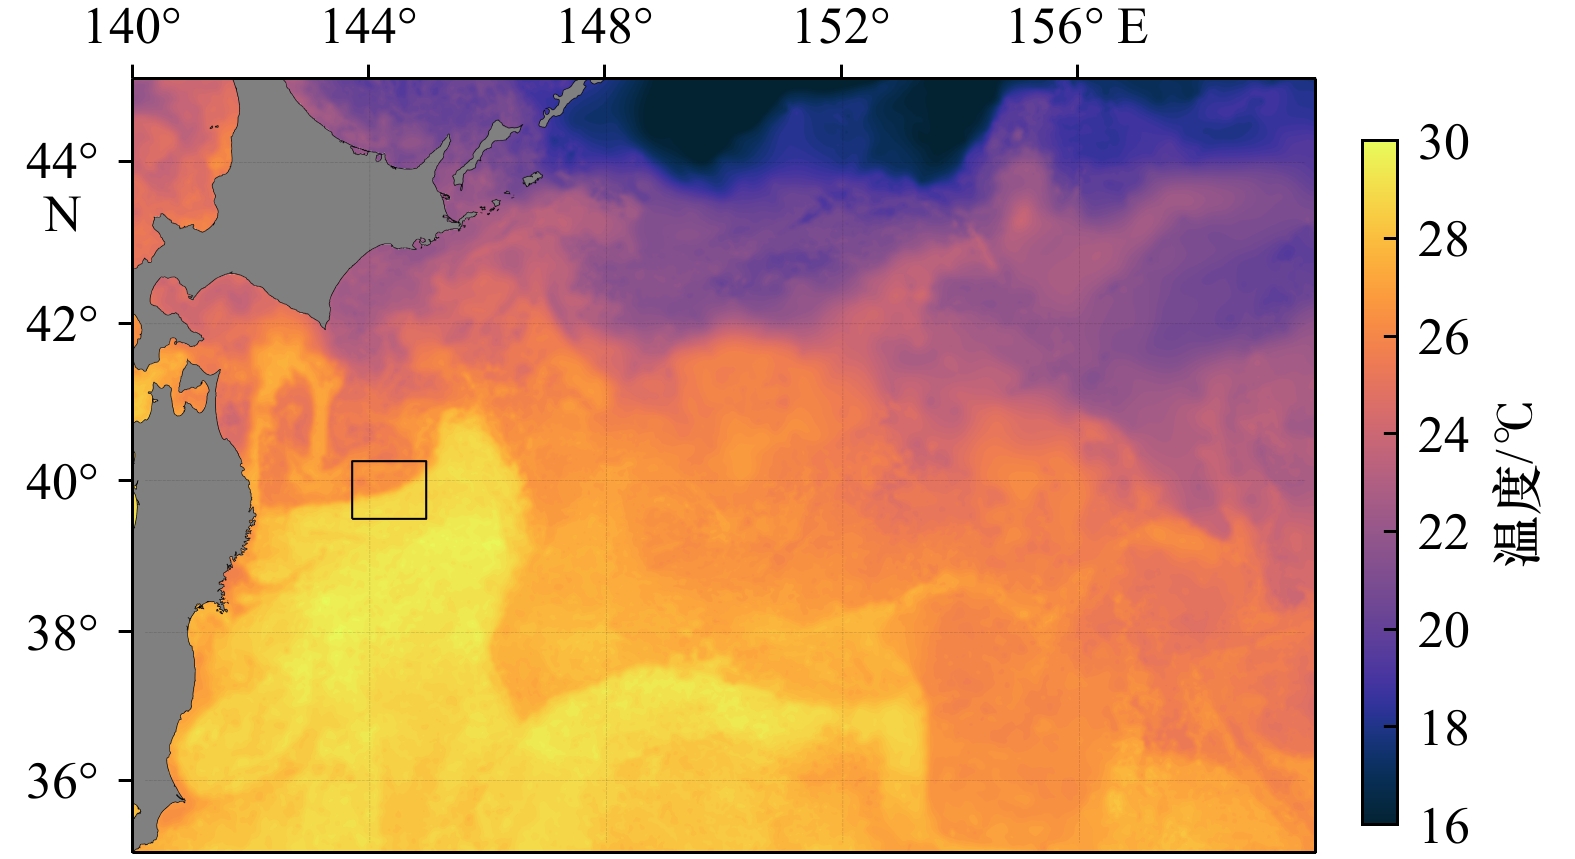
图 4 MURSST/CoralTemp/OSTIA/OISST 4种SST卫星遥感数据对2023年8月21日黑潮延伸体海域温度梯度值的分布情况
图4a黑色方框区域为涡旋边缘的一条典型次中尺度锋面附近海域
Fig. 4 The distribution of temperature gradient in Kuroshio Extension sea area on August 21, 2023 based on SST satellite remote sensing data of MURSST/CoralTemp/OSTIA/OISST
The black box area in Fig.4a is the sea area near a typical submesoscale front at the edge of the eddies
图 6 2023年8月21日调查海域周边SLA、地转流及中尺度涡分布(a),2023年8月21日调查锋面周边SST、SLA及地转流分布(b)
图6a中绿色方框为典型中尺度涡边缘次中尺度锋面所在区域,图6b中品红色线为SST等值线(℃),填色部分表示SLA,黑色箭头表示地转流
Fig. 6 Distribution of SLA, geostrophic currents and mesoscale eddies around the surveyed sea area on August 21, 2023 (a); distribution of SST, SLA and geostrophic currents around the surveyed front on August 21, 2023 (b)
In Fig.6a, the green box in the middle is the area where the submesoscale front at the edge of typical mesoscale eddies resides. In Fig.6b, the magenta line is the SST contour line (℃), the colored part represents SLA, and the black arrow represents geostrophic currents
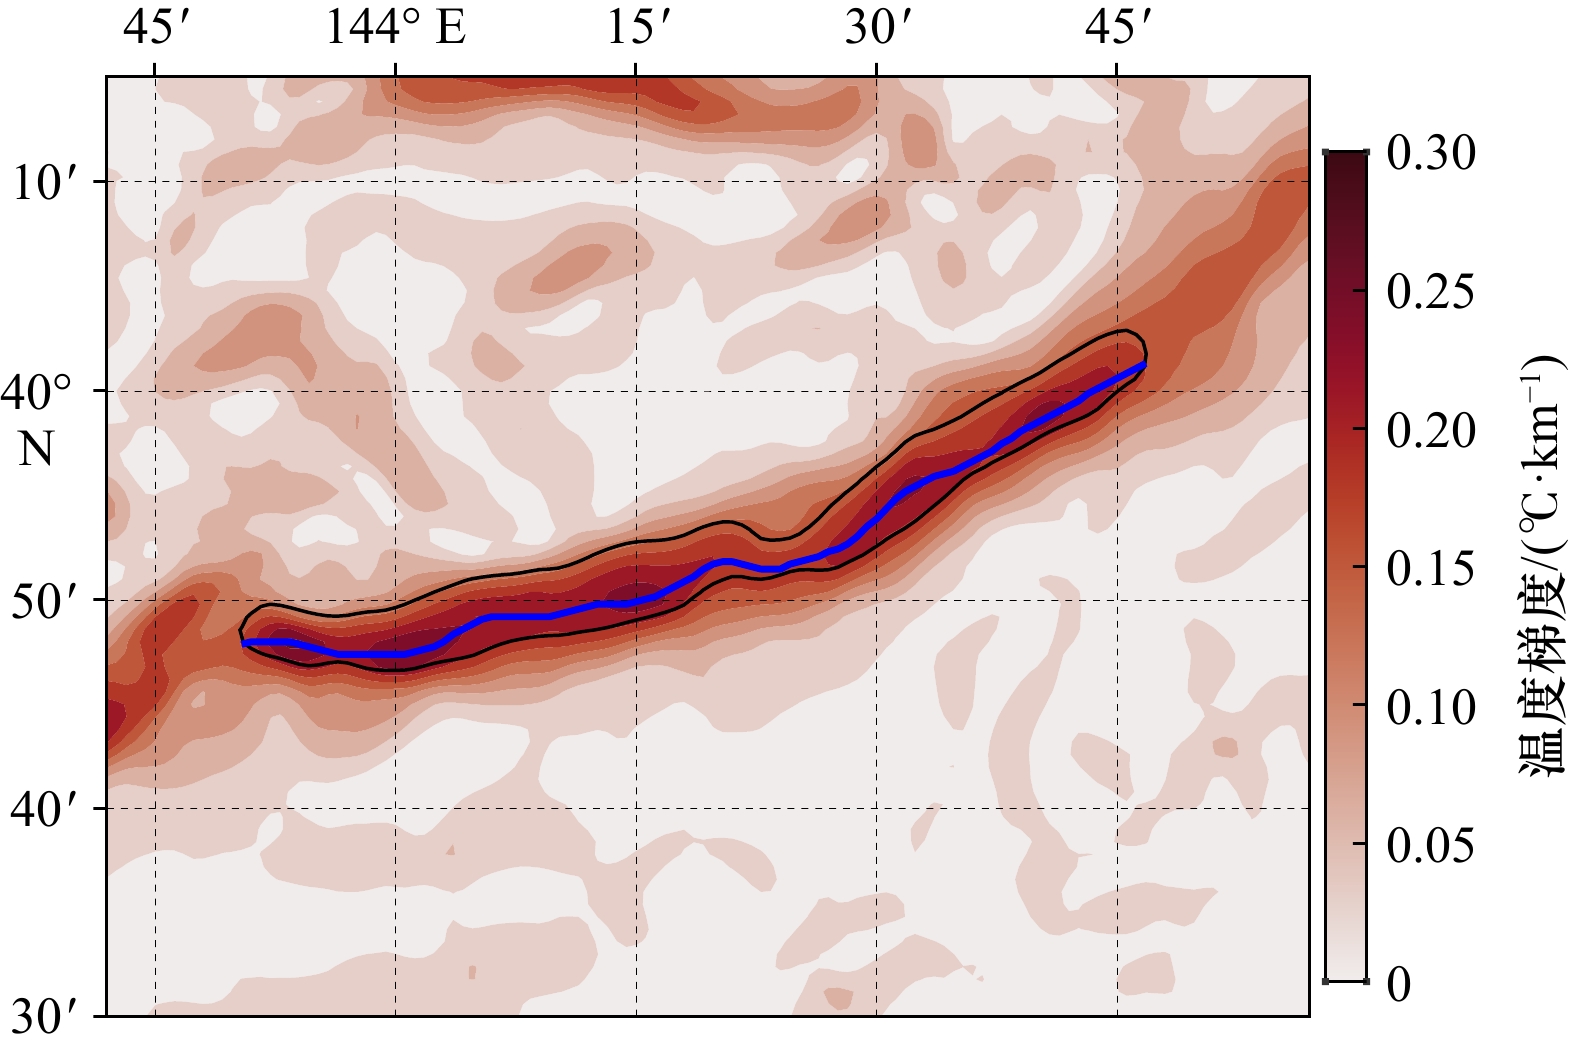
图 7 2023年8月21日涡旋边缘的典型次中尺度锋面附近海域SST梯度分布
黑线为0.18℃/km SST梯度等值线,蓝线为锋面主轴
Fig. 7 Sea surface temperature gradient distribution near a typical submesoscale front at the edge of the eddies on August 21, 2023
The black line is the isoline of sea surface temperature gradient of 0.18℃/km, and the blue line is the main axis of the front
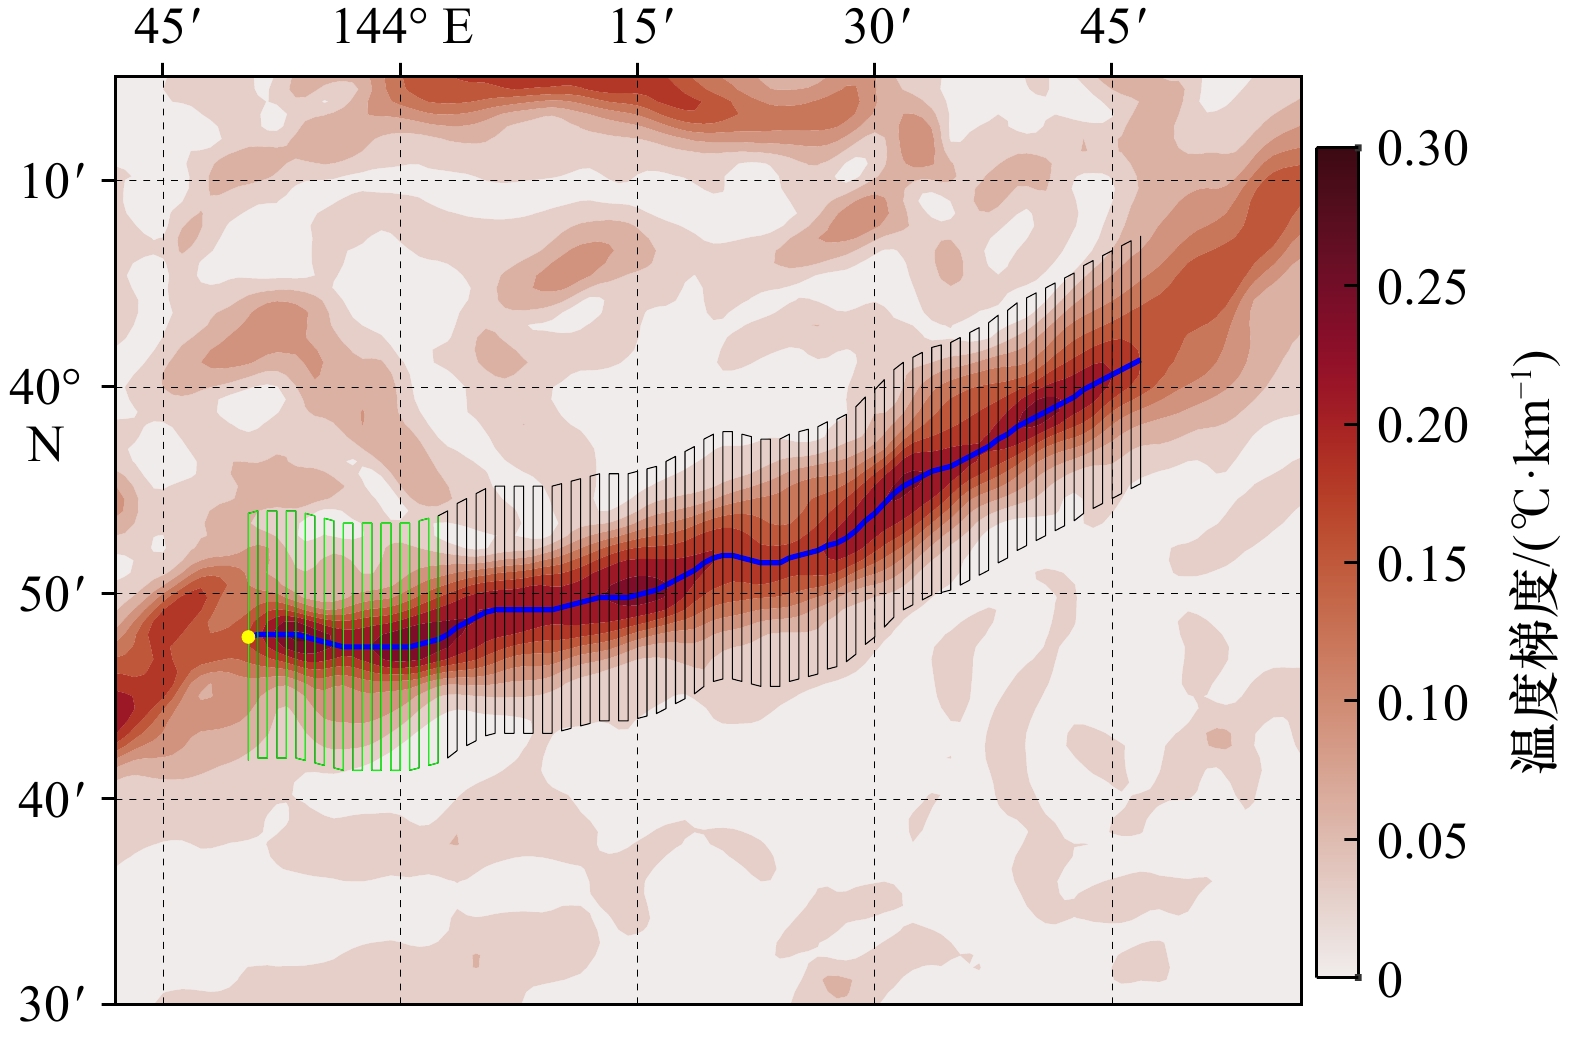
图 8 2023年8月21日典型次中尺度锋面附近海域温度梯度值分布
黄色圆点为中性漂流浮标的投放位置,蓝线为锋面主轴,黑线为调查航线,绿线为8月21日计划调查航线
Fig. 8 Distribution of temperature gradient in the sea area near a typical submesoscale front on August 21, 2023
The yellow dot shows the location of the neutrally buoyant float, the blue line shows the main axis of the front, the black line shows the survey course, and the green line shows the planned survey course on August 21
图 9 a、c、e、g为2023年8月22日至8月25日调查海域周边SLA、地转流及中尺度涡分布,b、d、f、h为2023年8月22日至8月25日调查锋面周边SST、SLA、地转流及主轴分布
图9b、d、f、h中青色线段为锋面主轴
Fig. 9 a, c, e, g are the distributions of SLA, geostrophic currents and mesoscale eddies around the surveyed sea area from August 22 to August 25, 2023; b, d, f, h are the distributions of SST, SLA, geostrophic currents and main axis around the surveyed front from August 22 to August 25, 2023
The cyan line segment in Fig.9 b, d, f, h is the main axis of the front
图 10 MURSST数据2023年8月22日至8月25日典型次中尺度锋面附近海域温度梯度分布
叠加锋面主轴及走航调查路线,其中绿色部分为当日计划调查航线
Fig. 10 MURSST data temperature gradient distributions of the sea area near a typical submesoscale front from August 22 to August 25, 2023
Superposed by the main axis of the front and the navigational survey route, in which the green part is the planned survey route on that day
表 1 不同航行速度下对应的MVP最大投放深度、最大投放深度对应的周期时间、平均速度、200 m投放深度周期时间、满足1 km观测分辨率最大周期时间
Tab. 1 Under different sailing speeds, the corresponding MVP maximum depth, cycle time corresponding to the maximum depth, average speed, cycle time of 200 m depth, and the maximum cycle time meeting the observation resolution of 1 km
航行速度/kn 最大投放
深度/m最大投放深度单个
周期时间/min平均速度/(m·s−1) 200 m投放深度单个
周期时间/min1 km观测分辨率最大
周期时间/min1 520 9.9 1.75 3.81 64.79 2 457 8.4 1.81 3.68 32.40 3 406 7.4 1.83 3.65 21.60 4 368 6.9 1.78 3.75 16.20 5 335 6.5 1.72 3.88 12.96 6 310 6.4 1.61 4.13 10.80 7 285 6.0 1.58 4.21 9.26 8 265 5.9 1.50 4.45 8.10 9 250 5.8 1.44 4.64 7.20 10 235 5.8 1.35 4.94 6.48 11 223 5.7 1.30 5.11 5.89 12 200 5.6 1.19 5.60 5.40 -
[1] Verma V, Sarkar S. Lagrangian three-dimensional transport and dispersion by submesoscale currents at an upper-ocean front[J]. Ocean Modelling, 2021, 165: 101844. doi: 10.1016/j.ocemod.2021.101844 [2] Ito D, Suga T, Kouketsu S, et al. Spatiotemporal evolution of submesoscale filaments at the periphery of an anticyclonic mesoscale eddy north of the Kuroshio Extension[J]. Journal of Oceanography, 2021, 77(5): 763−780. doi: 10.1007/s10872-021-00607-4 [3] Kuroda H, Toya Y. High-resolution sea surface temperatures derived from Landsat 8: a study of submesoscale frontal structures on the pacific shelf off the Hokkaido coast, Japan[J]. Remote Sensing, 2020, 12(20): 3326. doi: 10.3390/rs12203326 [4] McWilliams J C. Submesoscale currents in the ocean[J]. Proceedings of the Royal Society A: Mathematical, Physical and Engineering Sciences, 2016, 472(2189): 20160117. doi: 10.1098/rspa.2016.0117 [5] Mahadevan A, Tandon A. An analysis of mechanisms for submesoscale vertical motion at ocean fronts[J]. Ocean Modelling, 2006, 14(3/4): 241−256. [6] Siegelman L, O’Toole M, Flexas M, et al. Submesoscale ocean fronts act as biological hotspot for southern elephant seal[J]. Scientific Reports, 2019, 9(1): 5588. doi: 10.1038/s41598-019-42117-w [7] Bendtsen J, Sørensen L L, Daugbjerg N, et al. Phytoplankton diversity explained by connectivity across a mesoscale frontal system in the open ocean[J]. Scientific Reports, 2023, 13(1): 12117. doi: 10.1038/s41598-023-38831-1 [8] Siegelman L, Klein P, Rivière P, et al. Enhanced upward heat transport at deep submesoscale ocean fronts[J]. Nature Geoscience, 2020, 13(1): 50−55. doi: 10.1038/s41561-019-0489-1 [9] Thomas L N, Tandon A, Mahadevan A. Submesoscale processes and dynamics[M]//Hecht M W, Hasumi H. Ocean Modeling in an Eddying Regime. Washington: American Geophysical Union, 2008: 17-38. [10] 张旭, 经志友, 郑瑞玺, 等. 黑潮延伸体海域典型涡旋的次中尺度特征分析[J]. 热带海洋学报, 2021, 40(6): 31−40. doi: 10.11978/2020152Zhang Xu, Jing Zhiyou, Zheng Ruixi, et al. Submesoscale characteristics of a typical anticyclonic mesoscale eddy in Kuroshio Extension[J]. Journal of Tropical Oceanography, 2021, 40(6): 31−40. doi: 10.11978/2020152 [11] Jing Zhao, Wang Shengpeng, Wu Lixin, et al. Maintenance of mid-latitude oceanic fronts by mesoscale eddies[J]. Science Advances, 2020, 6(31): eaba7880. doi: 10.1126/sciadv.aba7880 [12] 张永垂, 楼鸿程, 姜德良, 等. 海洋次中尺度现象调查概述[J]. 海洋测绘, 2024, 44(3): 7−11, 17. Zhang Yongchui, Lou Hongcheng, Jiang Deliang, et al. Overview of oceanic submesoscales survey[J]. Hydrographic Surveying and Charting, 2024, 44(3): 7−11, 17. [13] Zhu Ruichen, Yang Haiyuan, Li Mingkui, et al. Observations reveal vertical transport induced by submesoscale front[J]. Scientific Reports, 2024, 14(1): 4407. doi: 10.1038/s41598-024-54940-x [14] Qiu Chunhua, He Benjun, Wang Dongxiao, et al. Mechanisms of a shelf submesoscale front in the northern South China Sea[J]. Deep Sea Research Part I: Oceanographic Research Papers, 2023, 202: 104197. doi: 10.1016/j.dsr.2023.104197 [15] Johnson L, Lee C M, D’Asaro E A, et al. Restratification at a California current upwelling front. Part I: observations[J]. Journal of Physical Oceanography, 2020, 50(5): 1455−1472. doi: 10.1175/JPO-D-19-0203.1 [16] Shcherbina A Y, Sundermeyer M A, Kunze E, et al. The LatMix summer campaign: submesoscale stirring in the upper ocean[J]. Bulletin of the American Meteorological Society, 2015, 96(8): 1257−1279. doi: 10.1175/BAMS-D-14-00015.1 [17] Poje A C, Özgökmen T M, Lipphardt Jr B L, et al. Submesoscale dispersion in the vicinity of the Deepwater Horizon spill[J]. Proceedings of the National Academy of Sciences of the United States of America, 2014, 111(35): 12693−12698. [18] Garabato A C N, Yu Xiaolong, Callies J, et al. Kinetic energy transfers between mesoscale and submesoscale motions in the open ocean’s upper layers[J]. Journal of Physical Oceanography, 2022, 52(1): 75−97. doi: 10.1175/JPO-D-21-0099.1 [19] Zhang Zhiwei, Zhang Xincheng, Qiu Bo, et al. Submesoscale currents in the subtropical upper ocean observed by long-term high-resolution mooring arrays[J]. Journal of Physical Oceanography, 2021, 51(1): 187−206. doi: 10.1175/JPO-D-20-0100.1 [20] Ding Yang, Xu Lixiao, Xie Shangping, et al. Submesoscale frontal instabilities modulate large-scale distribution of the winter deep mixed layer in the Kuroshio-Oyashio extension[J]. Journal of Geophysical Research: Oceans, 2022, 127(12): e2022JC018915. doi: 10.1029/2022JC018915 [21] Chin T M, Vazquez-Cuervo J, Armstrong E M. A multi-scale high-resolution analysis of global sea surface temperature[J]. Remote Sensing of Environment, 2017, 200: 154−169. doi: 10.1016/j.rse.2017.07.029 [22] Maturi E, Harris A, Mittaz J, et al. A new high-resolution sea surface temperature blended analysis[J]. Bulletin of the American Meteorological Society, 2017, 98(5): 1015−1026. doi: 10.1175/BAMS-D-15-00002.1 [23] Good S, Fiedler E, Mao Chongyuan, et al. The current configuration of the OSTIA system for operational production of foundation sea surface temperature and ice concentration analyses[J]. Remote Sensing, 2020, 12(4): 720. doi: 10.3390/rs12040720 [24] Huang Boyin, Liu Chunying, Banzon V, et al. Improvements of the daily optimum interpolation sea surface temperature (DOISST) version 2.1[J]. Journal of Climate, 2021, 34(8): 2923−2939. doi: 10.1175/JCLI-D-20-0166.1 [25] Gould W J. From Swallow floats to Argo—the development of neutrally buoyant floats[J]. Deep Sea Research Part II: Topical Studies in Oceanography, 2005, 52(3/4): 529−543. [26] D’Asaro E A. Performance of autonomous Lagrangian floats[J]. Journal of Atmospheric and Oceanic Technology, 2003, 20(6): 896−911. doi: 10.1175/1520-0426(2003)020<0896:POALF>2.0.CO;2 [27] 刘钊. 具有实时通信功能的新型海洋观测浮标的结构优化与控制系统研究[D]. 天津: 天津大学, 2009.Liu Zhao. Structure optimization and control system design of a new type of marine submersible buoy system with real time communication function[D]. Tianjin: Tianjin University, 2009. [28] Furlong A, Lamplugh M. In-situ underway sound velocity profiling for calibration of multibeam sounders using a moving vessel profiler (MVP)[J]. International Hydrographic Review, 2000, 1(2): 47-54. [29] 任强, 于非, 刁新源, 等. 处理走航式海洋多参数剖面测量系统(MVP)温度和电导率滞后效应的方法[J]. 海洋科学, 2014, 38(8): 59−66. doi: 10.11759/hykx20130823002Ren Qiang, Yu Fei, Diao Xinyuan, et al. A data processing method on the hysteresis effect of temperature and conductivity of moving vessel profiler (MVP)[J]. Marine Sciences, 2014, 38(8): 59−66. doi: 10.11759/hykx20130823002 [30] 刘彦祥. ADCP技术发展及其应用综述[J]. 海洋测绘, 2016, 36(2): 45−49. doi: 10.3969/j.issn.1671-3044.2016.02.011Liu Yanxiang. Review on development of ADCP technology and its application[J]. Hydrographic Surveying and Charting, 2016, 36(2): 45−49. doi: 10.3969/j.issn.1671-3044.2016.02.011 [31] Chelton D B, Schlax M G, Samelson R M. Global observations of nonlinear mesoscale eddies[J]. Progress in Oceanography, 2011, 91(2): 167−216. doi: 10.1016/j.pocean.2011.01.002 [32] Isern-Fontanet J, García-Ladona E, Font J. Identification of marine eddies from Altimetric maps[J]. Journal of Atmospheric and Oceanic Technology, 2003, 20(5): 772−778. doi: 10.1175/1520-0426(2003)20<772:IOMEFA>2.0.CO;2 [33] Robinson S K. Coherent motions in the turbulent boundary layer[J]. Annual Review of Fluid Mechanics, 1991, 23: 601−639. doi: 10.1146/annurev.fl.23.010191.003125 [34] Nencioli F, Dong C M, Dickey T, et al. A vector geometry–based eddy detection algorithm and its application to a high-resolution numerical model product and high-frequency radar surface velocities in the southern California bight[J]. Journal of Atmospheric and Oceanic Technology, 2010, 27(3): 564−579. doi: 10.1175/2009JTECHO725.1 [35] Souza J M A C, De Boyer Montégut C, Le Traon P Y. Comparison between three implementations of automatic identification algorithms for the quantification and characterization of mesoscale eddies in the South Atlantic Ocean[J]. Ocean Science, 2011, 7(3): 317−334. doi: 10.5194/os-7-317-2011 [36] Shao Mingming, Ortiz-Suslow D G, Haus B K, et al. The variability of winds and fluxes observed near submesoscale fronts[J]. Journal of Geophysical Research: Oceans, 2019, 124(11): 7756−7780. doi: 10.1029/2019JC015236 [37] 柴永平, 占祥生. MVP在综合调测中对多波束声速改正的应用[J]. 海洋技术学报, 2019, 38(6): 30−34.Chai Yongping, Zhan Xiangsheng. Application of the MVP for multi-beam sound velocity correction[J]. Journal of Ocean Technology, 2019, 38(6): 30−34. [38] Xi Jingyuan, Wang Yuntao, Feng Zhixuan, et al. Variability and intensity of the sea surface temperature front associated with the Kuroshio extension[J]. Frontiers in Marine Science, 2022, 9: 836469. doi: 10.3389/fmars.2022.836469 [39] Kwon Y O, Alexander M A, Bond N A, et al. Role of the gulf stream and Kuroshio–Oyashio systems in large-scale atmosphere–ocean interaction: a review[J]. Journal of Climate, 2010, 23(12): 3249−3281. doi: 10.1175/2010JCLI3343.1 -


 下载:
下载:
