

Variations of the Atlantic Water and Pacific Winter Water under the influence of the shifting Beaufort Gyre in the western Arctic Ocean
-
摘要: 大西洋水是北冰洋内部最重要的储热层,而西北冰洋楚科奇边陲区域是大西洋水进入加拿大海盆的关键海域,研究大西洋水在楚科奇边陲区域的变化能深入揭示大西洋水对北冰洋的影响。本文收集整理并校正1999−2021年的大量历史水文数据,探讨了近年来在波弗特流涡加强和摆动背景下,大西洋水、太平洋冬季水和双扩散阶梯结构在西北冰洋楚科奇边陲区域的时空变化。结果表明,在研究时段内楚科奇边陲区域出现了3次大西洋水暖异常信号,出现时间分别在2000年、2012年和2018年,异常暖水核心处的位温均超过1℃。太平洋冬季水核心和大西洋水核心间垂向平均热含量在楚科奇边陲区域中部和东部显著升高,主要归因于太平洋冬季水核心位温的增高。太平洋冬季水核心深度对波弗特流涡变化的响应相比大西洋水更显著。太平洋冬季水核心位温与大西洋水核心位温的联动变化调制着双扩散阶梯结构的变化。加拿大海盆内的双扩散阶梯结构呈现出从大阶梯结构向小阶梯结构过渡、直至大范围消亡的演变。该过程的主要调控机制为大西洋水核心位温的降低以及其上界面层化的增强抑制了垂向混合。Abstract: The Chukchi Borderland served as the critical gateway for the inflow of Atlantic Water (AW, which is the most important heat storage layer in the Arctic Ocean) into the Canada Basin in the western Arctic Ocean. One of the key issues is how the AW and Pacific Winter Water (PWW) interacts in this complex topography region. The answer to this question will shed light on the important role of AW in the Arctic Ocean. In this study, based on the multi-sources’ quality controlled hydrographic data during 1999−2021, the variation of AW, PWW and the double-diffusive staircases in the Chukchi Borderland are studied in details. We identified three anomalous warm events of AW that occurred in year 2000, 2012 and 2018 with the maximum potential temperature over 1℃. The vertical averaged heat content between the PWW and AW shows a warming trend in the central and eastern region of the Chukchi Borderland. The major reason for this is the warming of PWW. The depth of PWW is more sensitive to the shifting of the Beaufort Gyre (BG) than that of the AW. The combined changes of PWW and AW lead to the variation of double-diffusive staircases, which show a regime shift from large to small thickness and to largely decayed in the Canada Basin. Our results suggest that the major mechanism for this transition is the cooling of AW along with the stronger stratification that restricts the vertical mixing for all.
-
Key words:
- Atlantic Water /
- Pacific Winter Water /
- Beaufort Gyre /
- double-diffusive staircases /
- Chukchi Borderland
-

图 1 本文主要讨论的两个水团和典型的双扩散阶梯结构示意图(a)、大西洋水在楚科奇边陲区域的流动路径示意图(b)和依据大西洋水流动路径所细分的三个研究区域(c)
图a中彩色圆点为识别出的阶梯结构上下界面,灰色三角形为判断阶梯结构的水柱起点和终点,图c中东部海域由黄色虚线进一步分为东北部和东南部
Fig. 1 The typical potential temperature profiles with double-diffusive staircases and two major water masses that discussed in this study (a), schematic of Atlantic Water circulation in the Chukchi Borderland (b), three divided regions according to the pathway of Atlantic Water (c)
The identified double-diffusive staircase is separated by the colored dots in Fig. a, while the water column between the top and bottom grey triangles are used to identify the double-diffusive staircases. The eastern region is further divided into the northeastern part and the southeastern part by the yellow dashed line in Fig. c

图 6 1999−2021年双扩散阶梯的数量(a)和平均层厚(b)在楚科奇边陲区域的时空分布
其中每幅子图中的黑色空心圆圈代表没有双扩散阶梯的站位
Fig. 6 Spatio-temporal distribution of the amount of double-diffusive staircases for each profile (a) and the corresponding averaged thickness (b) in Chukchi Borderland during 1999−2021
The hollow black circles in each plot represent no double-diffusive staircases are identified for the profile

图 2 楚科奇边陲区域大西洋水核心位温在1999−2021年间的空间分布(a)、大西洋水(b)和太平洋冬季水(c)的核心位温在3个区域的平均值(曲线)和空间标准差(竖直棒)、大西洋水和太平洋冬季水之间垂向位温梯度(d)及垂向平均热含量(e)
a.气候态数据为400 m处位温;b. 绿色三角点线为95%分位数的核心位温数值,红灰色三角形为气候态楚科奇边陲区域平均位温值
Fig. 2 The spatial distribution of the potential temperature maximum of Atlantic Water (AW) during 1999−2021 in the Chukchi Borderland (a), annual potential temperature of Atlantic Water (b) and Pacific Winter Water (PWW) (c) in the three defined regions in Fig. 1c; The colored lines are for spatial averaged values while the vertical bars denote the spatial standard deviation; vertical gradient of potential temperature (d) and vertical averaged heat content (e) between the AW and PWW
a. The climatologically potential temperature at 400 m are shown; b. the green triangle dotted line is the 95% quantile of potential temperature maximum in the western part while the red-grey triangle indicates the climatologically regional averaged potential temperature at 400 m

图 3 楚科奇边陲区域太平洋冬季水核心位温在1999–2021年间的时空分布
Fig. 3 Spatio-temporal distribution of the potential temperature minimum of Pacific Winter Water in the Chukchi Borderland during 1999–2021.

图 4 2002−2021年在所划分4个区域(如图1c中所示,东部区域又细分为东北部和东南部区域)的温盐曲线变化,其中每幅子图的左上角温盐曲线图为红框内温盐性质的放大显示
Fig. 4 The four region are the potential temperature and salinity plots for the four defined regions (Fig. 1c, the eastern region is further divided into northeastern and southeastern regions) during 2002−2021, the insets of each subplot are the enlarged plots for the red rectangle boxes

图 5 2002−2021年大西洋水和太平洋冬季水核心深度区域年度平均值(a, b)、两核心间厚度区域年度平均值(c)和势能异常区域年度平均值(d)
这里的区域平均值即为在图1c中3个黄框区域内的区域平均值
Fig. 5 Annual regional averaged depth of Atlantic Water (a) and Pacific Winter Water (b), the layer thickness (c) and potential energy anomaly (d) between the Atlantic Water and Pacific Winter Water during 2002−2021
Here the regional averaged are referred to the three regions that showed in Fig.1c
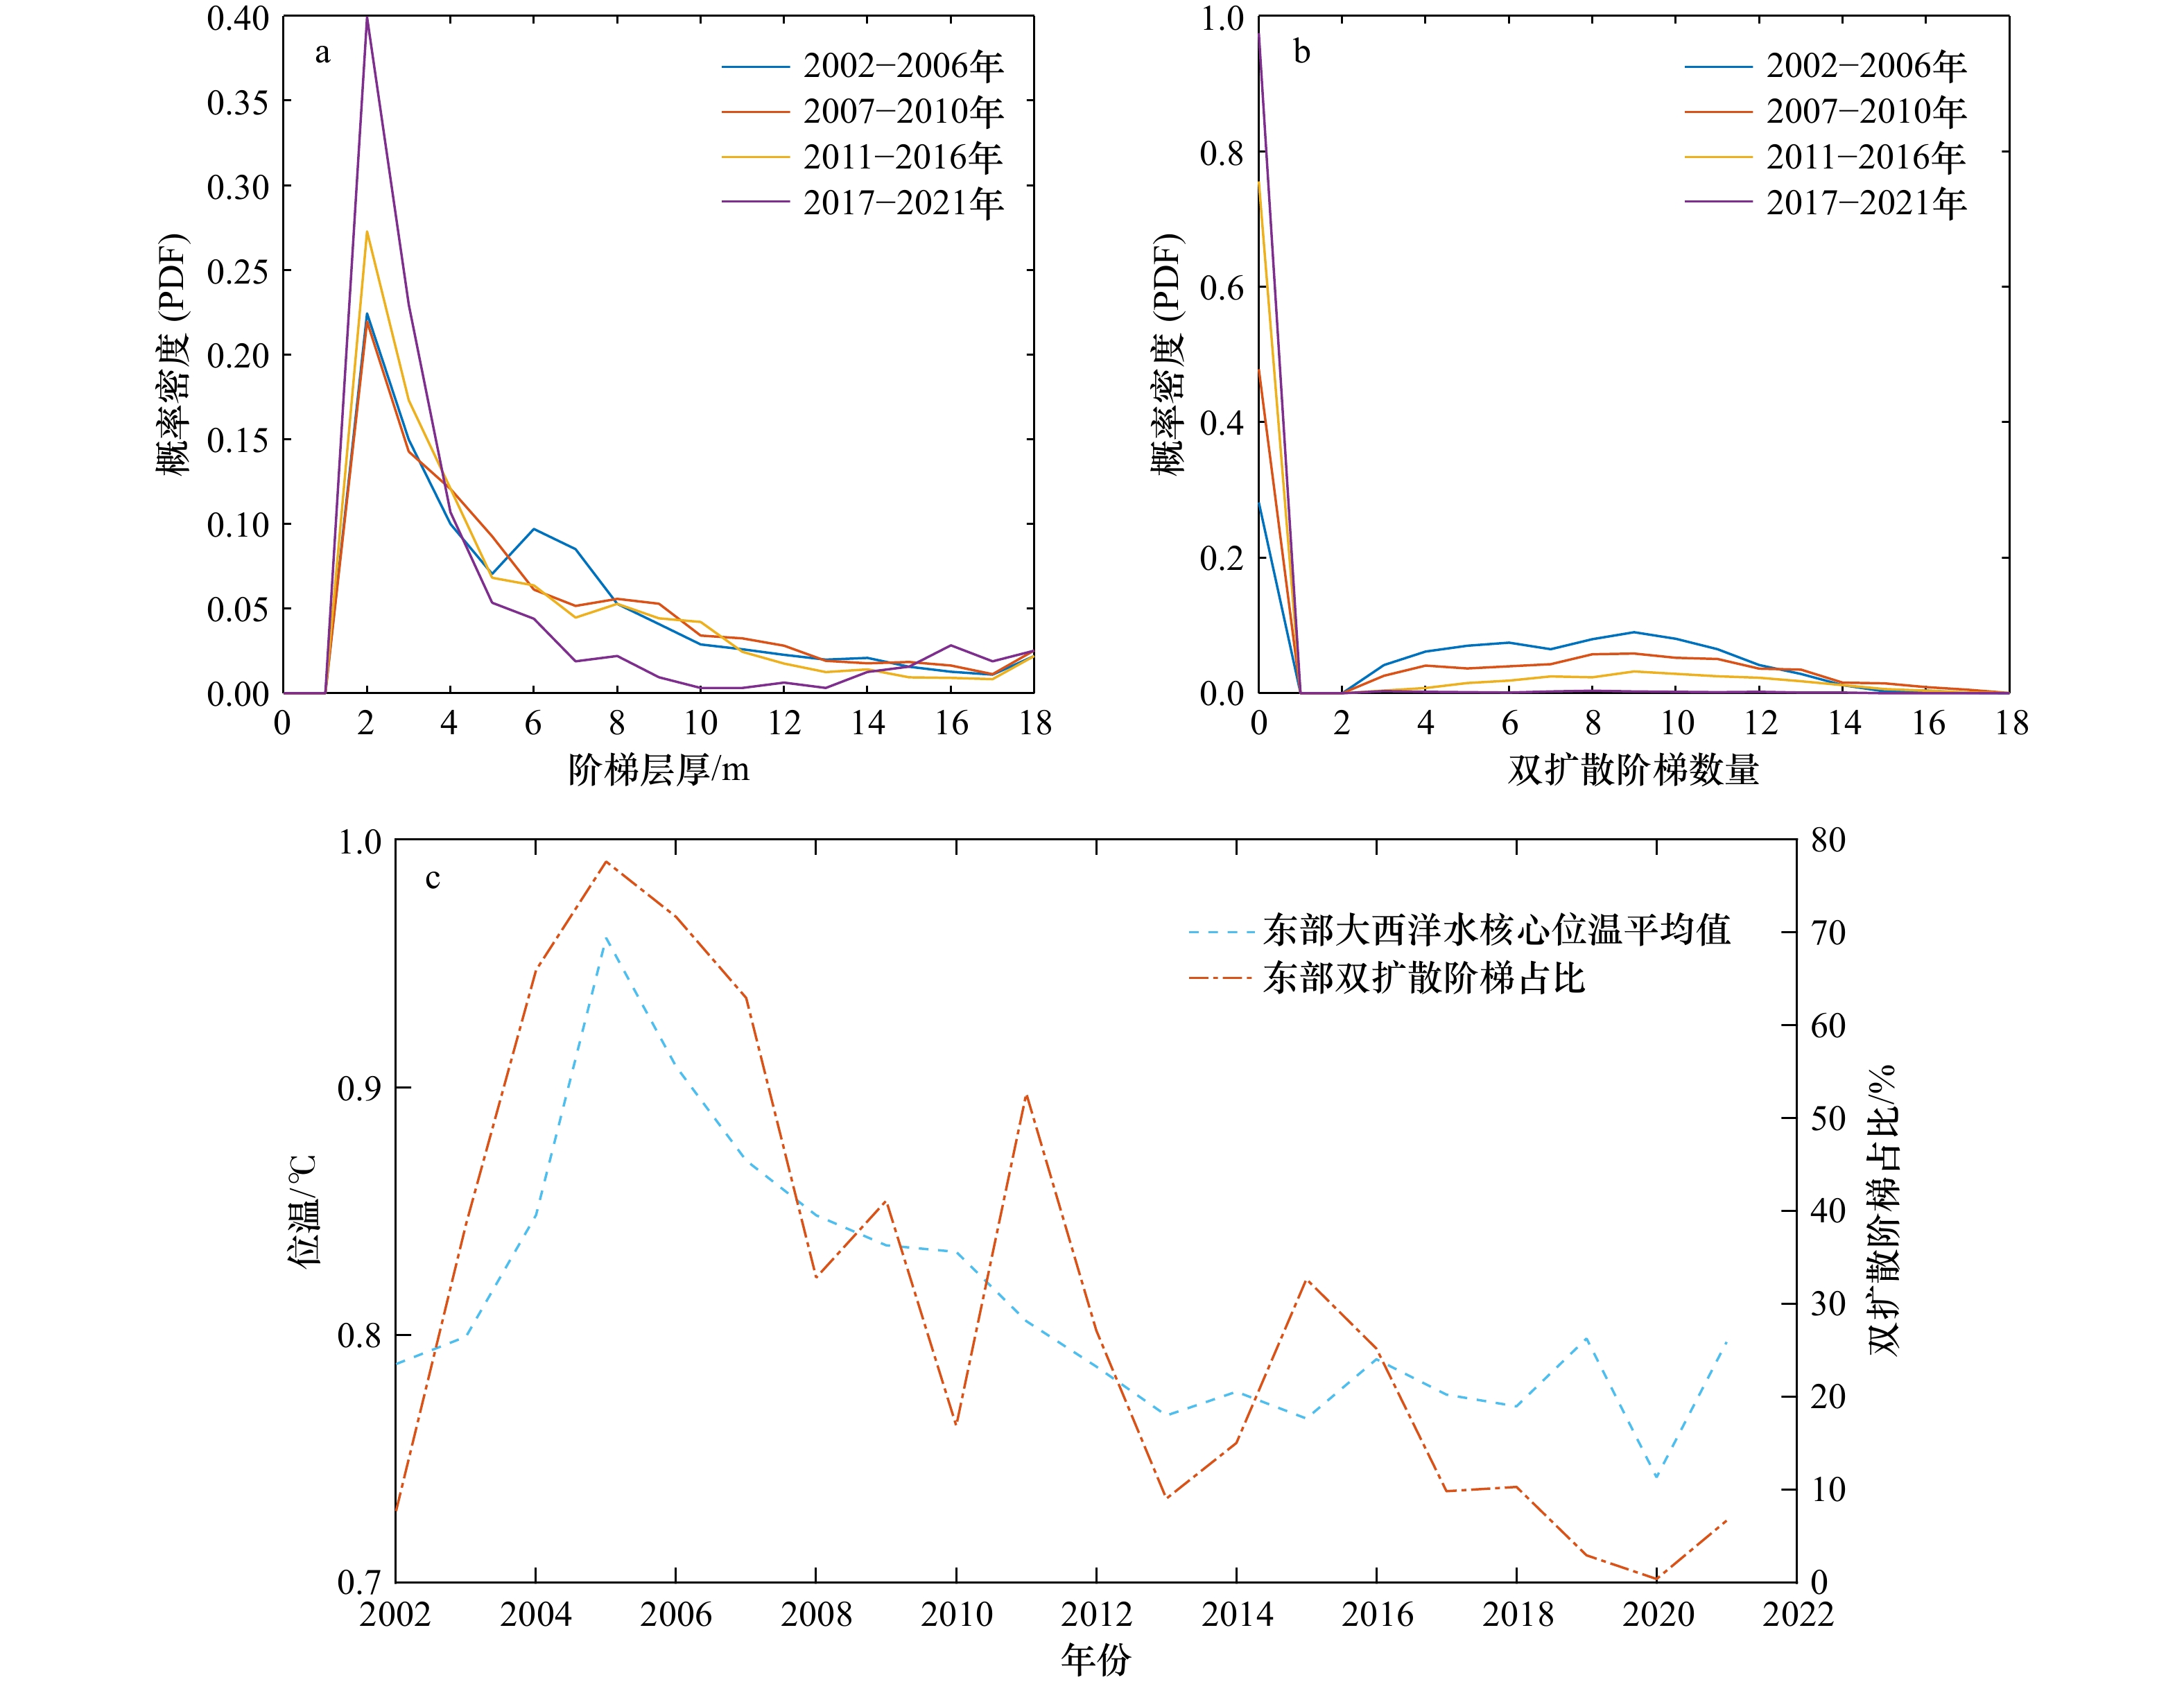
图 7 楚科奇边陲区域东部站位在所划分的4个时期的双扩散阶梯所有层厚和数量的概率密度分布(a, b),东部区域大西洋水核心位温平均值与双扩散阶梯占比之间的关系(c)
Fig. 7 The probability density function (PDF) of all layer thickness and number for double-diffusive staircases in the eastern region in four defined periods (a, b), and the regional averaged potential temperature maximum of Atlantic Water versus the ratio of the number of stations with double-diffusive staircases and the total stations in the eastern region of Chukchi Borderland (c)
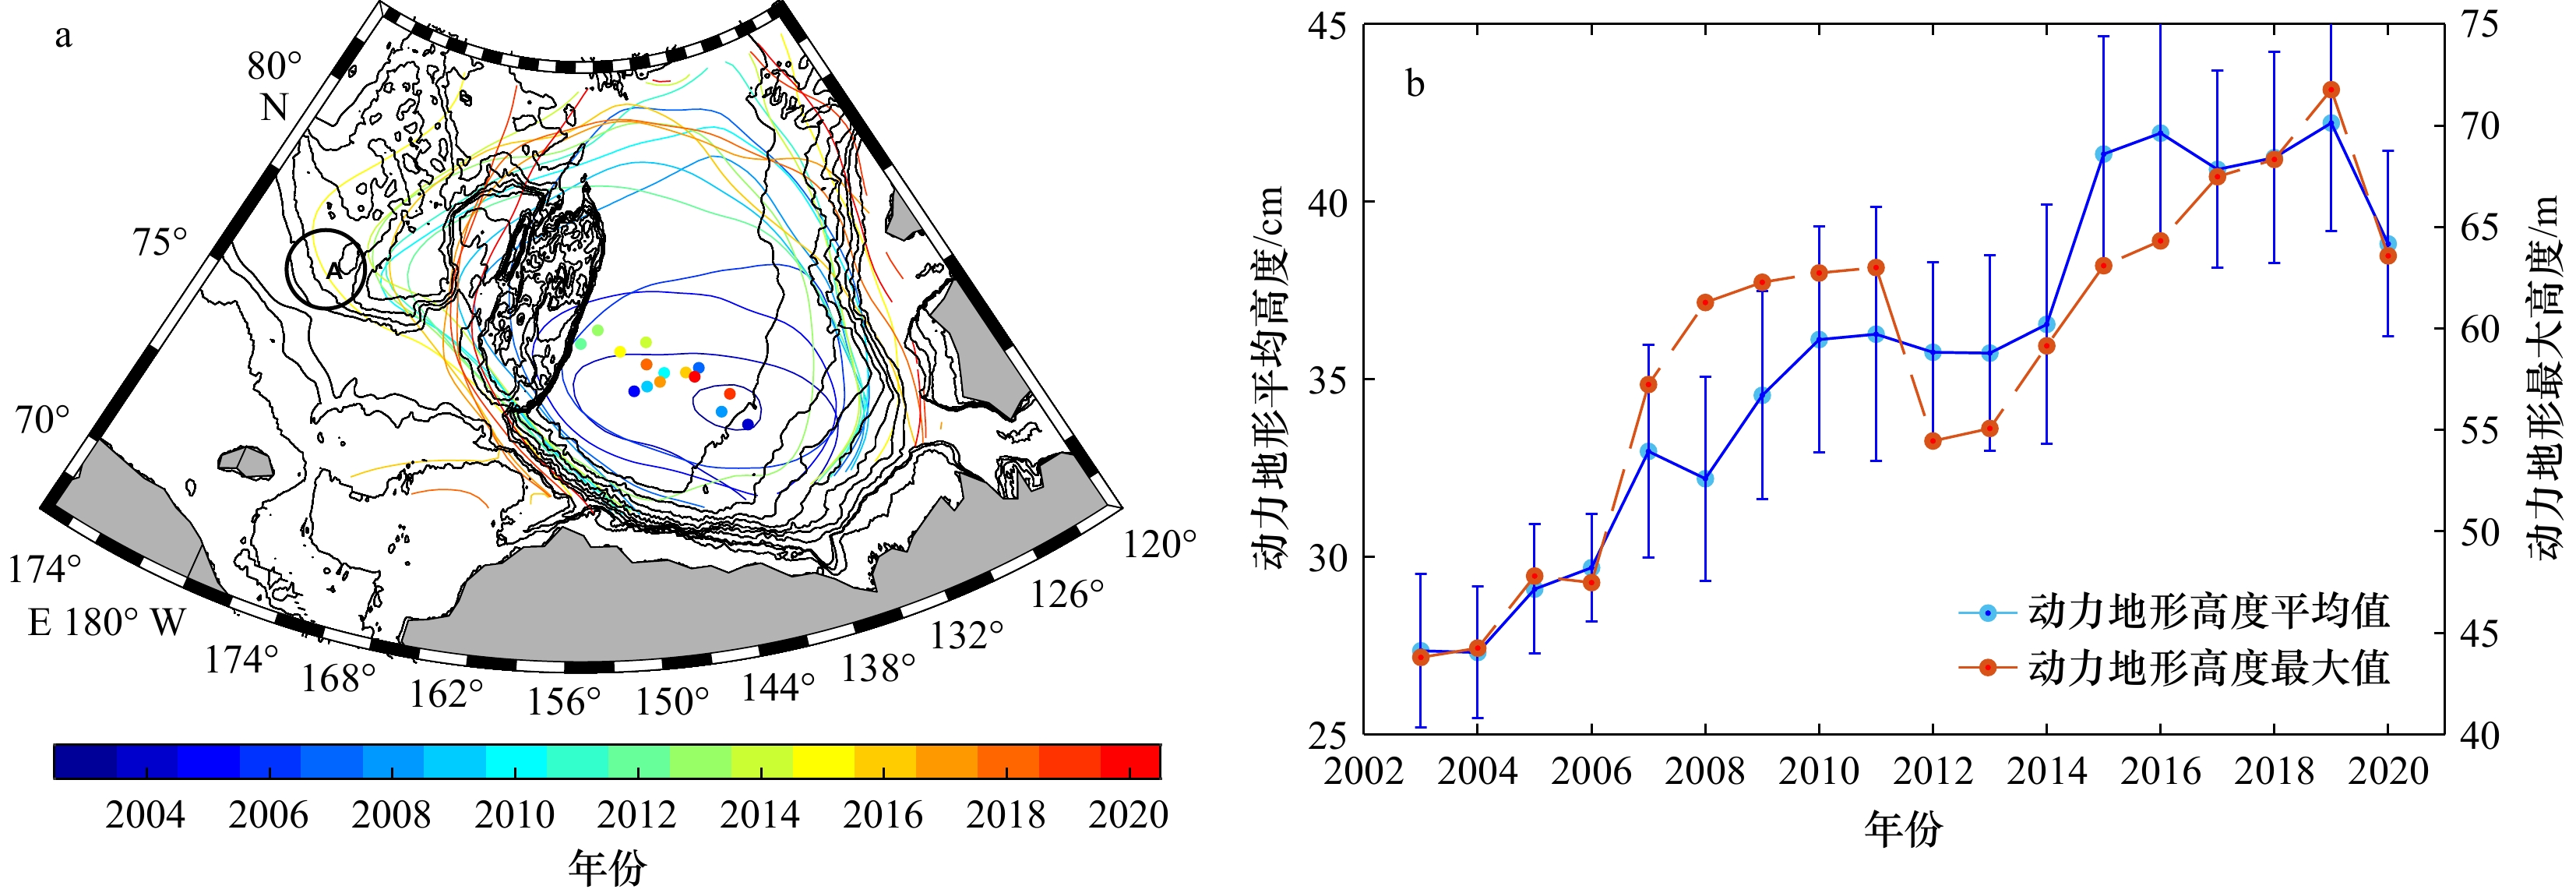
图 8 2003−2020年楚科奇边陲区域动力地形高度的40 cm等值线范围和波弗特流涡中心位置变化(a),动力地形高度区域平均值(68°~82°N,170°E~120°W)和最大值时间序列变化(b)
图a中黑圈A为西部大陆坡附近;图b中竖直棒线为标准误
Fig. 8 The 40 cm isolines of dynamic topography and the location of Beaufort Gyre center during 2003−2020 (a), the regional (68°–82°N,170°E–120°W) averaged (blue solid line) and maximum (red dotted line) dynamic topography (b)
The black circle in Fig. a is the western continental slope, while the vertical bars in Fig. b denote the standard error

图 9 楚科奇边陲区域西部大陆坡在2004年(a)、2012年(b)、2013年(c)和2020年(d)的垂直位温断面(中间一列所示)与埃克曼抽吸速度(最右一列所示,对应年份4−9月的平均值)的空间分布
位温断面插值使用ODV软件中的数据插值变分分析方法,并沿等密度面插值
Fig. 9 Vertical sections of potential temperature (middle panels) and the spatial distribution of Ekman pumping velocity (right panels, monthly mean during April to September for the corresponding year) in the western region of the Chukchi Borderland in 2004 (a), 2012 (b), 2013 (c), and 2020 (d)
Vertical sections of potential temperature are constructed using the Data Interpolating Variational Analysis (DIVA) method that incorporated in ODV software, and interpolate along the isodensity surface
表 1 本文所用到的观测数据列表
Tab. 1 Dataset that used in this study
WOD ITP UDASH CHINARE LSSL 1999 1999 1999 2000 2000 2001 2001 2002 2002 2003 2003 2003 2003 2004 2004 2004 2004 2005 2005 2005 2005 2006 2006 2006 2006 2007 2007 2007 2007 2008 2008 2008 2008 2008 2009 2009 2009 2009 2010 2010 2010 2010 2010 2011 2011 2011 2011 2012 2012 2012 2012 2012 2013 2013 2013 2013 2014 2014 2014 2014 2014 2015 2015 2015 2015 2016 2016 2016 2016 2017 2017 2017 2018 2018 2018 2018 2019 2019 2019 2020 2020 2020 2020 2021 2021 2021 2021 注:表中数字代表年份。  下载: 导出CSV
-
[1] Woodgate R A, Aagaard K, Muench R D, et al. The Arctic Ocean boundary current along the Eurasian slope and the adjacent Lomonosov Ridge: water mass properties, transports and transformations from moored instruments[J]. Deep Sea Research Part I: Oceanographic Research Papers, 2001, 48(8): 1757−1792. doi: 10.1016/S0967-0637(00)00091-1 [2] Aksenov Y, Ivanov V V, Nurser A J G, et al. The arctic circumpolar boundary current[J]. Journal of Geophysical Research: Oceans, 2011, 116(C9): C09017. [3] Rudels B, Korhonen M, Schauer U, et al. Circulation and transformation of Atlantic water in the Eurasian Basin and the contribution of the Fram Strait inflow branch to the Arctic Ocean heat budget[J]. Progress in Oceanography, 2015, 132: 128−152. doi: 10.1016/j.pocean.2014.04.003 [4] Polyakov I V, Alexeev V A, Ashik I M, et al. Fate of early 2000s Arctic warm water pulse[J]. Bulletin of the American Meteorological Society, 2011, 92(5): 561−566. doi: 10.1175/2010BAMS2921.1 [5] Karcher M, Smith J N, Kauker F, et al. Recent changes in Arctic Ocean circulation revealed by iodine-129 observations and modeling[J]. Journal of Geophysical Research: Oceans, 2012, 117(C8): C08007. [6] Rudels B. Arctic Ocean circulation, processes and water masses: a description of observations and ideas with focus on the period prior to the International Polar Year 2007–2009[J]. Progress in Oceanography, 2015, 132: 22−67. doi: 10.1016/j.pocean.2013.11.006 [7] Karcher M J, Oberhuber J M. Pathways and modification of the upper and intermediate waters of the Arctic Ocean[J]. Journal of Geophysical Research: Oceans, 2002, 107(C6): 3049. [8] Karcher M, Kauker F, Gerdes R, et al. On the dynamics of Atlantic Water circulation in the Arctic Ocean[J]. Journal of Geophysical Research: Oceans, 2007, 112(C4): C04S02. [9] Wefing A M, Casacuberta N, Christl M, et al. Circulation timescales of Atlantic Water in the Arctic Ocean determined from anthropogenic radionuclides[J]. Ocean Science, 2021, 17(1): 111−129. doi: 10.5194/os-17-111-2021 [10] Carmack E, Polyakov I, Padman L, et al. Toward quantifying the increasing role of oceanic heat in sea ice loss in the new Arctic[J]. Bulletin of the American Meteorological Society, 2015, 96(12): 2079−2105. doi: 10.1175/BAMS-D-13-00177.1 [11] Turner J S. The melting of ice in the Arctic Ocean: the influence of double-diffusive transport of heat from below[J]. Journal of Physical Oceanography, 2010, 40(1): 249−256. doi: 10.1175/2009JPO4279.1 [12] Polyakov I V, Pnyushkov A V, Alkire M B, et al. Greater role for Atlantic inflows on sea-ice loss in the Eurasian Basin of the Arctic Ocean[J]. Science, 2017, 356(6335): 285−291. doi: 10.1126/science.aai8204 [13] Overland J E, Wood K R, Wang M Y. Warm Arctic—cold continents: climate impacts of the newly open Arctic Sea[J]. Polar Research, 2011, 30(1): 15787. doi: 10.3402/polar.v30i0.15787 [14] Timmermans M L, Marshall J. Understanding Arctic Ocean circulation: a review of ocean dynamics in a changing climate[J]. Journal of Geophysical Research: Oceans, 2020, 125(4): e2018JC014378. doi: 10.1029/2018JC014378 [15] Aagaard K, Swift J H, Carmack E C. Thermohaline circulation in the Arctic Mediterranean seas[J]. Journal of Geophysical Research: Oceans, 1985, 90(C3): 4833−4846. doi: 10.1029/JC090iC03p04833 [16] Nøst O A, Isachsen P E. The large-scale time-mean ocean circulation in the Nordic Seas and Arctic Ocean estimated from simplified dynamics[J]. Journal of Marine Research, 2003, 61(2): 175−210. doi: 10.1357/002224003322005069 [17] Woodgate R A, Aagaard K, Swift J H, et al. Atlantic water circulation over the Mendeleev Ridge and Chukchi Borderland from thermohaline intrusions and water mass properties[J]. Journal of Geophysical Research: Oceans, 2007, 112(C2): C02005. [18] Polyakov I V, Rippeth T P, Fer I, et al. Intensification of near‐surface currents and shear in the Eastern Arctic Ocean[J]. Geophysical Research Letters, 2020, 47(16): e2020GL089469. doi: 10.1029/2020GL089469 [19] Zhao Jinping, Gao Guoping, Jiao Yutian. Warming in Arctic intermediate and deep waters around Chukchi Plateau and its adjacent regions in 1999[J]. Science in China Series D: Earth Sciences, 2005, 48(8): 1312−1320. doi: 10.1360/02yd0504 [20] Zhong Wenli, Zhao Jinping. Deepening of the Atlantic Water core in the Canada Basin in 2003–11[J]. Journal of Physical Oceanography, 2014, 44(9): 2353−2369. doi: 10.1175/JPO-D-13-084.1 [21] Richards A E, Johnson H L, Lique C. Spatial and temporal variability of Atlantic Water in the Arctic from 40 years of observations[J]. Journal of Geophysical Research: Oceans, 2022, 127(9): e2021JC018358. doi: 10.1029/2021JC018358 [22] Ménesguen C, Lique C, Caspar-Cohen Z. Density staircases are disappearing in the Canada Basin of the Arctic Ocean[J]. Journal of Geophysical Research: Oceans, 2022, 127(11): e2022JC018877. doi: 10.1029/2022JC018877 [23] Polyakov I V, Pnyushkov A V, Timokhov L A. Warming of the intermediate atlantic water of the Arctic Ocean in the 2000s[J]. Journal of Climate, 2012, 25(23): 8362−8370. doi: 10.1175/JCLI-D-12-00266.1 [24] Regan H C, Lique C, Armitage T W K. The Beaufort Gyre extent, shape, and location between 2003 and 2014 from satellite observations[J]. Journal of Geophysical Research: Oceans, 2019, 124(2): 844−862. doi: 10.1029/2018JC014379 [25] Bertosio C, Provost C, Athanase M, et al. Changes in freshwater distribution and pathways in the Arctic Ocean since 2007 in the Mercator Ocean global operational system[J]. Journal of Geophysical Research: Oceans, 2022, 127(6): e2021JC017701. doi: 10.1029/2021JC017701 [26] Schmitt R W. The salt finger experiments of Jevons (1857) and Rayleigh (1880)[J]. Journal of Physical Oceanography, 1995, 25(1): 8−17. doi: 10.1175/1520-0485(1995)025<0008:TSFEOJ>2.0.CO;2 [27] Turner J S, Stommel H. A new case of convection in the presence of combined vertical salinity and temperature gradients[J]. Proceedings of the National Academy of Sciences of the United States of America, 1964, 52(1): 49−53. [28] 赵倩, 赵进平. 加拿大海盆双扩散阶梯结构分布与热通量研究[J]. 地球科学进展, 2011, 26(2): 193−201.Zhao Qian, Zhao Jinping. Distribution of double-diffusive staircase structure and heat flux in the Canadian Basin[J]. Advances in Earth Science, 2011, 26(2): 193−201. [29] McLaughlin F A, Carmack E C, Williams W J, et al. Joint effects of boundary currents and thermohaline intrusions on the warming of Atlantic water in the Canada Basin, 1993–2007[J]. Journal of Geophysical Research: Oceans, 2009, 114(C1): C00A12. [30] Polyakov I V, Pnyushkov A V, Rember R, et al. Mooring-based observations of double-diffusive staircases over the Laptev Sea slope[J]. Journal of Physical Oceanography, 2012, 42(1): 95−109. doi: 10.1175/2011JPO4606.1 [31] Timmermans M L, Toole J, Proshutinsky A, et al. Eddies in the Canada Basin, Arctic Ocean, observed from ice-tethered profilers[J]. Journal of Physical Oceanography, 2008, 38(1): 133−145. doi: 10.1175/2007JPO3782.1 [32] Lincoln B J, Rippeth T P, Lenn Y D, et al. Wind-driven mixing at intermediate depths in an ice-free Arctic Ocean[J]. Geophysical Research Letters, 2016, 43(18): 9749−9756. doi: 10.1002/2016GL070454 [33] Shibley N C, Timmermans M L, Carpenter J R, et al. Spatial variability of the Arctic Ocean's double-diffusive staircase[J]. Journal of Geophysical Research: Oceans, 2017, 122(2): 980−994. doi: 10.1002/2016JC012419 [34] Steele M, Morison J, Ermold W, et al. Circulation of summer Pacific halocline water in the Arctic Ocean[J]. Journal of Geophysical Research: Oceans, 2004, 109(C2): C02027. [35] Timmermans M L, Proshutinsky A, Golubeva E, et al. Mechanisms of Pacific summer water variability in the Arctic's Central Canada Basin[J]. Journal of Geophysical Research: Oceans, 2014, 119(11): 7523−7548. doi: 10.1002/2014JC010273 [36] Timmermans M L, Marshall J, Proshutinsky A, et al. Seasonally derived components of the Canada Basin halocline[J]. Geophysical Research Letters, 2017, 44(10): 5008−5015. doi: 10.1002/2017GL073042 [37] Behrendt A, Sumata H, Rabe B, et al. UDASH–unified database for Arctic and Subarctic hydrography[J]. Earth System Science Data, 2018, 10(2): 1119−1138. doi: 10.5194/essd-10-1119-2018 [38] Steele M, Morley R, Ermold W. PHC: a global ocean hydrography with a high-quality Arctic Ocean[J]. Journal of Climate, 2001, 14(9): 2079−2087. doi: 10.1175/1520-0442(2001)014<2079:PAGOHW>2.0.CO;2 [39] Armitage T W K, Bacon S, Ridout A L, et al. Arctic sea surface height variability and change from satellite radar altimetry and GRACE, 2003–2014[J]. Journal of Geophysical Research: Oceans, 2016, 121(6): 4303−4322. doi: 10.1002/2015JC011579 [40] Zhong Wenli, Steele M, Zhang Jinlun, et al. Greater role of geostrophic currents in Ekman dynamics in the western Arctic Ocean as a mechanism for Beaufort Gyre stabilization[J]. Journal of Geophysical Research: Oceans, 2018, 123(1): 149−165. doi: 10.1002/2017JC013282 [41] Polyakov I V, Pnyushkov A V, Carmack E C. Stability of the arctic halocline: a new indicator of arctic climate change[J]. Environmental Research Letters, 2018, 13(12): 125008. doi: 10.1088/1748-9326/aaec1e [42] Shibley N C, Timmermans M L. The formation of double-diffusive layers in a weakly turbulent environment[J]. Journal of Geophysical Research: Oceans, 2019, 124(3): 1445−1458. doi: 10.1029/2018JC014625 [43] Quadfasel D, SY A, WELLS D, et al. Warming in the Arctic[J]. Nature, 1991, 350(6317): 385. [44] Quadfasel D, Sy A, Rudels B. A ship of opportunity section to the North Pole: Upper ocean temperature observations[J]. Deep Sea Research Part I: Oceanographic Research Papers, 1993, 40(4): 777−789. doi: 10.1016/0967-0637(93)90071-A [45] Li Jianqiang, Pickart R S, Lin Peigen, et al. The Atlantic water boundary current in the Chukchi Borderland and southern Canada Basin[J]. Journal of Geophysical Research: Oceans, 2020, 125(8): e2020JC016197. doi: 10.1029/2020JC016197 [46] Dmitrenko I A, Polyakov I V, Kirillov S A, et al. Toward a warmer Arctic Ocean: spreading of the early 21st century Atlantic Water warm anomaly along the Eurasian Basin margins[J]. Journal of Geophysical Research: Oceans, 2008, 113(C5): C05023. [47] Corlett W B, Pickart R S. The Chukchi slope current[J]. Progress in Oceanography, 2017, 153: 50−65. doi: 10.1016/j.pocean.2017.04.005 [48] Zhong Wenli, Steele M, Zhang Jinlun, et al. Circulation of Pacific winter water in the Western Arctic Ocean[J]. Journal of Geophysical Research: Oceans, 2019, 124(2): 863−881. doi: 10.1029/2018JC014604 -

计量
- 文章访问数: 347
- HTML全文浏览量: 192
- PDF下载量: 70
- 被引次数: 0
