

Assessing the impacts of fishing on fish community in marine ranch of the Wuzhizhou Island based on size-spectrum model
-
摘要: 基于生态系统的渔业管理的理念已得到广泛认同,但其在海洋牧场建设中的应用仍非常少见。本研究根据2020−2021年在蜈支洲岛海域开展的渔业资源底拖网调查数据,构建了海洋牧场鱼类群落的质量谱模型(SSM),反映了海洋牧场中食物网的复杂结构以及种间相互作用,以评估捕捞对海洋牧场鱼类群落的影响。研究通过对两种管理策略(单物种管理和多物种管理)的模拟,分析特定种类的捕捞死亡系数变化对鱼类群落产生的影响,并利用群落总生物量、质量谱斜率、平均最大质量、平均质量和大型鱼类指数5种群落生态指标监测了鱼类群落的特征状态。单物种管理策略结果显示,蜈支洲岛海洋牧场生态系统呈现下行控制效应,肉食性鱼类对浮游生物食性鱼类存在着强烈的调控作用。捕捞死亡系数变化后,不同物种间竞争捕食等复杂的相互作用会产生营养级联效应。多物种管理策略结果显示,灰海鳗(Muraenesox cinereus)的捕捞死亡系数对群落质量谱斜率影响最大,大头狗母鱼(Trachiocephalus myops)和灰海鳗的捕捞死亡系数对鱼类群落生物量和群落结构及功能的影响最大。研究结果对于保护和维持鱼类群落稳定方面具有重要意义,能够帮助管理者更好地了解捕捞死亡系数变化对鱼类群落产生的潜在影响,从而根据物种对渔业的重要性制定可行且有效的保护和管理策略。Abstract: The concept of ecosystem-based fisheries management has been widely recognized, but it’s application in the construction of marine ranch is still very rare. In this study, based on the data from a bottom trawl survey of fishery resources conducted in the waters of Wuzhizhou Island from 2020 to 2021, a marine ranch fish community size-spectrum model (SSM) was built, which reflects the complex structure of food webs and interspecies interactions in marine ranch, to assess the impacts of fishing on the fish community in marine ranch. The study analyzed the effects of changes in species-specific fishing death coefficient on fish community by simulating two management strategies (single-species management and multispecies management) and monitored the state of fish community characteristics using five community ecological indicators: the total biomass of the community, the slope of size spectrum, the mean maximum weight, the mean weight, and the large fish index. The results of the single-species management strategy showed that the marine ranch ecosystem of Wuzhizhou Island showed top-down control, and there was a strong regulatory effect of carnivorous fish on plankton-feeding fish. Complex interactions such as competitive predation among different species produce trophic cascade effects after changes in fishing death coefficient. The results of the multispecies management strategy showed that fishing death coefficient of Muraenesox cinereus had the greatest effect on the slope of size spectrum, and that fishing death coefficient of Trachiocephalus myops and Muraenesox cinereus had the greatest effect on fish community biomass and community structure and function. The results of this study have important implications for the conservation and stabilization of fish community, and can help managers to better understand the potential impacts of changes in fishing death coefficient rates on fish communities, so that viable and effective conservation and management strategies can be developed based on the importance of the species to the fishery.
-

图 1 蜈支洲岛海洋牧场渔业资源调查站位
Fig. 1 Fishery resources survey station in the marine ranch of the Wuzhizhou Island
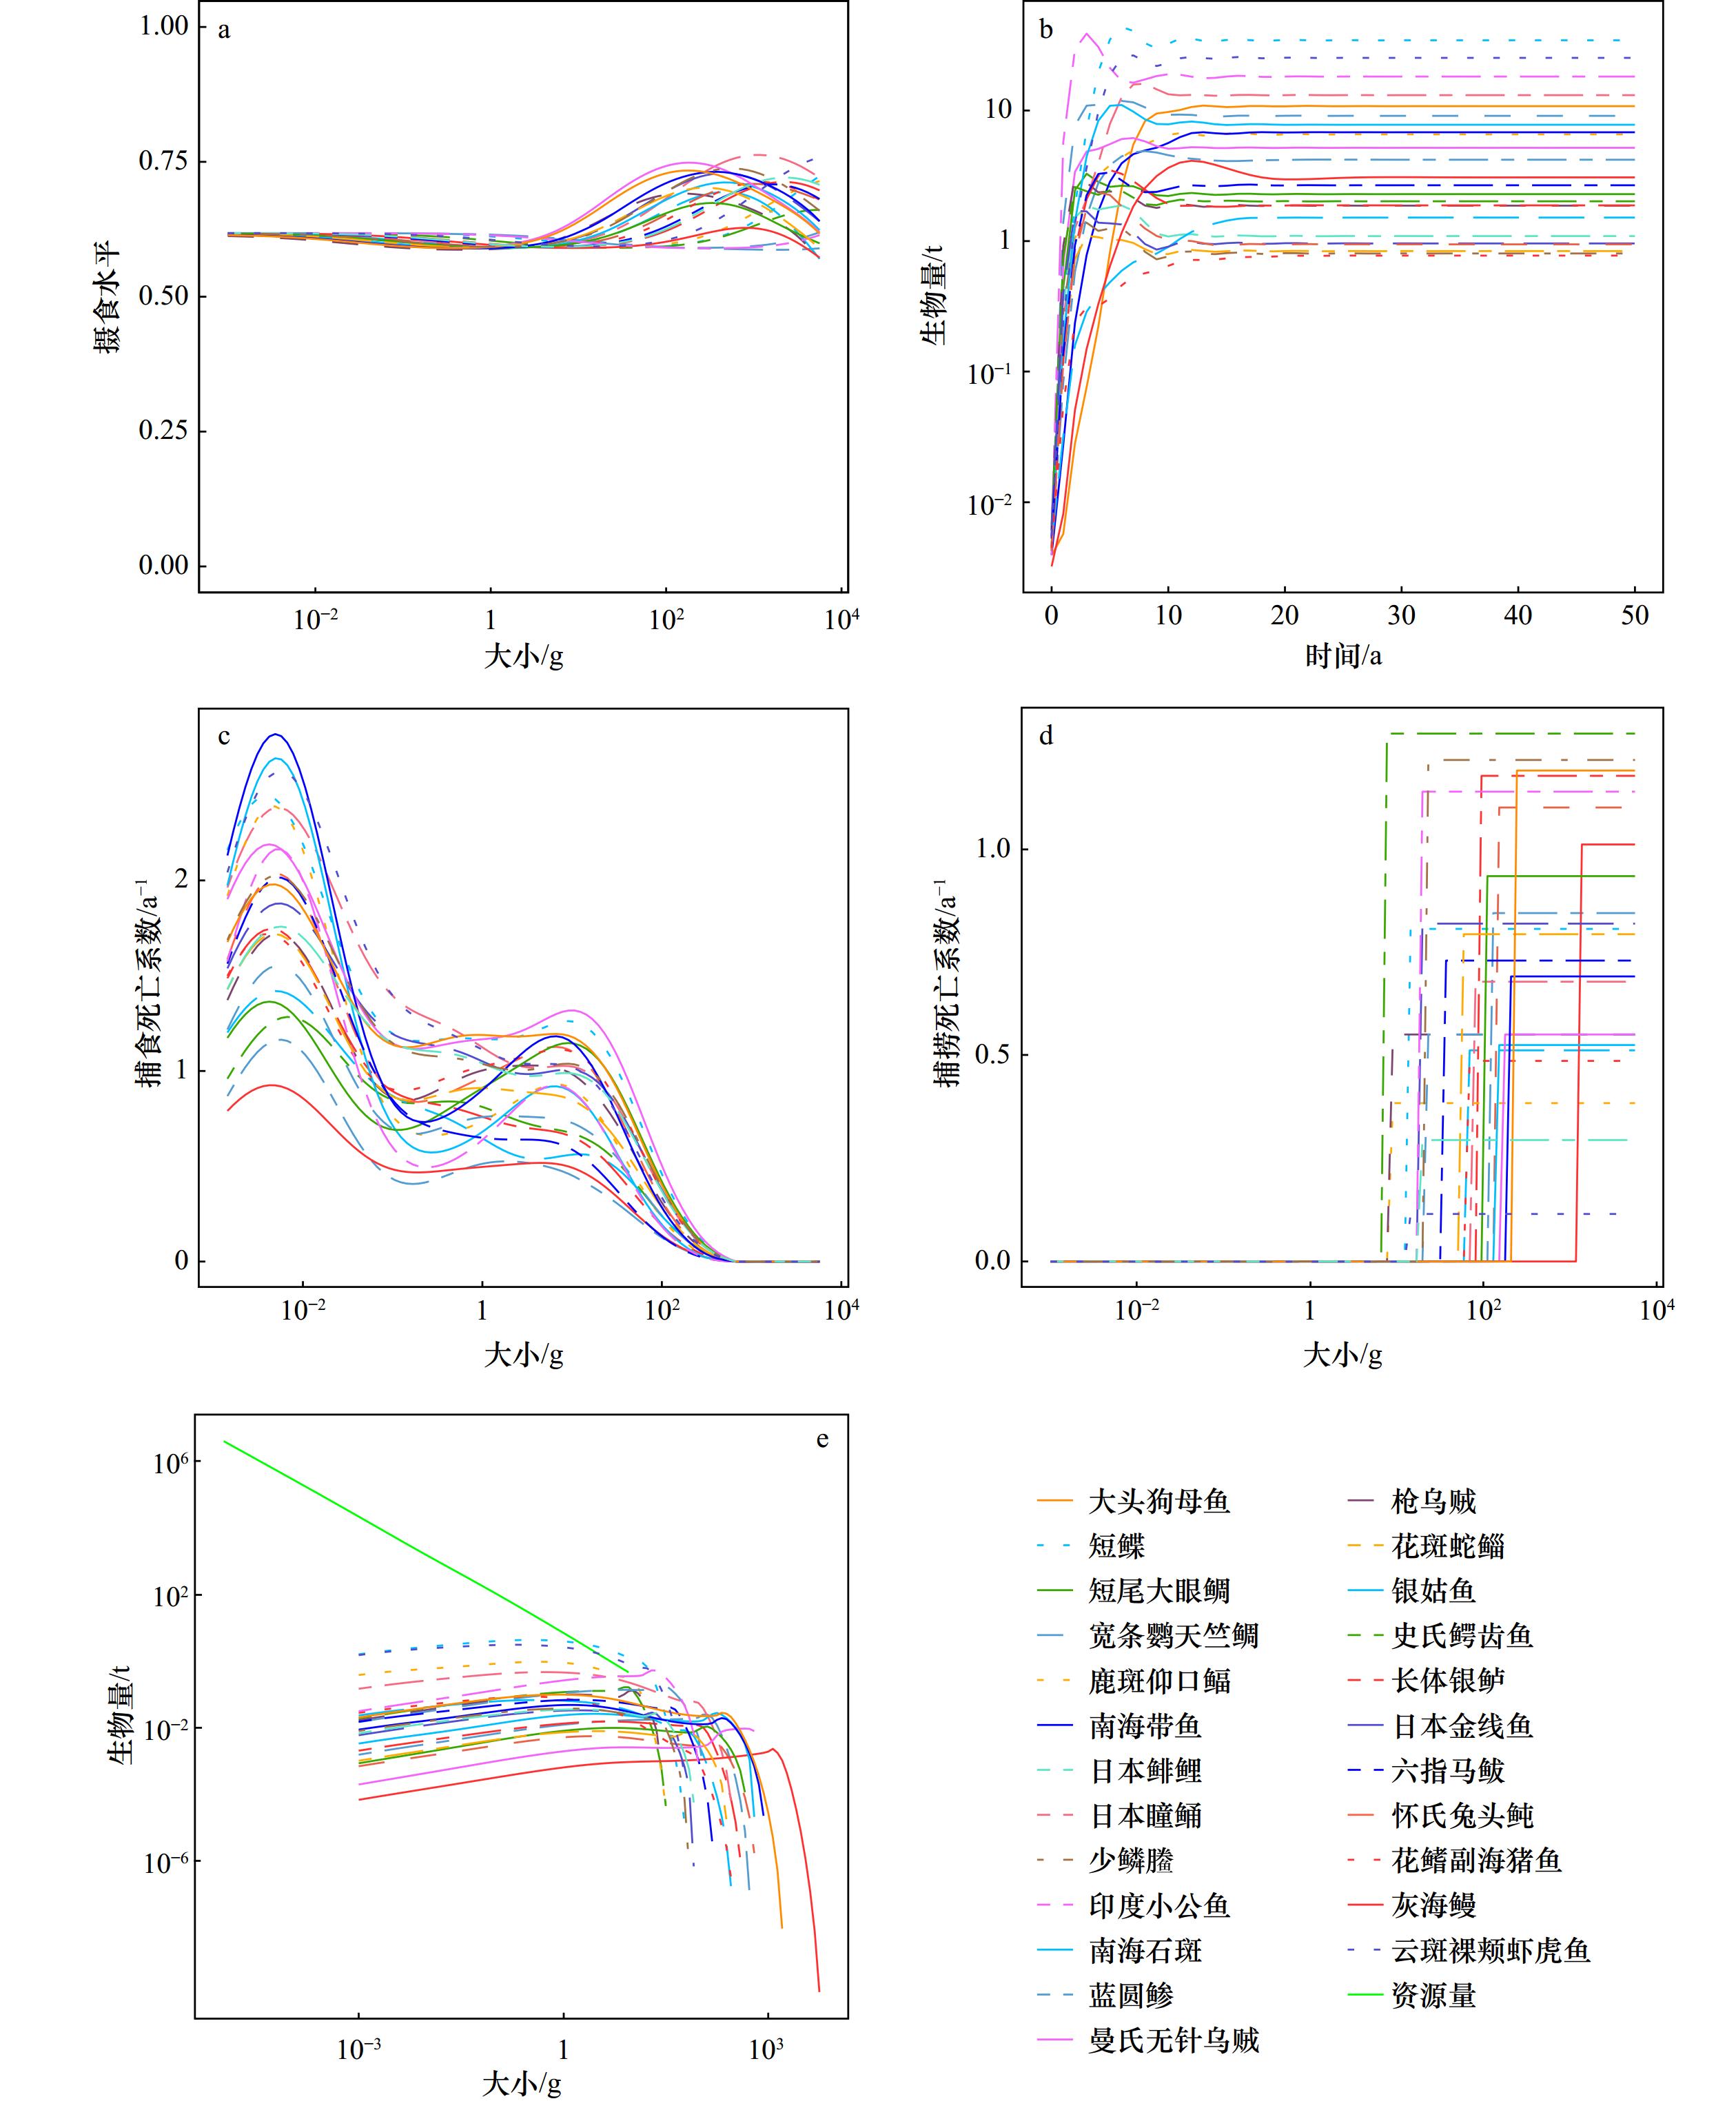
图 2 质量谱模型(SSM)的基本输出
a. 摄食水平;b. 鱼类个体生物量随时间变化;c. 捕食死亡系数;d. 捕捞死亡系数;e. 群落生物量谱
Fig. 2 A summary of the size-spectrum model (SSM) outputs
a. Feeding level; b. species biomass change through time; c. predation mortality coefficient; d. fishing death coefficient; e. community size spectra

图 3 在单物种管理下群落中物种生物量的变化情况
图a、c、e 、g、i和 k 分别为模拟大头狗母鱼、灰海鳗、南海带鱼、曼氏无针乌贼、银姑鱼和短尾大眼鲷的捕捞死亡系数在2025年增加 75% 后群落中物种生物量的变化情况,图b、d、f、h、j和 l分别为模拟大头狗母鱼、灰海鳗、南海带鱼、曼氏无针乌贼、银姑鱼和短尾大眼鲷的捕捞死亡系数在2025年减小75% 后群落中物种生物量的变化情况,黑色虚线对应年份为2025年
Fig. 3 Changes in species biomass in communities under single-species management
Figures a, c, e, g, i, and k show changes in biomass of species in the community after a 75% increase in fishing death coefficient in 2025 for simulations Trachiocephalus myops, Muraenesox cinereus, Trichiurus nanhaiensis, Sepiella maindroni, Pennahia argentata and Priacanthus macracanthus, respectively. Figures b, d, f, h, j and l show changes in biomass of species in the community after a 75% decrease in fishing death coefficient in 2025 for simulations Trachiocephalus myops, Muraenesox cinereus, Trichiurus nanhaiensis, Sepiella maindroni, Pennahia argentata and Priacanthus macracanthus, respectively. The black dashed line corresponds to the year 2025
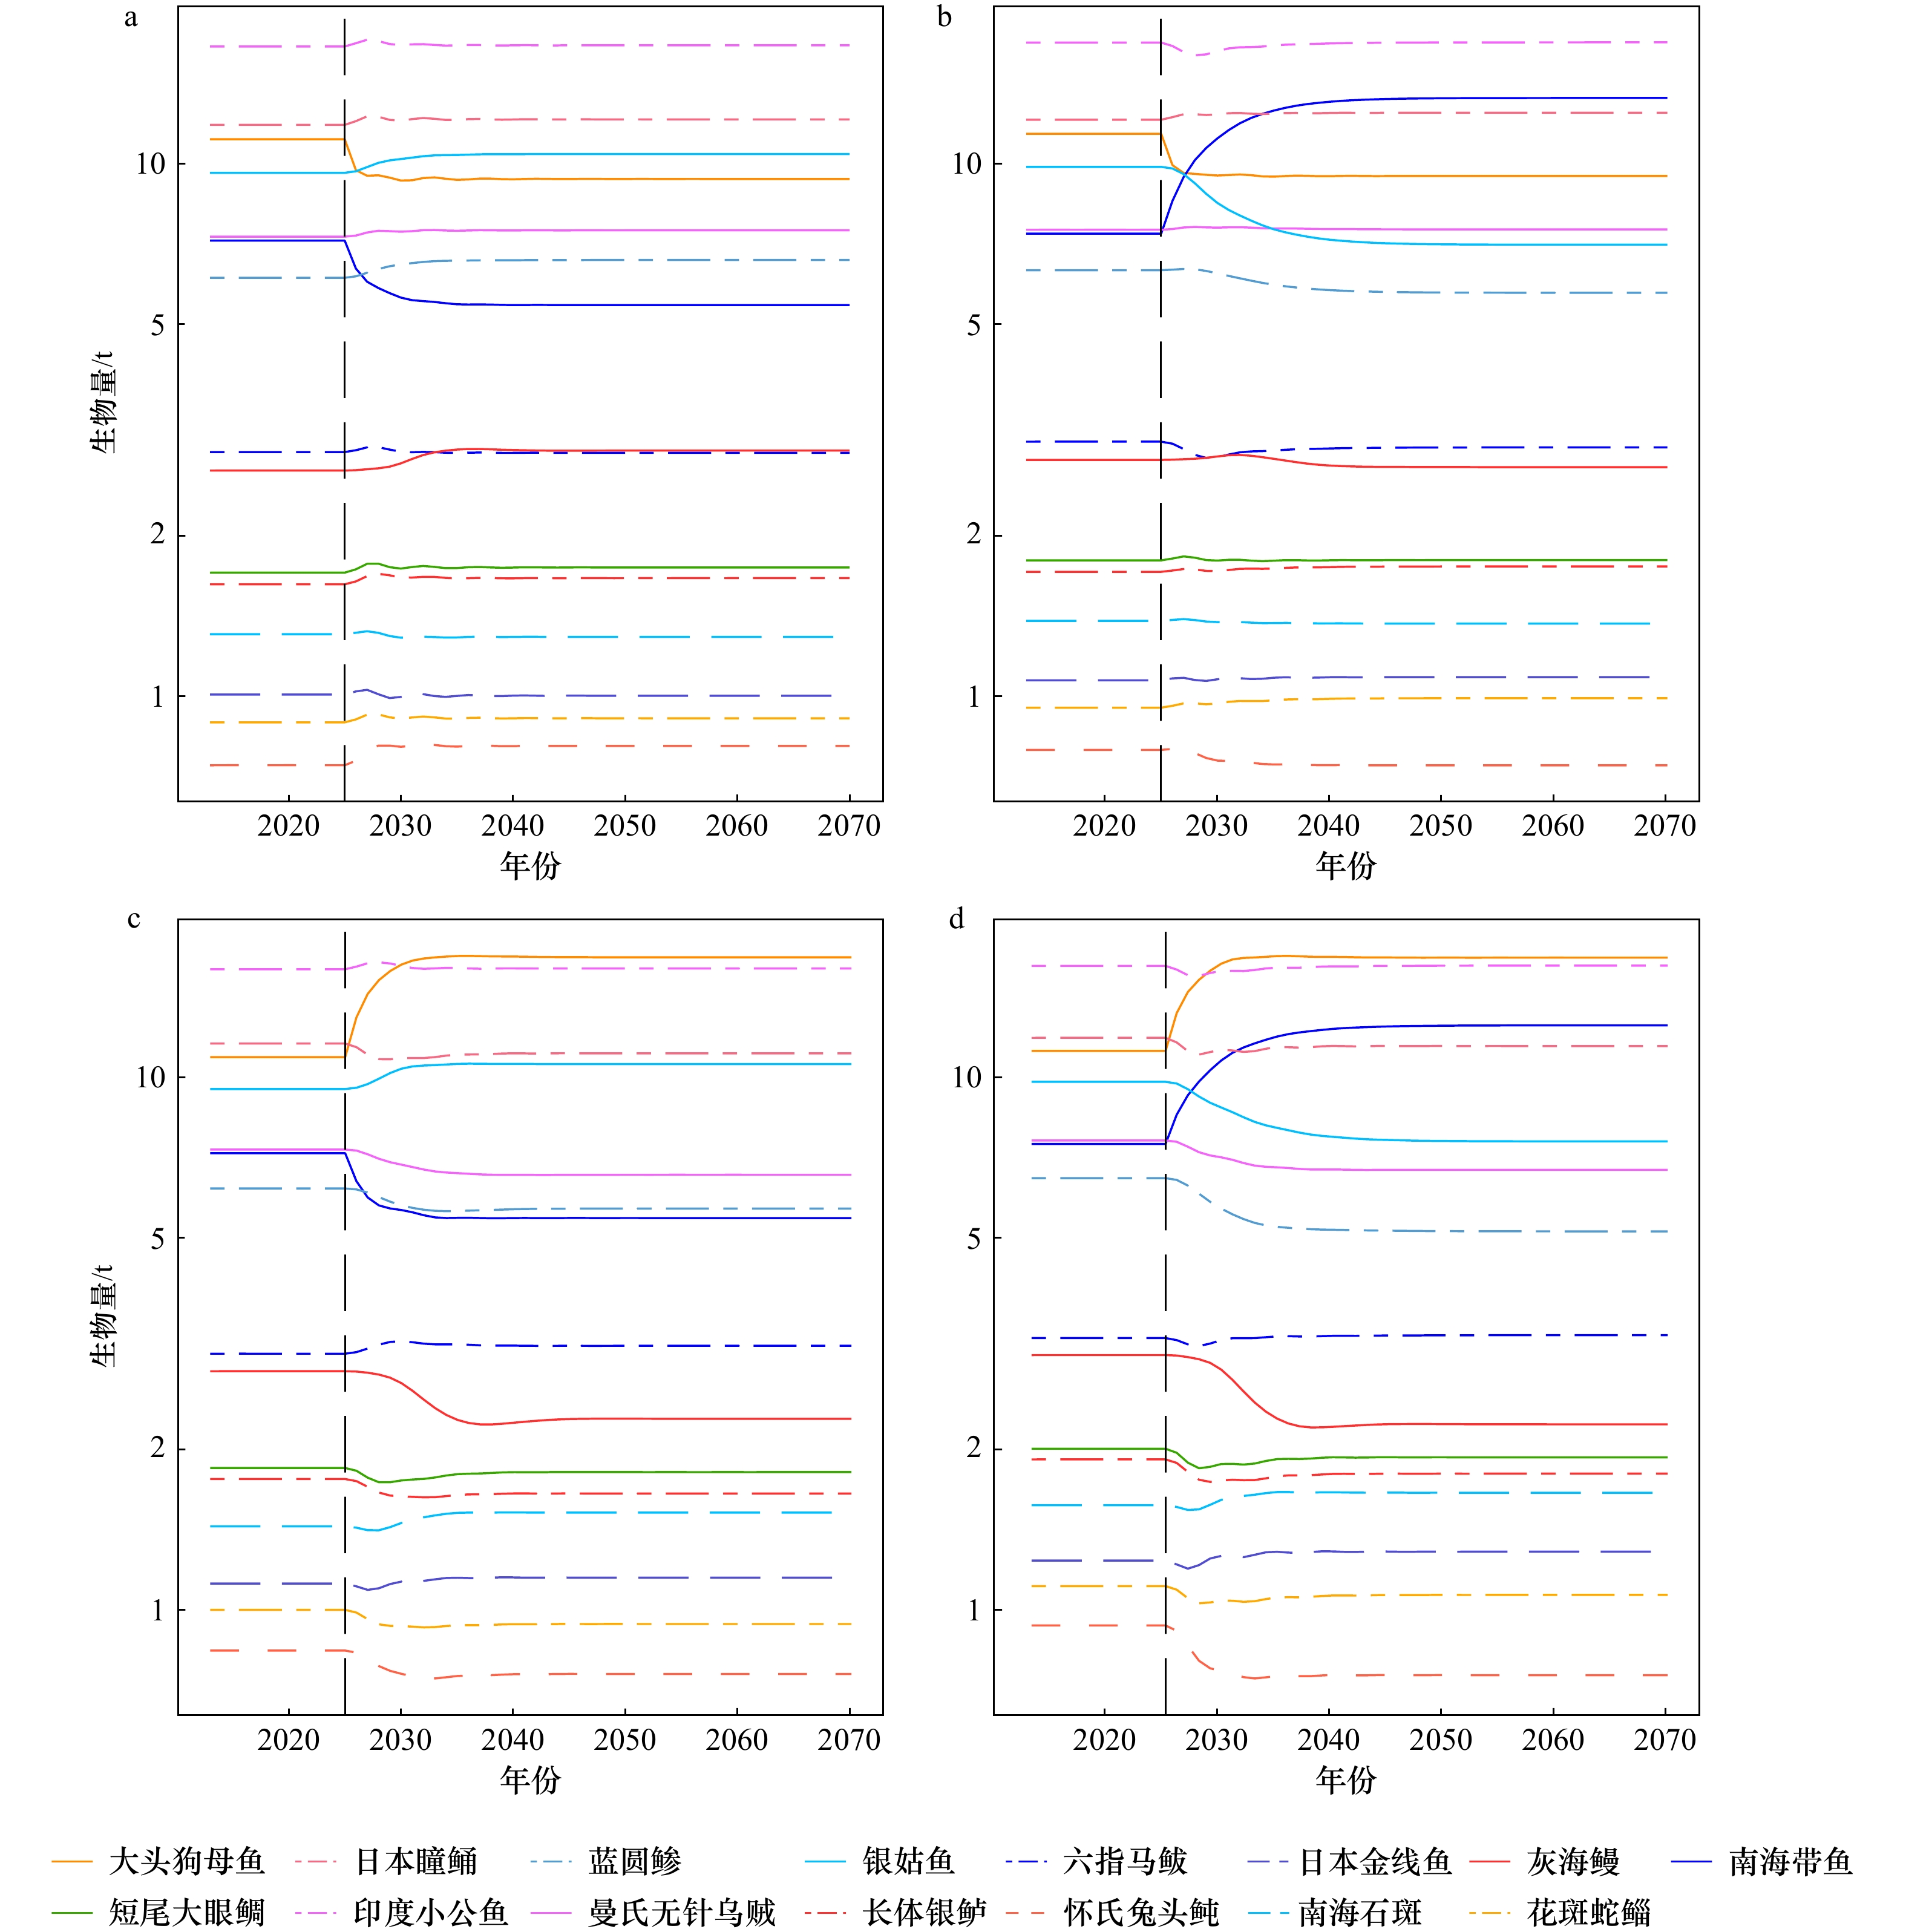
图 4 多物种管理下群落中物种生物量变化情况
图a为模拟大头狗母鱼和南海带鱼的捕捞死亡系数在2025年同时增大75% 后群落中物种生物量的变化情况;图b为模拟大头狗母鱼的捕捞死亡系数在2025年增大75%且南海带鱼的捕捞死亡系数在2025年减小75%后群落中物种生物量的变化情况;图c为模拟大头狗母鱼的捕捞死亡系数在2025年减小75%且南海带鱼的捕捞死亡系数在2025年增大75%后群落中物种生物量的变化情况;图d为模拟大头狗母鱼和南海带鱼的捕捞死亡系数在2025年同时减小75%后群落中物种生物量的变化情况,黑色虚线对应年份为2025年
Fig. 4 Changes in species biomass in communities under multi-species management
Figure a shows the change in species biomass in the community after a simulated 75% increase in fishing death coefficient for both Trachiocephalus myops and Trichiurus nanhaiensis in 2025; figure b shows the change in species biomass in the community after a simulated 75% increase in fishing death coefficient for Trachiocephalus myops in 2025 and a 75% decrease in fishing death coefficient for Trichiurus nanhaiensis in 2025; figure c shows the change in species biomass in the community after a simulated 75% decrease in fishing death coefficient for Trachiocephalus myops in 2025 and a 75% increase in fishing death coefficient for Trichiurus nanhaiensis in 2025; figure d shows the change in species biomass in the community after a simulated 75% decrease in fishing death coefficient for both Trachiocephalus myops and Trichiurus nanhaiensis in 2025, the black dashed line corresponds to the year 2025
表 1 质量谱模型中的物种特征参数
Tab. 1 Species-specific input parameters in the size-spectrum model
物种 Winf Wmat β Rmax SS σ Kvb Q 大头狗母鱼Trachiocephalus myops 1 419.92 218.92 18 9.52 × 10⁵ 10.23 1.30 0.24 0.93 短鲽Brachypleura novaezeelandiae 57.04 13.73 3090 5.15 × 10⁷ 9.81 1.30 0.46 0.63 短尾大眼鲷Priacanthus macracanthus 441.61 100.08 50 7.93 × 10⁴ 11.39 1.30 0.70 0.73 宽条鹦天竺鲷Ostorhinchus fasciatus 101.73 21.04 6545 9.38 × 10⁵ 5.86 1.30 0.78 0.43 鹿斑仰口鲾Secutor ruconius 29.26 8.51 970 9.16 × 10⁶ 6.99 1.30 0.43 0.3 南海带鱼Trichiurus nanhaiensis 805.85 181.87 20 4.11 × 10⁵ 37.84 1.30 0.29 0.54 日本鲱鲤Upeneus japonicus 73.31 19.28 254 3.34 × 10⁵ 8.62 1.30 0.67 0.23 日本瞳鲬Inegocia japonicus 268.78 77.53 112 5.38 × 10⁶ 11.48 1.30 0.32 0.53 少鳞鰧Uranoscopus oligolepis 59.75 21.54 60 3.73 × 10⁵ 7.20 1.30 0.68 0.95 印度小公鱼Stolephorus indicus 87.71 17.33 5487 2.55 × 10⁶ 8.66 1.30 1.05 0.89 南海石斑Epinephelus stictus 257.92 64.48 75 5.04 × 10⁵ 3.91 1.30 0.19 0.4 蓝圆鲹Decapterus maruadsi 464.44 116.11 8849 7.54 × 10⁴ 0.55 1.30 0.36 0.66 曼氏无针乌贼Sepiella maindroni 620.00 155.00 20 3.20 × 10⁴ 1.32 1.30 1.10 0.43 枪乌贼Loligo chinensis 24.00 8.00 14 9.13 × 10⁵ 0.67 1.30 1.10 0.43 花斑蛇鲻Saurida undosquamis 218.37 54.59 33 6.30 × 10⁴ 9.99 1.30 0.59 0.62 银姑鱼Pennahia argentata 539.00 134.75 28 1.90 × 10⁵ 11.67 1.30 0.4 0.41 史氏鳄齿鱼Champsodon snyderi 28.72 7.18 745 9.64 × 10⁵ 1.60 1.30 0.95 1.00 长体银鲈Gerres macrosoma 366.31 91.57 284 1.05 × 10⁵ 14.86 1.30 0.41 0.92 日本金线鱼Nemipterus japonicus 69.50 17.38 50 3.25 × 10⁵ 3.48 1.30 0.76 0.64 六指马鲅Polynemus sextarius 137.00 34.25 178 5.06 × 10⁵ 2.70 1.30 0.37 0.57 怀氏兔头鲀Lagocephalus wheeleri 574.90 143.73 82 4.66 × 10⁴ 27.59 1.30 0.46 0.86 花鳍副海猪鱼Parajulis poecilepterus 276.24 69.06 146 7.64 × 10⁵ 12.38 1.30 0.22 0.38 灰海鳗Muraenesox cinereus 5111.91 1277.99 205 3.91 × 10³ 175.44 1.30 0.19 0.79 云斑裸颊虾虎鱼Yongeichthys criniger 56.98 14.25 950 4.23 × 10⁷ 6.85 1.30 0.4 0.09 注:Winf为渐进质量(单位:g);Wmat为成熟质量(单位:g);Kvb为生长速率;β为捕食者与被捕食者的偏好质量比;Rmax为最大补充量;σ为物种选择函数的宽度;SS为刀刃型网具物种选择大小(单位:g);Q为物种的可捕系数。  下载: 导出CSV
表 2 多物种管理中特定种的捕捞死亡系数管理组合
Tab. 2 Species-specific fishing death coefficient management combinations in multispecies management
场景 捕捞死亡系数管理组合 1 物种A↑物种B↑ 2 物种A↑物种B↓ 3 物种A↓物种B↑ 4 物种A↓物种B↓
下载: 导出CSV
表 3 模拟中物种的捕捞死亡系数变化
Tab. 3 Changes in fishing death coefficient for species in the simulation
物种 F F↑ F↓ 大头狗母鱼Trachiocephalus myops 0.60 1.05 0.15 灰海鳗Muraenesox cinereus 1.01 1.77 0.25 南海带鱼Trichiurus nanhaiensis 0.35 0.61 0.09 曼氏无针乌贼Sepiella maindroni 0.28 0.49 0.07 银姑鱼Pennahia argentata 0.27 0.47 0.07 短尾大眼鲷Priacanthus macracanthus 0.94 1.65 0.24 注:F代表2025年的捕捞死亡系数,F↑ 表示模拟时物种的捕捞死亡系数增大75%(1.75F),F↓表示模拟时物种的捕捞死亡系数减小75%(0.25F)。
下载: 导出CSV
表 4 单物种管理下群落生态指标平均值(%)的变化情况
Tab. 4 Changes in the mean values (%) of community ecological indicators under single species management
物种 总生物量 质量谱
斜率平均最大
质量平均质量 大型鱼类
指数大头狗母鱼Trachiocephalus myops↑ −0.79 −0.20 −1.59 −0.66 −2.41 大头狗母鱼Trachiocephalus myops↓ +3.53 +1.79 +5.04 +3.93 +7.11 灰海鳗Muraenesox cinereus↑ −0.07 −10.69 −2.29 −0.02 −0.49 灰海鳗Muraenesox cinereus↓ +0.54 +19.01 +14.84 +0.28 +3.09 南海带鱼Trichiurus nanhaiensis↑ −0.35 −0.06 −0.29 −0.31 −1.21 南海带鱼Trichiurus nanhaiensis↓ +1.80 +0.62 +0.69 +1.96 +3.74 曼氏无针乌贼Sepiella maindroni↑ +0.69 +0.29 +3.39 +1.27 +3.23 曼氏无针乌贼Sepiella maindroni↓ −1.20 −1.19 −7.08 −2.20 −4.72 银姑鱼Pennahia argentata↑ +0.08 −0.04 −0.91 +0.68 −3.84 银姑鱼Pennahia argentata↓ +0.56 +0.17 +1.84 −0.56 +8.52 短尾大眼鲷Priacanthus macracanthus↑ +0.25 +0.14 −0.05 +0.37 −0.65 短尾大眼鲷Priacanthus macracanthus↓ −0.81 −0.53 +0.02 −1.33 +2.74
下载: 导出CSV
表 5 多物种管理下群落生态指标平均值(%)的变化情况
Tab. 5 Changes in the mean values (%) of community ecological indicators under multispecies management
物种 总生物量 质量谱
斜率平均最大
质量平均质量 大型鱼类
指数大头狗母鱼Trachiocephalus myops↓
灰海鳗Muraenesox cinereus↓+3.73 +20.74 +16.87 +3.86 +8.58 南海带鱼Trichiurus nanhaiensis↓
灰海鳗Muraenesox cinereus↓+2.11 +19.67 +14.28 +2.00 +5.70 曼氏无针乌贼Sepiella maindroni↓
灰海鳗Muraenesox cinereus↓−0.82 +17.80 +12.64 −2.06 −2.16 银姑鱼Pennahia argentata↓
灰海鳗Muraenesox cinereus↓+1.08 +19.17 +16.82 −0.29 +11.11 短尾大眼鲷Priacanthus macracanthus↓
灰海鳗Muraenesox cinereus↓−0.31 +18.68 +14.71 −1.08 +5.35 南海带鱼Trichiurus nanhaiensis↓
大头狗母鱼Trachiocephalus myops↓+4.95 +1.90 +5.77 +5.48 +9.23 曼氏无针乌贼Sepiella maindroni↓
大头狗母鱼Trachiocephalus myops↓+1.14 +0.43 −2.11 +0.26 +1.11 银姑鱼Pennahia argentata↓
大头狗母鱼Trachiocephalus myops↓+3.97 +1.90 +6.63 +3.19 +14.49 短尾大眼鲷Priacanthus macracanthus↓
大头狗母鱼Trachiocephalus myops↓+2.53 +1.29 +4.79 +2.40 +8.27 曼氏无针乌贼Sepiella maindroni↓
南海带鱼Trichiurus nanhaiensis↓+0.12 −0.56 −6.12 −0.80 −2.04 银姑鱼Pennahia argentata↓
南海带鱼Trichiurus nanhaiensis↓+1.49 +0.62 +1.79 +0.71 +8.43 短尾大眼鲷Priacanthus macracanthus↓
南海带鱼Trichiurus nanhaiensis↓+0.83 +0.13 +0.61 +0.48 +5.43 银姑鱼Pennahia argentata↓
曼氏无针乌贼Sepiella maindroni↓−0.85 −1.11 −5.23 −2.94 +3.43 短尾大眼鲷Priacanthus macracanthus↓
曼氏无针乌贼Sepiella maindroni↓−1.69 −1.41 −6.97 −2.90 −3.88 短尾大眼鲷Priacanthus macracanthus↓
银姑鱼Pennahia argentata↓−0.25 −0.36 +1.85 −1.84 +10.78
下载: 导出CSV
-
[1] 张国胜, 陈勇, 张沛东, 等. 中国海域建设海洋牧场的意义及可行性[J]. 大连水产学院学报, 2003, 18(2): 141−144.Zhang Guosheng, Chen Yong, Zhang Peidong, et al. Significance and feasibility of establishing marine ranching in Chinese sea area[J]. Journal of Dalian Fisheries University, 2003, 18(2): 141−144. [2] 杨金龙, 吴晓郁, 石国峰, 等. 海洋牧场技术的研究现状和发展趋势[J]. 中国渔业经济, 2004(5): 48−50.Yang Jinlong, Wu Xiaoyu, Shi Guofeng, et al. Overview of marine ranching technology[J]. Chinese Fisheries Economics, 2004(5): 48−50. [3] 杨红生. 我国海洋牧场建设回顾与展望[J]. 水产学报, 2016, 40(7): 1133−1140.Yang Hongsheng. Construction of marine ranching in China: reviews and prospects[J]. Journal of Fisheries of China, 2016, 40(7): 1133−1140. [4] 阙华勇, 陈勇, 张秀梅, 等. 现代海洋牧场建设的现状与发展对策[J]. 中国工程科学, 2016, 18(3): 79−84. doi: 10.15302/J-SSCAE-2016.03.013Que Huayong, Chen Yong, Zhang Xiumei, et al. Modern marine ranching: status and development strategy[J]. Strategic Study of CAE, 2016, 18(3): 79−84. doi: 10.15302/J-SSCAE-2016.03.013 [5] 杨红生, 章守宇, 张秀梅, 等. 中国现代化海洋牧场建设的战略思考[J]. 水产学报, 2019, 43(4): 1255−1262.Yang Hongsheng, Zhang Shouyu, Zhang Xiumei, et al. Strategic thinking on the construction of modern marine ranching in China[J]. Journal of Fisheries of China, 2019, 43(4): 1255−1262. [6] 魏虎进, 朱小明, 纪雅宁, 等. 基于稳定同位素技术的象山港海洋牧场区食物网基础与营养级的研究[J]. 应用海洋学学报, 2013, 32(2): 250−257.Wei Hujin, Zhu Xiaoming, Ji Yaning, et al. Study on the food web structure and their trophic levels of marine ranching area in Xiangshan Harbor[J]. Journal of Applied Oceanography, 2013, 32(2): 250−257. [7] 彭璇, 马胜伟, 陈海刚, 等. 粤柘林东湾−南澳岛海洋牧场的海水营养状况及其等级评价[J]. 广东农业科学, 2014, 41(19): 135−141.Peng Xuan, Ma Shengwei, Chen Haigang, et al. Nutrient status and grade evaluation of seawater in Zhelin Bay-Nanao Island marine ranching[J]. Guangdong Agricultural Sciences, 2014, 41(19): 135−141. [8] 高春梅, 朱珠, 王功芹, 等. 海州湾海洋牧场海域表层沉积物磷的形态与环境意义[J]. 中国环境科学, 2015, 35(11): 3437−3444.Gao Chunmei, Zhu Zhu, Wang Gongqin, et al. The distribution of phosphorus forms and its environmental significance in the marine ranching demonstration area of Haizhou Bay sediment[J]. China Environmental Science, 2015, 35(11): 3437−3444. [9] 陈勇, 杨军, 田涛, 等. 獐子岛海洋牧场人工鱼礁区鱼类资源养护效果的初步研究[J]. 大连海洋大学学报, 2014, 29(2): 183−187.Chen Yong, Yang Jun, Tian Tao, et al. The enhancement effect of fishery resources on artificial reefs in marine ranching area in Zhangzi Island[J]. Journal of Dalian Ocean University, 2014, 29(2): 183−187. [10] 李纯厚, 贾晓平, 齐占会, 等. 大亚湾海洋牧场低碳渔业生产效果评价[J]. 农业环境科学学报, 2011, 30(11): 2346−2352.Li Chunhou, Jia Xiaoping, Qi Zhanhui, et al. Effect evaluation of a low-carbon fisheries production by marine ranching in Daya Bay[J]. Journal of Agro-Environment Science, 2011, 30(11): 2346−2352. [11] Zhang Chongliang, Chen Yong, Ren Yiping. The efficacy of fisheries closure in rebuilding depleted stocks: lessons from size-spectrum modeling[J]. Ecological Modelling, 2016, 332: 59−66. doi: 10.1016/j.ecolmodel.2016.04.001 [12] Blanchard J L, Heneghan R F, Everett J D, et al. From bacteria to whales: using functional size spectra to model marine ecosystems[J]. Trends in Ecology & Evolution, 2017, 32(3): 174−186. [13] Hartvig M, Andersen K H, Beyer J E. Food web framework for size-structured populations[J]. Journal of Theoretical Biology, 2011, 272(1): 113−122. doi: 10.1016/j.jtbi.2010.12.006 [14] Zhang Chongliang, Chen Yong, Ren Yiping. An evaluation of implementing long-term MSY in ecosystem-based fisheries management: incorporating trophic interaction, bycatch and uncertainty[J]. Fisheries Research, 2016, 174: 179−189. doi: 10.1016/j.fishres.2015.10.007 [15] Andersen K H, Jacobsen N S, Farnsworth K D. The theoretical foundations for size spectrum models of fish communities[J]. Canadian Journal of Fisheries and Aquatic Sciences, 2016, 73(4): 575−588. doi: 10.1139/cjfas-2015-0230 [16] Blanchard J L, Andersen K H, Scott F, et al. Evaluating targets and trade-offs among fisheries and conservation objectives using a multispecies size spectrum model[J]. Journal of Applied Ecology, 2014, 51(3): 612−622. doi: 10.1111/1365-2664.12238 [17] Reum J C P, Blanchard J L, Holsman K K, et al. Ensemble projections of future climate change impacts on the eastern Bering Sea food web using a multispecies size spectrum model[J]. Frontiers in Marine Science, 2020, 7: 124. doi: 10.3389/fmars.2020.00124 [18] Wo Jia, Zhang Chongliang, Ji Yupeng, et al. A multispecies TAC approach to achieving long-term sustainability in multispecies mixed fisheries[J]. ICES Journal of Marine Science, 2022, 79(1): 218−229. doi: 10.1093/icesjms/fsab257 [19] Zhang Chongliang, Chen Yong, Thompson K, et al. Implementing a multispecies size-spectrum model in a data-poor ecosystem[J]. Acta Oceanologica Sinica, 2016, 35(4): 63−73. doi: 10.1007/s13131-016-0822-0 [20] 罗惠桂, 汪佳仪, 谢珍玉, 等. 三亚蜈支洲岛毗邻海域鱼类物种多样性及群落结构特征[J]. 海洋科学, 2023, 47(7): 74−86.Luo Huigui, Wang Jiayi, Xie Zhenyu, et al. Fish biodiversity and community structure characteristics of Wuzhizhou Island, Sanya[J]. Marine Sciences, 2023, 47(7): 74−86. [21] Andersen K H, Beyer J E. Asymptotic size determines species abundance in the marine size spectrum[J]. The American Naturalist, 2006, 168(1): 54−61. doi: 10.1086/504849 [22] Scott F, Blanchard J L, Andersen K H. mizer: an R package for multispecies, trait-based and community size spectrum ecological modelling[J]. Methods in Ecology and Evolution, 2014, 5(10): 1121−1125. doi: 10.1111/2041-210X.12256 [23] Kokkalis A, Thygesen U H, Nielsen A, et al. Limits to the reliability of size-based fishing status estimation for data-poor stocks[J]. Fisheries Research, 2015, 171: 4−11. doi: 10.1016/j.fishres.2014.10.007 [24] Benoit D M, Chu C, Giacomini H C, et al. Size spectrum model reveals importance of considering species interactions in a freshwater fisheries management context[J]. Ecosphere, 2022, 13(7): e4163. doi: 10.1002/ecs2.4163 [25] Andersen K H, Pedersen M. Damped trophic cascades driven by fishing in model marine ecosystems[J]. Proceedings of the Royal Society B: Biological Sciences, 2010, 277(1682): 795−802. doi: 10.1098/rspb.2009.1512 [26] Wo Jia, Zhang Chongliang, Pan Xindong, et al. Modeling the dynamics of multispecies fisheries: a case study in the coastal water of North Yellow Sea, China[J]. Frontiers in Marine Science, 2020, 7: 524463. doi: 10.3389/fmars.2020.524463 [27] Kempf A, Dingsør G E, Huse G, et al. The importance of predator-prey overlap: predicting North Sea cod recovery with a multispecies assessment model[J]. ICES Journal of Marine Science, 2010, 67(9): 1989−1997. doi: 10.1093/icesjms/fsq114 [28] Fulton E A, Smith A D M, Punt A E. Which ecological indicators can robustly detect effects of fishing?[J]. ICES Journal of Marine Science, 2005, 62(3): 540−551. doi: 10.1016/j.icesjms.2004.12.012 [29] Houle J E, Farnsworth K D, Rossberg A G, et al. Assessing the sensitivity and specificity of fish community indicators to management action[J]. Canadian Journal of Fisheries and Aquatic Sciences, 2012, 69(6): 1065−1079. doi: 10.1139/f2012-044 [30] Rice J C. Evaluating fishery impacts using metrics of community structure[J]. ICES Journal of Marine Science, 2000, 57(3): 682−688. doi: 10.1006/jmsc.2000.0735 [31] Greenstreet S P R, Rogers S I, Rice J C, et al. Development of the EcoQO for the North Sea fish community[J]. ICES Journal of Marine Science, 2011, 68(1): 1−11. doi: 10.1093/icesjms/fsq156 [32] Rochet M J, Rice J C. Do explicit criteria help in selecting indicators for ecosystem-based fisheries management?[J]. ICES Journal of Marine Science, 2005, 62(3): 528−539. doi: 10.1016/j.icesjms.2005.01.007 [33] Shin Y J, Cury P. Using an individual-based model of fish assemblages to study the response of size spectra to changes in fishing[J]. Canadian Journal of Fisheries and Aquatic Sciences, 2004, 61(3): 414−431. doi: 10.1139/f03-154 [34] Petchey O L, Belgrano A. Body-size distributions and size-spectra: universal indicators of ecological status?[J]. Biology Letters, 2010, 6(4): 434−437. doi: 10.1098/rsbl.2010.0240 [35] Sissenwine M P. Why do fish populations vary?[M]//May R M. Exploitation of Marine Communities: Report of the Dahlem Workshop on Exploitation of Marine Communities Berlin 1984, April 1−6. Berlin Heidelberg: Springer, 1984: 59−94. [36] Hessen D O, Kaartvedt S. Top-down cascades in lakes and oceans: different perspectives but same story?[J]. Journal of Plankton Research, 2014, 36(4): 914−924. doi: 10.1093/plankt/fbu040 [37] Worm B, Myers R A. Meta-analysis of cod-shrimp interactions reveals top-down control in oceanic food webs[J]. Ecology, 2003, 84(1): 162−173. doi: 10.1890/0012-9658(2003)084[0162:MAOCSI]2.0.CO;2 [38] Casini M, Lövgren J, Hjelm J, et al. Multi-level trophic cascades in a heavily exploited open marine ecosystem[J]. Proceedings of the Royal Society B: Biological Sciences, 2008, 275(1644): 1793−1801. doi: 10.1098/rspb.2007.1752 [39] Daskalov G M. Overfishing drives a trophic cascade in the Black Sea[J]. Marine Ecology Progress Series, 2002, 225: 53−63. doi: 10.3354/meps225053 [40] 徐旭才, 张其永. 闽南−台湾浅滩大头狗母鱼种群年龄结构和生长特性研究[J]. 厦门大学学报(自然科学版), 1986, 25(6): 712−720.Xu Xucai, Zhang Qiyong. Age and growth of Trachiocephalus myops in the South-Fujian and Taiwan Bank[J]. Journal of Xiamen University (Natural Science), 1986, 25(6): 712−720. [41] 张壮丽. 闽南−台湾浅滩渔场大头狗母鱼的渔业生物学[J]. 台湾海峡, 1997, 16(2): 212−216.Zhang Zhuangli. Fishery biology of Trachinocephalus myops in Minnan-Taiwan shoal Fishery Ground[J]. Journal of Oceanography in Taiwan Strait, 1997, 16(2): 212−216. [42] Heithaus M R, Frid A, Wirsing A J, et al. Predicting ecological consequences of marine top predator declines[J]. Trends in Ecology & Evolution, 2008, 23(4): 202−210. [43] Pauly D, Christensen V, Guénette S, et al. Towards sustainability in world fisheries[J]. Nature, 2002, 418(6898): 689−695. doi: 10.1038/nature01017 [44] Shin Y J, Rochet M J, Jennings S, et al. Using size-based indicators to evaluate the ecosystem effects of fishing[J]. ICES Journal of Marine Science, 2005, 62(3): 384−396. doi: 10.1016/j.icesjms.2005.01.004 [45] 肖祎, 蒋日进, 印瑞, 等. 舟山群岛海域5种鳗的营养生态位及种间关系[J]. 水产学报, 2023, 47(7): 65−74.Xiao Yi, Jiang Rijin, Yin Rui, et al. Trophic niche and interspecific relationship of five eels in the waters of the Zhoushan Islands[J]. Journal of Fisheries of China, 2023, 47(7): 65−74. [46] Cardinale B J, Duffy J E, Gonzalez A, et al. Correction: corrigendum: biodiversity loss and its impact on humanity[J]. Nature, 2012, 489(7415): 326. [47] Mora C, Wei C L, Rollo A, et al. Biotic and human vulnerability to projected changes in ocean biogeochemistry over the 21st century[J]. PLoS Biology, 2013, 11(10): e1001682. doi: 10.1371/journal.pbio.1001682 [48] Benoit D M, Giacomini H C, Chu C, et al. Identifying influential parameters of a multi-species fish size spectrum model for a northern temperate lake through sensitivity analyses[J]. Ecological Modelling, 2021, 460: 109740. doi: 10.1016/j.ecolmodel.2021.109740 [49] McCauley D J, Pinsky M L, Palumbi S R, et al. Marine defaunation: animal loss in the global ocean[J]. Science, 2015, 347(6219): 1255641. doi: 10.1126/science.1255641 [50] Beaugrand G, Reid P C. Long-term changes in phytoplankton, zooplankton and salmon related to climate[J]. Global Change Biology, 2003, 9(6): 801−817. doi: 10.1046/j.1365-2486.2003.00632.x [51] Ware D M, Thomson R E. Bottom-up ecosystem trophic dynamics determine fish production in the Northeast Pacific[J]. Science, 2005, 308(5726): 1280−1284. doi: 10.1126/science.1109049 [52] Zhang Chongliang, Chen Yong, Ren Yiping. Assessing uncertainty of a multispecies size-spectrum model resulting from process and observation errors[J]. ICES Journal of Marine Science, 2015, 72(8): 2223−2233. doi: 10.1093/icesjms/fsv086 -

计量
- 文章访问数: 936
- HTML全文浏览量: 426
- PDF下载量: 75
- 被引次数: 0
