

Study on the non-stationary characteristics of extreme storm surges along the Changjiang River Estuary
-
摘要: 本文基于ADCIRC构建适用于长江口的台风暴潮模型,对1979–2019年间长江口台风增水过程进行数值重构;结合非平稳广义极值分布和状态空间模型,构建适用于刻画长江口极端增水非平稳变化的频率统计模型,研判非平稳变化引起的极端增水量值调整情况。结果表明,长江口各验潮站处极端增水的非平稳广义极值分布时变位置参数在2008年前表现为波动特征,2008年后呈现逐渐增大趋势。2008–2019年间各验潮站处极端增水时变位置参数的线性上升率介于0.8~1.2 cm/a之间。基于上述变化趋势,考虑极端增水非平稳变化时长江口各验潮站处百年一遇增水均大于基于平稳假定的推算结果,二者差值介于8~15 cm之间。经分析,2008年后北上到长江口附近海域再转向外海的热带气旋强度有明显增强趋势,致使长江口各验潮站处年第二和第三大值增水增大,这是导致各验潮站处风暴增水极值分布位置参数出现趋势性增大的主要原因。Abstract: Under the background of global climate change, the extreme storm surge events caused by tropical cyclones in the Changjiang River Estuary and adjacent coastal area present non-stationary feature. In this study, a storm surge model for the Changjiang River Estuary was constructed using the ADCIRC model to reproduce the storm surges during 241 tropical cyclones affecting the Changjiang River Estuary from 1979 to 2019. By combining the non-stationary generalized extreme value distribution with the state space approach, a statistical model for capturing the non-stationarity of extreme storm surges was built to investigate the spatiotemporal variability of the extreme storm surges in the Changjiang River Estuary and its adjacent coastal area. The statistical model can well reproduce the non-stationary feature of extreme storm surges, which was mainly represented by the time-dependent location parameter. The time-dependent location parameters at the tidal gauge stations were stationary before 2008 and presented increasing trends afterwards, which was mainly caused by the increase of the annual second- and third-largest storm surges. The reoccurrence period of storm surge event with 100-year return period under the stationary assumption was reduced to around 40–80 years, indicating an increased flood risk in the Changjiang River Estuary. Combined with the changes in the intensity and path of the tropical cyclones that caused the annual second- and third-largest storm surges, it was concluded that the increasing trends of extreme storm surges were mainly caused by the increase in the intensity of the tropical cyclone that tracking northward to the offshore of the Changjiang River Estuary and veering eastwards.
-

图 1 风暴潮模型网格布置及水深分布
b和d分别为a和c紫色框中网格和地形的局部放大图
Fig. 1 Mesh and bathymetry for storm surge modeling
b and d are the zoom-in mesh and bathymetry within the purple rectangles in a and c, respectively
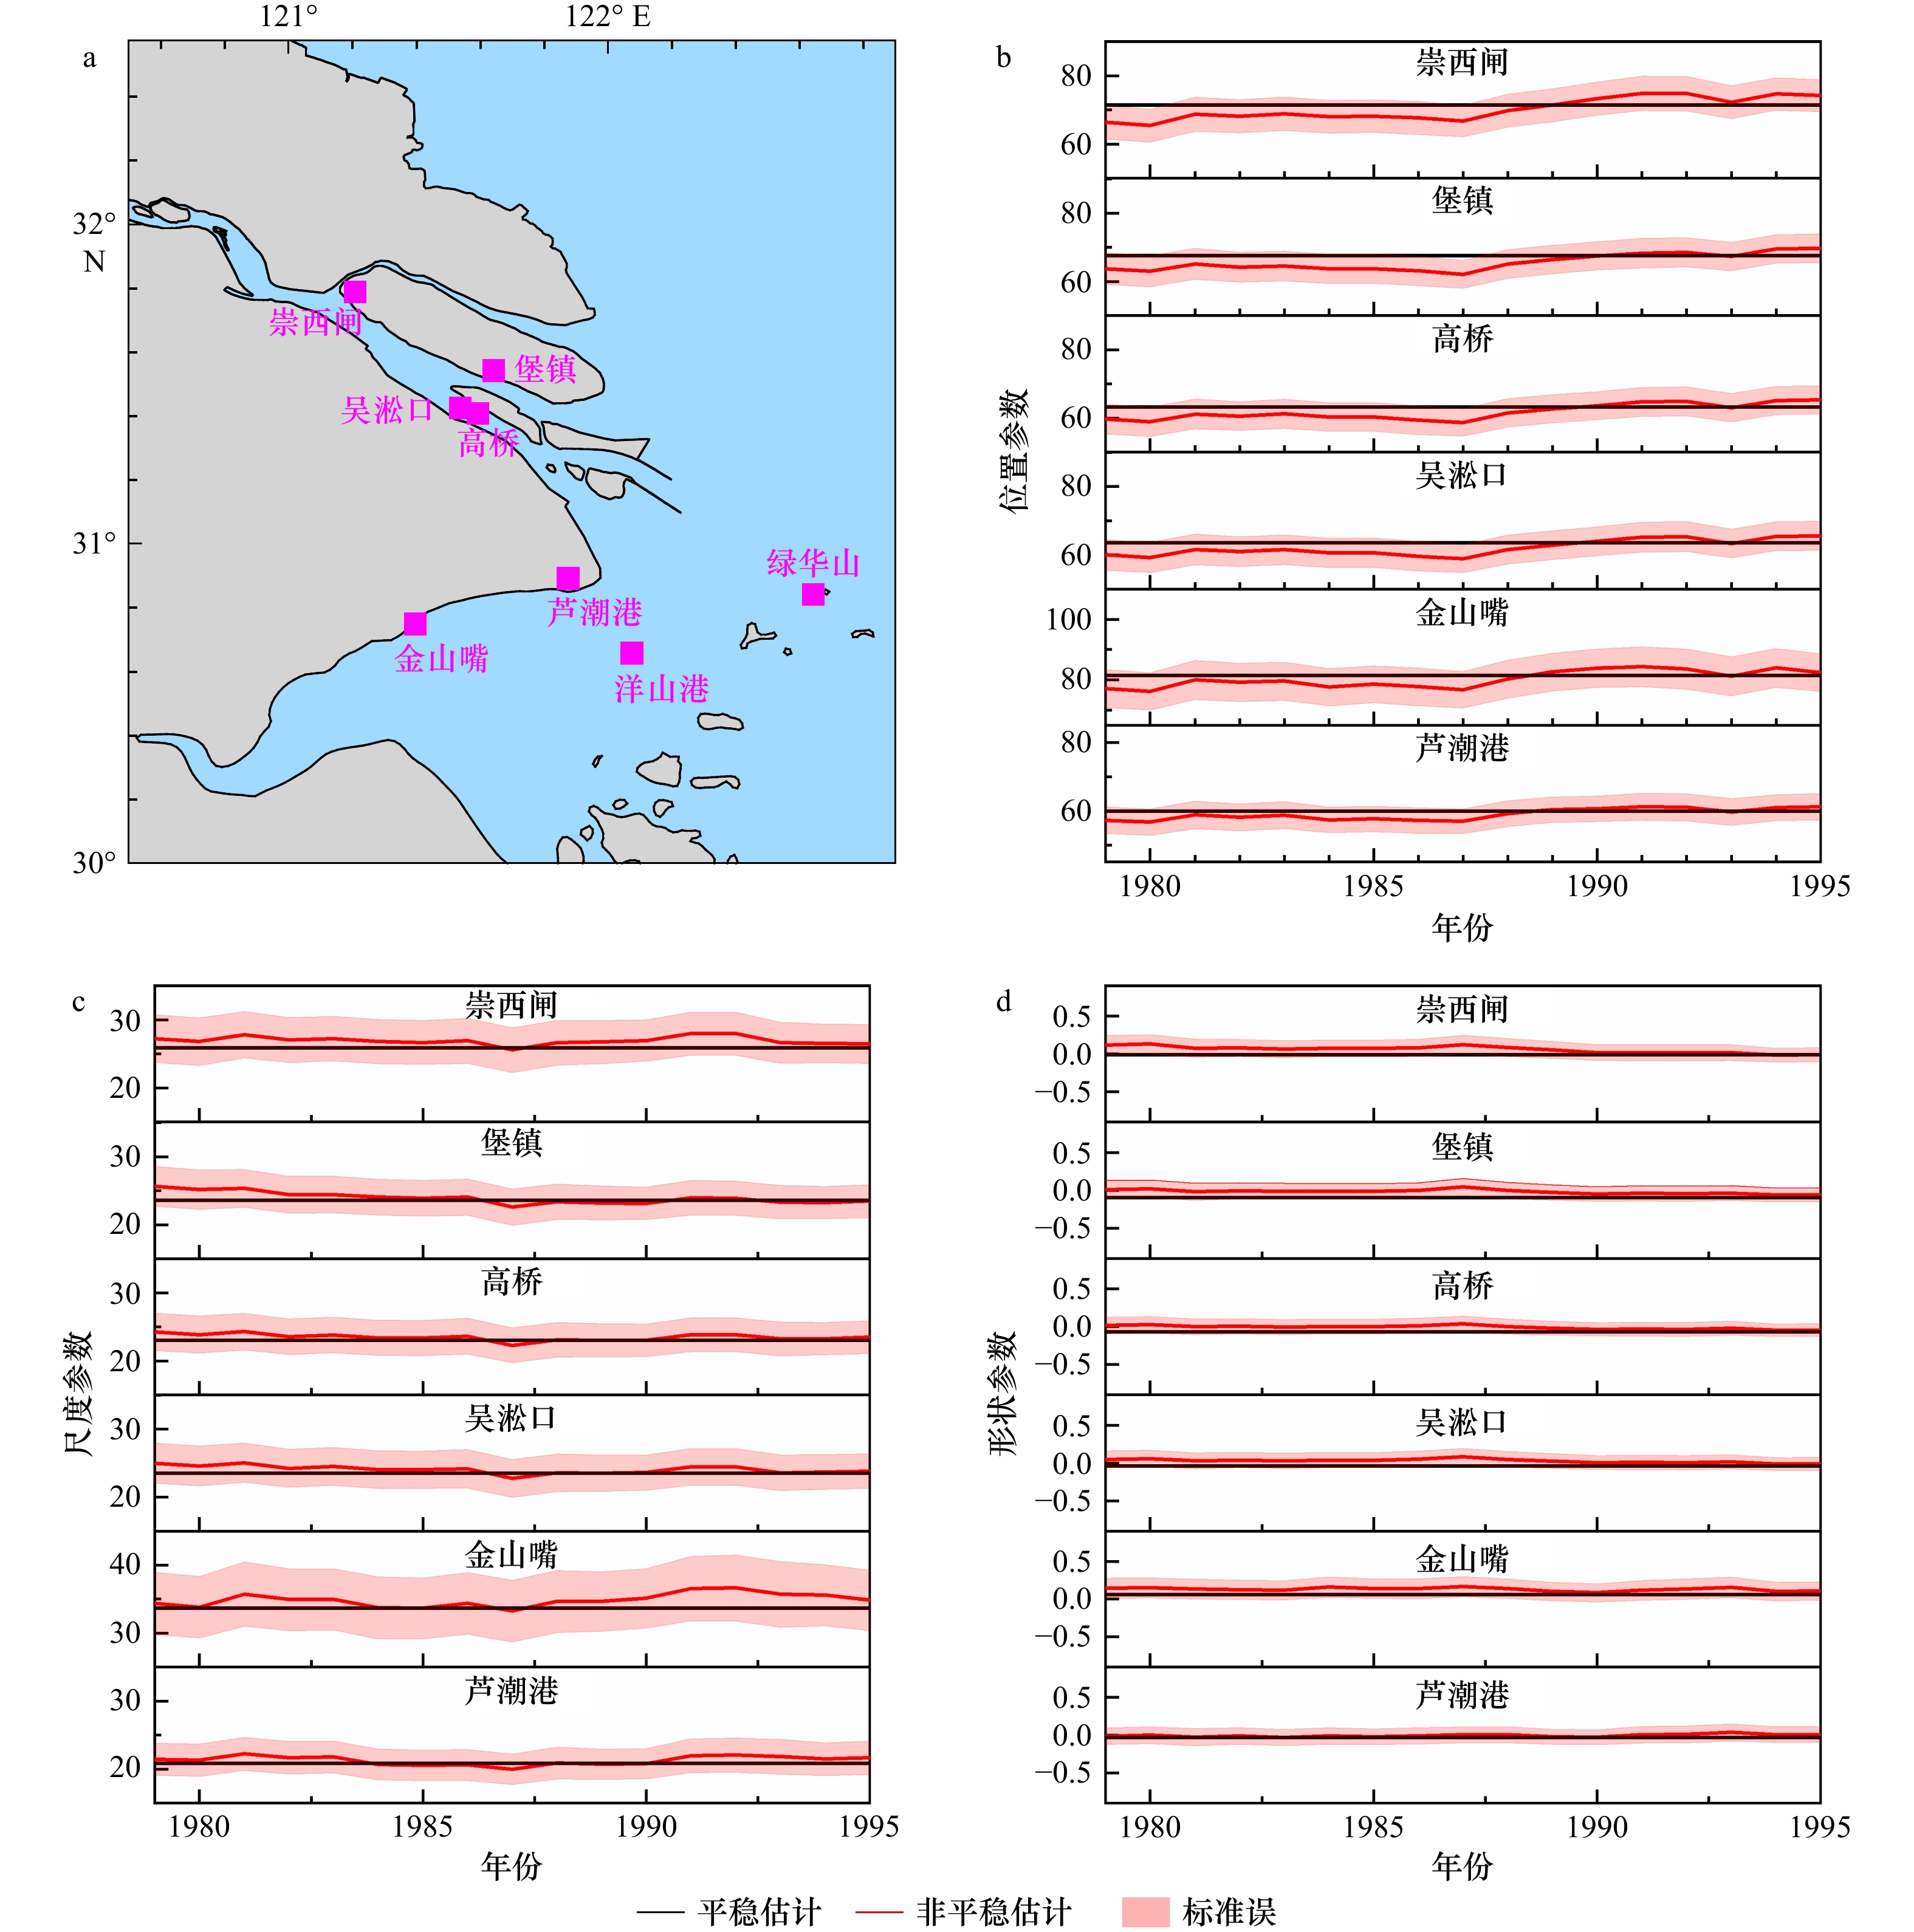
图 2 年极端增水样本数r= 3时各验潮站处增水极值分布参数的拟合结果
a. 长江口及附近海域验潮站位置;b. 位置参数;c. 尺度参数;d. 形状参数
Fig. 2 Fitting results of the parameters of GEV distribution for the annual three-largest storm surges at the tide gauges
a. Locations of tide gauges within Changjiang Rvier Estuary and its adjacent area; b. location parameter; c. scale parameter; d. shape parameter
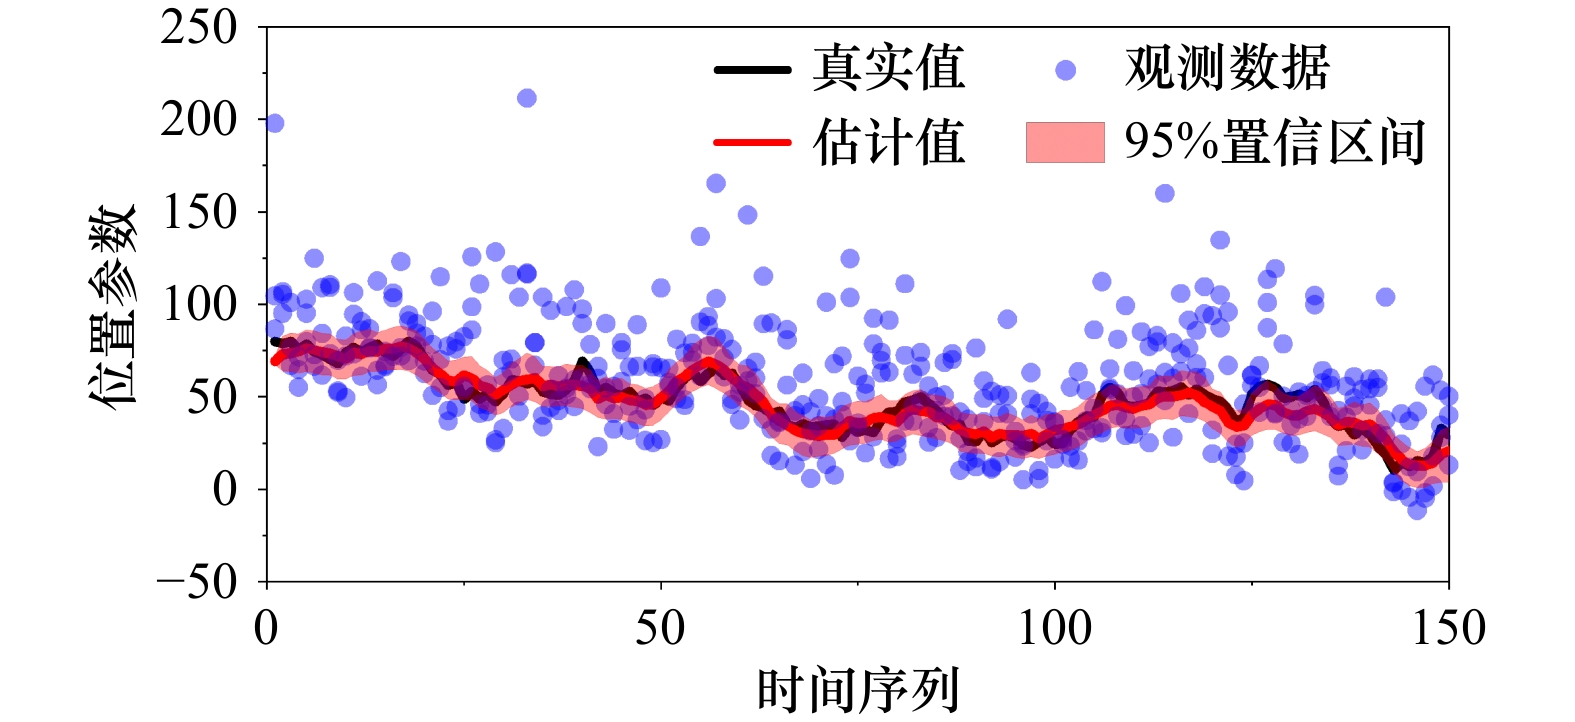
图 3 PGAS算法用于非平稳位置参数计算验证
Fig. 3 Verification of non-stationary location parameter estimated by PGAS algorithm

图 4 1909号超强台风“利奇马”期间风速和气压验证
a. 台风路径及强度;b. 风圈半径验证;c. 风速验证;d. 气压验证
Fig. 4 Verification of wind and pressure during the 1909 Super Typhoon Lekima
a. Storm track and intensity; b. verification of different gale-force wind radii; c. verification of wind speed; d. verification of atmospheric pressure

图 6 1909号超强台风“利奇马”期间增水验证结果
Fig. 6 Verification of storm surge level during the 1909 super Typhoon Lekima

图 7 各验潮站年前三大值增水及线性趋势
加粗字体表示趋势通过95%显著性检验
Fig. 7 Annual three-largest storm surges and their linear trends
Bold fonts present trends passing 95% significance test
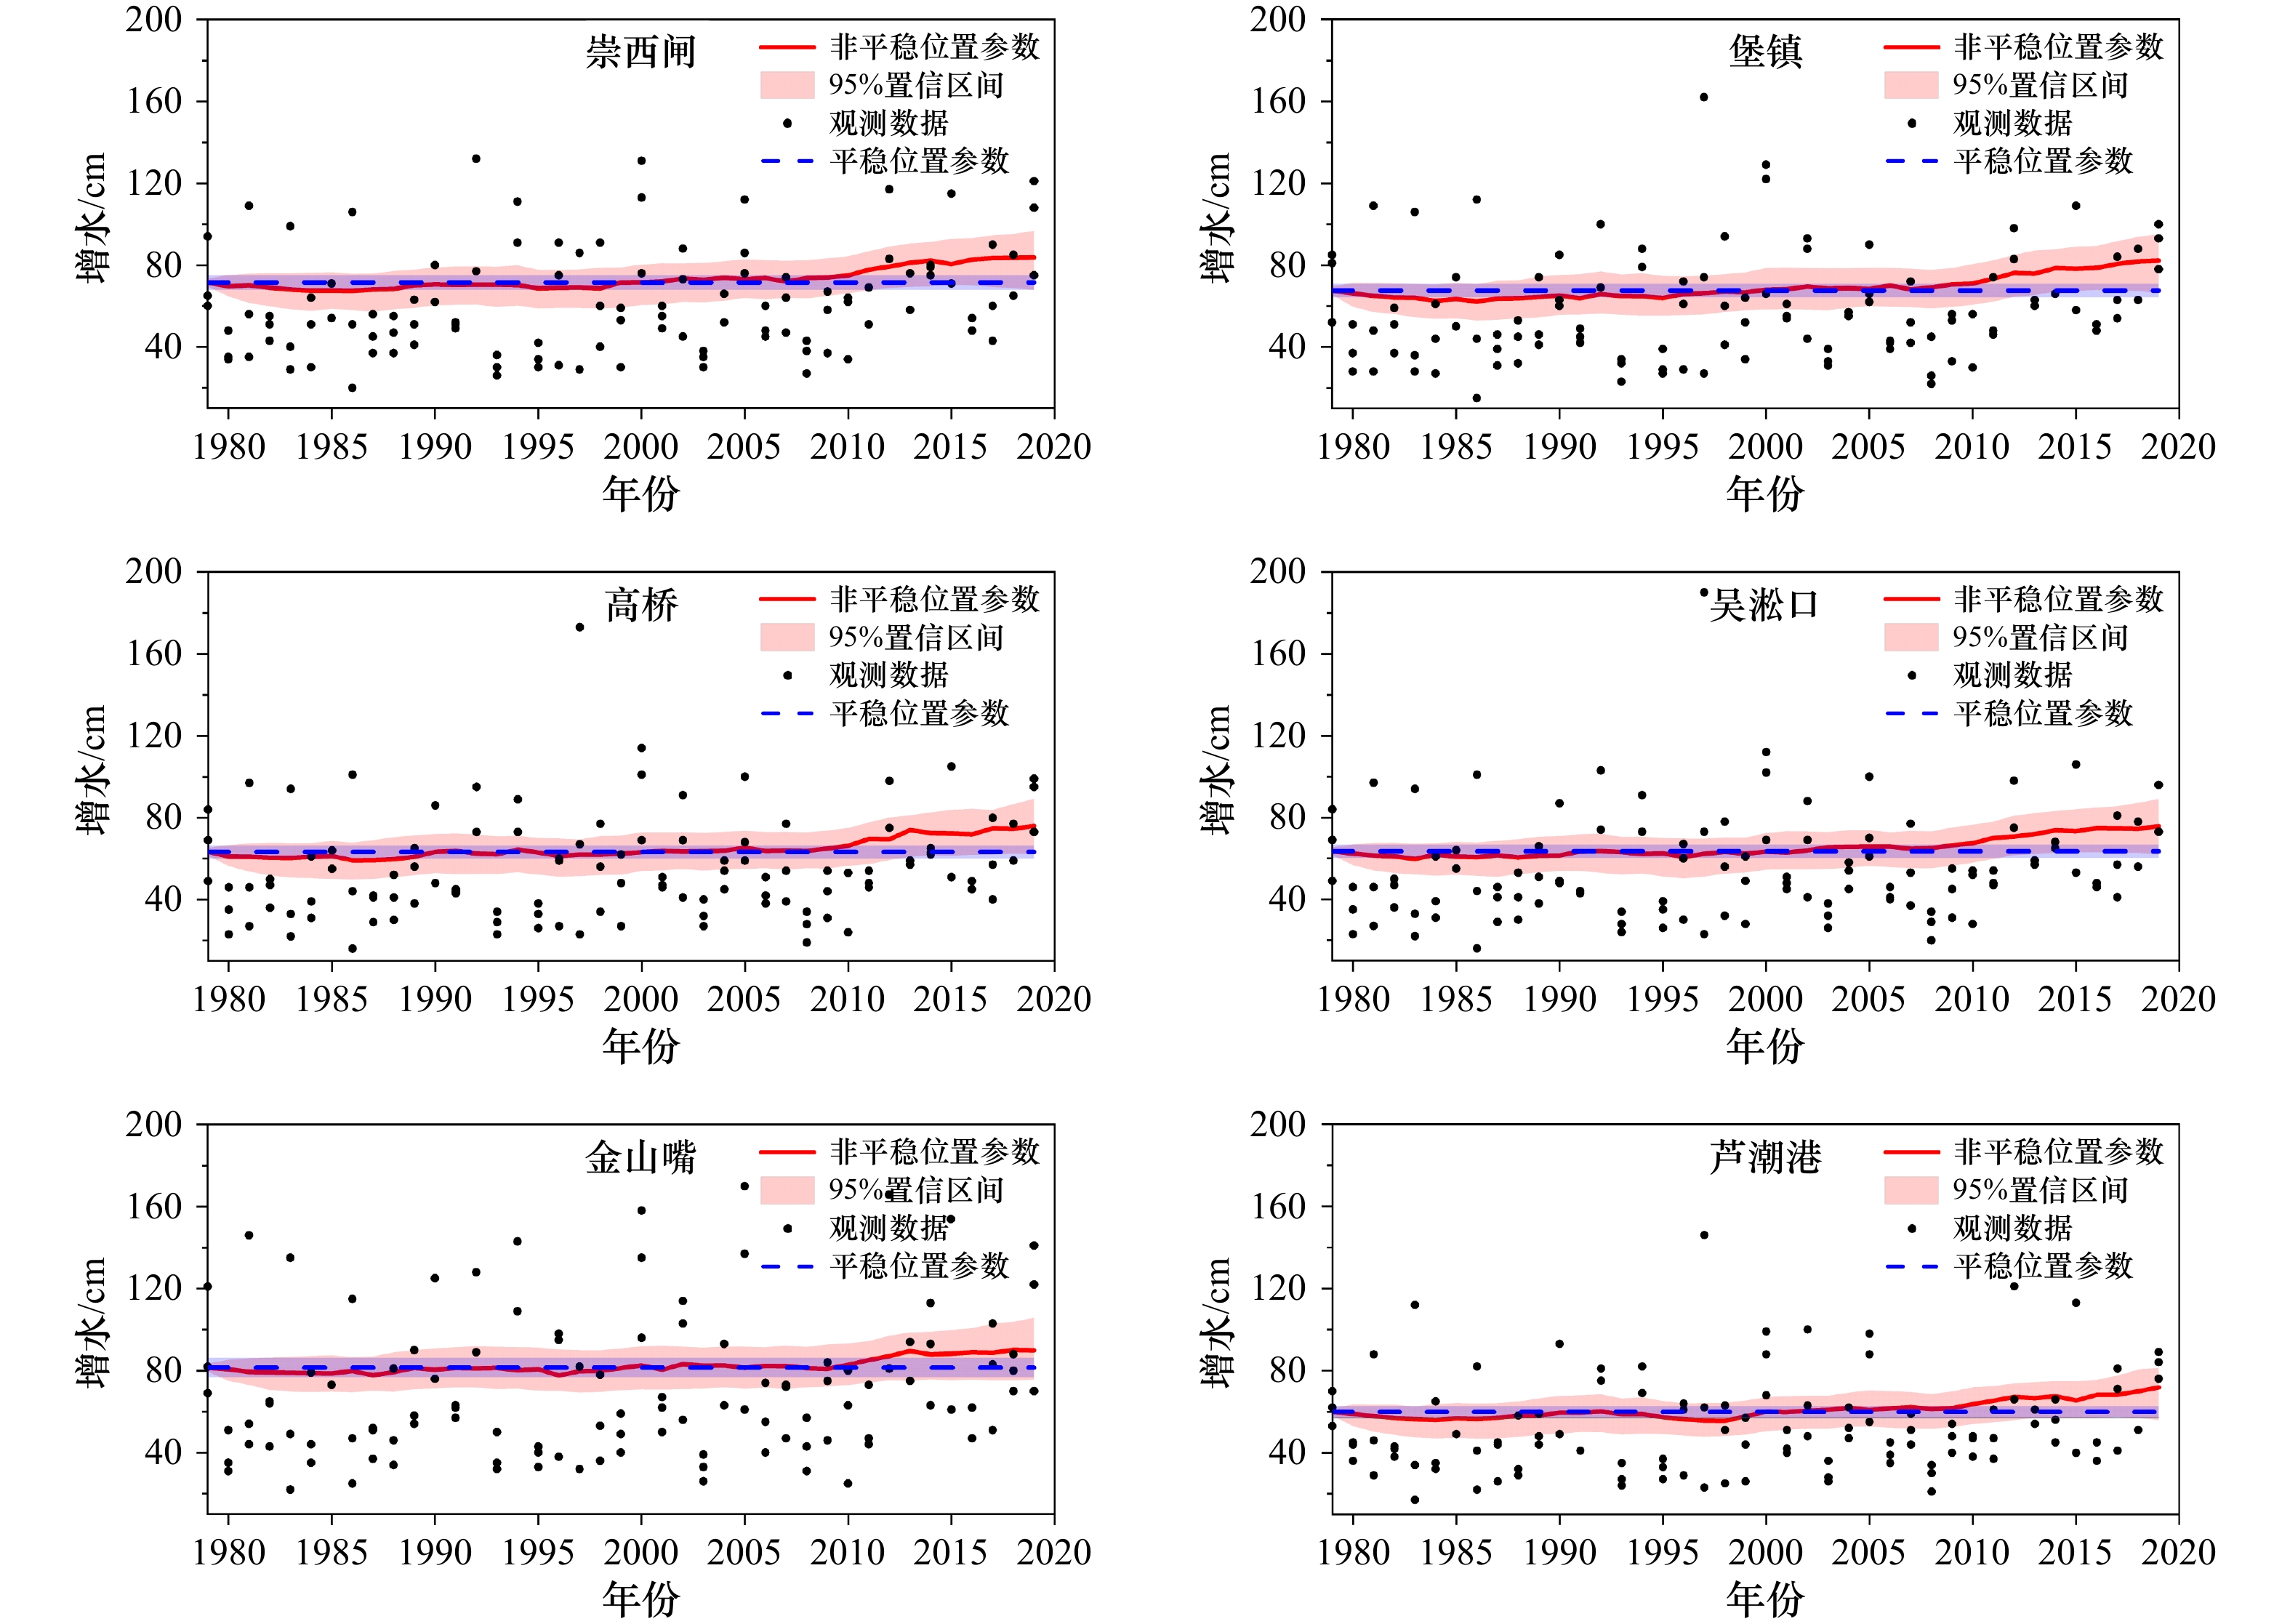
图 8 非平稳条件下各验潮站处位置参数模拟结果
Fig. 8 Fitting results of location parameters under non-stationary conditions at the tide gauges
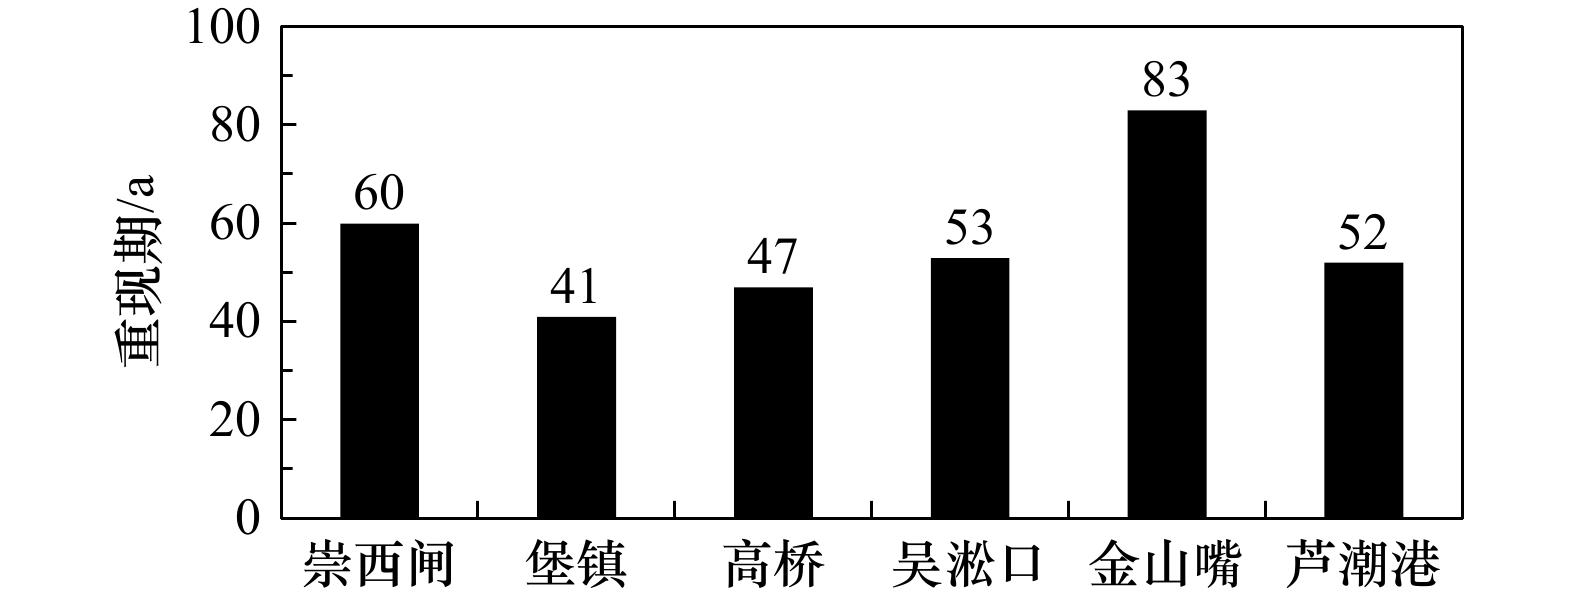
图 9 基于平稳假设的百年一遇增水在考虑非平稳变化下的重现期
Fig. 9 The reoccurrence level of 100-year return levels based on the stationary assumption when considering non-stationary features

图 10 热带气旋路径分类示意图
1号路径:热带气旋北上到长江口附近海域再转向外海;2号路径:热带气旋北向直行经过长江口外海;3号路径:热带气旋在长江口以南登陆;4号路径:热带气旋在长江口以南登陆并北上经过长江口西侧;5号路径:热带气旋直接登陆长江口;6号路径:热带气旋在长江口以北登陆;7号路径:热带气旋在长江口以南登陆并转向穿过长江口
Fig. 10 Schematic diagram of tropical cyclone track categories
Track type 1: tropical cyclones track northwards until reaching near the Changjiang River Estuary and continue moving offshore; track type 2: tropical cyclones track northwards in the offshore of the Changjiang River Estuary; track type 3: tropical cyclones make landfall to the south of the Changjiang River Estuary; track type 4: tropical cyclones make landfall to the south of the Changjiang River Estuary and continue moving northwards to the west of the Changjiang River Estuary; track type 5: tropical cyclones make landfall at the Changjiang River Estuary; track type 6: tropical cyclones make landfall to the north of the Changjiang River Estuary; track type 7: tropical cyclones make landfall to the south of the Changjiang River Estuary and continue moving northward to the Changjiang River Estuary
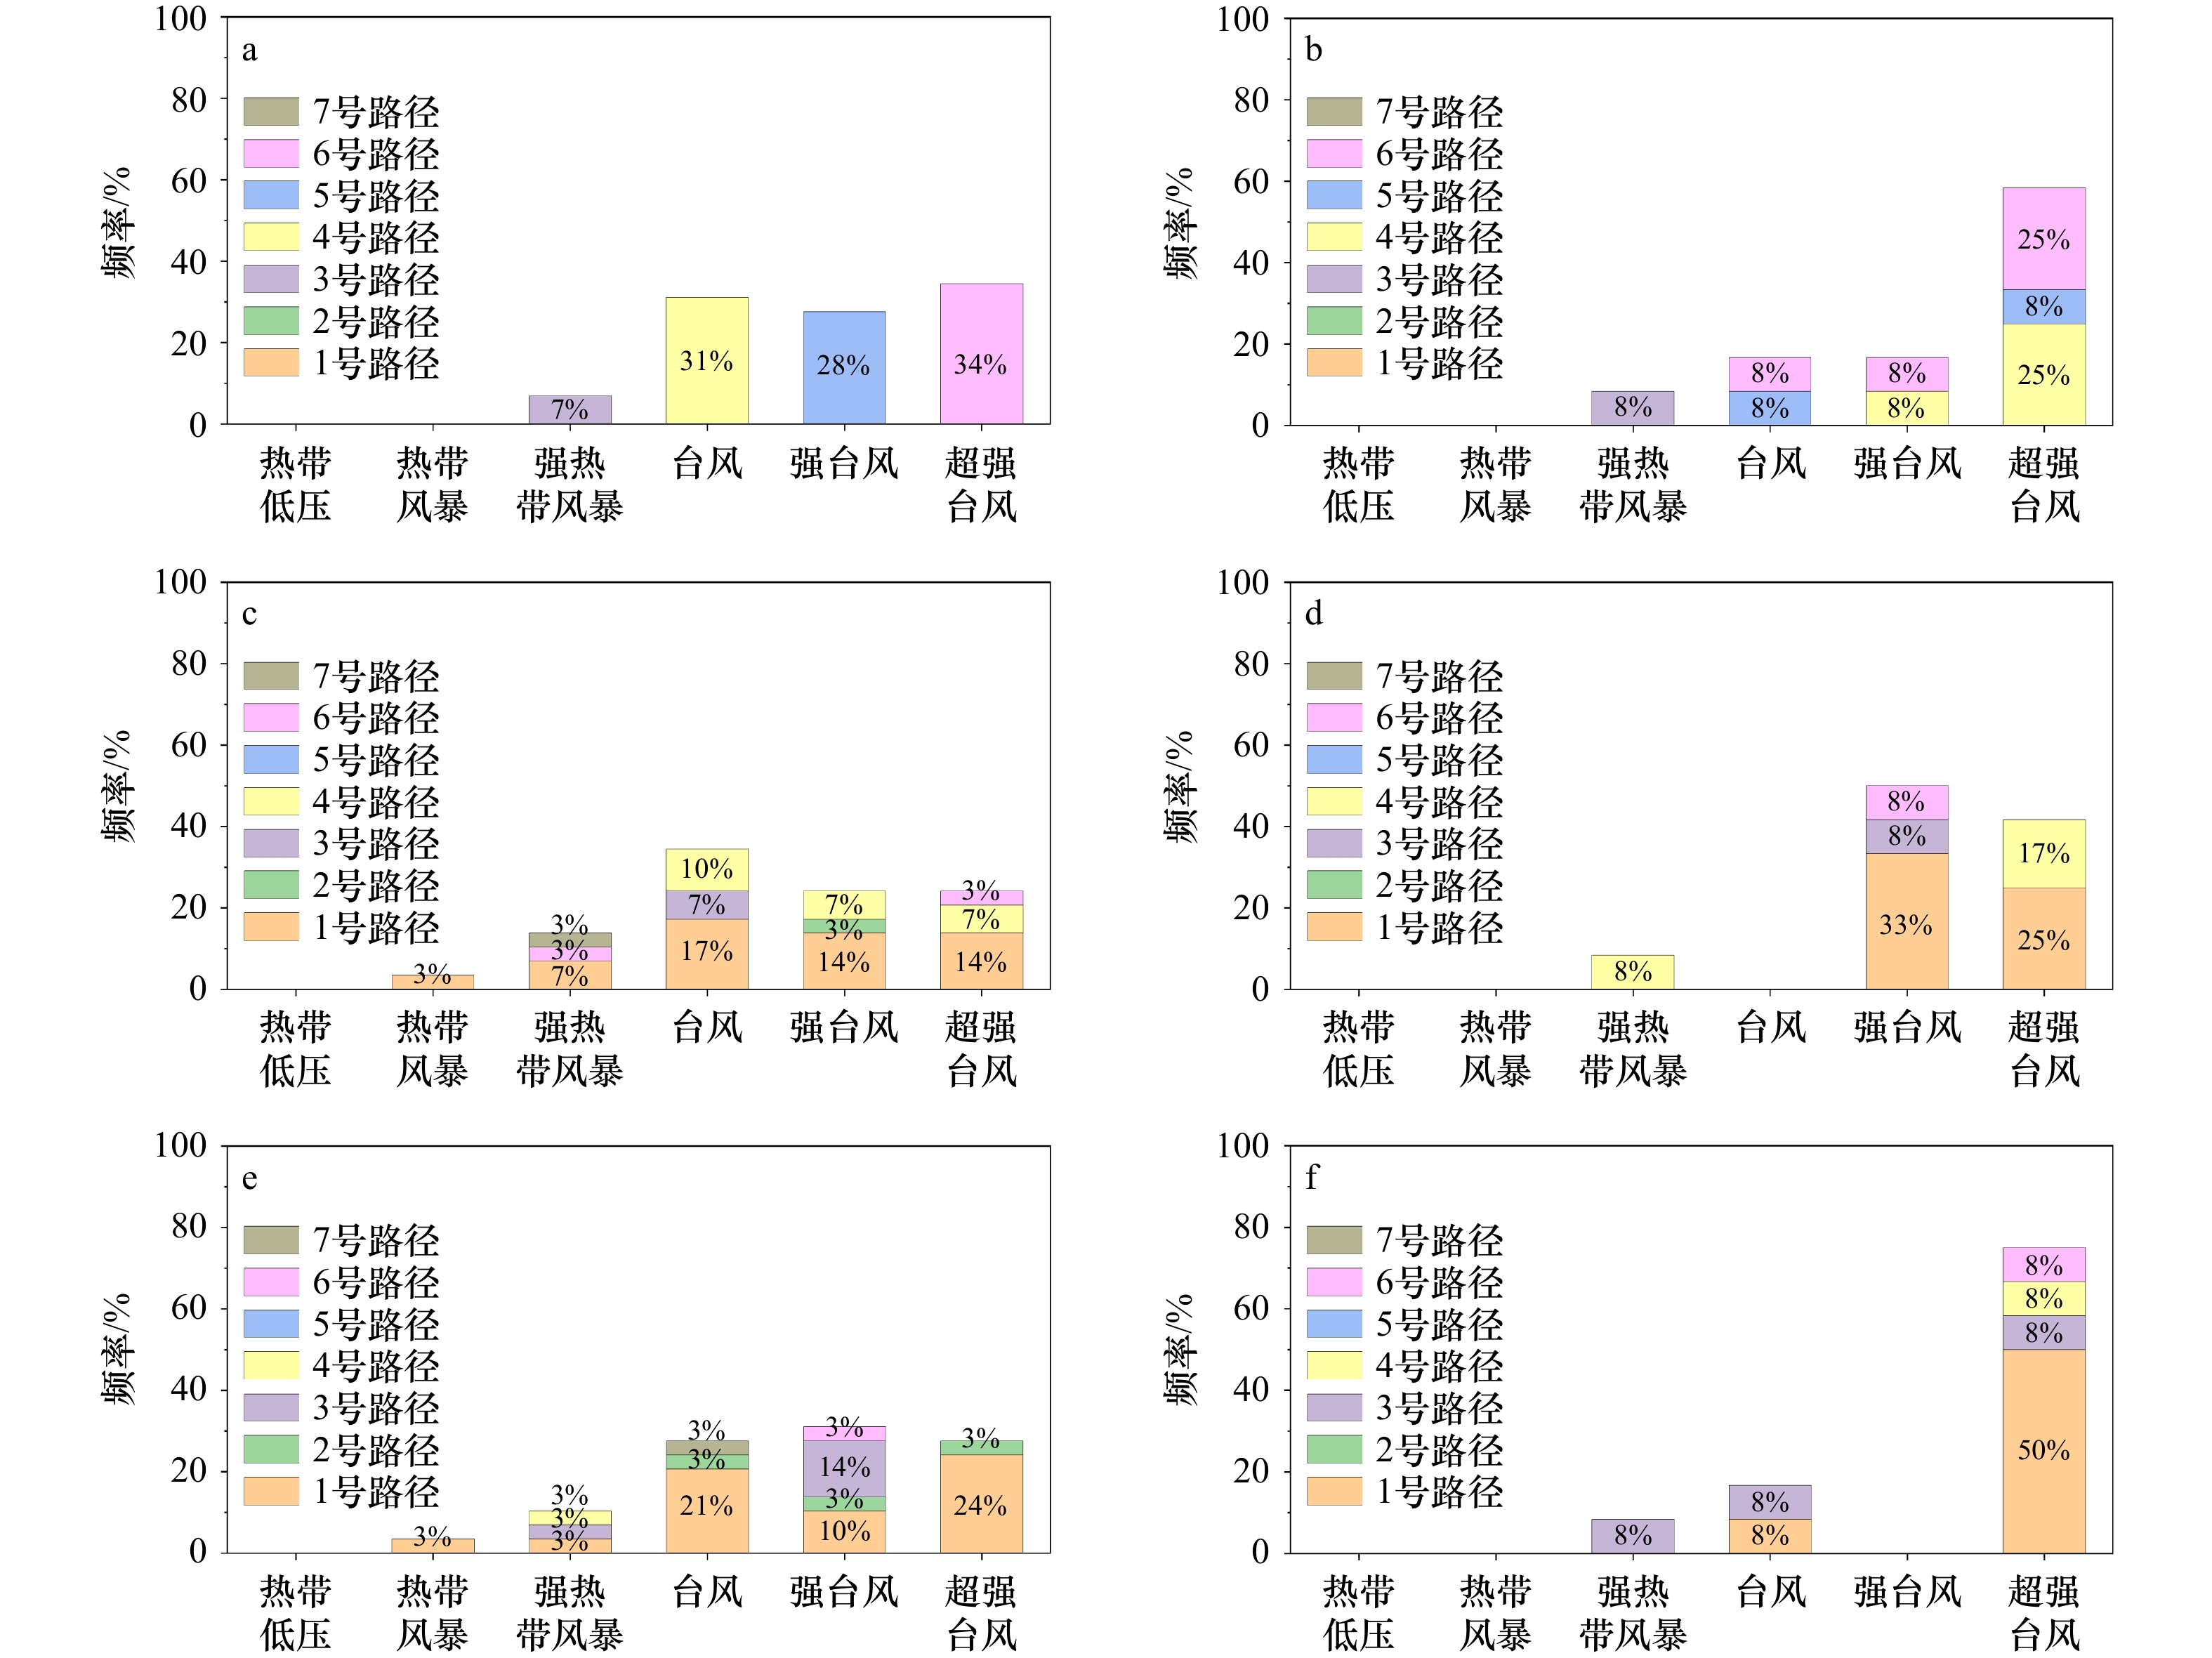
图 11 崇西闸年前三大值增水所对应的热带气旋强度和路径频率分布
a,b. 年第一大值;c,d. 年第二大值;e,f. 年第三大值;a,c,e. 2008年前;b,d,f. 2008年后
Fig. 11 The combined probability of tropical cyclone intensity and path corresponding to the annual three-largest storm surges at Chongxizha tide gauge
a, b. the annual largest storm surge; c, d. the annual second-largest storm surge;e, f. the annual third-largest storm surge;a, c, e. before the year 2008;b, d, f. after the year 2008
表 1 年极端增水样本数r取值为1、2和3情况下长江口各验潮站处增水的平稳估计结果
Tab. 1 Estimated parameters of the GEV distribution for the annual maxima storm surge under stationary assumption when r= 1, 2, 3, respectively
验潮站 r取值 位置参数 ± 标准误差/cm 尺度参数 ± 标准误差/cm 形状参数 ± 标准误差/cm 崇西闸 1 65.9 ± 4.1 23.0 ± 3.1 0.1 ± 0.1 2 70.5 ± 3.6 23.7 ± 2.4 0.1 ± 0.1 3 71.5 ± 3.6 25.9 ± 2.2 0.0 ± 0.1 堡镇 1 62.9 ± 3.9 21.4 ± 2.9 0.0 ± 0.1 2 66.7 ± 3.4 22.2 ± 2.1 0.0 ± 0.1 3 67.5 ± 3.3 23.6 ± 1.8 −0.1 ± 0.1 高桥 1 58.4 ± 3.6 19.7 ± 2.7 0.1 ± 0.1 2 61.9 ± 3.0 20.1 ± 2.0 0.1 ± 0.1 3 63.3 ± 3.2 23.0 ± 1.8 −0.1 ± 0.1 吴淞口 1 58.4 ± 3.6 20.0 ± 2.8 0.1 ± 0.1 2 62.2 ± 3.1 20.6 ± 2.1 0.1 ± 0.1 3 63.6 ± 3.3 23.5 ± 1.9 0.0 ± 0.1 金山嘴 1 77.7 ± 5.5 30.0 ± 4.3 0.1 ± 0.1 2 82.2 ± 5.0 32.1 ± 3.4 0.1 ± 0.1 3 81.5 ± 4.7 33.7 ± 3.2 0.1 ± 0.1 芦潮港 1 54.8 ± 3.4 18.0 ± 2.7 0.1 ± 0.2 2 58.3 ± 2.9 19.1 ± 2.0 0.1 ± 0.1 3 59.9 ± 2.9 20.9 ± 1.7 0.0 ± 0.1  下载: 导出CSV
表 2 各验潮站处非平稳位置参数M-K检验结果
Tab. 2 Results of M-K test of non-stationary location parameters at the tide gauges
验潮站 p值 z值 突变年份 崇西闸 9.25 × 10⁻¹² 6.8 2008 堡镇 1.61 × 10⁻¹² 7.1 2007 高桥 1.72 × 10⁻¹¹ 6.7 2006 吴淞口 1.26 × 10⁻¹¹ 6.8 2007 金山嘴 1.41 × 10⁻⁸ 5.7 2009 芦潮港 6.99 × 10⁻¹⁰ 6.2 2009
下载: 导出CSV
表 3 长江口各验潮站处百年一遇风暴增水比较
Tab. 3 Comparison of storm surge levels with 100-year return period at the tide gauges
验潮站 崇西闸 堡镇 高桥 吴淞口 金山嘴 芦潮港 极值I型/cm 186 159 155 163 256 152 平稳估计/cm 187 156 153 162 260 149 非平稳估计/cm 200 170 166 175 268 161 非平稳和平稳估计差值/cm 12 15 13 12 8 12
下载: 导出CSV
-
[1] Mawdsley R J, Haigh I D. Spatial and temporal variability and long-term trends in skew surges globally[J]. Frontiers in Marine Science, 2016, 3: 29. [2] Wood M, Haigh I D, Le Quanquan, et al. Climate-induced storminess forces major increases in future storm surge hazard in the South China Sea region[J]. Natural Hazards and Earth System Sciences Discussions, 2023, 23(7): 2475−2504. [3] IPCC. Climate change 2021: the physical science basis. Contribution of Working Group I to the sixth assessment report of the intergovernmental panel on climate change[R]. Cambridge: Cambridge University Press, 2021. [4] Marcos M, Calafat F M, Berihuete Á, et al. Long-term variations in global sea level extremes[J]. Journal of Geophysical Research: Oceans, 2015, 120(12): 8115−8134. doi: 10.1002/2015JC011173 [5] Muis S, Verlaan M, Winsemius H C, et al. A global reanalysis of storm surges and extreme sea levels[J]. Nature Communications, 2016, 7(1): 11969. doi: 10.1038/ncomms11969 [6] Muis S, Verlaan M, Nicholls R J, et al. A comparison of two global datasets of extreme sea levels and resulting flood exposure[J]. Earth’s Future, 2017, 5(4): 379−392. doi: 10.1002/2016EF000430 [7] Merrifield M A, Genz A S, Kontoes C P, et al. Annual maximum water levels from tide gauges: contributing factors and geographic patterns[J]. Journal of Geophysical Research: Oceans, 2013, 118(5): 2535−2546. doi: 10.1002/jgrc.20173 [8] Pugh D, Woodworth P. Sea-Level Science: Understanding Tides, Surges, Tsunamis and Mean Sea-Level Changes[M]. Cambridge: Cambridge University Press, 2014. [9] Woodworth P L, Blackman D L. Evidence for systematic changes in extreme high waters since the mid-1970s[J]. Journal of Climate, 2004, 17(6): 1190−1197. doi: 10.1175/1520-0442(2004)017<1190:EFSCIE>2.0.CO;2 [10] Menéndez M, Woodworth P L. Changes in extreme high water levels based on a quasi-global tide-gauge data set[J]. Journal of Geophysical Research: Oceans, 2010, 115(C10): C10011. [11] Butler A, Heffernan J E, Tawn J A, et al. Extreme value analysis of decadal variations in storm surge elevations[J]. Journal of Marine Systems, 2007, 67(1/2): 189−200. [12] Haigh I, Nicholls R, Wells N. Assessing changes in extreme sea levels: application to the English Channel, 1900−2006[J]. Continental Shelf Research, 2010, 30(9): 1042−1055. doi: 10.1016/j.csr.2010.02.002 [13] Haigh I D, Wadey M P, Wahl T, et al. Spatial and temporal analysis of extreme sea level and storm surge events around the coastline of the UK[J]. Scientific Data, 2016, 3(1): 160107. doi: 10.1038/sdata.2016.107 [14] Marcos M, Tsimplis M N, Shaw A G P. Sea level extremes in southern Europe[J]. Journal of Geophysical Research: Oceans, 2009, 114(C1): C01007. [15] Dangendorf S, Mudersbach C, Wahl T, et al. Characteristics of intra-, inter-annual and decadal sea-level variability and the role of meteorological forcing: the long record of Cuxhaven[J]. Ocean Dynamics, 2013, 63(2/3): 209−224. [16] Mudersbach C, Wahl T, Haigh I D, et al. Trends in high sea levels of German North Sea gauges compared to regional mean sea level changes[J]. Continental Shelf Research, 2013, 65: 111−120. doi: 10.1016/j.csr.2013.06.016 [17] Cid A, Menéndez M, Castanedo S, et al. Long-term changes in the frequency, intensity and duration of extreme storm surge events in southern Europe[J]. Climate Dynamics, 2016, 46(5/6): 1503−1516. [18] Marcos M, Woodworth P L. Spatiotemporal changes in extreme sea levels along the coasts of the North Atlantic and the Gulf of Mexico[J]. Journal of Geophysical Research: Oceans, 2017, 122(9): 7031−7048. doi: 10.1002/2017JC013065 [19] 侯京明, 于福江, 原野, 等. 影响我国的重大台风风暴潮时空分布[J]. 海洋通报, 2011, 30(5): 535−539.Hou Jingming, Yu Fujiang, Yuan Ye, et al. Spatial and temporal distribution of red tropical storm surge disasters in China[J]. Marine Science Bulletin, 2011, 30(5): 535−539. [20] Feng Xiangbo, Tsimplis M N. Sea level extremes at the coasts of China[J]. Journal of Geophysical Research: Oceans, 2014, 119(3): 1593−1608. doi: 10.1002/2013JC009607 [21] Feng Jianlong, Von Storch H, Jiang Wensheng, et al. Assessing changes in extreme sea levels along the coast of China[J]. Journal of Geophysical Research: Oceans, 2015, 120(12): 8039−8051. doi: 10.1002/2015JC011336 [22] Oey L Y, Chou S. Evidence of rising and poleward shift of storm surge in western North Pacific in recent decades[J]. Journal of Geophysical Research: Oceans, 2016, 121(7): 5181−5192. doi: 10.1002/2016JC011777 [23] Feng Jianlong, Li Delei, Li Yan, et al. Storm surge variation along the coast of the Bohai Sea[J]. Scientific Reports, 2018, 8(1): 11309. doi: 10.1038/s41598-018-29712-z [24] Zhang Wei, Yan Yixin, Zheng Jinhai, et al. Temporal and spatial variability of annual extreme water level in the Pearl River Delta region, China[J]. Global and Planetary Change, 2009, 69(1/2): 35−47. [25] 董剑希, 李涛, 侯京明. 福建省风暴潮时空分布特征分析[J]. 海洋通报, 2016, 35(3): 331−339.Dong Jianxi, Li Tao, Hou Jingming. Analysis on the spatial and temporal distribution characteristics of the storm surge of Fujian Province[J]. Marine Science Bulletin, 2016, 35(3): 331−339. [26] 袁方超, 吴向荣, 卢君峰. 福建中南部沿海风暴潮统计特征分析[J]. 海洋预报, 2018, 35(3): 68−75.Yuan Fangchao, Wu Xiangrong, Lu Junfeng. Statistical characteristics of storm surges in central and southern Fujian coast[J]. Marine Forecasts, 2018, 35(3): 68−75. [27] Feng Xingru, Li Mingjie, Yin Baoshu, et al. Study of storm surge trends in typhoon-prone coastal areas based on observations and surge-wave coupled simulations[J]. International Journal of Applied Earth Observation and Geoinformation, 2018, 68: 272−278. doi: 10.1016/j.jag.2018.01.006 [28] 张海燕. 南海区台风风暴潮时空分布特征[J]. 海洋预报, 2019, 36(6): 1−8.Zhang Haiyan. Spatio-temporal distribution of typhoon storm surge along the South China Sea coast[J]. Marine Forecasts, 2019, 36(6): 1−8. [29] Feng Jianlong, Jiang Wensheng. Extreme water level analysis at three stations on the coast of the Northwestern Pacific Ocean[J]. Ocean Dynamics, 2015, 65(11): 1383−1397. doi: 10.1007/s10236-015-0881-3 [30] 陈剑飞, 苏志, 罗红磊. 2001−2018年广西沿海风暴潮特征分析[J]. 气象研究与应用, 2020, 41(2): 21−24.Chen Jianfei, Su Zhi, Luo Honglei. Characteristics of storm surge in Guangxi coastal area from 2001 to 2018[J]. Journal of Meteorological Research and Application, 2020, 41(2): 21−24. [31] Leadbetter M R, Lindgren G, Rootzén H. Extremes and Related Properties of Random Sequences and Processes[M]. New York: Springer, 2012. [32] Hüsler J. Extreme values of non-stationary random sequences[J]. Journal of Applied Probability, 1986, 23(4): 937−950. doi: 10.2307/3214467 [33] Dixon M J, Tawn J A. The effect of non-stationarity on extreme sea-level estimation[J]. Journal of the Royal Statistical Society Series C:Applied Statistics, 1999, 48(2): 135−151. doi: 10.1111/1467-9876.00145 [34] Calafat F M, Marcos M. Probabilistic reanalysis of storm surge extremes in Europe[J]. Proceedings of the National Academy of Sciences of the United States of America, 2020, 117(4): 1877−1883. doi: 10.1073/pnas.1913049117 [35] 鲁帆, 肖伟华, 严登华, 等. 非平稳时间序列极值统计模型及其在气候−水文变化研究中的应用综述[J]. 水利学报, 2017, 48(4): 379−389.Lu Fan, Xiao Weihua, Yan Denghua, et al. Progresses on statistical modeling of non-stationary extreme sequences and its application in climate and hydrological change[J]. Journal of Hydraulic Engineering, 2017, 48(4): 379−389. [36] Serinaldi F, Kilsby C G. Stationarity is undead: uncertainty dominates the distribution of extremes[J]. Advances in Water Resources, 2015, 77: 17−36. doi: 10.1016/j.advwatres.2014.12.013 [37] 陈升, 甘敏, 孙丽, 等. 上海沿海风暴潮历史特征分析[J]. 海洋学研究, 2021, 39(4): 101−108.Chen Sheng, Gan Min, Sun Li, et al. Historical characteristics of the storm surges along Shanghai coast[J]. Journal of Marine Sciences, 2021, 39(4): 101−108. [38] Luettich R A Jr, Westerink J J, Scheffner N W. ADCIRC: an advanced three-dimensional circulation model for shelves coasts and estuaries, Report 1: theory and methodology of ADCIRC-2DDI and ADCIRC-3DL[R]. Vicksburg: Army Engineers Waterways Experiment Station, 1992. [39] Westerink J J, Luettich R A Jr, Blain C A, et al. ADCIRC: an advanced three-dimensional circulation model for shelves, coasts, and estuaries. Report 2. User’s manual for ADCIRC-2DDI[R]. Vicksburg: Army Engineer Waterways Experiment Station, 1994. [40] Pan Yi, Chen Yongping, Li Jiangxia, et al. Improvement of wind field hindcasts for tropical cyclones[J]. Water Science and Engineering, 2016, 9(1): 58−66. doi: 10.1016/j.wse.2016.02.002 [41] Xiong Jie, Yu Fujiang, Fu Cifu, et al. Evaluation and improvement of the ERA5 wind field in typhoon storm surge simulations[J]. Applied Ocean Research, 2022, 118: 103000. doi: 10.1016/j.apor.2021.103000 [42] Hersbach H, Bell B, Berrisford P, et al. The ERA5 global reanalysis[J]. Quarterly Journal of the Royal Meteorological Society, 2020, 146(730): 1999−2049. doi: 10.1002/qj.3803 [43] Jelesnianski C P. A numerical calculation of storm tides induced by a tropical storm impinging on a continental shelf[J]. Monthly Weather Review, 1965, 93(6): 343−358. doi: 10.1175/1520-0493(1993)093<0343:ANCOS>2.3.CO;2 [44] Li Jiangxia, Pan Shunqi, Chen Yongping, et al. Numerical estimation of extreme waves and surges over the northwest Pacific Ocean[J]. Ocean Engineering, 2018, 153: 225−241. doi: 10.1016/j.oceaneng.2018.01.076 [45] Jakobsen F, Madsen H. Comparison and further development of parametric tropical cyclone models for storm surge modelling[J]. Journal of Wind Engineering and Industrial Aerodynamics, 2004, 92(5): 375−391. doi: 10.1016/j.jweia.2004.01.003 [46] Knaff J A, Sampson C R, DeMaria M, et al. Statistical tropical cyclone wind radii prediction using climatology and persistence[J]. Weather and Forecasting, 2007, 22(4): 781−791. doi: 10.1175/WAF1026.1 [47] Ying Ming, Zhang Wei, Yu Hui, et al. An overview of the China meteorological administration tropical cyclone database[J]. Journal of Atmospheric and Oceanic Technology, 2014, 31(2): 287−301. doi: 10.1175/JTECH-D-12-00119.1 [48] Lu Xiaoqin, Yu Hui, Ying Ming, et al. Western North Pacific tropical cyclone database created by the China Meteorological Administration[J]. Advances in Atmospheric Sciences, 2021, 38(4): 690−699. doi: 10.1007/s00376-020-0211-7 [49] Kapoor D C. General bathymetric chart of the oceans (GEBCO)[J]. Marine Geodesy, 1981, 5(1): 73−80. doi: 10.1080/15210608109379408 [50] Egbert G D, Bennett A F, Foreman M G G. TOPEX/POSEIDON tides estimated using a global inverse model[J]. Journal of Geophysical Research: Oceans, 1994, 99(C12): 24821−24852. doi: 10.1029/94JC01894 [51] Méndez F J, Menéndez M, Luceño A, et al. Analyzing monthly extreme sea levels with a time-dependent GEV model[J]. Journal of Atmospheric and Oceanic Technology, 2007, 24(5): 894−911. doi: 10.1175/JTECH2009.1 [52] Mentaschi L, Vousdoukas M, Voukouvalas E, et al. The transformed-stationary approach: a generic and simplified methodology for non-stationary extreme value analysis[J]. Hydrology and Earth System Sciences, 2016, 20(9): 3527−3547. doi: 10.5194/hess-20-3527-2016 [53] Zadeh L, Desoer C. Linear System Theory: the State Space Approach[M]. New York: Courier Dover Publications, 2008. [54] Andrieu C, Doucet A, Holenstein R. Particle Markov chain Monte Carlo methods[J]. Journal of the Royal Statistical Society: Series B (Statistical Methodology), 2010, 72(3): 269−342. doi: 10.1111/j.1467-9868.2009.00736.x [55] Lindsten F, Jordan M I, Schön T B. Particle Gibbs with ancestor sampling[J]. The Journal of Machine Learning Research, 2014, 15(1): 2145−2184. [56] Geweke J, Tanizaki H. Bayesian estimation of state-space models using the Metropolis-Hastings algorithm within Gibbs sampling[J]. Computational Statistics & Data Analysis, 2001, 37(2): 151−170. [57] Knapp K R, Kruk M C, Levinson D H, et al. The international best track archive for climate stewardship (IBTrACS): unifying tropical cyclone data[J]. Bulletin of the American Meteorological Society, 2010, 91(3): 363−376. doi: 10.1175/2009BAMS2755.1 [58] Knapp K R, Diamond H J, Kossin J P, et al. International best track archive for climate stewardship (IBTrACS) project, version 4[DB/OL]. [2022–06–22]. https://doi.org/10.25921/82ty-9e16. [59] 魏凤英. 现代气候统计诊断与预测技术[M]. 2版. 北京: 气象出版社, 2007.Wei Fengying. Modern Technology of Statistics, Diagnosis and Forecast for Climate[M]. 2nd ed. Beijing: China Meteorological Press, 2007. [60] 中华人民共和国交通运输部. JTS 145−2015, 港口与航道水文规范[S]. 北京: 人民交通出版社, 2015.Ministry of Transport of the People’s Republic of China. JTS 145−2015, Code of hydrology for harbour and waterway[S]. Beijing: China Communications Press, 2015. -


计量
- 文章访问数: 707
- HTML全文浏览量: 639
- PDF下载量: 120
- 被引次数: 0
