

Free-dropping acoustic Doppler current profiler observation and data processing
-
摘要: 自由投放式声学多普勒海流剖面(FADCP)观测以“自由落体”方式进行采样,其不依赖于测船钢缆牵引即可对全深度海流进行观测,观测稳定性较下放式声学多普勒海流剖面(LADCP)大幅提升,有效减少了观测值之中的不规则运动。2021年4月与9月在南海西沙海域开展的FADCP观测实验获得了两个断面包含16个站的海流及CTD资料。基于静置期间的真实底流观测,各站全深度的海流剖面采用剪切法获得,潜标附近站位剖面与潜标观测剖面相比,平均流速偏差为3 cm/s。观测断面捕捉到了西沙海域两个时期的气旋涡,其垂直结构比HYCOM模拟更精细,表层流与绝对地转流契合。研究表明,FADCP对测船要求低、数据质量高,其后处理简便且结果良好,但无法对特定水层实施补充观测。
-
关键词:
- 自由投放式声学多普勒海流剖面 /
- LADCP /
- 剪切法
Abstract: The free-dropping acoustic Doppler current profile (FADCP) samples in a “free-fall” manner, which can observe the full depth current without relying on the cable traction of the ship, and its stability is greatly improved compared with lowered acoustic doppler current profiler (LADCP), effectively reducing the irregular motion in the observations. The FADCP observation experiments conducted in April and September 2021 at Xisha waters in the South China Sea obtained current and CTD data from two sections containing 16 stations. Based on the real bottom current observation during the resting period, the full-depth current profiles at each station were obtained by shear method, and the average deviation of the station profile near a mooring compared with the mooring profile was 3 cm/s. The observation section captured the cyclonic eddies of two periods at Xisha waters with more precise vertical structures than the HYCOM simulation, and the surface flows fitted with the absolute geostrophic currents. This research shows that the FADCP has low vessel requirements, high data quality, easy post-processing and good results, but cannot perform supplementary observations for specific water layers.-
Key words:
- FADCP /
- LADCP /
- shear method
-
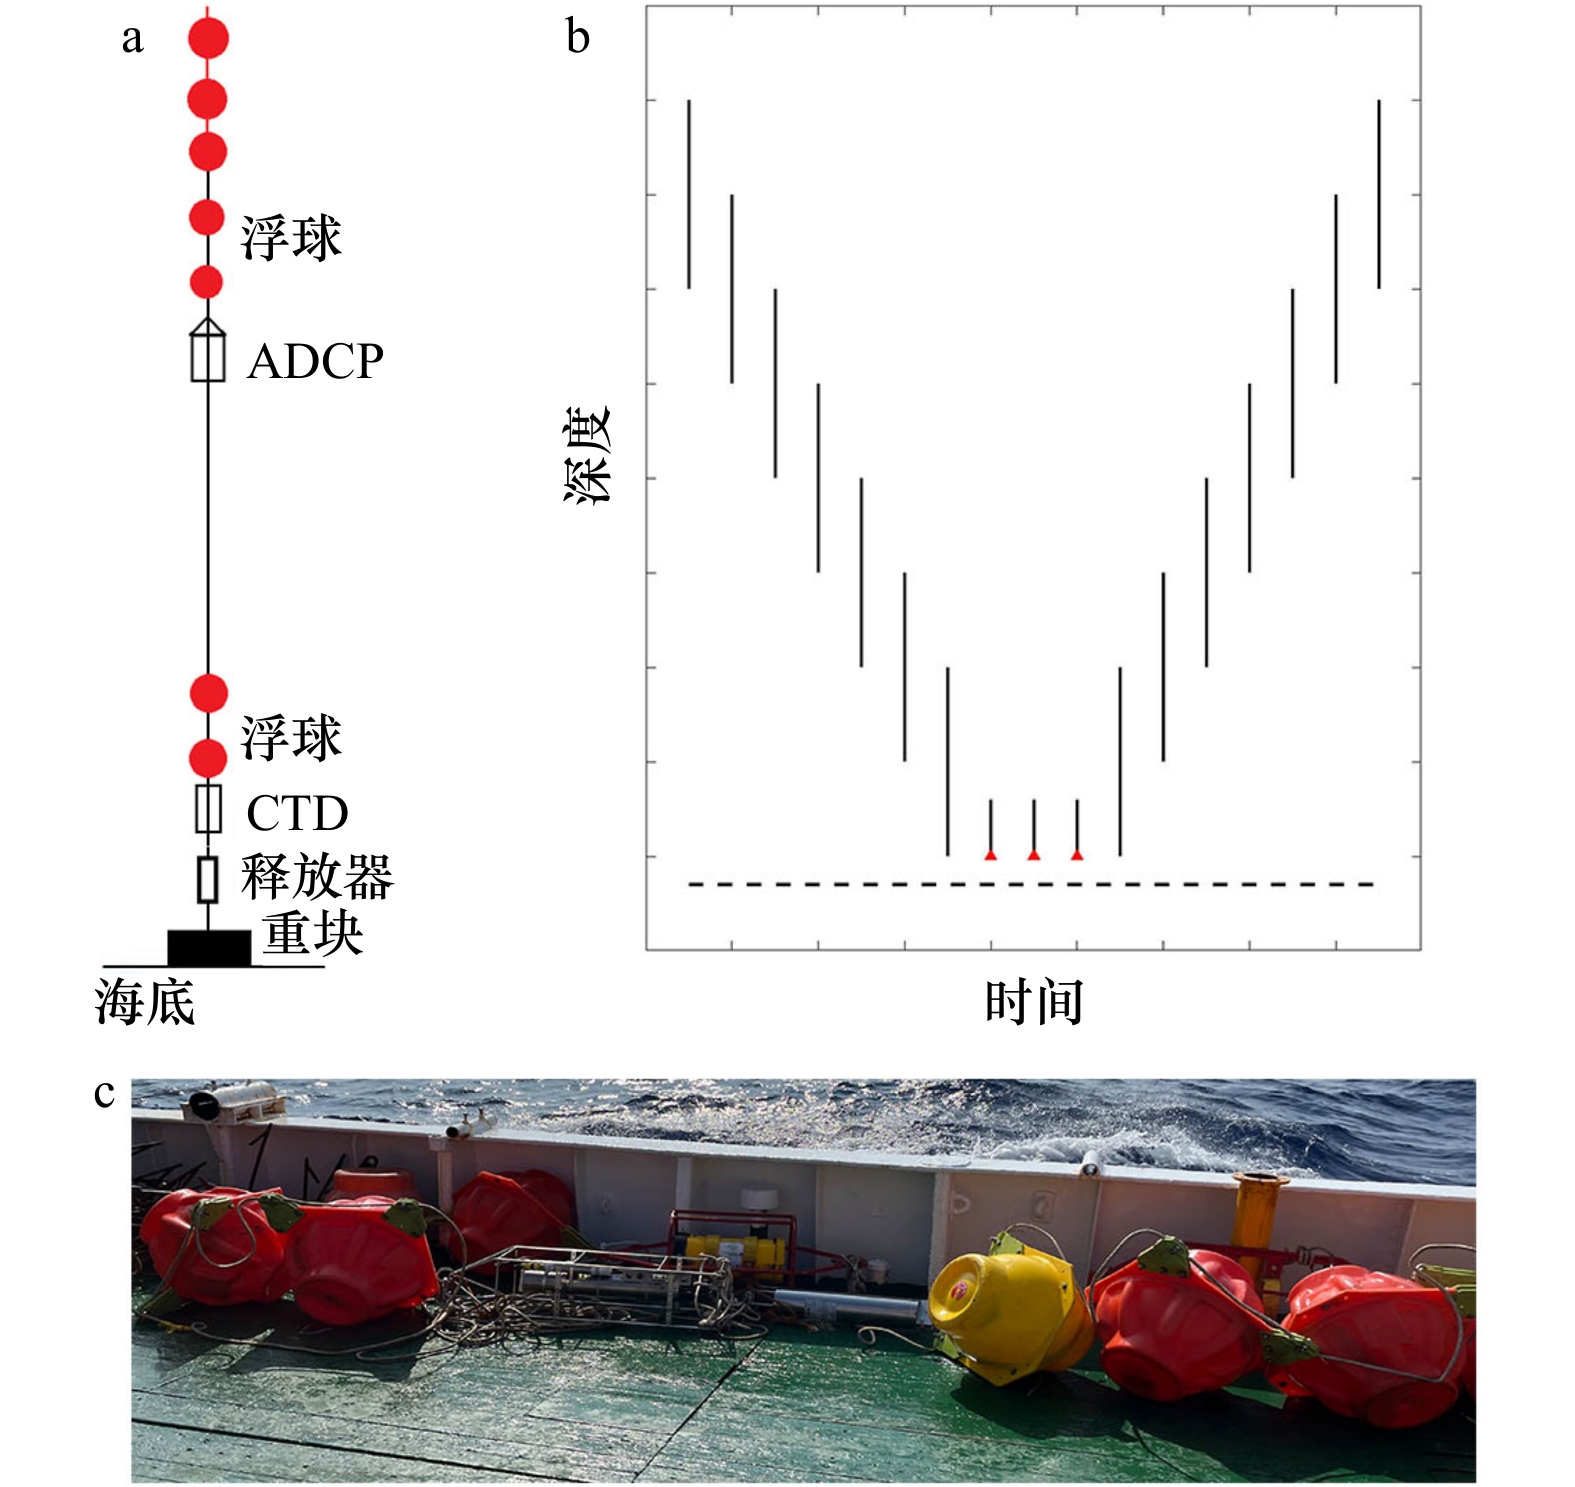
图 1 FADCP仪器链及其资料阵
a.示意图;b.资料阵,红色三角点代表仪器静置阶段;c.实物图
Fig. 1 FADCP instrument chain and data array
a. Schematic diagram; b. data array, the red triangles represent the static stage of the instrument; c. physical diagram
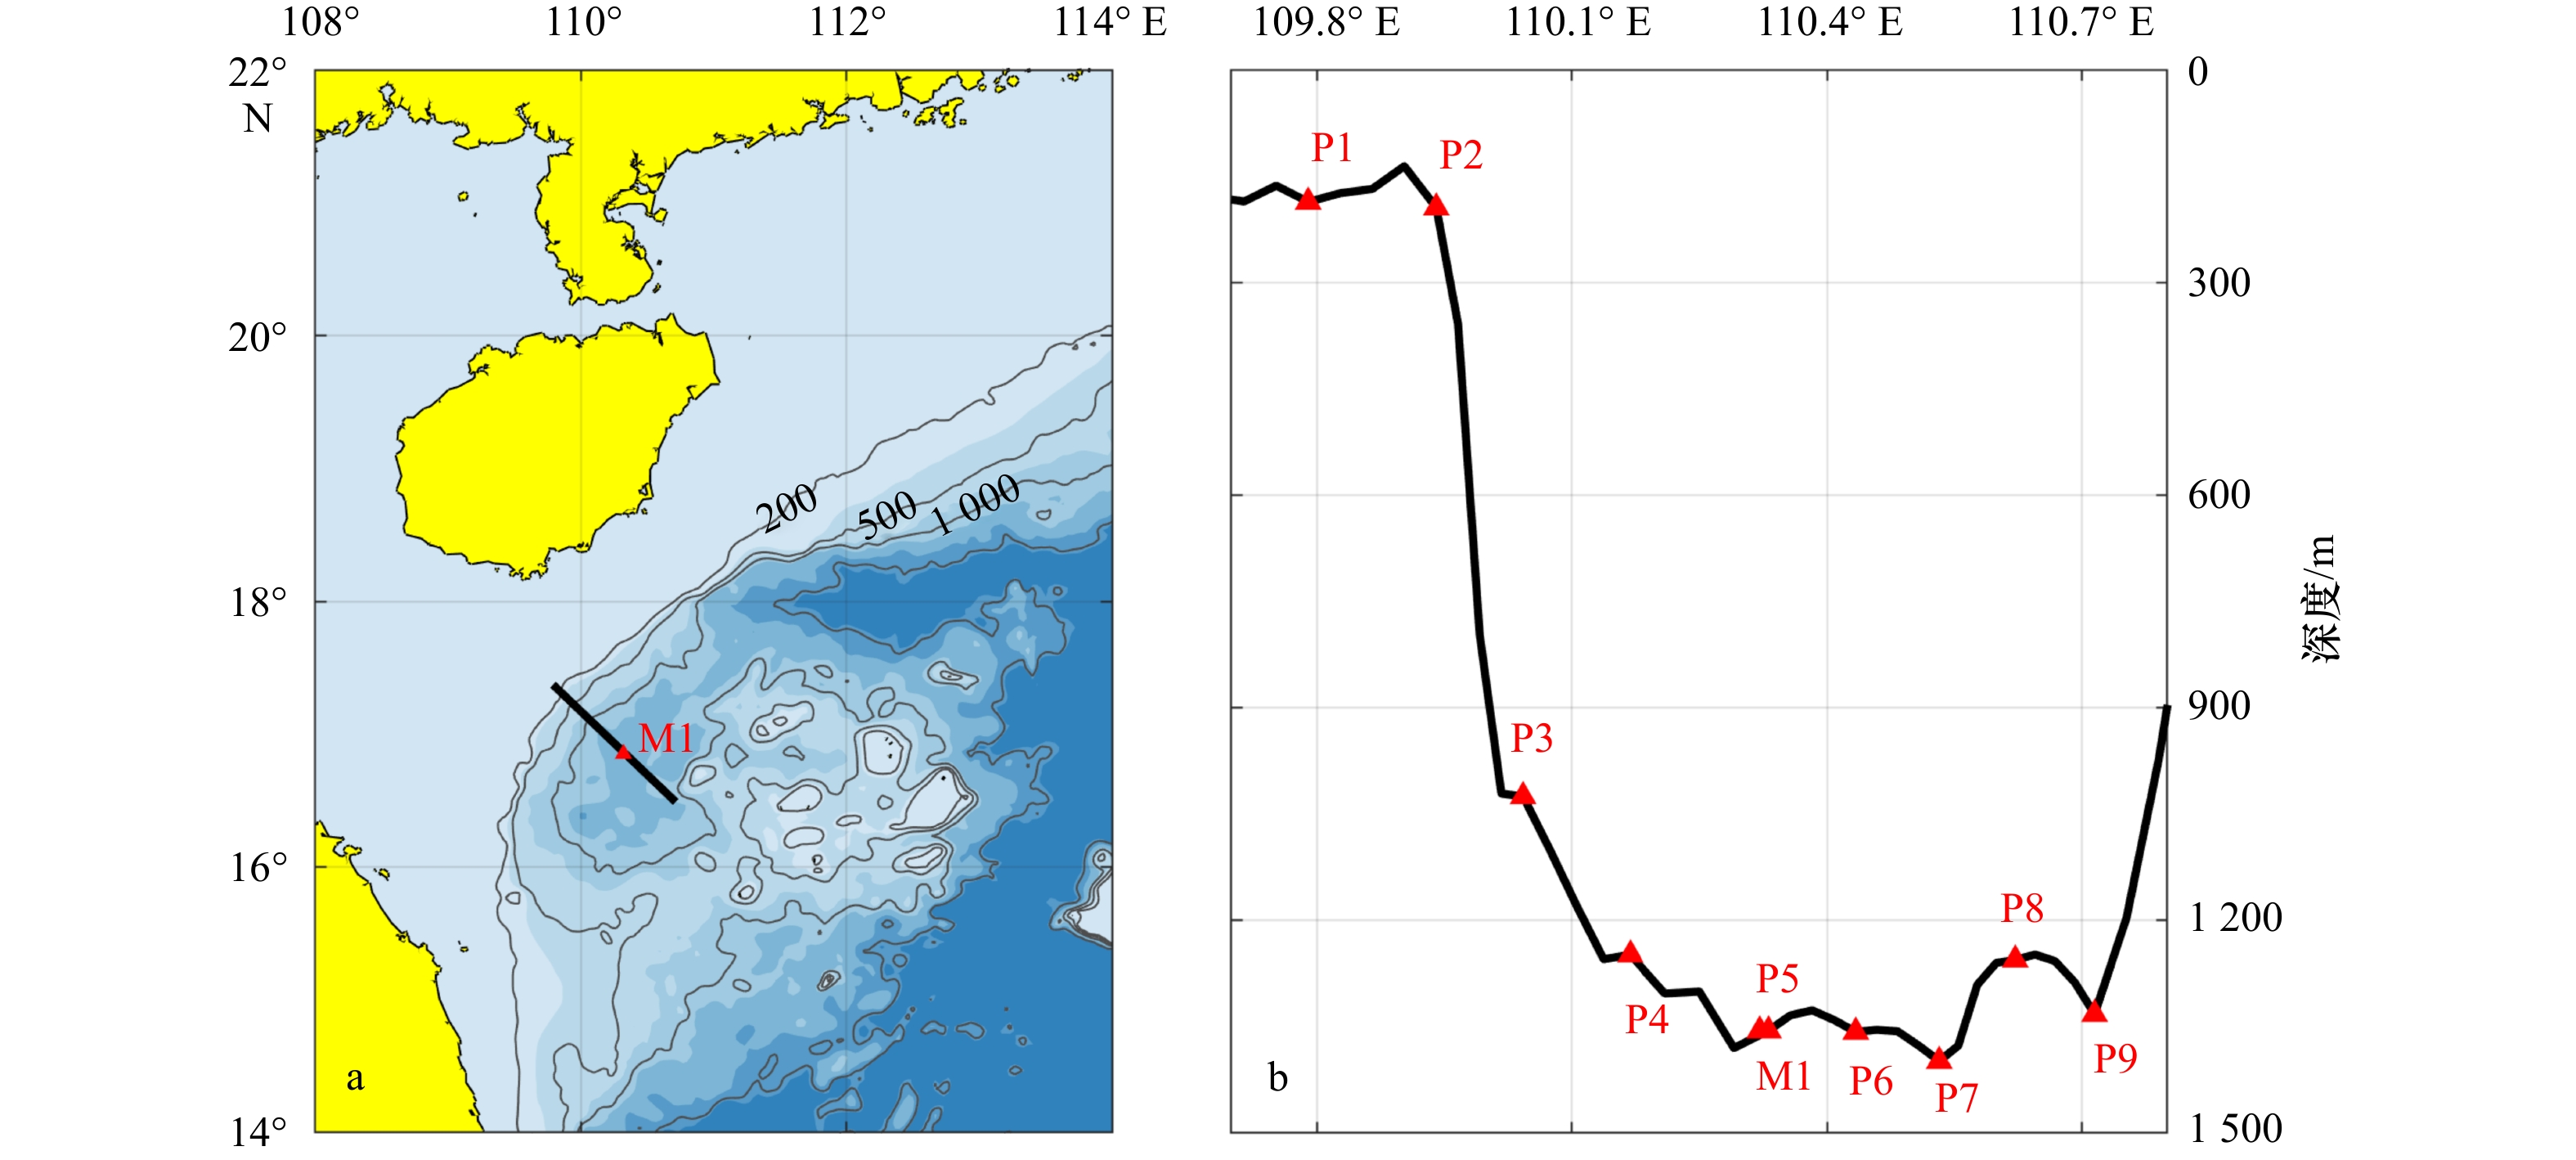
图 2 自由投放式声学多普勒海流剖面观测站位概况
a.观测断面及潜标M1;b.垂向横截面
Fig. 2 Overview of the free-dropping acoustic Doppler current profiler observation stations
a. Observation section and the mooring M1; b. vertical cross-section
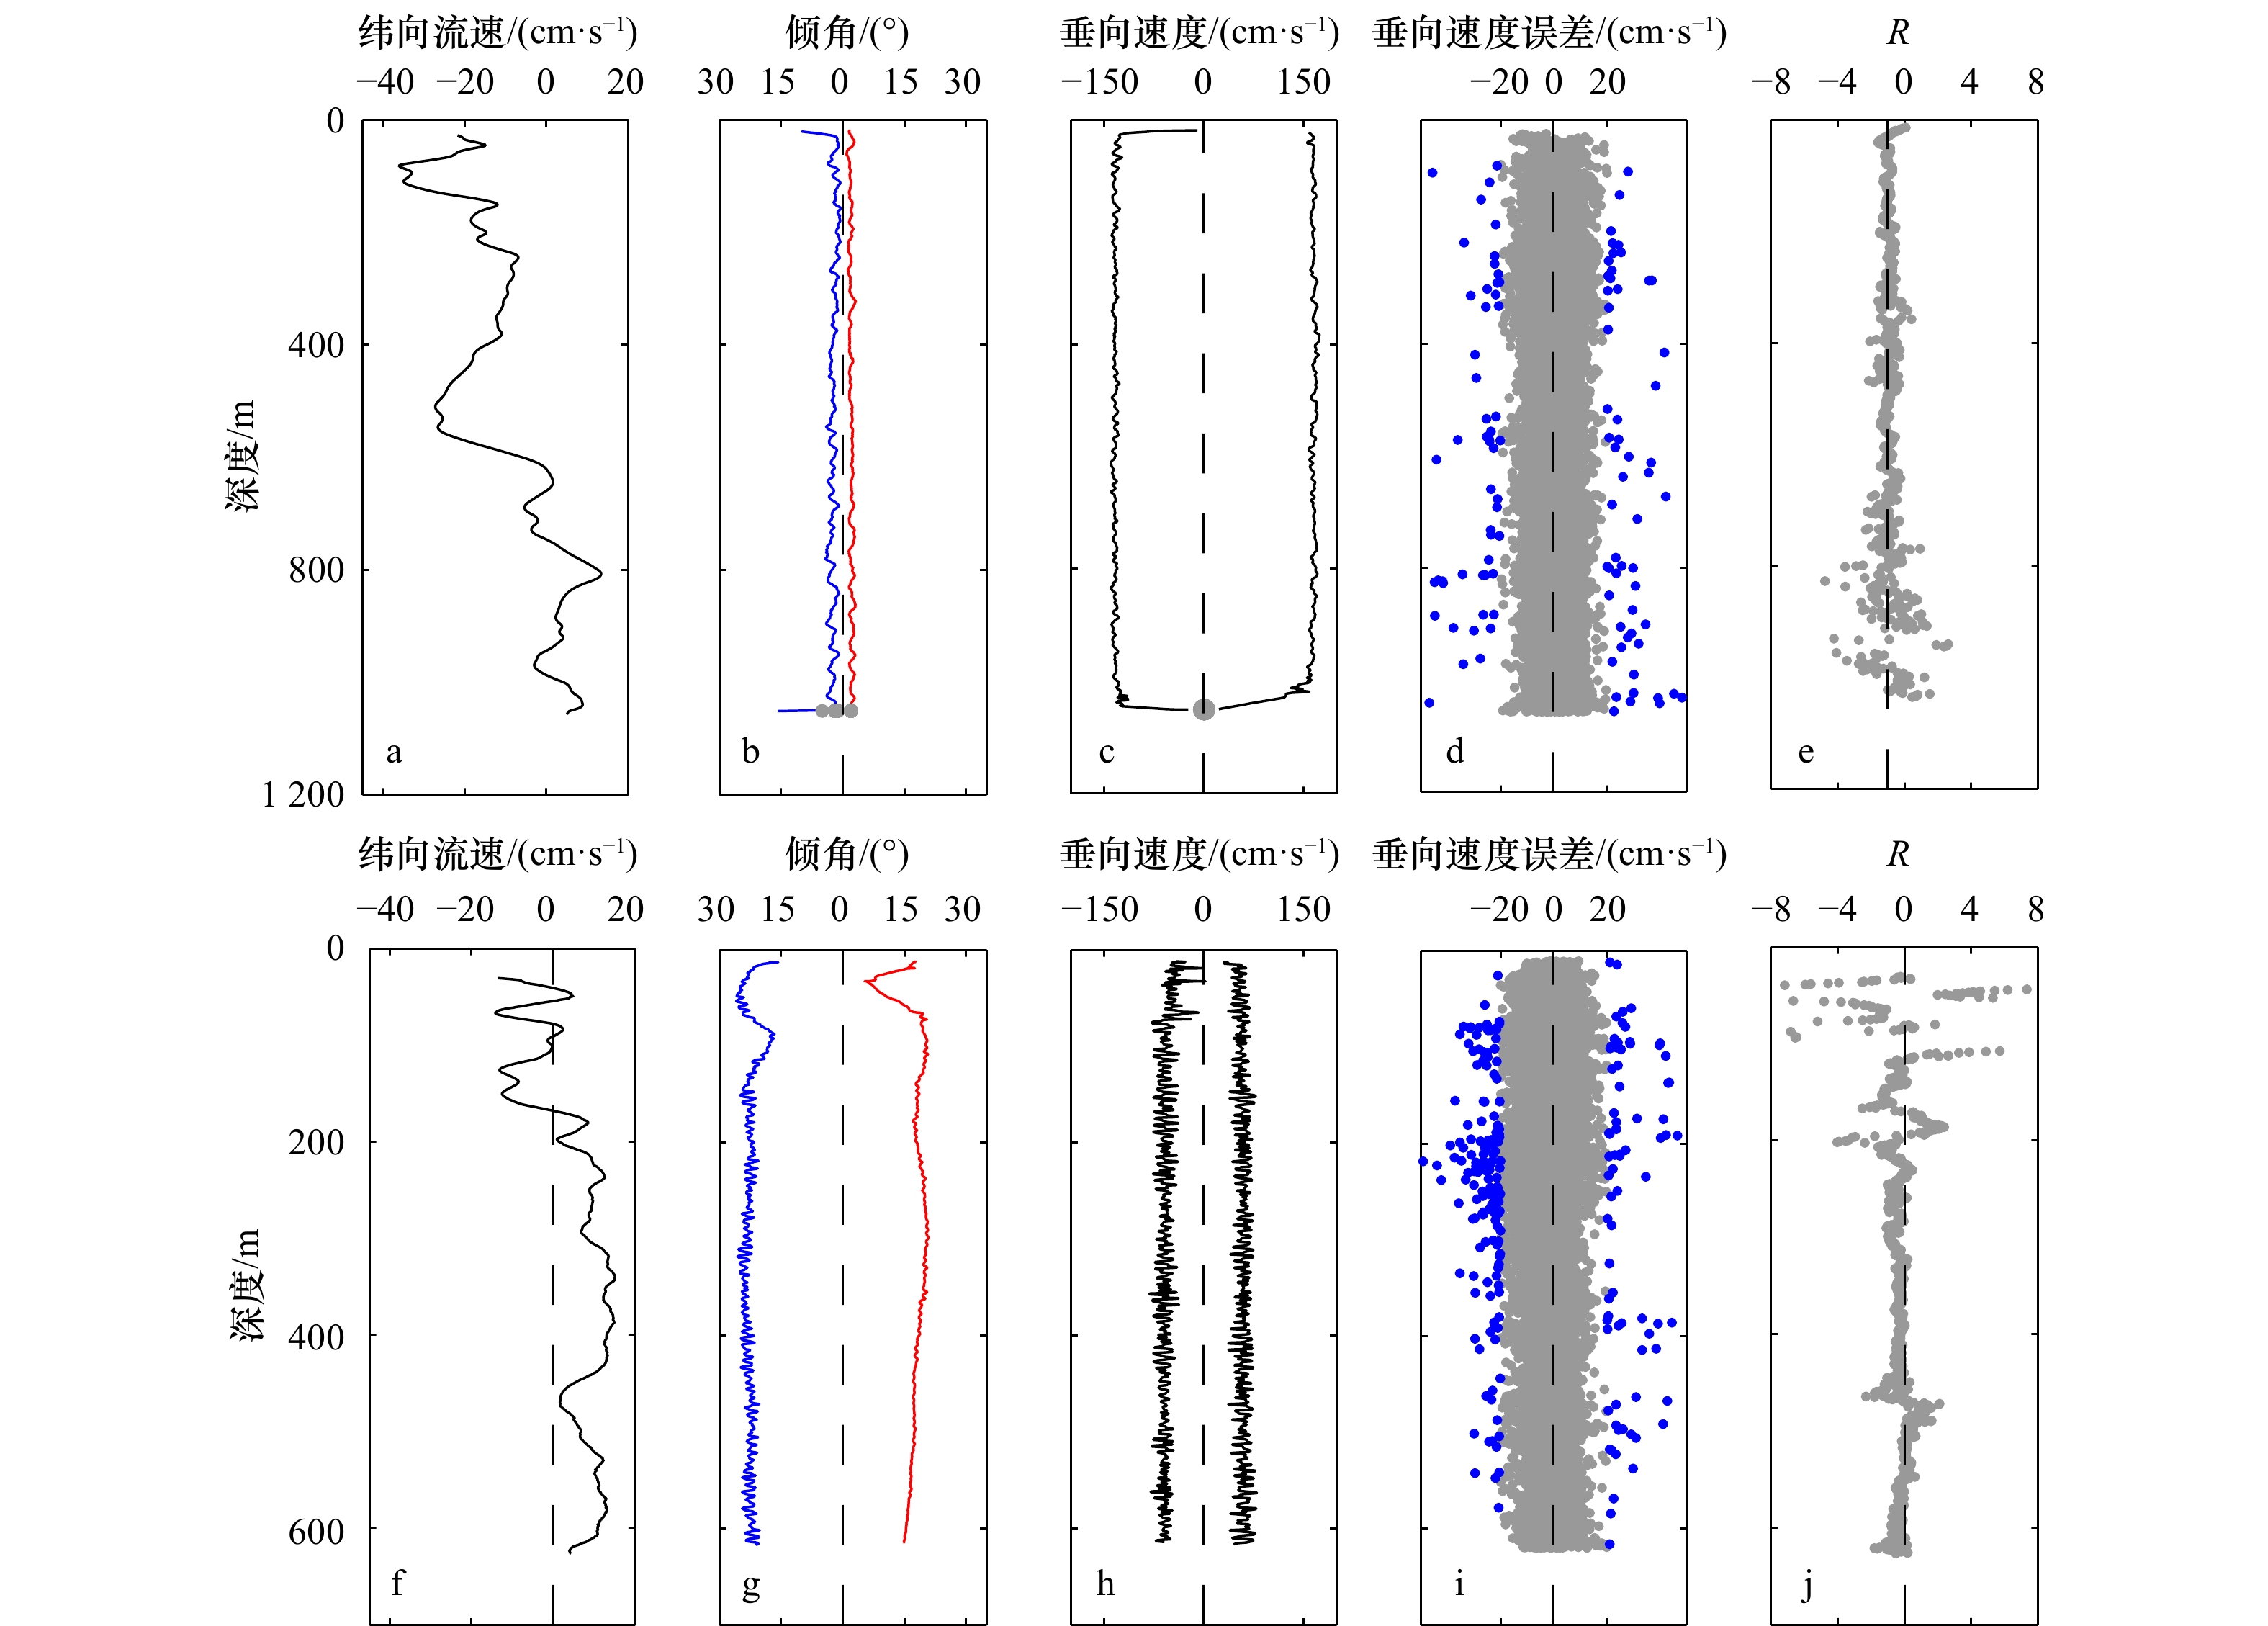
图 3 自由投放式声学多普勒海流剖面 (a–e)与下放式声学多普勒海流剖面 (f–j)特征参数
a, f. 纬向流速;b, g. 倾角,蓝色:下落阶段,红色:回收阶段;c, h. 垂向速度;d, i. 垂向速度误差,蓝点代表绝对值大于20 cm/s;e, j. 仪器水平速度与海流的比值
Fig. 3 Free-dropping acoustic Doppler current profile (a–e) and lowered acoustic Doppler current profiler (f–j) characteristic parameters
a, f. Zonal velocity; b, g. inclination, the blue line is the falling stage, and the red line is the recovery stage; c, h. vertical velocity; d, i. vertical velocity error, blue dot represents absolute value greater than 20 cm/s; e, j. ratio of instrument horizontal velocity to current

图 4 2021年9月P8站自由投放式声学多普勒海流剖面静置阶段近底流速
a.纬向速度剖面;b.第一层样本分布;c.第二层样本分布
Fig. 4 Near bottom velocity of free-dropping acoustic Doppler current profile at Station P8 in September, 2021
a. Zonal velocity profiles; b. distribution of samples in the first layer; c. distribution of samples in the second layer

图 5 2021年9月P5站观测流速剖面及其偏差
a.纬向流速剖面,黑线:FADCP,红线:潜标M1,灰色点:M1观测流速样本;b.纬向流速偏差,黑线:FADCP与潜标M1观测偏差,红线:潜标M1观测标准差;c.经向流速剖面;d.经向流速偏差
Fig. 5 Velocity profile and its deviation observed at Station P5 in September, 2021
a. Zonal velocity profile, black line: FADCP, red line: mooring M1, gray points: velocity samples of M1; b. zonal velocity deviations, black line: FADCP observation deviation from mooring M1, red line: standard deviation of mooring observation; c. meridional velocity profile; d. meridional velocity deviations
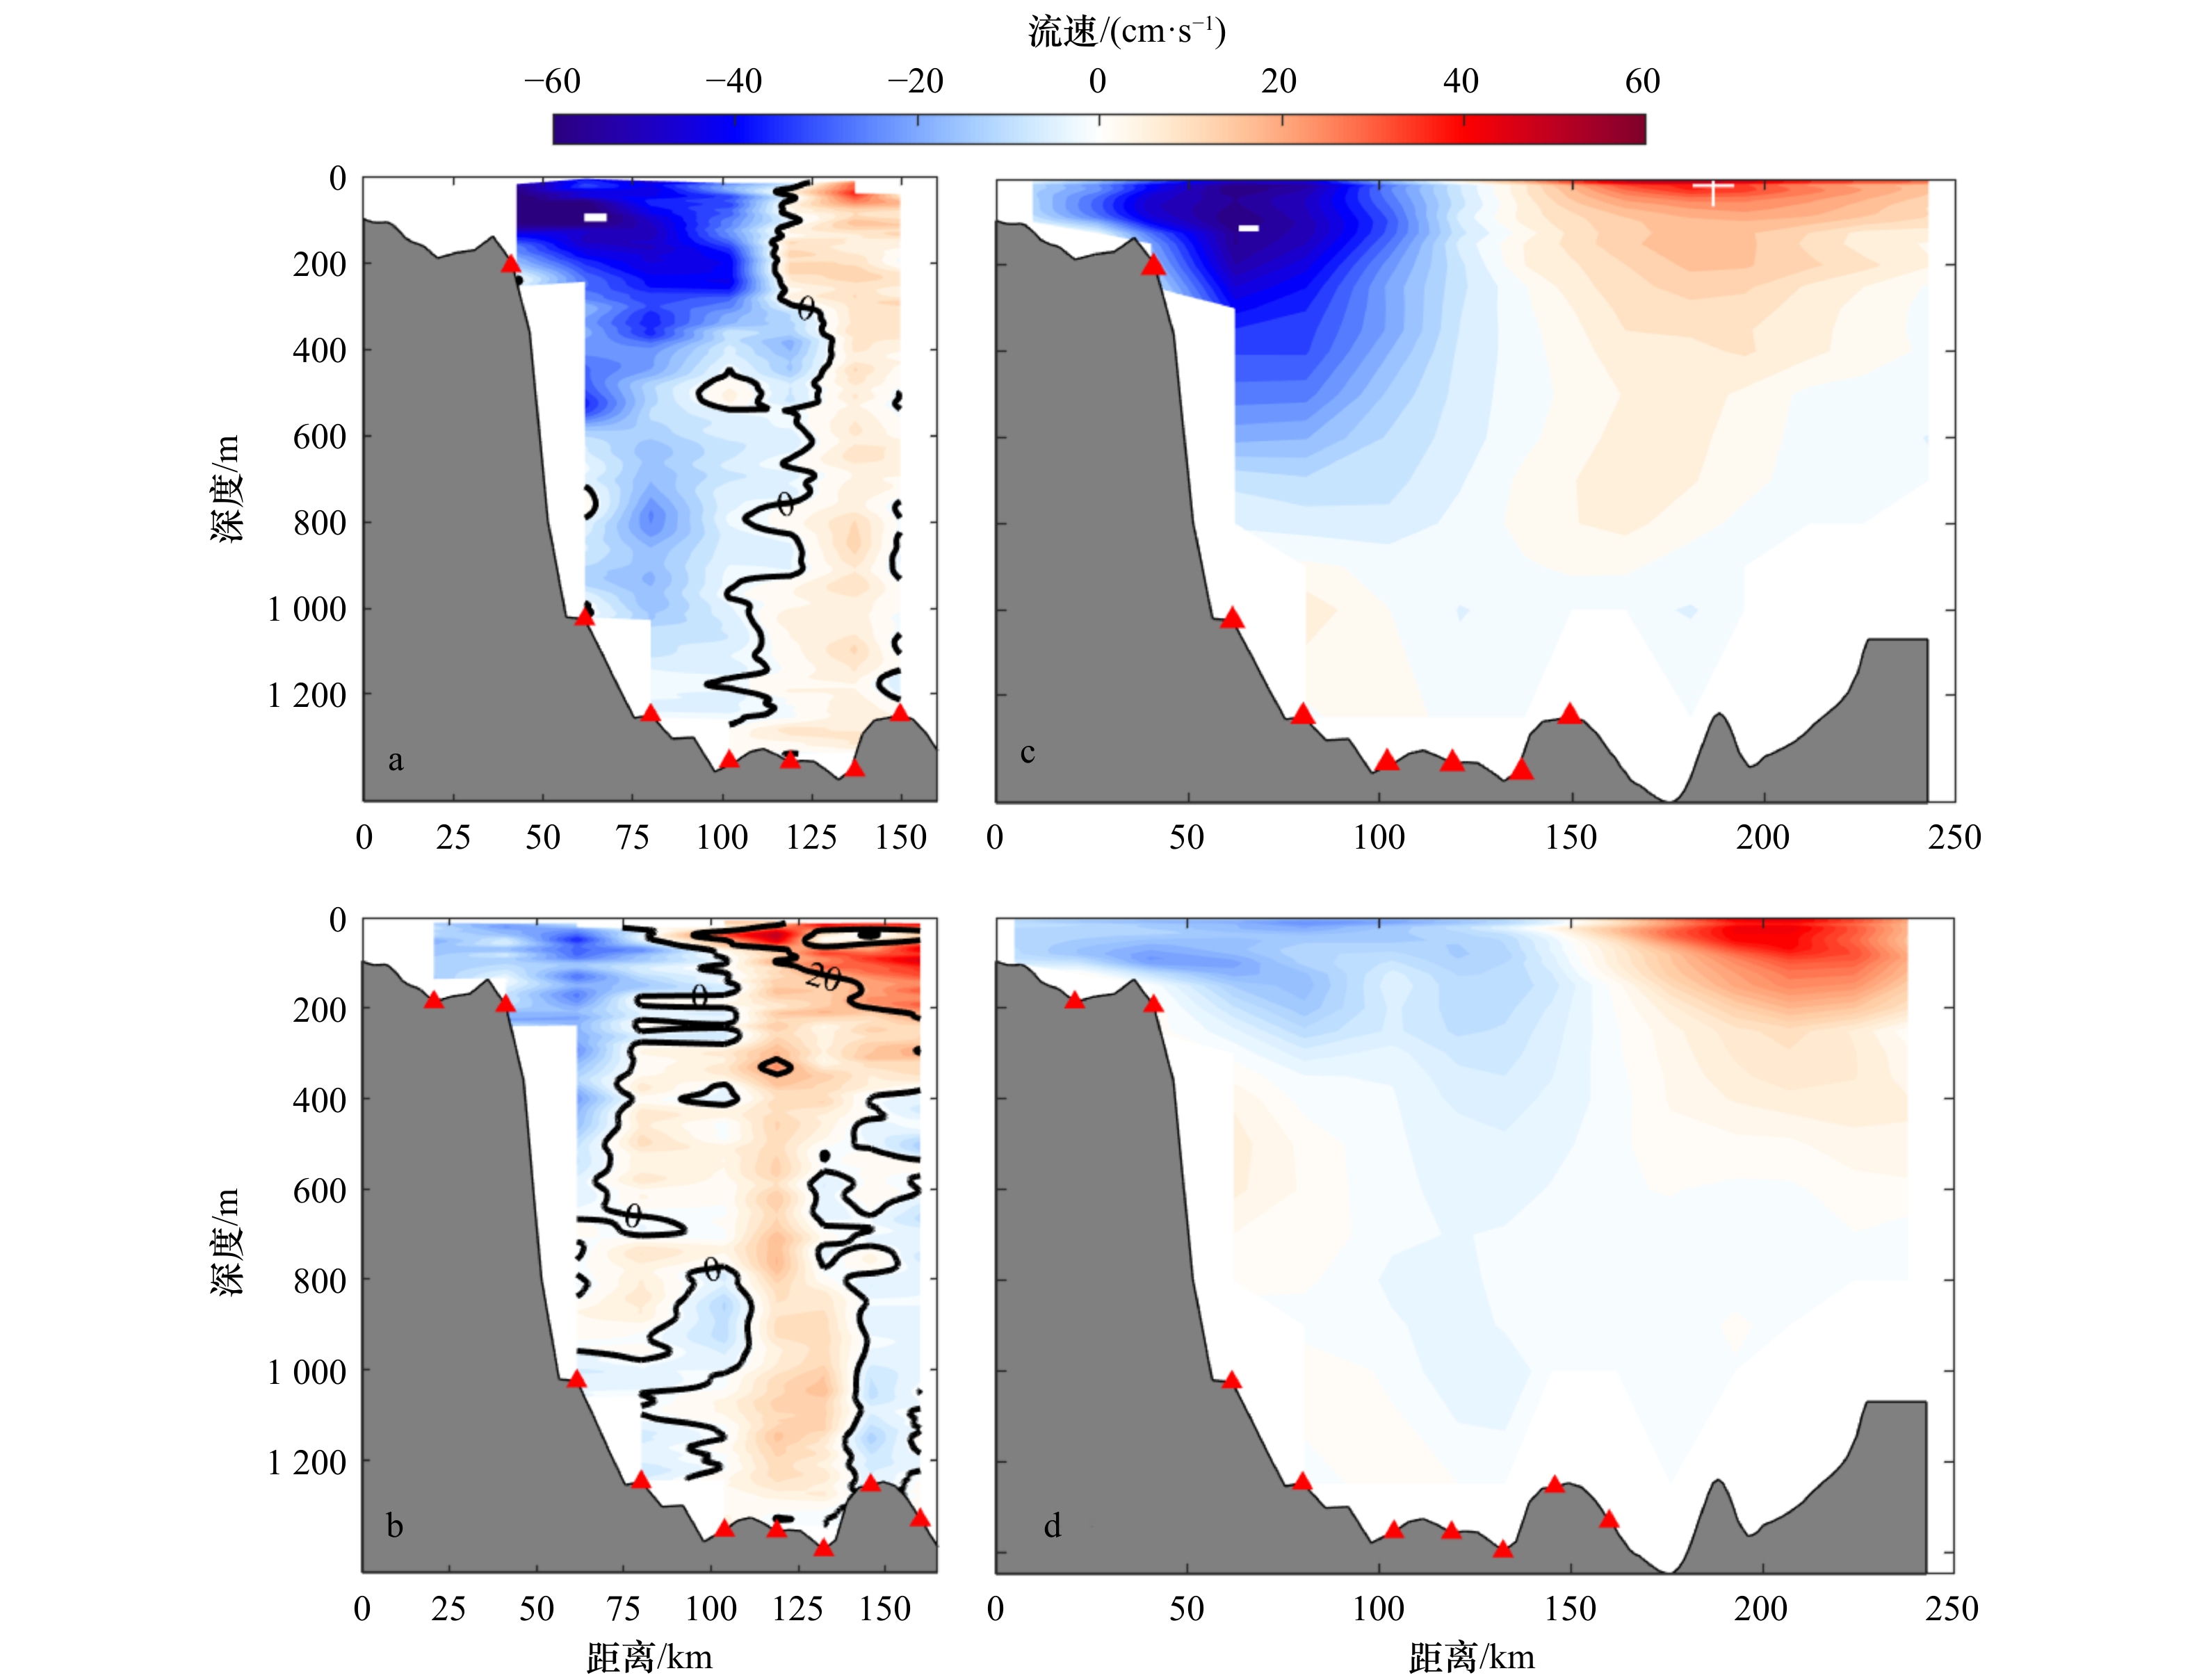
图 6 自由投放式声学多普勒海流剖面观测(a, b)及HYCOM模拟(c, d)的海流断面
a, c. 4月;b, d. 9月,颜色柱负值表示西南向流,正值表示东北向流,红色三角点为FADCP站位
Fig. 6 Current section of free-dropping acoustic Doppler current profile observation (a, b) and HYCOM simulation (c, d)
a, c. April; b, d. September, negative value of color column indicates southwest flow, and positive value indicates northeast flow, the red triangle points is the FADCP station

图 7 海面高度异常及绝对地转流场
a. 4月;b.9月,红色箭头为FADCP观测到的50 m以浅的平均流,蓝色线为200 m等深线
Fig. 7 Sea level anomaly and absolute geostrophic current fields
a. April; b. September, the red arrow shows the average flow of more than 50 m observed by FADCP, the blue line shows the isobath of 200 m
表 1 自由投放式声学多普勒海流剖面站位(P1–P9)详情
Tab. 1 Details of free-dropping acoustic Doppler current profiler stations (P1–P9)
站位 经纬度 时间/CTD状态 水深/m 2021年4月 2021年9月 P1 17.37°N, 109.79°E 6日15:24–15:34 186 P2 17.26°N, 109.94°E 23日06:47–06:57 6日17:13–17:26 CTD缺失 256 P3 17.10°N, 110.04°E 24日06:45–07:10 7日07:29–08:03 1025 P4 16.98°N, 110.17°E 24日08:44–09:15 CTD缺失 7日09:31–10:06 CTD缺失 1248 P5 16.84°N, 110.33°E 24日11:01–11:39 CTD缺失 8日08:21–09:01 CTD缺失 1355 P6 16.74°N, 110.27°E 24日14:13–14:48 8日06:30–07:10 1382 P7 16.67°N, 110.53°E 24日16:16–16:49 7日13:41–14:19 CTD缺失 1400 P8 16.58°N, 110.62°E 24日17:53–18:27 7日15:31–16:15 1255 P9 16.49°N, 110.71°E 7日17:20–18:02 1332  下载: 导出CSV
表 2 潜标M1观测仪器及设置(位置为16.85°N,110.32°E,水深为1 400 m)
Tab. 2 Details of M1 instruments and settings (location: 16.85°N, 110.32°E, depth: 1 400 m)
序号 仪器 设计水
深/m离底水
深/m采样间
隔/min仪器设置 1 75 kHz ADCP 80 1 320 3 向下观测,
层厚为16 m,
层数为35层2 Seaguard单点海流计 900 500 6 3 Seaguard单点海流计 1 200 200 6 4 Seaguard单点海流计 1 380 20 6
下载: 导出CSV
-
[1] Firing E, Gordon R L. Deep ocean acoustic Doppler current profiling[C]//Proceedings of the IEEE Fourth Working Conference on Current Measurement. Clinton: IEEE, 1990: 192−201. [2] Fischer J, Visbeck M. Deep velocity profiling with self-contained ADCPs[J]. Journal of Atmospheric and Oceanic Technology, 1993, 10(5): 764−773. doi: 10.1175/1520-0426(1993)010<0764:DVPWSC>2.0.CO;2 [3] Firing E. Lowered ADCP development and use in WOCE[C]//International WOCE Newsletter. [S.l.: s.n.]. 1998: 10−15. [4] Morozov A N, Lemeshko E M, Shutov S A, et al. Structure of the Black Sea currents based on the results of the LADCP observations in 2004−2014[J]. Physical Oceanography, 2017(1): 25−40. [5] Komaki K, Kawabe M. Deep-circulation current through the Main Gap of the Emperor Seamounts Chain in the North Pacific[J]. Deep Sea Research Part I: Oceanographic Research Papers, 2009, 56(3): 305−313. doi: 10.1016/j.dsr.2008.10.006 [6] Seo S, Park Y G, Park J H, et al. Observation and simulation of internal tides on the continental slope of the southwestern East Sea[C]//EGU General Assembly Conference Abstracts. Vienna: EGU, 2013. [7] Saito T. Simple LADCP data processing method with DGPS[R]. Research Institute for Applied Mechanics, Kyushu University, 2008. [8] 杨成浩, 廖光洪, 袁耀初, 等. ADCP观测得到的2008年4月吕宋海峡流速剖面结构[J]. 海洋学报, 2013, 35(3): 1−10.Yang Chenghao, Liao Guanghong, Yuan Yaochu, et al. Structures of velocity profile in the Luzon Strait measured by LADCP in April 2008[J]. Haiyang Xuebao, 2013, 35(3): 1−10. [9] Thurnherr A M, Symonds D, St. Laurent L. Processing explorer ADCP data collected on Slocum gliders using the LADCP shear method[C]//2015 IEEE/OES Eleveth Current, Waves and Turbulence Measurement. St. Petersburg: IEEE, 2015: 1−7. [10] 谢玲玲, 郭心顺, 张艳伟, 等. LADCP底跟踪参考速度问题分析[J]. 海洋技术, 2013, 32(2): 1−5,34.Xie Lingling, Guo Xinshun, Zhang Yanwei, et al. Reference velocity from bottom track in LADCP data processing[J]. Journal of Ocean Technology, 2013, 32(2): 1−5,34. [11] Visbeck M. Deep velocity profiling using lowered acoustic Doppler current profilers: bottom track and inverse solutions[J]. Journal of Atmospheric and Oceanic Technology, 2002, 19(5): 794−807. doi: 10.1175/1520-0426(2002)019<0794:DVPULA>2.0.CO;2 [12] Egbert G D. Tidal data inversion: interpolation and inference[J]. Progress in Oceanography, 1997, 40(1/4): 53−80. [13] Egbert G D, Erofeeva S Y. Efficient inverse modeling of Barotropic ocean tides[J]. Journal of Atmospheric and Oceanic Technology, 2002, 19(2): 183−204. doi: 10.1175/1520-0426(2002)019<0183:EIMOBO>2.0.CO;2 -

计量
- 文章访问数: 638
- HTML全文浏览量: 269
- PDF下载量: 53
- 被引次数: 0
