

Effects of lengths of catch time series on stock assessment using CMSY method
-
摘要: 大多数渔业种类由于数据缺乏,无法使用传统的渔业资源评估方法开展评估和管理。越来越多的研究采用CMSY等基于有限数据的评估方法,但CMSY方法在渔获量数据时间序列长度有限、存在误差等情况下的评估可靠性尚有待验证。本研究运用CMSY方法对黄海3种产量较高的经济鱼类开展资源评估,探索渔获量数据时间序列长度、不同渔业发展阶段,以及观测误差水平对评估结果的影响。结果表明,鲐、带鱼和银鲳在2000年后均出现产量高于最大可持续产量(MSY)的情况,资源处于过度利用状况(B/BMSY<1、F/FMSY>1),近10年来开发强度降低,但生物量仍处于较低水平(B/BMSY<1)。评估模型的回溯性分析结果差异较小,表明评估结果稳定。从数据长度上看,使用遍历产量上升和下降过程的长时间序列数据,其评估结果更为稳定。在观测误差大于20%的情况下,模型对MSY和BMSY出现高估,但结果仍较为稳健。在CMSY方法的应用中应注意选取长时间序列的产量数据,在评估结果不确定性高的情况下应采取相对保守的渔业管理措施。Abstract: The majority of global fish stocks lack adequate data for their stock statuses to be assessed using conventional stock assessment methods. Data-limited methods, such as CMSY, have been increasingly recommended as new solutions for stock assessment and fishery management. However, CMSY is highly dependent on data quality, and the reliability of the method is yet to be verified under circumstances of limited length of time series data and variable observational errors. In this study, we investigated effects of lengths of catch time series, stages of fishery development, and levels of observational errors in catches on stock assessment of three economically-important species in the Yellow Sea using CMSY method. The results show that chub mackerel (Scomber japonicus), hairtail (Trichiurus lepturus), and silver pomfret (Pampus argenteus), all have been overfished (B/BMSY<1 and F/FMSY>1), with their yields higher than estimated MSY since 2000, and although their fishing intensities have been reduced over the most recent decade, their biomasses remain at low levels (B/BMSY<1). The retrospective analysis show small differences in the results of stock assessment for the three species, indicating that the assessments are robust enough with long time series data. As to effects of lengths of catch time series, the assessments are more stable using time series data covering a period of both rise and fall in catches. The effect of observational errors in catches is also tested, showing that when the error is >20%, the model tend to overestimate MSY and BMSY, but the assessment remains robust enough. This study suggests that cautions should be undertaken in the application of CMSY by using longer time series of catch data and, in the presence of high uncertainty in the assessment, more conservative measures should be taken in fishery management.
-
Key words:
- data-limited methods /
- fishery stock assessment /
- CMSY method /
- fisheries yield /
- time series data
-

图 1 CMSY方法对鲐、带鱼和银鲳种群状态的评估结果
Fig. 1 The estimated stock status of Scomber japonicus, Trichiurus lepturus and Pampus argenteus by the CMSY method
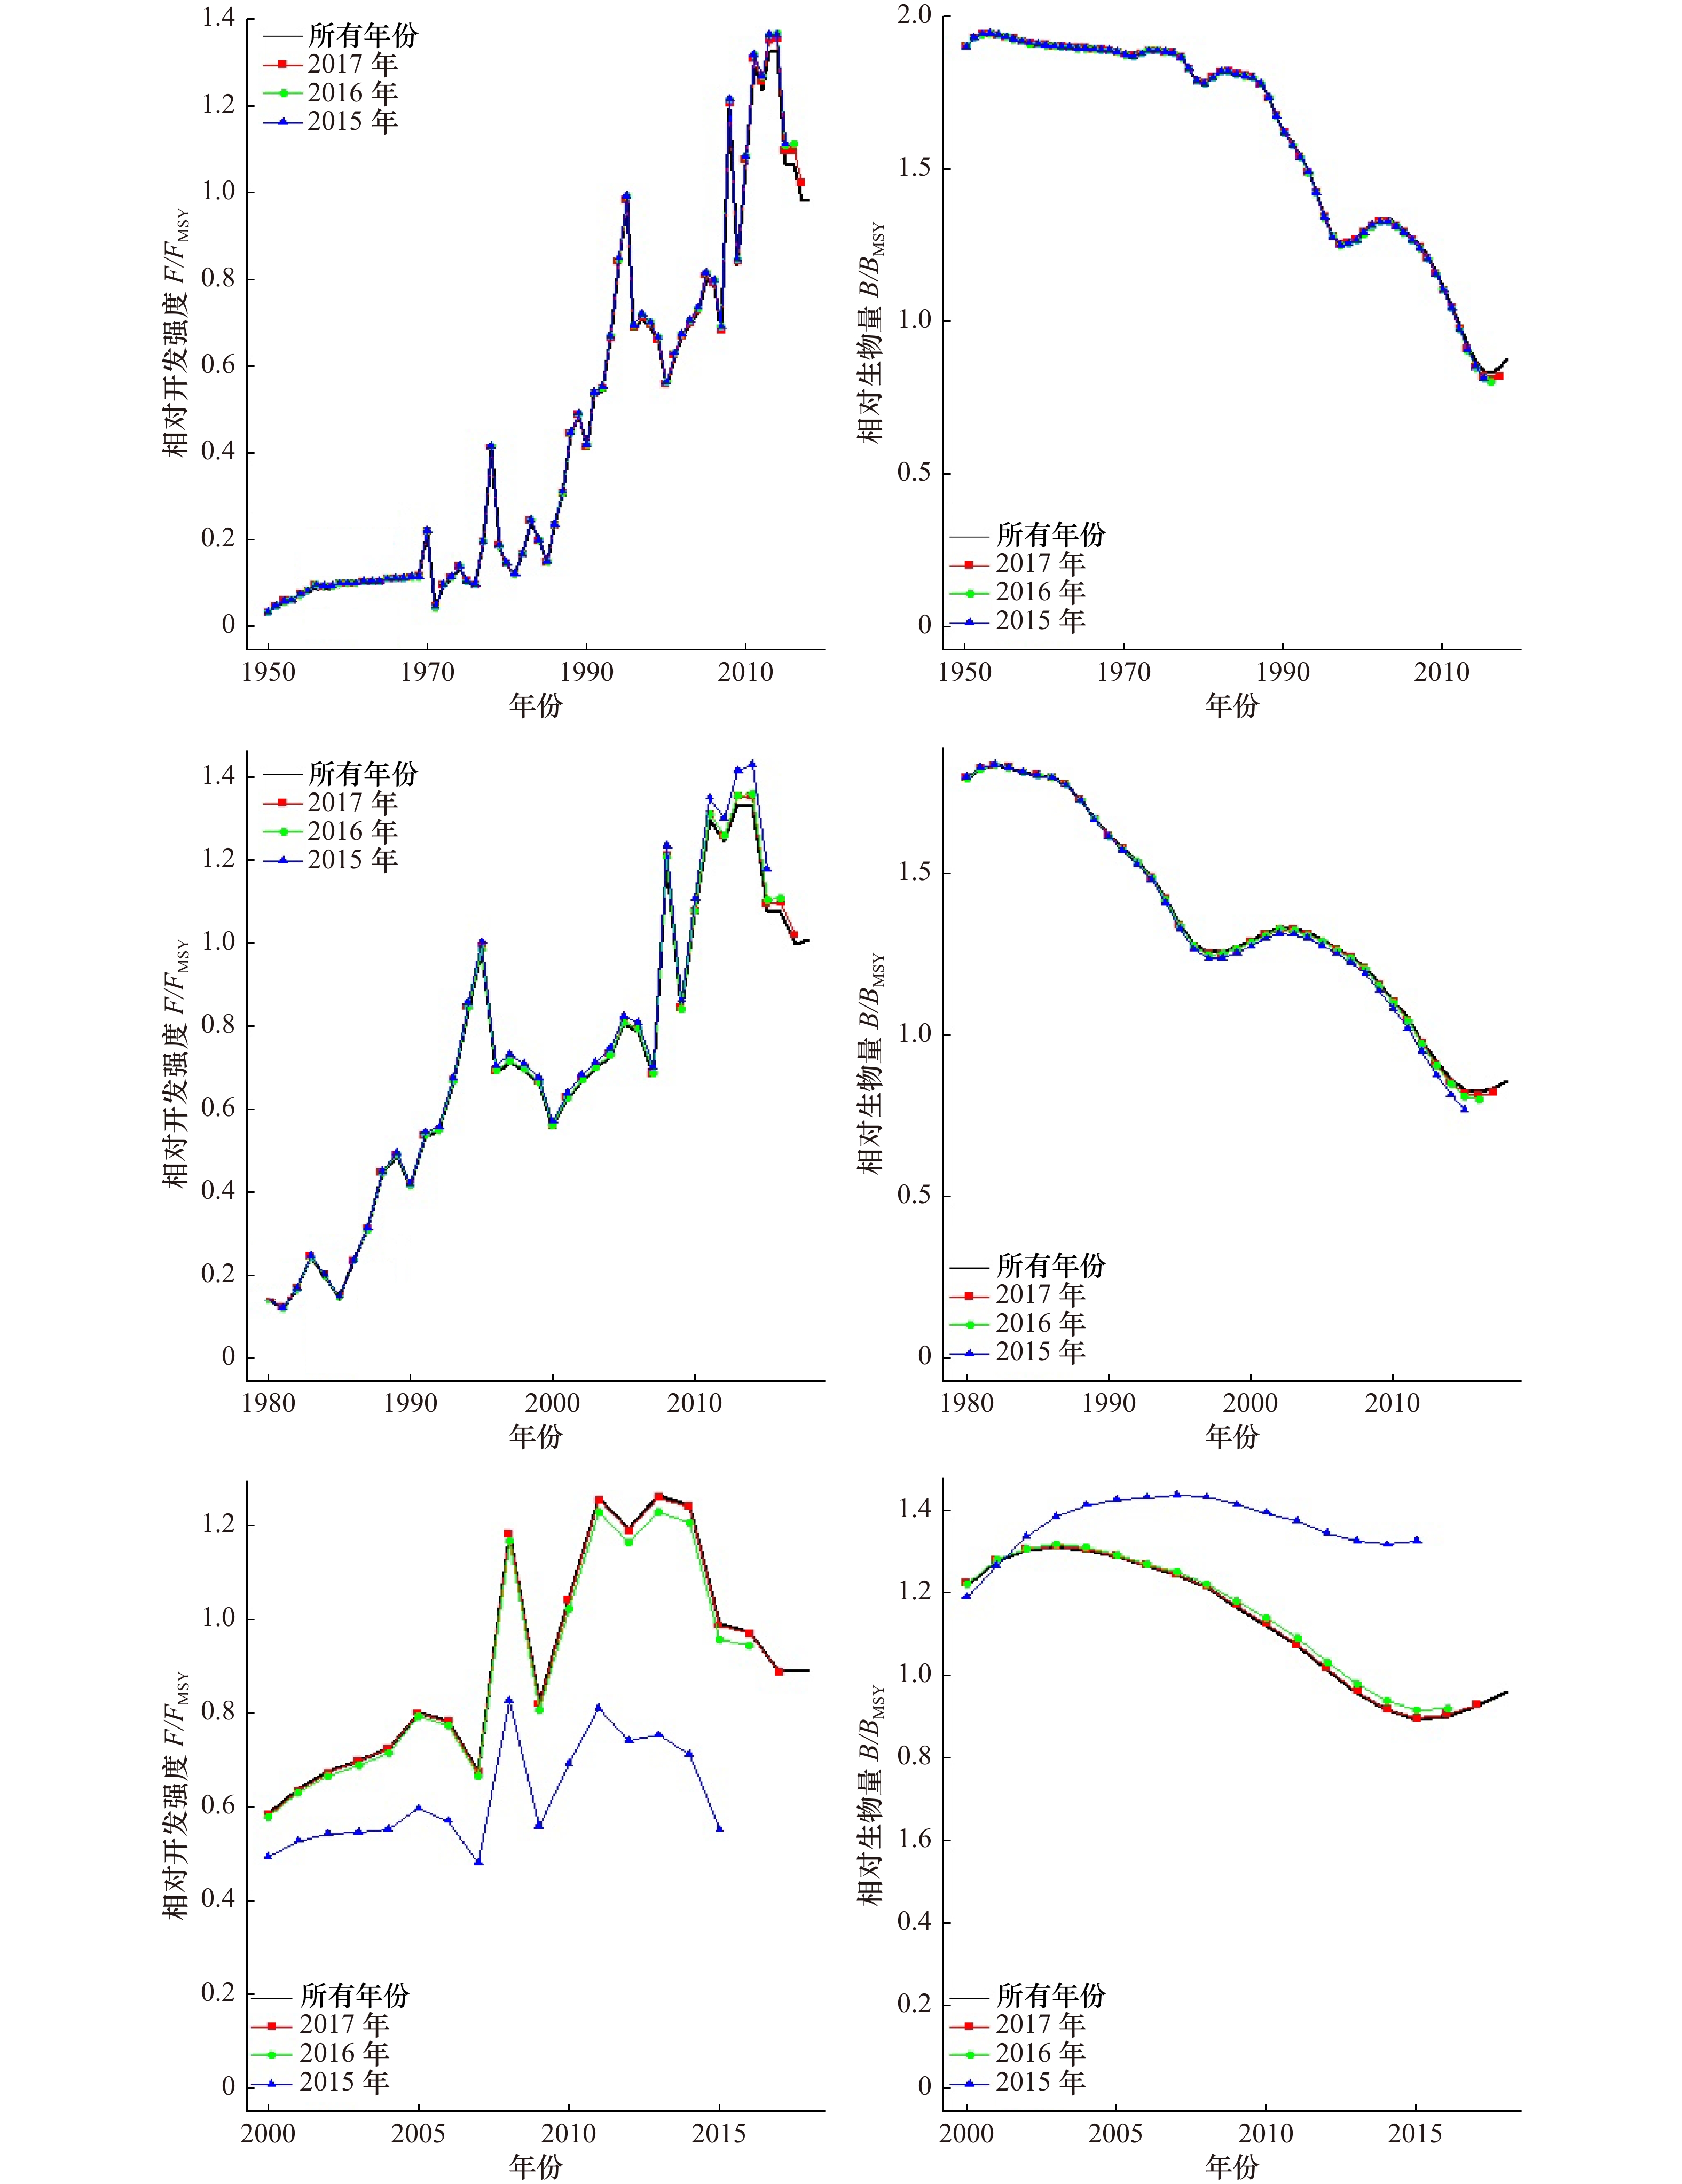
图 2 不同时间序列长度的产量数据情况下鲐的回溯性分析结果
Fig. 2 Retrospective analysis of mackerel (Scomber japonicus) with catch data of different time-series lengths

3 使用在不同渔业发展阶段带鱼、鲐产量的回溯性分析结果
3 Retrospective analysis of hairtail (Trichiurus lepturus) and mackerel (Scomber japonicus) with catches of different development stages
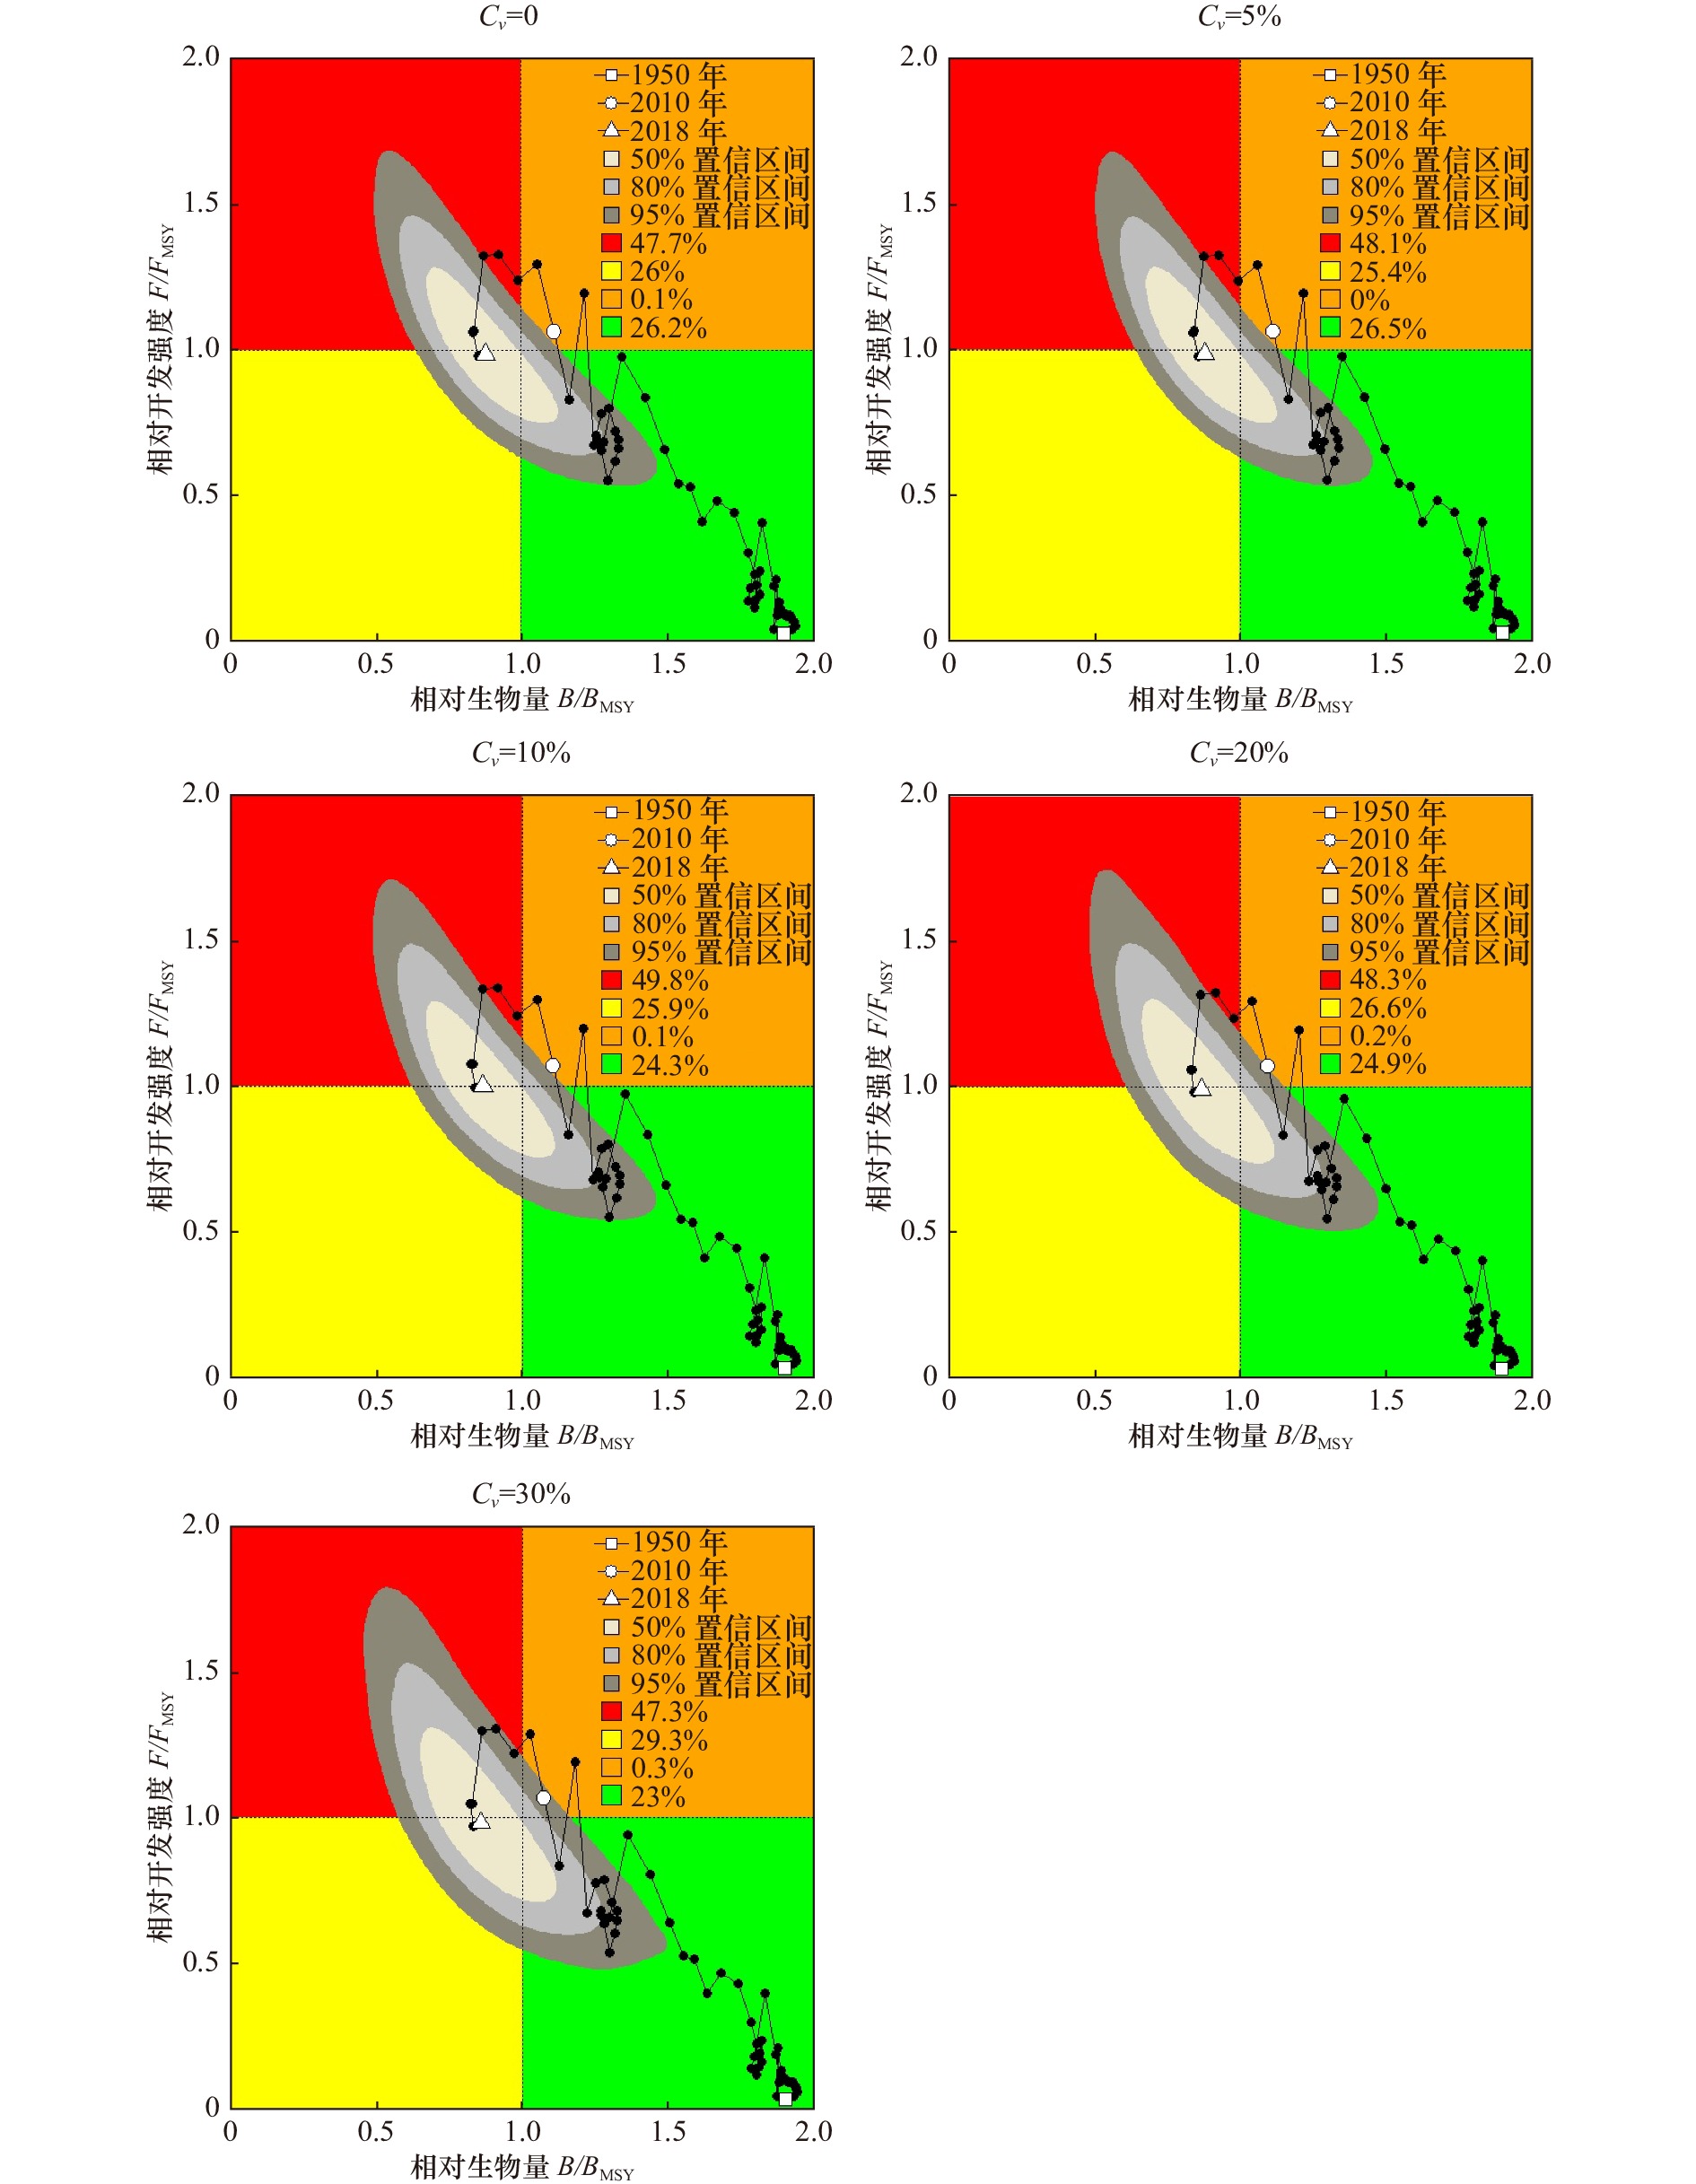
图 4 不同渔获量数据误差情况下鲐的评估结果KOBE图
右上方图例中的4种颜色对应的百分数表示最后一年该物种落入其中一个彩色区域的概率
Fig. 4 KOBE plot of mackerel (Scomber japonicus) at different levels of error in catch data
The legend in the upper right graph indicates the probability of the last year falling into one of the colored areas
表 1 CMSY相对生物量( B / k ) 的先验设置
Tab. 1 Prior settings of the relative biomass (B/k) in CMSY
生物量水平 建议先验范围 Bstart/k Bend/k 极低生物量水平 0.8~1.0 鲐(1950−2018年、1980−2018年、1980−1999年);银鲳(1969−2018年、1980−2018年);带鱼(1950−2018年) − 低生物量水平 0.4~0.8 鲐(2000−2018年、1960−1979年);带鱼(1980−2018年、1980−1999年、1960−1979年) 鲐(1960−1979年);带鱼(1980−1999年、1960−1979年) 中等生物量水平 0.2~0.6 银鲳(2000−2018年);带鱼(2000−2018年) 鲐(1950−2018年、1980−2018年、2000−2018年、1980−1999年);银鲳(1969−2018年、1980−2018年、2000−2018年);带鱼(1950−2018年、1980−2018年) 高生物量水平 0.01~0.4 − 带鱼(2000−2018年) 几乎未被开发 0.01~0.2 − − 注:“−”代表没有任何一种鱼类的生物量水平先验设置在此范围内。  下载: 导出CSV
表 2 渔获量数据时间序列的情景设置
Tab. 2 Scenario settings for the time series of catch data
物种 不同时间长度设置 不同发展阶段时间设置 鲐 Scomber japonicus 1950−2018年 1960−1979年 1980−2018年 1980−1999年 2000−2018年 2000−2018年 带鱼 Trichiurus lepturus 1950−2018年 1960−1979年 1980−2018年 1980−1999年 2000−2018年 2000−2018年 银鲳 Pampus argenteus 1969−2018年 − 1980−2018年 2000−2018年 注:渔获量数据误差(以变异系数区分不同误差,分别为5%、10%、20%和30%)均在鲐1950−2018年的时间序列下加入;“−”表示未针对此情景开展模型稳定性探究。
下载: 导出CSV
表 3 不同渔获量时间序列长度下CMSY模型评估结果比较
Tab. 3 A comparison of the assessment results by CMSY with different catch time-series lengths
物种 时间序列 最大可持续产量
MSY/(10³ t)MSY变异系数
Cv相对生物量
B/BMSYB/BMSY标准差
SD相对开发强度
F/FMSYF/FMSY标准差
SD鲐
Scomber japonicus1950−2018年 50.21 0.055 0.86 0.182 1.01 0.315 1980−2018年 49.88 0.054 0.86 0.182 1.02 0.318 2000−2018年 50.76 0.072 0.94 0.189 0.91 0.312 银鲳
Pampus argenteus1969−2018年 87.26 0.052 0.82 0.187 0.96 0.298 1980−2018年 87.16 0.052 0.84 0.186 0.95 0.298 2000−2018年 92.89 0.077 0.93 0.188 0.80 0.267 带鱼
Trichiurus lepturus1950−2018年 183.18 0.066 0.93 0.185 0.75 0.239 1980−2018年 186.73 0.045 0.93 0.183 0.74 0.231 2000−2018年 191.12 0.086 0.54 0.188 1.21 3.991
下载: 导出CSV
表 4 鲐和带鱼在不同渔业发展阶段的评估结果分析
Tab. 4 Stock assessment results for mackerel (Scomber japonicus) and hairtail (Trichiurus lepturus)at different stages of fishery development
物种 时间序列 最大可持续产量
MSY/(10³ t)MSY变异系数
Cv相对生物量
B/BMSYB/BMSY标准差
SD相对开发强度
F/FMSYF/FMSY标准差
SD鲐
Scomber japonicus1960−1979年 22.40 0.190 1.46 0.160 0.55 0.084 1980−1999年 42.15 0.102 0.99 0.186 1.02 0.349 2000−2018年 50.76 0.072 0.94 0.189 0.91 0.312 带鱼
Trichiurus lepturus1960−1979年 105.51 0.150 1.32 0.188 0.74 0.140 1980−1999年 196.79 0.195 1.34 0.188 0.75 0.141 2000−2018年 191.12 0.086 0.54 0.188 1.21 3.991
下载: 导出CSV
表 5 不同渔获量误差情况下鲐的评估结果分析
Tab. 5 Stock assessment results for mackerel (Scomber japonicus) at different levels of error in catch data
物种 渔获量数据误差
(Cv)/%最大可持续产量
MSY/(103 t)MSY变异系数
CvMSY生物量
BMSY/(103 t)BMSY变异系数
CvMSY开发强度
FMSYFMSY变异系数
Cv鲐
Scomber japonicus0 50.21 0.055 179.03 0.152 0.283 0.161 5 50.05 0.058 178.08 0.146 0.283 0.159 10 50.16 0.065 179.21 0.151 0.282 0.161 20 50.81 0.083 180.27 0.154 0.284 0.159 30 51.44 0.100 183.15 0.155 0.283 0.165
下载: 导出CSV
-
[1] Costello C, Ovando D A, Hilborn R, et al. Status and solutions for the world’s unassessed fisheries[J]. Science, 2012, 338(6106): 517−520. doi: 10.1126/science.1223389 [2] Hilborn R, Amoroso R O, Anderson C M, et al. Effective fisheries management instrumental in improving fish stock status[J]. Proceedings of the National Academy of Sciences, 2020, 117(4): 2218−2224. doi: 10.1073/pnas.1909726116 [3] Harley S J, Williams P, Nicol S, et al. The western and central Pacific tuna fishery: 2010 overview and status of stocks[R]. Noumea, New Caledonia: Secretariat of the Pacific Community, 2011. [4] Harley S, Davies N, Hampton J, et al. Stock assessment of bigeye tuna in the western and central Pacific Ocean[R]. Majuro, Marshall Islands: Western and Central Pacific Fisheries Commission, 2014. [5] Pauly D. Major trends in small-scale marine fisheries, with emphasis on developing countries, and some implications for the social sciences[J]. Maritime Studies, 2006, 4(2): 7−22. [6] Costello C, Ovando D. Status, institutions, and prospects for global capture fisheries[J]. Annual Review of Environment and Resources, 2019, 44: 177−200. doi: 10.1146/annurev-environ-101718-033310 [7] Froese R, Zeller D, Kleisner K, et al. What catch data can tell us about the status of global fisheries[J]. Marine Biology, 2012, 159(6): 1283−1292. doi: 10.1007/s00227-012-1909-6 [8] 耿喆, 朱江峰, 夏萌, 等. 数据缺乏条件下的渔业资源评估方法研究进展[J]. 海洋湖沼通报, 2018(5): 130−137.Geng Zhe, Zhu Jiangfeng, Xia Meng, et al. Research progress in fishery stock assessment using data-poor/limited methods[J]. Transactions of Oceanology and Limnology, 2018(5): 130−137. [9] Liang Cui, Pauly D. Fisheries impacts on China’s coastal ecosystems: unmasking a pervasive ‘fishing down’effect[J]. PLoS One, 2017, 12(3): e0173296. doi: 10.1371/journal.pone.0173296 [10] Froese R, Demirel N, Coro G, et al. Estimating fisheries reference points from catch and resilience[J]. Fish and Fisheries, 2017, 18(3): 506−526. doi: 10.1111/faf.12190 [11] Demirel N, Zengin M, Ulman A. First large-scale eastern mediterranean and Black Sea stock assessment reveals a dramatic decline[J]. Frontiers in Marine Science, 2020, 7: 103. doi: 10.3389/fmars.2020.00103 [12] Zhang Kui, Zhang Jun, Xu Youwei, et al. Application of a catch-based method for stock assessment of three important fisheries in the East China Sea[J]. Acta Oceanologica Sinica, 2018, 37(2): 102−109. doi: 10.1007/s13131-018-1173-9 [13] Liang Cui, Xian Weiwei, Pauly D. Assessments of 15 exploited fish stocks in Chinese, South Korean and Japanese waters using the CMSY and BSM methods[J]. Frontiers in Marine Science, 2020, 7: 623. doi: 10.3389/fmars.2020.00623 [14] Wang Yibang, Wang Yuanchao, Liang Cui, et al. Assessment of 12 fish species in the northwest Pacific using the CMSY and BSM methods[J]. Frontiers in Marine Science, 2020, 7: 616. doi: 10.3389/fmars.2020.00616 [15] 官文江, 高峰, 雷林, 等. 渔业资源评估中的回顾性问题[J]. 上海海洋大学学报, 2012, 21(5): 841−847.Guan Wenjiang, Gao Feng, Lei Lin, et al. Retrospective problem in fishery stock assessment[J]. Journal of Shanghai Ocean University, 2012, 21(5): 841−847. [16] 李亚楠, 戴小杰, 朱江峰, 等. 渔获量不确定性对印度洋大眼金枪鱼资源评估的影响[J]. 渔业科学进展, 2018, 39(5): 1−9.Li Ya’nan, Dai Xiaojie, Zhu Jiangfeng, et al. Impact of catch uncertainty on the stock assessment of bigeye tuna (Thunnus obesus) in the Indian Ocean[J]. Progress in Fishery Sciences, 2018, 39(5): 1−9. [17] Wang Yingbin, Zheng Ji, Wang Zheng. Impacts of distorted fishery statistical data on assessments of three surplus production models[J]. Chinese Journal of Oceanology and Limnology, 2011, 29(2): 270−276. doi: 10.1007/s00343-011-0138-z [18] 张魁, 刘群, 廖宝超, 等. 渔业数据失真对两种非平衡剩余产量模型评估结果的影响比较[J]. 水产学报, 2018, 42(9): 1378−1389.Zhang Kui, Liu Qun, Liao Baochao, et al. Comparative effects of distorted fishery data on assessment results of two non-equilibrium surplusproduction models[J]. Journal of Fisheries of China, 2018, 42(9): 1378−1389. [19] Watson R, Pang L, Pauly D. The marine fisheries of China: development and reported catches[R]. Vancouver: Fisheries Centre, University of British Columbia, 2001. [20] Schaefer M B. Some aspects of the dynamics of populations important to the management of the commercial marine fisheries[J]. Inter-American Tropical Tuna Commission Bulletin, 1954, 1(2): 23−56. [21] Mohn R. The retrospective problem in sequential population analysis: an investigation using cod fishery and simulated data[J]. ICES Journal of Marine Science, 1999, 56(4): 473−488. doi: 10.1006/jmsc.1999.0481 [22] Szuwalski C S, Ianelli J N, Punt A E. Reducing retrospective patterns in stock assessment and impacts on management performance[J]. ICES Journal of Marine Science, 2018, 75(2): 596−609. doi: 10.1093/icesjms/fsx159 [23] Brooks E N, Legault C M. Retrospective forecasting—evaluating performance of stock projections for New England groundfish stocks[J]. Canadian Journal of Fisheries and Aquatic Sciences, 2016, 73(6): 935−950. doi: 10.1139/cjfas-2015-0163 [24] Zhang Fan, Reid K B, Nudds T D. The longer the better? Trade-offs in fisheries stock assessment in dynamic ecosystems[J]. Fish and Fisheries, 2021, 22(4): 789−797. doi: 10.1111/faf.12550 [25] 高强, 李大良, 贾海明. 我国渔业发展研究综述[J]. 渔业经济研究, 2008(1): 13−19.Gao Qiang, Li Daliang, Jia Haiming. Research on our country’s fishery development[J]. Fisheries Economy Research, 2008(1): 13−19. [26] Garibaldi L. The FAO global capture production database: a six-decade effort to catch the trend[J]. Marine Policy, 2012, 36(3): 760−768. doi: 10.1016/j.marpol.2011.10.024 [27] Kimura D K, Tagart J V. Stock reduction analysis, another solution to the catch equations[J]. Canadian Journal of Fisheries and Aquatic Sciences, 1982, 39(11): 1467−1472. doi: 10.1139/f82-198 [28] Miyagawa M, Ichinokawa M, Yoda M, et al. Commentary: stock status assessments for 12 exploited fishery species in the Tsushima Warm Current region, Southwest Japan and East China, using the CMSY and BSM methods[J]. Frontiers in Marine Science, 2021, 8: 703039. doi: 10.3389/fmars.2021.703039 [29] Ju Peilong, Tian Yongjun, Chen Mingru, et al. Evaluating stock status of 16 commercial fish species in the coastal and offshore waters of taiwan using the CMSY and BSM methods[J]. Frontiers in Marine Science, 2020, 7: 618. doi: 10.3389/fmars.2020.00618 [30] Ren Qingqiang, Liu Min. Assessing northwest Pacific fishery stocks using two new methods: the Monte Carlo catch-MSY (CMSY) and the Bayesian Schaefer model (BSM)[J]. Frontiers in Marine Science, 2020, 7: 430. doi: 10.3389/fmars.2020.00430 [31] Bouch P, Minto C, Reid D G. Comparative performance of data-poor CMSY and data-moderate SPiCT stock assessment methods when applied to data-rich, real-world stocks[J]. ICES Journal of Marine Science, 2021, 78(1): 264−276. doi: 10.1093/icesjms/fsaa220 [32] Zhai Lu, Liang Cui, Pauly D. Assessments of 16 exploited fish stocks in Chinese waters using the CMSY and BSM methods[J]. Frontiers in Marine Science, 2020, 7: 483993. doi: 10.3389/fmars.2020.483993 [33] Yu Huming. Marine fishery management in PR China[J]. Marine Policy, 1991, 15(1): 23−32. doi: 10.1016/0308-597X(91)90040-I [34] Wang S D H, Zhan Bingyi. Marine fishery resource management in PR China[J]. Marine Policy, 1992, 16(3): 197−209. doi: 10.1016/0308-597X(92)90081-Y [35] 吴子彦. 基于可持续发展的我国海洋渔业资源有效管理研究[D]. 长春: 吉林大学, 2009.Wu Ziyan. Study on effective management of China’s marine fishery resources based on sustainable development[D]. Changchun: Jilin University, 2009. [36] 林学钦. 伏季休渔实施十年论我国渔业资源和资源管理问题[J]. 厦门科技, 2004(6): 11−15.Lin Xueqin. 10th anniversary of implementation of summer fishing moratorium-study on issues of fishery resource and resource management[J]. Xiamen Science and Technology, 2004(6): 11−15. [37] Shen Gongming, Heino M. An overview of marine fisheries management in China[J]. Marine Policy, 2014, 44: 265−272. doi: 10.1016/j.marpol.2013.09.012 [38] 侯秀琼. 我国海洋渔业的发展状况及对策[J]. 科技致富向导, 2012(12): 328−329.Hou Xiuqiong. The development and measures of Chinese marine fishery situation[J]. Guide of Sci-Tech Magazine, 2012(12): 328−329. [39] 李尚鲁. 我国沿海海洋渔业经济可持续发展对策[J]. 海洋开发与管理, 2009, 26(9): 72−75. doi: 10.3969/j.issn.1005-9857.2009.09.016Li Shanglu. The sustainable developing countermeasures of marine fishery economy in 8 coastal provinces of China[J]. Ocean Development and Management, 2009, 26(9): 72−75. doi: 10.3969/j.issn.1005-9857.2009.09.016 [40] 卢秀容. 中国海洋渔业资源可持续利用和有效管理研究[D]. 武汉: 华中农业大学, 2005.Lu Xiurong. Study on sustainable utilization and effective management of marine fishery resources in China[D]. Wuhan: Hua Zhong Agriculture University, 2005. [41] 慕永通. 我国海洋捕捞业的困境与出路[J]. 中国海洋大学学报(社会科学版), 2005(2): 1−5.Mu Yongtong. The predicament and outlet of China’s marine fishing[J]. Journal of Ocean University of China (Social Sciences Edition), 2005(2): 1−5. [42] 居占杰, 韩倩. 加强我国海洋渔业资源管理的思考[J]. 河北渔业, 2009(9): 48−50. doi: 10.3969/j.issn.1004-6755.2009.09.023Ju Zhanjie, Han Qian. The opinion of strengthening the managment of sea fishery resources in China[J]. Hebei Fisheries, 2009(9): 48−50. doi: 10.3969/j.issn.1004-6755.2009.09.023 [43] 唐议, 邹伟红, 胡振明. 基于统计数据的中国海洋渔业资源利用状况及管理分析[J]. 资源科学, 2009, 31(6): 1061−1068. doi: 10.3321/j.issn:1007-7588.2009.06.023Tang Yi, Zou Weihong, Hu Zhenming. An analysis of utilization status and management of marine fisheries resources in China based on statistics data[J]. Resources Science, 2009, 31(6): 1061−1068. doi: 10.3321/j.issn:1007-7588.2009.06.023 [44] Pauly D, Zeller D. Catch reconstructions reveal that global marine fisheries catches are higher than reported and declining[J]. Nature Communications, 2016, 7(1): 10244. doi: 10.1038/ncomms10244 [45] Pauly D, Zeller D. Comments on FAOs state of world fisheries and aquaculture (SOFIA 2016)[J]. Marine Policy, 2017, 77: 176−181. doi: 10.1016/j.marpol.2017.01.006 [46] Su Shu, Tang Yi, Chang Bowen, et al. Evolution of marine fisheries management in China from 1949 to 2019: how did China get here and where does China go next?[J]. Fish and Fisheries, 2020, 21(2): 435−452. doi: 10.1111/faf.12439 [47] Pauly D. Global fisheries: a brief review[J]. Journal of Biological Research-Thessaloniki, 2008, 9: 3−9. [48] Watson R, Pauly D. Systematic distortions in world fisheries catch trends[J]. Nature, 2001, 414(6863): 534−536. doi: 10.1038/35107050 [49] Martell S, Froese R. A simple method for estimating MSY from catch and resilience[J]. Fish and Fisheries, 2013, 14(4): 504−514. doi: 10.1111/j.1467-2979.2012.00485.x [50] Zhang Shanshan, Wang Yibang, Wang Yuanchao, et al. Assessment of 11 exploited fish and invertebrate populations in the Japan Sea using the CMSY and BSM methods[J]. Frontiers in Marine Science, 2020, 7: 525363. doi: 10.3389/fmars.2020.525363 [51] Winker H, Carvalho F, Sharma R, et al. Initial results for North and South Atlantic shortfin mako (Isurus oxyrinchus) stock assessments using the Bayesian surplus production model JABBA and the catch-resilience method CMSY[R]. Spain, Madrid: International Commission for the Conservation of Atlantic Tunas, 2017. [52] Rosenberg A A, Kleisner K M, Afflerbach J, et al. Applying a new ensemble approach to estimating stock status of marine fisheries around the world[J]. Conservation Letters, 2018, 11(1): e12363. doi: 10.1111/conl.12363 [53] Free C M, Jensen O P, Anderson S C, et al. Blood from a stone: performance of catch-only methods in estimating stock biomass status[J]. Fisheries Research, 2020, 223: 105452. doi: 10.1016/j.fishres.2019.105452 [54] Rosenberg A A, Fogarty M J, Cooper A B, et al. Developing new approaches to global stock status assessment and fishery production potential of the seas[R]. Rome: FAO, 2014: 175. -


计量
- 文章访问数: 856
- HTML全文浏览量: 347
- PDF下载量: 73
- 被引次数: 0
