

Comparations of environmental dose rate measurements for optically stimulated luminescence dating on marine sediments
-
摘要: 光释光测年作为一种沉积物绝对测年方法已在第四纪地质研究中得到了广泛应用,提高光释光测年精度和准确度一直是学术界关注的热点,长期以来人们对等效剂量测量程序和计算方法的研究十分丰富,而对环境剂量率的研究则相对较少。本文以琼西南海域ZBW钻孔岩心样品为例,利用电感耦合等离子质谱/发射光谱法(ICP-MS/OES)、中子活化分析(NAA)、γ谱仪法对海洋沉积物环境剂量率进行了对比测量。结果表明,在部分层段3种方法测量的结果存在差异,其原因为:(1)ICP-MS/OES前处理过程中重矿物中的U不完全溶解;(2)ICP-MS/OES测量结果为U、Th、K元素含量,包含了部分非放射性核素含量;(3)NAA测量用的样品量小,存在偶然性误差,样品中非放射性物质的稀释作用影响测量结果;(4)样品中存在铀系不平衡现象,结合研究区沉积环境和高纯锗γ谱仪测量结果进行对比分析表明,铀系不平衡主要来源于自生铀吸收,对环境剂量率的影响约为11%。Abstract: Optically stimulated luminescence (OSL) dating as a absolute dating method for sediments has been widely used in Quaternary studies. Improving the accuracy and precision of OSL dating has been a hot spot in academic research. However, for a long time, there have been numerous studies on equivalent dose measurement procedures and calculation methods, and relatively few studies on environmental dose rates. In this paper, we conducted OSL chronology study on marine sediment samples obtained from the Borehole ZBW in the southwestern of Hainan Province. The contents of uranium, thorium and potassium in the samples were measured by inductively coupled plasma mass spectrometry/optical emission spectrometry (ICP-MS/OES), neutron activation analysis (NAA) and γ-ray spectrometer, respectively. The results show that there are differences in the results measured by the three methods in some strata, and the reasons could be: (1) incomplete dissolution of U in heavy minerals during the ICP-MS/OES pretreatment process; (2) the ICP-MS/OES measurement results are the elemental contents of U, Th, and K, which include some non-radionuclide contents; (3) the small sample size used for NAA, which was subject to chance errors, and the dilution effect of non-radioactive material in the sample affects the measurement results; (4) there is an imbalance of uranium system in the sample. Combined with the sedimentary environment in the study area and the data measured by HPGe γ-ray spectrometer, the results show that the uranium imbalance originates from the autogenous uranium absorption phenomenon, and the effect on the environmental dose rate is about 11%.
-
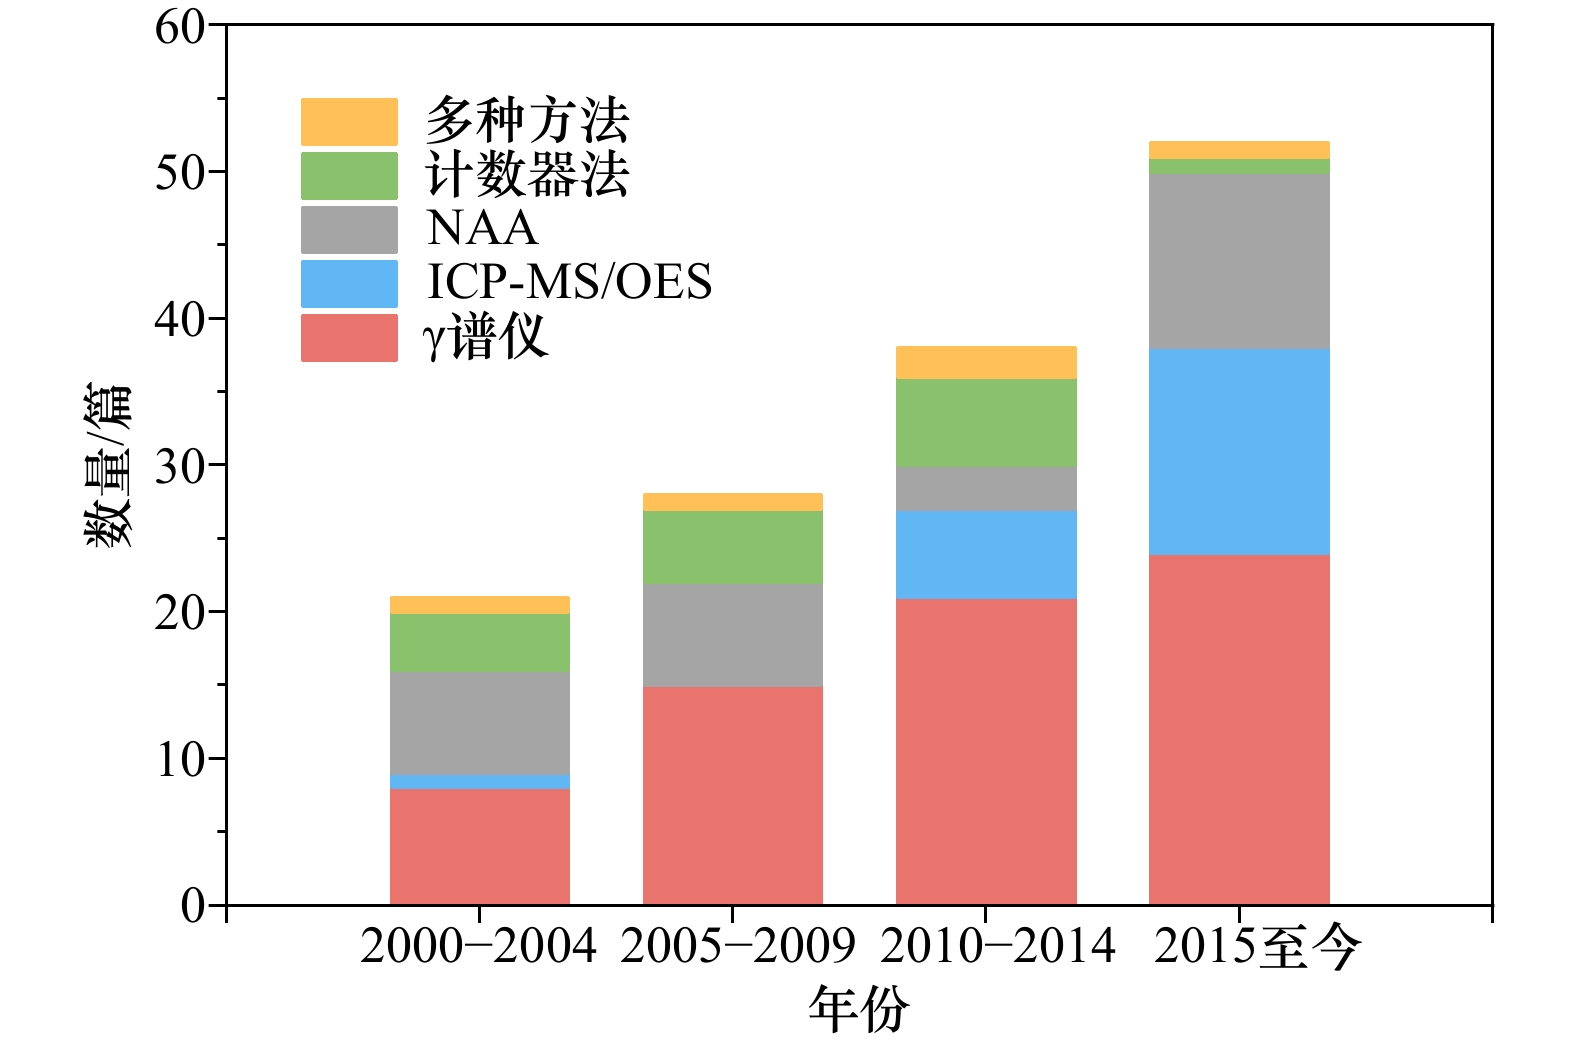
图 1 2000年以来国内外海洋沉积物环境剂量率测量方法统计
Fig. 1 Statistics of environmental dose rate measurements for marine sediments in the world since 2000

图 2 ZBW钻孔位置及光释光样品取样位置图
Fig. 2 Locations of Borehole ZBW and optically stimulated luminescence samples
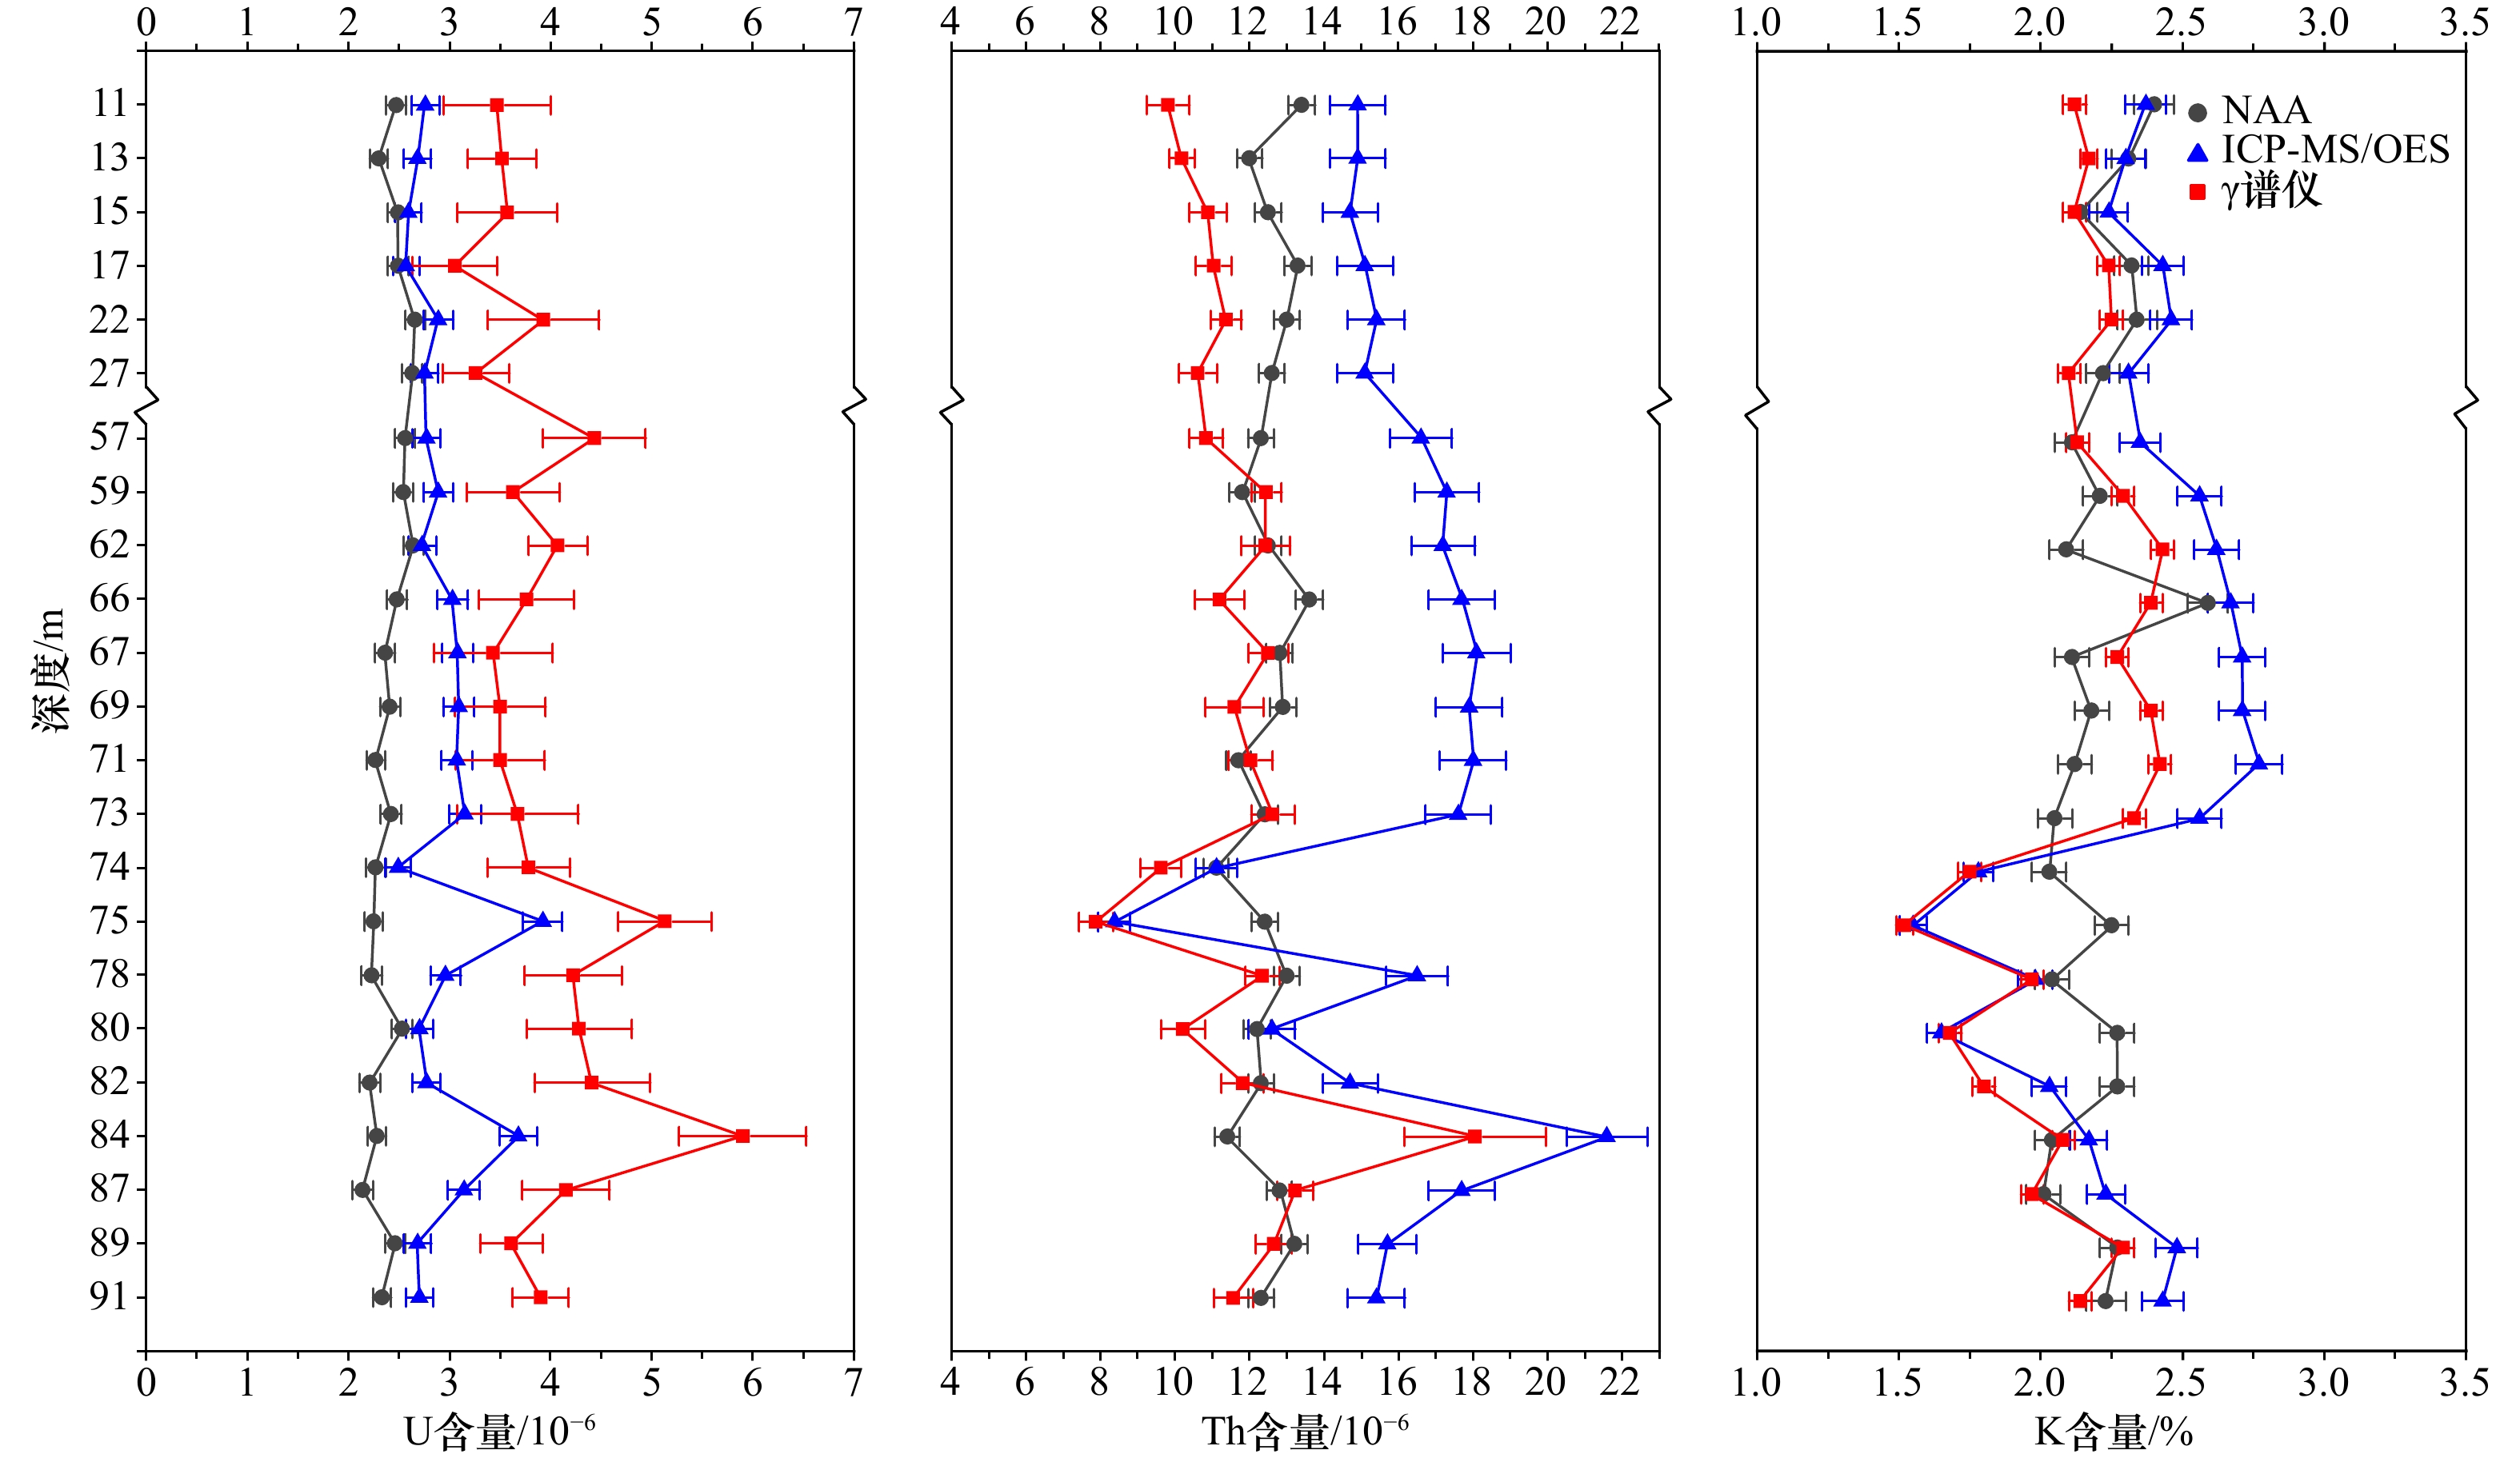
图 3 NAA,ICP-MS/OES和γ谱仪法测量的U、Th、K含量结果对比
Fig. 3 Comparison of the results of U, Th and K contents measured by NAA, ICP-MS/OES and γ-ray spectrometry
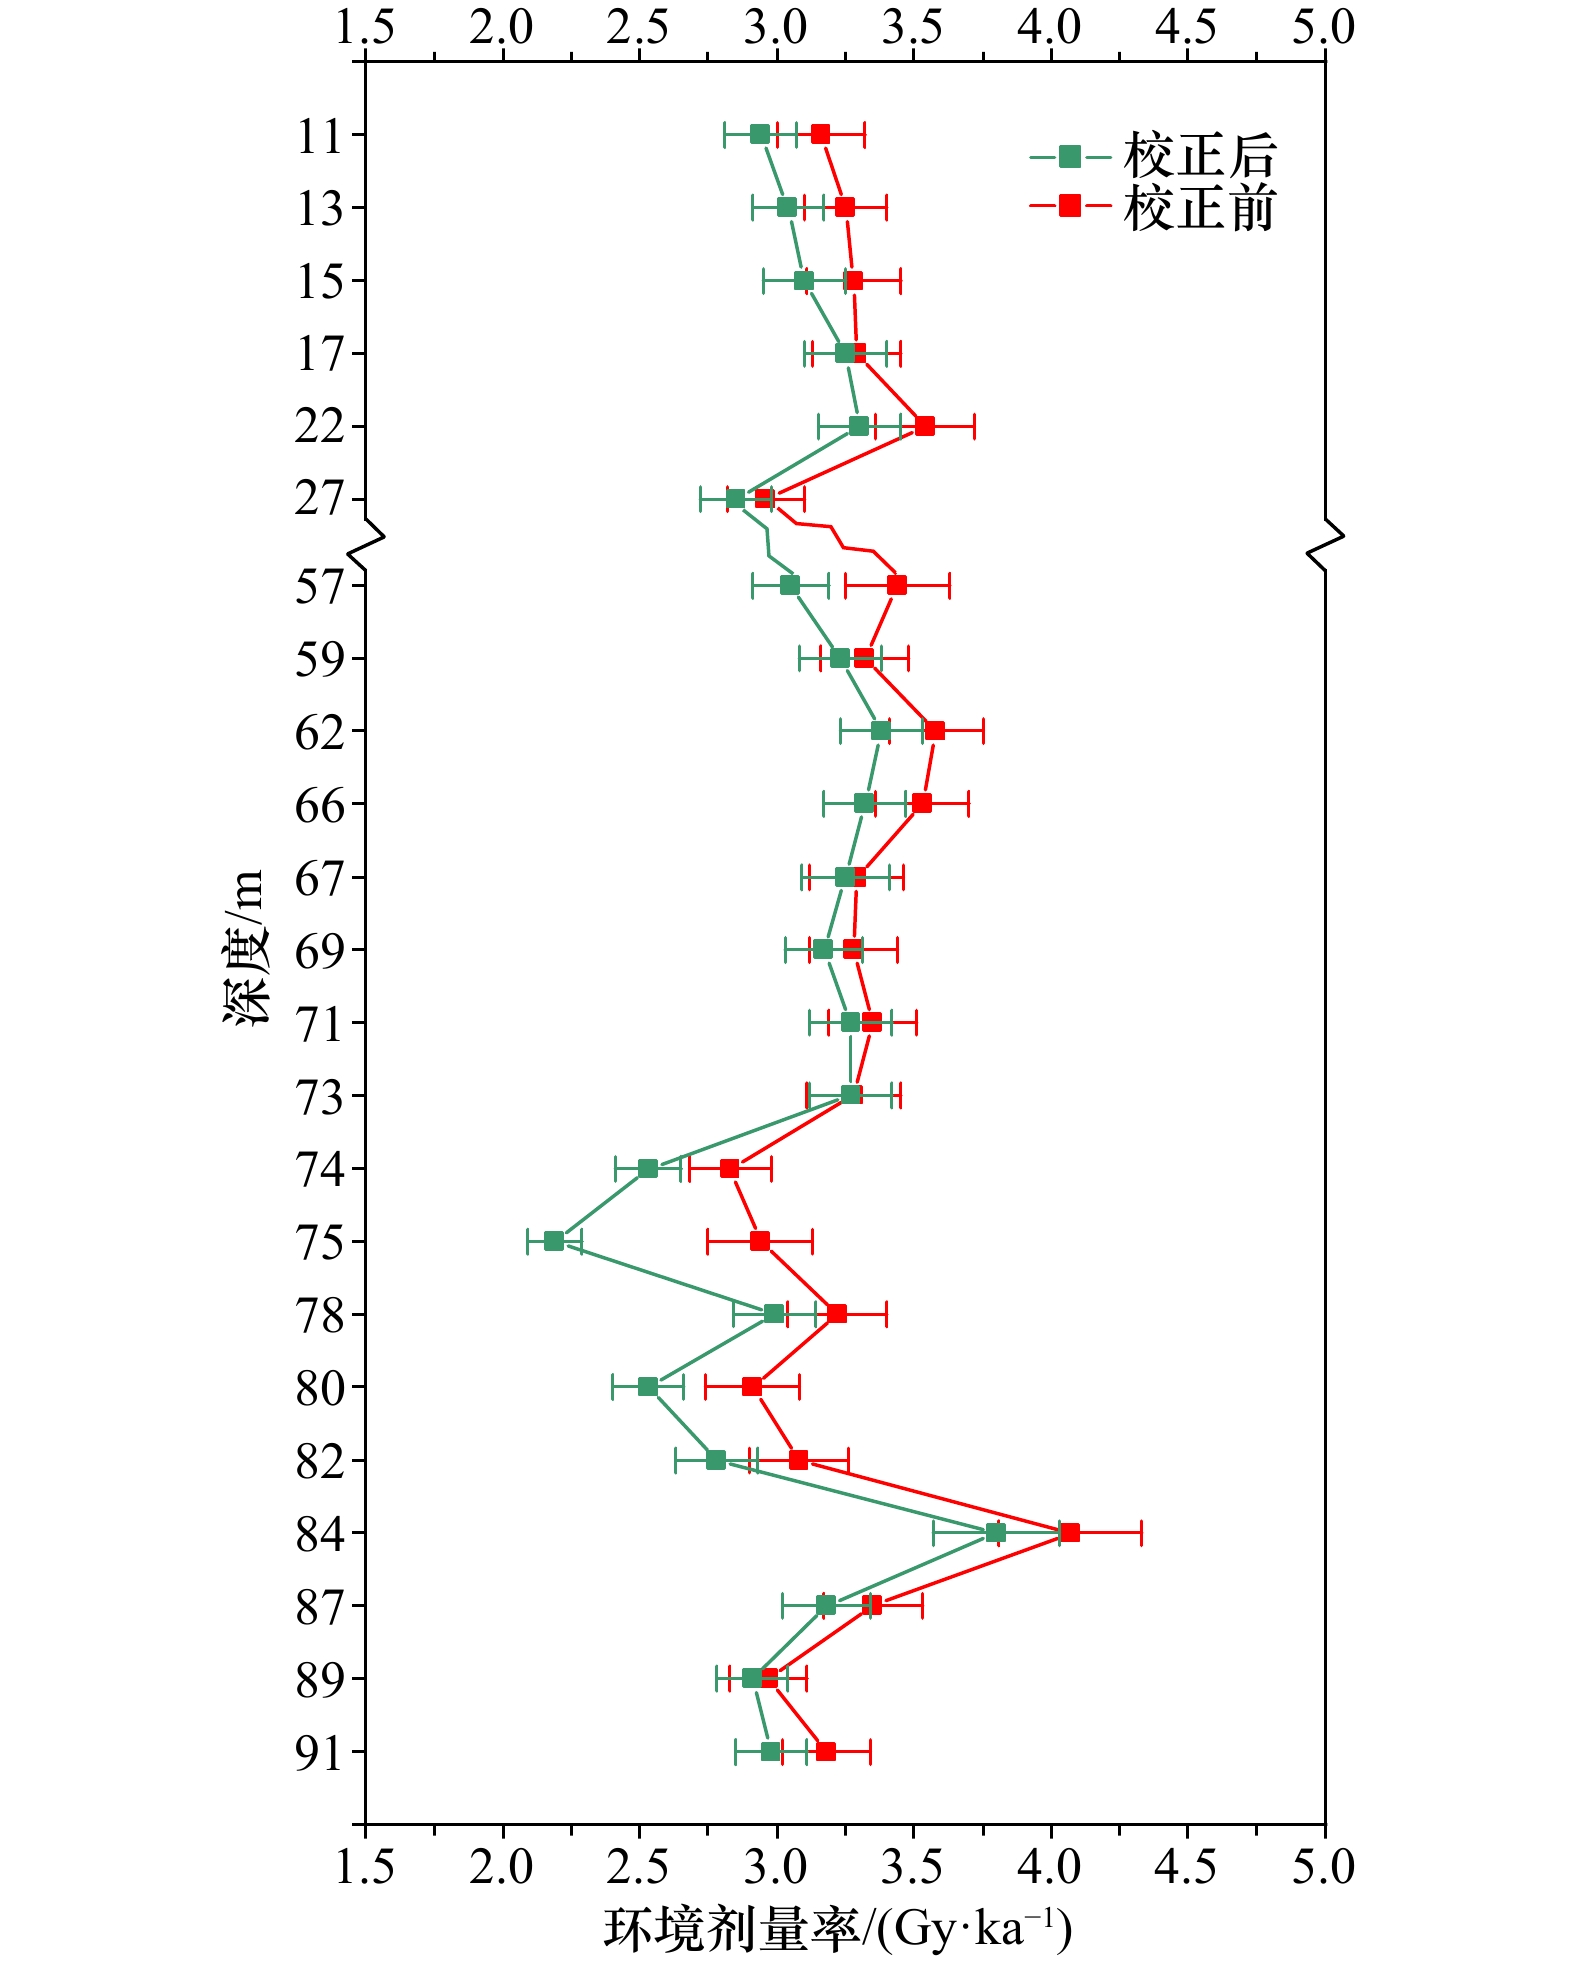
图 5 自生铀校正前后环境剂量率测量结果对比
Fig. 5 Comparison of environmental dose rates results before and after authigenic uranium correction
表 1 核素的特征γ射线能量和分支比
Tab. 1 Characteristic γ-ray energies and branching ratios of radionuclides
特征γ射线能量和分支比 测量核素 能量/keV 分支比/% 238U 234Th 63.3 4.8 92.6 2.8 232Th 228Ac 338.3 11.3 911.2 26.6 969.0 16.2 40K 40K 1460.8 10.6  下载: 导出CSV
表 2 实验样品的U、Th、K含量以及环境剂量率结果对比
Tab. 2 Comparison of U, Th and K contents and environmental dose rates of experimental samples
样品号 深度/m NAA ICP-MS/OES 高纯锗γ谱仪 U含量/
10−6误差/
10−6Th含量/
10−6误差/
10−6K含量/
%误差/
%D/
(Gy·ka−1)误差 U含量/
10−6误差/
10−6Th含量/
10−6误差/
10−6K含量/
%误差/
%D/
(Gy·ka−1)误差 U含量/
10−6误差/
10−6Th含量/
10−6误差/
10−6K含量/
%误差/
%D/
(Gy·ka−1)误差 ZBW-12 11 2.47 0.10 13.4 0.36 2.4 0.07 3.38 0.15 2.76 0.14 14.9 0.75 2.37 0.07 3.53 0.16 3.47 0.53 9.81 0.57 2.12 0.04 3.16 0.16 ZBW-14 13 2.3 0.09 12 0.34 2.31 0.06 3.18 0.14 2.68 0.13 14.9 0.75 2.3 0.07 3.48 0.16 3.52 0.34 10.18 0.34 2.17 0.03 3.25 0.15 ZBW-17 15 2.49 0.10 12.5 0.35 2.14 0.06 3.14 0.14 2.59 0.13 14.7 0.74 2.24 0.07 3.40 0.16 3.57 0.49 10.88 0.50 2.12 0.04 3.28 0.17 ZBW-18 17 2.49 0.10 13.3 0.36 2.32 0.06 3.38 0.15 2.57 0.13 15.1 0.76 2.43 0.07 3.61 0.17 3.05 0.42 11.03 0.47 2.24 0.04 3.29 0.16 ZBW-24 22 2.66 0.10 13 0.35 2.34 0.07 3.41 0.15 2.89 0.14 15.4 0.77 2.46 0.07 3.73 0.17 3.93 0.55 11.37 0.42 2.25 0.04 3.54 0.18 ZBW-29 27 2.63 0.10 12.6 0.35 2.22 0.06 3.04 0.14 2.75 0.14 15.1 0.76 2.31 0.07 3.30 0.15 3.26 0.33 10.61 0.51 2.10 0.04 2.96 0.14 ZBW-60 57 2.56 0.10 12.3 0.35 2.11 0.06 3.07 0.14 2.77 0.14 16.6 0.83 2.35 0.07 3.61 0.17 4.43 0.51 10.83 0.45 2.13 0.04 3.44 0.19 ZBW-62 59 2.54 0.10 11.8 0.34 2.21 0.06 2.96 0.13 2.89 0.14 17.3 0.87 2.56 0.08 3.66 0.17 3.63 0.46 12.45 0.41 2.29 0.04 3.32 0.16 ZBW-65 62 2.64 0.10 12.5 0.35 2.09 0.06 2.99 0.14 2.73 0.14 17.2 0.86 2.62 0.08 3.72 0.17 4.07 0.29 12.43 0.65 2.43 0.04 3.58 0.17 ZBW-69 66 2.48 0.10 13.6 0.36 2.59 0.07 3.53 0.15 3.03 0.15 17.7 0.89 2.67 0.08 4.02 0.19 3.76 0.47 11.20 0.66 2.39 0.04 3.53 0.17 ZBW-70 67 2.36 0.10 12.8 0.35 2.11 0.06 2.94 0.13 3.08 0.15 18.1 0.91 2.71 0.08 3.90 0.18 3.43 0.59 12.50 0.53 2.27 0.04 3.29 0.17 ZBW-72 69 2.41 0.10 12.9 0.35 2.18 0.06 2.96 0.13 3.09 0.15 17.9 0.90 2.71 0.08 3.83 0.18 3.50 0.45 11.59 0.78 2.39 0.04 3.28 0.16 ZBW-74 71 2.27 0.09 11.7 0.33 2.12 0.06 2.83 0.13 3.07 0.15 18 0.90 2.77 0.08 3.90 0.18 3.50 0.44 12.02 0.59 2.42 0.04 3.35 0.16 ZBW-76 73 2.42 0.10 12.4 0.35 2.05 0.06 2.78 0.13 3.15 0.16 17.6 0.88 2.56 0.08 3.64 0.17 3.67 0.60 12.62 0.58 2.33 0.04 3.28 0.17 ZBW-77 74 2.27 0.10 11.1 0.34 2.03 0.06 2.78 0.12 2.49 0.12 11.1 0.56 1.78 0.05 2.65 0.13 3.78 0.41 9.61 0.55 1.75 0.04 2.83 0.15 ZBW-78 75 2.25 0.09 12.4 0.35 2.25 0.06 3.1 0.14 3.92 0.20 8.36 0.42 1.55 0.05 2.70 0.15 5.13 0.46 7.87 0.46 1.52 0.03 2.94 0.19 ZBW-81 78 2.23 0.10 13 0.35 2.04 0.06 2.85 0.13 2.96 0.15 16.5 0.83 1.98 0.06 3.21 0.17 4.22 0.48 12.34 0.46 1.97 0.04 3.22 0.18 ZBW-84 80 2.53 0.10 12.2 0.36 2.27 0.06 3.06 0.13 2.7 0.14 12.6 0.63 1.65 0.05 2.68 0.14 4.28 0.52 10.21 0.59 1.68 0.04 2.91 0.17 ZBW-86 82 2.21 0.10 12.3 0.35 2.27 0.06 2.94 0.13 2.77 0.14 14.7 0.74 2.03 0.06 3.06 0.15 4.41 0.57 11.81 0.57 1.80 0.04 3.08 0.18 ZBW-88 84 2.28 0.09 11.4 0.34 2.04 0.06 2.75 0.12 3.68 0.18 21.6 1.08 2.17 0.07 3.86 0.21 5.90 0.63 18.06 1.91 2.08 0.04 4.07 0.26 ZBW-91 87 2.14 0.10 12.8 0.34 2.01 0.06 2.86 0.13 3.14 0.16 17.7 0.89 2.23 0.07 3.60 0.18 4.15 0.43 13.22 0.48 1.97 0.04 3.35 0.18 ZBW-94 89 2.46 0.10 13.2 0.35 2.27 0.06 2.75 0.12 2.68 0.13 15.7 0.79 2.48 0.07 3.08 0.14 3.61 0.31 12.65 0.48 2.29 0.04 2.97 0.14 ZBW-96 91 2.33 0.09 12.3 0.35 2.23 0.07 2.93 0.13 2.7 0.14 15.4 0.77 2.43 0.07 3.36 0.15 3.90 0.28 11.56 0.53 2.14 0.04 3.18 0.16
下载: 导出CSV
表 3 铀放射系中氡及其子体的占比(%)
Tab. 3 Percentage of radon and its daughters in the uranium radioactive system (%)
类别 α β γ 铀系 54.7 59.5 94.6 钍系 58.1 63.8 63.4
下载: 导出CSV
表 4 样品不密封和密封测量结果对比
Tab. 4 Comparison of results of unsealed and sealed measurements of samples
ZBW-18 ZBW-24 ZBW-62 ZBW-76 比活度/(Bq·kg−1) 比值 比活度/(Bq·kg−1) 比值 比活度/(Bq·kg−1) 比值 比活度/(Bq·kg−1) 比值 Rn-222 (不密封) 29.06 0.95 26.68 0.95 26.08 0.92 27.13 0.96 Rn-222 (密封) 30.51 28.23 28.50 28.40
下载: 导出CSV
表 5 样品238U和226Ra比活度及Uauth含量对比
Tab. 5 Comparison of 238U and 226Ra and Uauth contents in samples
样品编号 深度/m 238U比活度/(Bq·kg−1) 误差 226Ra比活度/(Bq·kg−1) 误差 Ra/U 误差 Uauth比活度/(Bq·kg−1) 误差 Uauth/U ZBW-12 11 43.16 6.59 28.85 1.17 0.67 0.11 11.24 0.46 0.26 ZBW-14 13 43.83 4.17 29.51 0.71 0.67 0.07 10.72 0.28 0.24 ZBW-17 15 44.43 6.14 30.92 1.07 0.70 0.10 9.03 0.41 0.20 ZBW-18 17 37.90 5.22 30.51 0.99 0.80 0.11 2.01 0.38 0.05 ZBW-24 22 48.85 6.88 28.23 0.94 0.58 0.08 11.85 0.34 0.24 ZBW-29 27 40.61 4.11 36.23 1.37 0.89 0.10 6.09 0.42 0.15 ZBW-60 57 55.07 6.32 36.75 1.33 0.67 0.08 19.84 0.36 0.36 ZBW-62 59 45.12 5.69 28.49 1.12 0.63 0.08 4.61 0.33 0.10 ZBW-65 62 50.59 3.59 28.35 1.19 0.56 0.05 10.15 0.52 0.20 ZBW-69 66 46.74 5.81 31.29 0.94 0.67 0.09 10.31 0.54 0.22 ZBW-70 67 42.64 7.32 30.16 1.29 0.71 0.13 1.99 0.43 0.05 ZBW-72 69 43.50 5.64 33.67 1.21 0.77 0.10 5.80 0.63 0.13 ZBW-74 71 43.53 5.44 32.27 1.29 0.74 0.10 4.43 0.48 0.10 ZBW-76 73 45.60 7.44 28.40 1.20 0.62 0.10 4.54 0.47 0.10 ZBW-77 74 46.97 5.13 25.41 0.90 0.54 0.06 15.71 0.45 0.33 ZBW-78 75 63.82 5.67 24.73 1.24 0.39 0.04 38.22 0.37 0.60 ZBW-81 78 52.45 6.03 34.71 1.19 0.66 0.08 12.31 0.37 0.23 ZBW-84 80 53.28 6.48 27.69 0.90 0.52 0.07 20.08 0.48 0.38 ZBW-86 82 54.79 7.11 36.96 1.21 0.67 0.09 16.37 0.46 0.30 ZBW-88 84 73.44 7.78 33.70 0.96 0.46 0.05 14.69 1.55 0.20 ZBW-91 87 51.57 5.39 38.32 1.30 0.74 0.08 8.56 0.39 0.17 ZBW-94 89 44.95 3.83 32.65 1.14 0.73 0.07 3.79 0.38 0.08 ZBW-96 91 48.47 3.51 30.92 1.12 0.64 0.05 10.87 0.43 0.22
下载: 导出CSV
-
[1] Huntley D J, Godfrey-Smith D I, Thewalt M L W. Optical dating of sediments[J]. Nature, 1985, 313(5998): 105−107. doi: 10.1038/313105a0 [2] 张克旗. 释光测年中环境剂量率影响因素研究[J]. 地质力学学报, 2012, 18(1): 62−71.Zhang Keqi. Quantitative calculations of environmental dose rate at different influencing factors in luminescence dating[J]. Journal of Geomechanics, 2012, 18(1): 62−71. [3] 李虎侯. 光释光断代[J]. 核电子学与探测技术, 2000, 20(3): 217−228.Li Huhou. Optical luminescence dating[J]. Nuclear Electronics & Detection Technology, 2000, 20(3): 217−228. [4] 张克旗, 吴中海, 吕同艳, 等. 光释光测年法——综述及进展[J]. 地质通报, 2015, 34(1): 183−203.Zhang Keqi, Wu Zhonghai, Lü Tongyan, et al. Review and progress of OSL dating[J]. Geological Bulletin of China, 2015, 34(1): 183−203. [5] 卢演俦. 沉积物的光释光(OSL)测年简介[J]. 地质地球化学, 1990(1): 36−40.Lu Yanchou. Introduction to optical release light (OSL) dating of sediments[J]. Earth and Environment, 1990(1): 36−40. [6] Murray A S, Wintle A G. Luminescence dating of quartz using an improved single-aliquot regenerative-dose protocol[J]. Radiation Measurements, 2000, 32(1): 57−73. doi: 10.1016/S1350-4487(99)00253-X [7] Singarayer J S, Bailey R M. Further investigations of the quartz optically stimulated luminescence components using linear modulation[J]. Radiation Measurements, 2003, 37(4/5): 451−458. [8] Thomas P J, Murray A S, Kjær K H, et al. Optically stimulated luminescence (OSL) dating of glacial sediments from Arctic Russia-depositional bleaching and methodological aspects[J]. Boreas, 2006, 35(3): 587−599. doi: 10.1080/03009480600781933 [9] Mauz B, Baeteman C, Bungenstock F, et al. Optical dating of tidal sediments: potentials and limits inferred from the North Sea coast[J]. Quaternary Geochronology, 2010, 5(6): 667−678. doi: 10.1016/j.quageo.2010.05.004 [10] Fuchs M, Kreutzer S, Fischer M, et al. OSL and IRSL dating of raised beach sand deposits along the southeastern coast of Norway[J]. Quaternary Geochronology, 2012, 10: 195−200. doi: 10.1016/j.quageo.2011.11.009 [11] Chen Guangquan, Yi Liang, Xu Xingyong, et al. Testing the standardized growth curve (SGC) to OSL dating coastal sediments from the South Bohai Sea, China[J]. Geochronometria, 2013, 40(2): 101−112. doi: 10.2478/s13386-013-0103-z [12] Kim J C, Cheong D, Shin S, et al. OSL chronology and accumulation rate of the Nakdong deltaic sediments, southeastern Korean Peninsula[J]. Quaternary Geochronology, 2015, 30: 245−250. doi: 10.1016/j.quageo.2015.01.006 [13] Chen Jie, Yang Taibao, Matishov G G, et al. A luminescence dating study of loess deposits from the Beglitsa section in the Sea of Azov, Russia[J]. Quaternary International, 2018, 478: 27−37. doi: 10.1016/j.quaint.2017.11.017 [14] Möller P, Benediktsson Í Ö, Anjar J, et al. Data set on sedimentology, palaeoecology and chronology of Middle to Late Pleistocene deposits on the Taimyr Peninsula, Arctic Russia[J]. Data in Brief, 2019, 25: 104267. doi: 10.1016/j.dib.2019.104267 [15] Aitken M J. Thermoluminescence Dating[M]. London: Academic Press, 1985. [16] Aitken M J. An Introduction to Optical Dating[M]. Oxford: Oxford University Press, 1998. [17] Guérin G, Mercier N, Nathan R, et al. On the use of the infinite matrix assumption and associated concepts: a critical review[J]. Radiation Measurements, 2012, 47(9): 778−785. doi: 10.1016/j.radmeas.2012.04.004 [18] Brennan B J. Beta doses to spherical grains[J]. Radiation Measurements, 2003, 37(4/5): 299−303. [19] Mejdahl V. Thermoluminescence dating: beta-dose attenuation in quartz grains[J]. Archaeometry, 1979, 21(1): 61−72. doi: 10.1111/j.1475-4754.1979.tb00241.x [20] 王同利. 释光测年中几种年剂量测量方法的对比[D]. 北京: 中国地震局地质研究所, 2006.Wang Tongli. A comparison of methods for the annual radiation dose determination in luminescence dating[D]. Beijing: Institute of Geology, China Earthquake Administrator, 2006. [21] Chen Yawen, Chen Y G, Murray A S, et al. Luminescence dating of neotectonic activity on the southwestern coastal plain, Taiwan[J]. Quaternary Science Reviews, 2003, 22(10/13): 1223−1229. [22] Murray A, Buylaert J P, Thiel C. A luminescence dating intercomparison based on a Danish beach-ridge sand[J]. Radiation Measurements, 2015, 81: 32−38. doi: 10.1016/j.radmeas.2015.02.012 [23] Jankowski N R, Jacobs Z, Goldberg P. Optical dating and soil micromorphology at MacCauley’s Beach, New South Wales, Australia[J]. Earth Surface Processes and Landforms, 2015, 40(2): 229−242. doi: 10.1002/esp.3622 [24] 姜涛, 胡亦潘, 周从艳, 等. 海洋沉积物释光测年现状与展望[J]. 地质科技通报, 2022, 41(5): 31−54.Jiang Tao, Hu Yipan, Zhou Congyan, et al. A review of luminescence dating on marine sediments[J]. Bulletin of Geological Science and Technology, 2022, 41(5): 31−54. [25] Sugisaki S, Buylaert J P, Murray A S, et al. High resolution OSL dating back to MIS 5e in the central Sea of Okhotsk[J]. Quaternary Geochronology, 2010, 5(2/3): 293−298. [26] Madsen A T, Murray A S, Andersen T J, et al. Optically stimulated luminescence dating of young estuarine sediments: a comparison with 210Pb and 137Cs dating[J]. Marine Geology, 2005, 214(1/3): 251−268. [27] Madsen A T, Murray A S, Andersen T J, et al. Temporal changes of accretion rates on an estuarine salt marsh during the Late Holocene-Reflection of local sea level changes? The Wadden Sea, Denmark[J]. Marine Geology, 2007, 242(4): 221−233. doi: 10.1016/j.margeo.2007.03.001 [28] Madsen A T, Murray A S, Andersen T J, et al. Optical dating of young tidal sediments in the Danish Wadden Sea[J]. Quaternary Geochronology, 2007, 2(1/4): 89−94. [29] Madsen A T, Murray A S, Andersen T J, et al. Spatial and temporal variability of sediment accumulation rates on two tidal flats in Lister Dyb tidal basin, Wadden Sea, Denmark[J]. Earth Surface Processes and Landforms, 2010, 35(13): 1556−1572. doi: 10.1002/esp.1999 [30] Bateman M D, Holmes P J, Carr A S, et al. Aeolianite and barrier dune construction spanning the last two glacial–interglacial cycles from the southern Cape coast, South Africa[J]. Quaternary Science Reviews, 2004, 23(14/15): 1681−1698. [31] Bateman M D, Carr A S, Dunajko A C, et al. The evolution of coastal barrier systems: a case study of the Middle-Late Pleistocene Wilderness barriers, South Africa[J]. Quaternary Science Reviews, 2011, 30(1/2): 63−81. [32] Sugisaki S, Buylaert J P, Murray A S, et al. High resolution optically stimulated luminescence dating of a sediment core from the southwestern Sea of Okhotsk[J]. Geochemistry Geophysics Geosystems, 2012, 13(5): Q0AA22. [33] Anderson A, Roberts R, Dickinson W, et al. Times of sand: sedimentary history and archaeology at the Sigatoka Dunes, Fiji[J]. Geoarchaeology, 2006, 21(2): 131−154. doi: 10.1002/gea.20094 [34] Polymeris G S, Kitis G, Liolios A K, et al. Luminescence dating of the top of a deep water core from the NESTOR site near the Hellenic Trench, East Mediterranean Sea[J]. Quaternary Geochronology, 2009, 4(1): 68−81. doi: 10.1016/j.quageo.2008.05.001 [35] Jakobsson M, Backman J, Murray A, et al. Optically stimulated luminescence dating supports central Arctic Ocean cm-scale sedimentation rates[J]. Geochemistry, Geophysics, Geosystems, 2003, 4(2): 1016. [36] Berger G W. Trans-arctic-ocean tests of fine-silt luminescence sediment dating provide a basis for an additional geochronometer for this region[J]. Quaternary Science Reviews, 2006, 25(19/20): 2529−2551. [37] Armitage S J. Optically stimulated luminescence dating of ocean drilling program core 658B: complications arising from authigenic uranium uptake and lateral sediment movement[J]. Quaternary Geochronology, 2015, 30: 270−274. doi: 10.1016/j.quageo.2015.03.002 [38] Armitage S J, Pinder R C. Testing the applicability of optically stimulated luminescence dating to ocean drilling program cores[J]. Quaternary Geochronology, 2017, 39: 124−130. doi: 10.1016/j.quageo.2017.02.008 [39] Olley J M, De Deckker P, Roberts R G, et al. Optical dating of deep-sea sediments using single grains of quartz: a comparison with radiocarbon[J]. Sedimentary Geology, 2004, 169(3/4): 175−189. [40] Zander A, Degering D, Preusser F, et al. Optically stimulated luminescence dating of sublittoral and intertidal sediments from Dubai, UAE: radioactive disequilibria in the uranium decay series[J]. Quaternary Geochronology, 2007, 2(1/4): 123−128. [41] De Deckker P, Arnold L J, van der Kaars S, et al. Marine isotope stage 4 in Australasia: a full glacial culminating 65, 000 years ago−global connections and implications for human dispersal[J]. Quaternary Science Reviews, 2019, 204: 187−207. doi: 10.1016/j.quascirev.2018.11.017 [42] Chivas A R, Garcı́a A, van der Kaars S, et al. Sea-level and environmental changes since the last interglacial in the Gulf of Carpentaria, Australia: an overview[J]. Quaternary International, 2001, 83−85: 19−46. doi: 10.1016/S1040-6182(01)00029-5 [43] Jacobs Z, Roberts R G, Lachlan T J, et al. Development of the SAR TT-OSL procedure for dating Middle Pleistocene dune and shallow marine deposits along the southern Cape coast of South Africa[J]. Quaternary Geochronology, 2011, 6(5): 491−513. [44] Wang Yong, Long Hao, Yi Liang, et al. OSL chronology of a sedimentary sequence from the inner-shelf of the East China Sea and its implication on post-glacial deposition history[J]. Quaternary Geochronology, 2015, 30: 282−287. doi: 10.1016/j.quageo.2015.06.005 [45] 陈泓君, 黄文凯, 邱燕. 海南岛西南海域晚第四纪古水深反演[J]. 海洋地质与第四纪地质, 2017, 37(6): 128−139.Chen Hongjun, Huang Wenkai, Qiu Yan. The inversion of Late Quaternary paleo-water depth in southwestern offshore Hainan Island[J]. Marine Geology & Quaternary Geology, 2017, 37(6): 128−139. [46] 田伟之, 倪邦发, 陈细林, 等. 中子活化分析在当代无机痕量分析计量学中的作用Ⅰ. 相对法中子活化分析(NAA)作为比较基准法资格的论证[J]. 核化学与放射化学, 2004, 26(3): 129−140.Tian Weizhi, Ni Bangfa, Chen Xilin, et al. Role of neutron activation analysis in metrology of modern inorganic trace analysis Ⅰ. Qualification of neutron activation analysis (NAA) as a primary ration method of measurement[J]. Journal of Nuclear and Radiochemistry, 2004, 26(3): 129−140. [47] 田伟之, 倪邦发, 王平生, 等. 中子活化分析在当代无机痕量分析计量学中的作用Ⅲ. NAA用于多元素取样行为的定量表征[J]. 核化学与放射化学, 2005, 27(2): 65−69.Tian Weizhi, Ni Bangfa, Wang Pingsheng, et al. Role of neutron activation analysis in metrology of modern inorganic trace analysis Ⅲ. NAA in characterization of sampling behavior for multielements[J]. Journal of Nuclear and Radiochemistry, 2005, 27(2): 65−69. [48] 秦亚丽, 陈喆, 吴伟明, 等. 光释光测年中铀、钍、钾的NAA分析[J]. 核电子学与探测技术, 2010, 30(12): 1653−1656. doi: 10.3969/j.issn.0258-0934.2010.12.025Qin Yali, Chen Zhe, Wu Weiming, et al. Determination of U, Th and K for optically stimulated luminescence dating by NAA[J]. Nuclear Electronics & Detection Technology, 2010, 30(12): 1653−1656. doi: 10.3969/j.issn.0258-0934.2010.12.025 [49] 陈敏, 张成江, 倪师军. 仪器中子活化法研究核设施周围土壤中的铀、钍、钾[J]. 核化学与放射化学, 2010, 32(5): 315−320.Chen Min, Zhang Chengjiang, Ni Shijun. Study on uranium, thorium, and potassium in soil around a nuclear installation by using INAA[J]. Journal of Nuclear and Radiochemistry, 2010, 32(5): 315−320. [50] 刘颖, 刘海臣, 李献华. 用ICP—MS准确测定岩石样品中的40余种微量元素[J]. 地球化学, 1996, 25(6): 552−558. doi: 10.3321/j.issn:0379-1726.1996.06.004Liu Ying, Liu Haichen, Li Xianhua. Simultaneous and precise determination of 40 trace elements in rock samples using ICP-MS[J]. Geochimica, 1996, 25(6): 552−558. doi: 10.3321/j.issn:0379-1726.1996.06.004 [51] 韩佳, 卢新卫, 庞奖励, 等. γ谱法和ICP-MS法测定黄土样品中铀、钍含量的比较[J]. 陕西师范大学学报(自然科学版), 2005, 33(2): 119−121.Han Jia, Lu Xinwei, Pang Jiangli, et al. Determination of uranium and thorium contents in loess by Gamma-ray (γ) spectrometry and ICP-MS[J]. Journal of Shaanxi Normal University (Natural Science Edition), 2005, 33(2): 119−121. [52] 李君利. 实验室γ能谱测量与分析[M]. 北京: 人民交通出版社股份有限公司, 2014: 25−109.Li Junli. Laboratory γ Energy Spectrum Measurement and Analysis[M]. Beijing: China Communications Press, 2014: 25−109. [53] 杨会丽, 陈杰. ORTEC GEM70P4-95 P型高纯锗γ谱仪的标定[J]. 核技术, 2012, 35(11): 854−858.Yang Huili, Chen Jie. Calibration of the ORTEC P type Ge γ-ray spectrometer[J]. Nuclear Techniques, 2012, 35(11): 854−858. [54] 何乐龙, 辛文彩, 张剑, 等. 海洋沉积物光释光测年中铀、钍、钾的γ能谱法分析[J]. 海洋地质前沿, 2018, 34(12): 68−76.He Lelong, Xin Wencai, Zhang Jian, et al. γ-Spectrometric determination of U, Th and K for OSL dating of marine sediments[J]. Marine Geology Frontiers, 2018, 34(12): 68−76. [55] Murray A, Arnold L J, Buylaert J P, et al. Optically stimulated luminescence dating using quartz[J]. Nature Reviews Methods Primers, 2021, 1(1): 72. doi: 10.1038/s43586-021-00068-5 [56] Durcan J A, King G E, Duller G A T. DRAC: dose rate and age calculator for trapped charge dating[J]. Quaternary Geochronology, 2015, 28: 54−61. doi: 10.1016/j.quageo.2015.03.012 [57] Guérin G, Mercier N, Adamiec G. Dose-rate conversion factors: update[J]. Ancient TL, 2011, 29(1): 5−8. [58] Brennan B J, Lyons R G, Phillips S W. Attenuation of alpha particle track dose for spherical grains[J]. International Journal of Radiation Applications and Instrumentation. Part D. Nuclear Tracks and Radiation Measurements, 1991, 18(1/2): 249−253. [59] Aitken M J, Xie J. Moisture correction for annual gamma dose[J]. Ancient TL, 1990, 8(2): 6−9. [60] Zimmerman D W. Thermoluminescent dating using fine grains from pottery[J]. Archaeometry, 1971, 13(1): 29−52. doi: 10.1111/j.1475-4754.1971.tb00028.x [61] Prescott J R, Hutton J T. Cosmic ray contributions to dose rates for luminescence and ESR dating: large depths and long-term time variations[J]. Radiation Measurements, 1994, 23(2/3): 497−500. [62] Henderson G M, Anderson R F. The U-series toolbox for paleoceanography[J]. Reviews in Mineralogy and Geochemistry, 2003, 52(1): 493−531. doi: 10.2113/0520493 [63] Forman S L, Pierson J, Smith R P, et al. Assessing the accuracy of thermoluminescence for dating baked sediments beneath late Quaternary lava flows, Snake River Plain, Idaho[J]. Journal of Geophysical Research: Solid Earth, 1994, 99(B8): 15569−15576. doi: 10.1029/94JB00806 [64] Tuo Fei, Zhang Qing, Zhang Jing, et al. Inter-comparison exercise for determination of 226Ra, 232Th and 40K in soil and building material[J]. Applied Radiation and Isotopes, 2010, 68(12): 2335−2338. doi: 10.1016/j.apradiso.2010.04.023 [65] Barnes C E, Cochran J K. Uranium removal in oceanic sediments and the oceanic U balance[J]. Earth and Planetary Science Letters, 1990, 97(1/2): 94−101. [66] Klinkhammer G P, Palmer M R. Uranium in the oceans: where it goes and why[J]. Geochimica et Cosmochimica Acta, 1991, 55(7): 1799−1806. doi: 10.1016/0016-7037(91)90024-Y [67] Chen J H, Edwards R L, Wasserburg G J. 238U, 234U and232Th in seawater[J]. Earth and Planetary Science Letters, 1986, 80(3/4): 241−251. [68] Cheng H, Edwards R L, Hoff J, et al. The half-lives of uranium-234 and thorium-230[J]. Chemical Geology, 2000, 169(1/2): 17−33. [69] Robinson L F, Belshaw N S, Henderson G M. U and Th concentrations and isotope ratios in modern carbonates and waters from the Bahamas[J]. Geochimica et Cosmochimica Acta, 2004, 68(8): 1777−1789. doi: 10.1016/j.gca.2003.10.005 [70] Anderson R F, Lehuray A P, Fleisher M Q, et al. Uranium deposition in Saanich inlet sediments, Vancouver Island[J]. Geochimica et Cosmochimica Acta, 1989, 53(9): 2205−2213. doi: 10.1016/0016-7037(89)90344-X -


计量
- 文章访问数: 567
- HTML全文浏览量: 204
- PDF下载量: 49
- 被引次数: 0
