

Regulation of phytoplankton distribution by characteristic water masses in the northern Chukchi Sea, Arctic
-
摘要: 通过楚科奇海北部–加拿大海盆西侧交接地带的生态调查,我们发现0~150 m海域水体中以融冰水(MW,0~20 m)、白令海夏季水(sBSW)和阿拉斯加沿岸流(ACW)等水团为主。水温和营养盐变化与水团息息相关,物理–生化的耦合作用进一步影响了浮游植物分布和群落结构。叶绿素a浓度最大值多位于约50 m深、富含营养盐的sBSW和ACW暖水团中。 sBSW和ACW中分别以小型(占比约74%)和微微型(占比约65%)浮游植物为主。藻华初期,溶解无机氮(DIN)虽呈相对限制状态,但仍高于浮游植物生长所需阈值。双单元混合模型显示:浮游植物对氮去除明显,氮吸收量与叶绿素a浓度呈正比,且在温度略高的ACW水团中氮吸收量高于sBSW水团。在北极变暖、波弗特流涡增强以及ACW和sBSW营养盐补给下,该区域的浮游植物的叶绿素a浓度(均值:(0.327±0.163)mg/m3,范围:0.04~0.69 mg/ m3)与历史数据相比有所提高。这将增加北极海区的碳吸收通量,有利于其作为碳汇区的发展。Abstract: Based on ecological observations of the northern Chukchi Sea and the western Canada Basin junction zore, We found that within the upper 150 m, the phytoplankton distribution was complicated by dominant water masses: the Melting Water (MW), the Alaskan Coastal Water (ACW) transported with the Beaufort Gyre (BG), and summer Bering Sea Water (sBSW). The changes of temperature and nutrients were closely related to water mass, and the physical-biochemical coupling effect further affects the distribution and community structure of phytoplankton. The Chl a maximum concentration layer often existed in the dim water of about 50 m depth. In the nutrient-rich sBSW and ACW dominant water-mass, phytoplankton were dominant by netplankton (74% of the total Chl a concentration) and picoplankton (65% of the total Chl a concentration). In the early stage of bloom, dissolved inorganic nitrogen (DIN) was relative limited to phosphate, while bioavailable nitrogen was still above the absolute limit threshold. The DIN-Salinity conservative mixing model showed that phytoplankton significantly removed nitrogen, and the nitrogen-uptake was positively related to Chl a concentration. The amount of nitrogen uptake in ACW water mass with slightly higher temperature was higher than that in sBSW water mass. In response to Arctic warming, the enhanced Beaufort Gyre, and nutrient supply from ACW and sBSW, Chl a concentration of phytoplankton in this region (ranged from 0.04−0.69 mg/m3 with an average of (0.327±0.163) mg/m3) were higher than the historical observations. This will increase the carbon absorption flux in the Arctic sea area, which is conducive to its development as a carbon sink area.
-
Key words:
- Chukchi Sea /
- Beaufort Gyre /
- size-fractionated Chl a /
- temperature /
- water masses
-
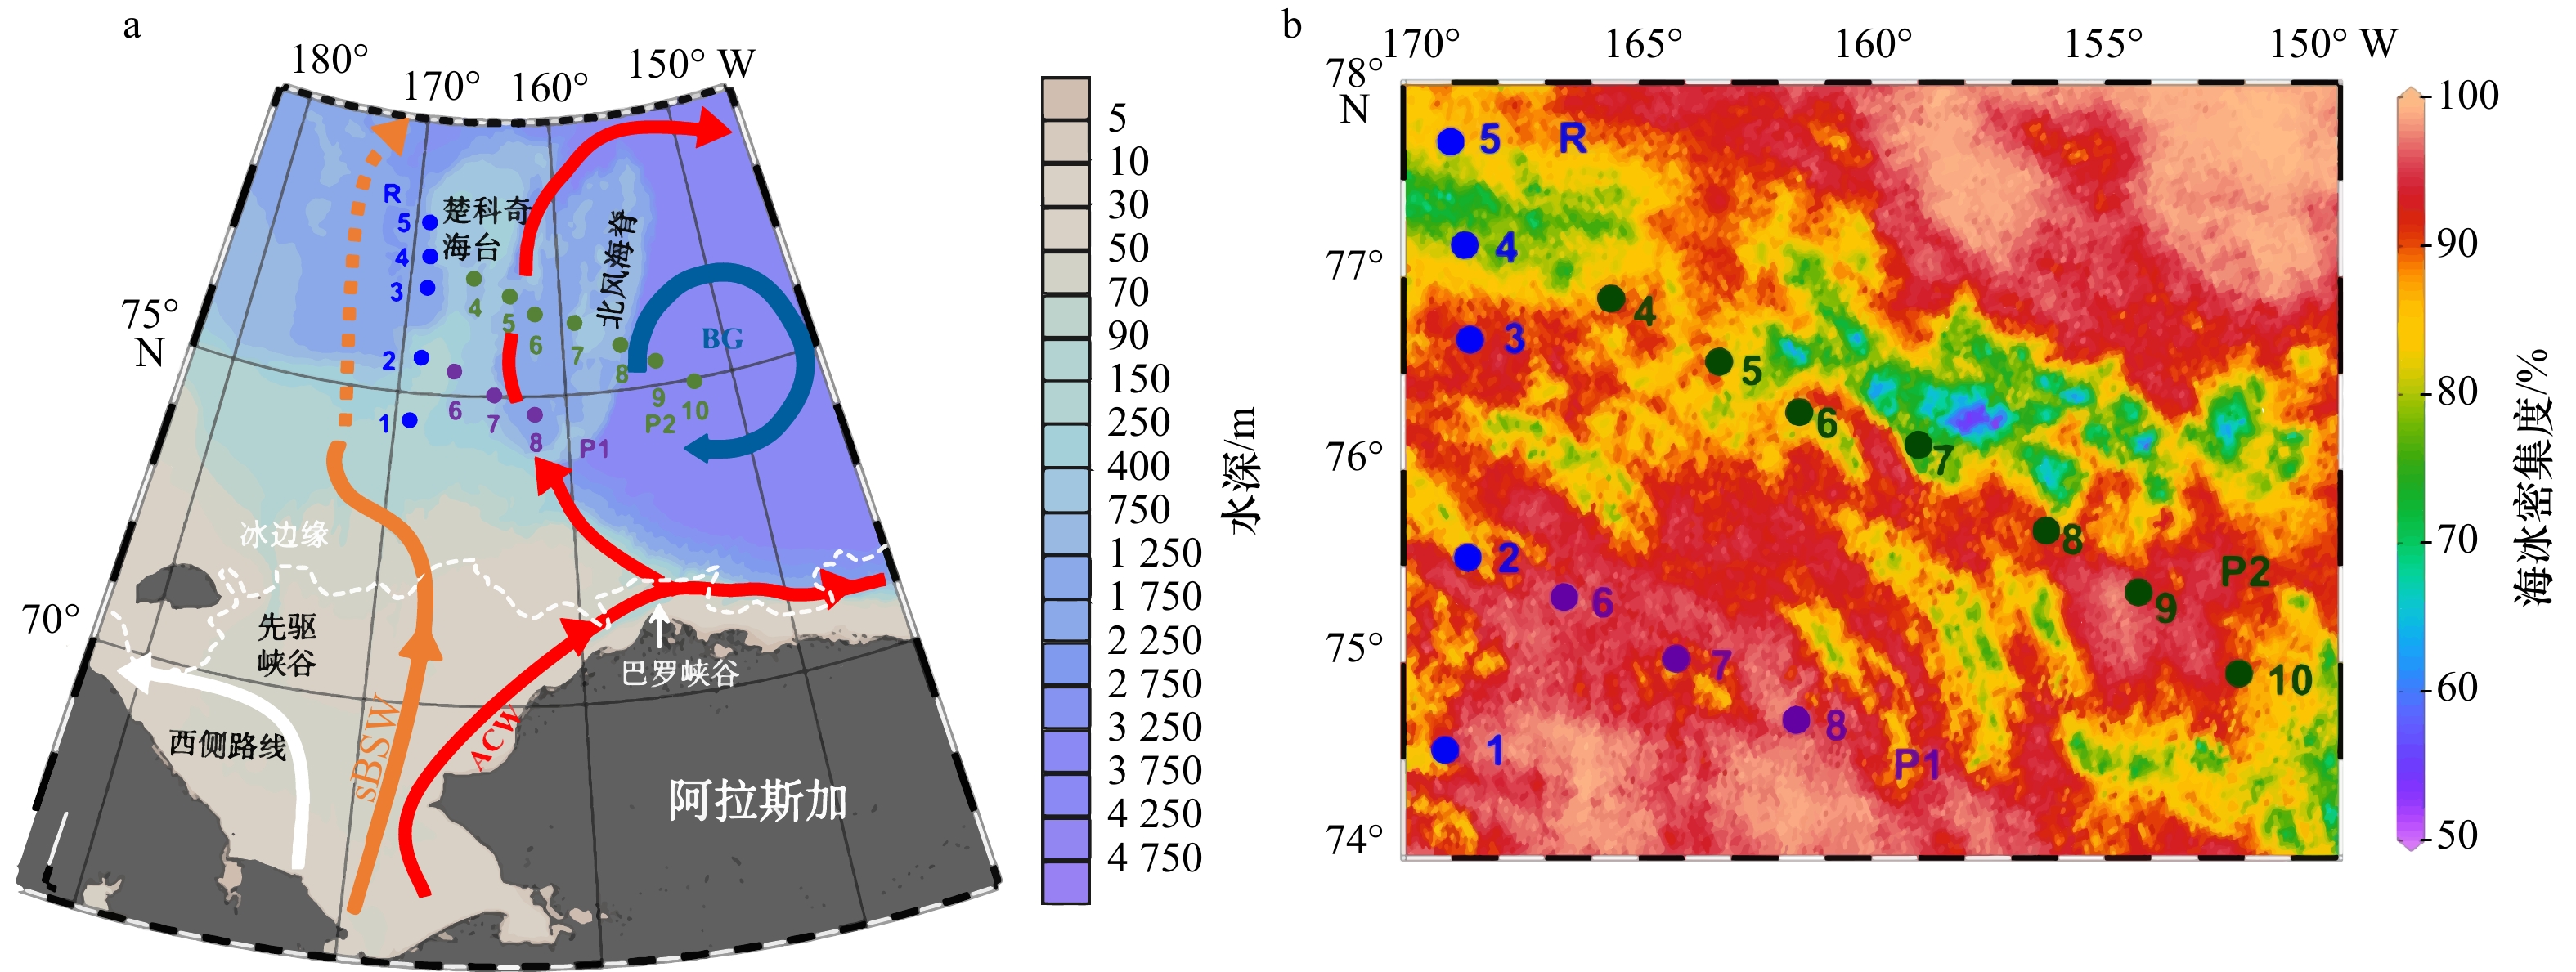
图 1 西北冰洋环流示意图(a)和采样区的海冰密集度在调查期间的均值(b)
采样区域主要受阿拉斯加沿岸流(ACW,红色)和白令海夏季水(sBSW,橘黄色)的影响;深蓝色箭头指示波弗特流涡(BG)的方向;白色虚线表示在2021年7月25日至8月1日的海冰密集度均值为 10%的边缘线;采样站位点分别用蓝色(R 断面)、紫色(P1 断面)、绿色(P2 断面)圆点表示
Fig. 1 Schematic diagram of the western Arctic Ocean circulation (a) and the average of sea ice concentration during the sampling time (b)
The study region experienced the influence of the Alaskan Coastal Water (ACW, red) and summer Bering Sea Water (sBSW, orange); the direction of the Beaufort Gyre (BG) marked by blue arrows; the white-dash line represents the ice edge (ice concentration=10% during July 25th to August 1st, 2021); sampling stations are shown in blue (transection R), purple (transection P1) and green (transection P2) dots

图 2 在 R(a)、P1(b)和 P2(c)断面水温和盐度的垂向分布
Fig. 2 Vertical distribution of temperature and salinity in the R (a), P1 (b), and P2 (c) transections

图 3 溶解态无机氮(DIN)、磷酸盐(SRP)和硅酸盐(Si(OH)4)浓度在 3 个断面的垂向分布
Fig. 3 Vertical distribution of dissolved inorganic nitrates (DIN), soluble reactive phosphates (SRP) and silicates (Si(OH)4) concentration in three transections

图 4 在 R(a)、P1(b)和 P2(c)断面叶绿素a浓度的垂向分布(灰色虚线为等密度线)
Fig. 4 Vertical distribution of chlorophyll a concentration in the R (a), P1 (b), and P2 (c) transections (gray dotted lines are equal density lines)
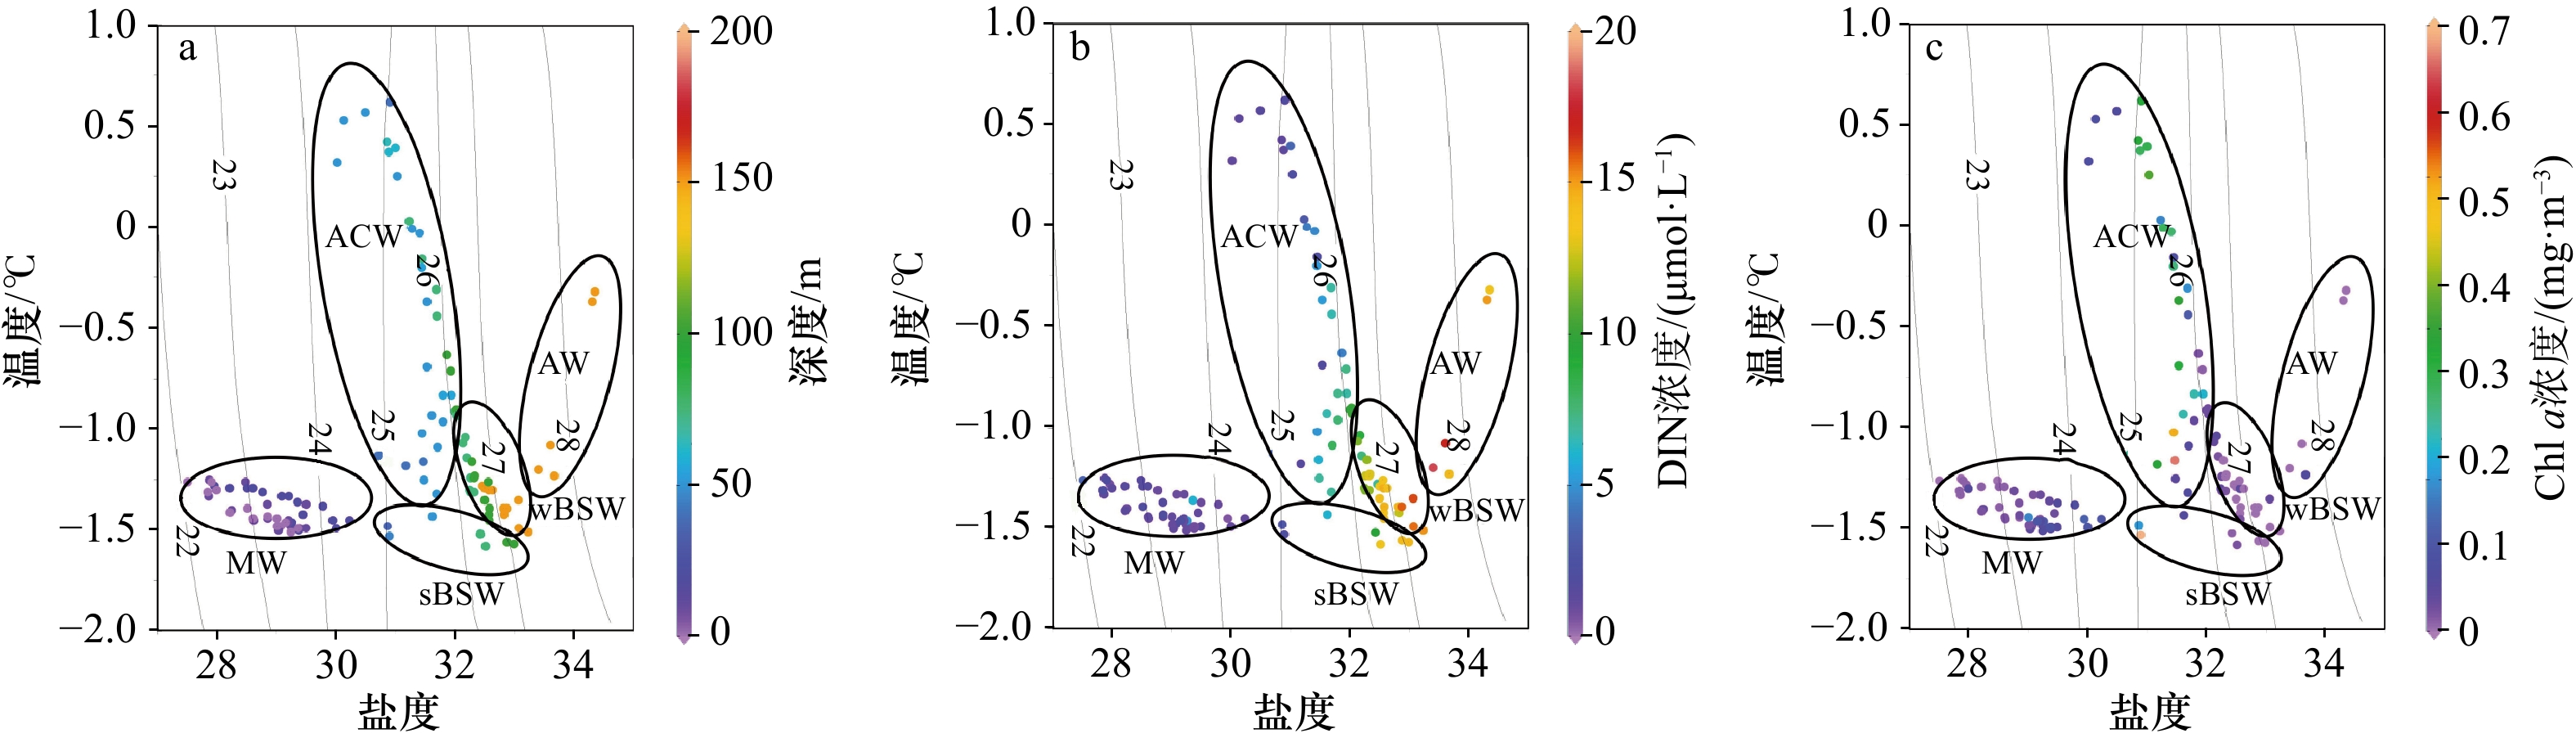
图 5 150 m 以上水体的温−盐−深度点聚图(a)、温−盐−DIN 浓度点聚图(b)和温−盐−叶绿素 a浓度点聚图(c)
MW 为融冰水;ACW 为阿拉斯加沿岸流;sBSW 为白令海夏季水;wBSW 为白令海冬季水;AW 为大西洋水
Fig. 5 Depth distribution in temprature-salinity-depth scatter diagram (a), temperature-salinity-DIN concentration scatter diagram (b) and temperature-salinity-Chl a concentration scatter diagram (c) above 150 m
MW is Melting Water; ACW is Alaskan Coastal Water; sBSW is summer Bering Sea Water; wSBW is winter Bering Sea Water; AW is Atlantic Water
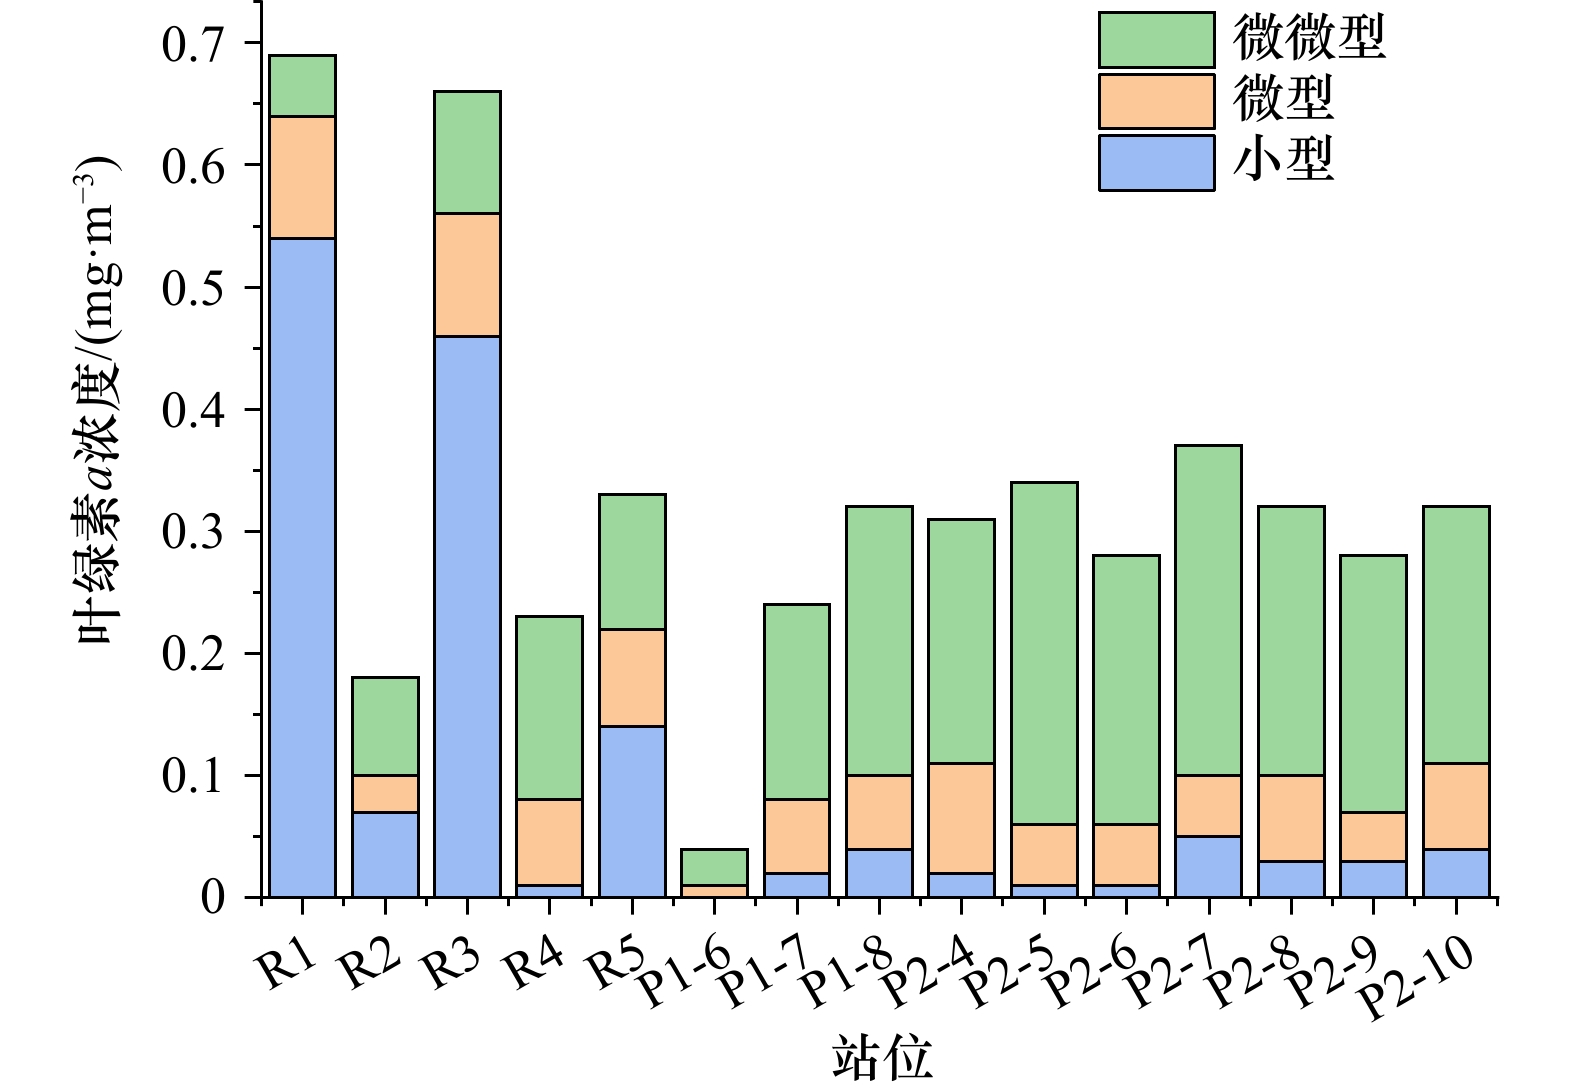
图 6 叶绿素a浓度最大层的浮游植物叶绿素a浓度的分级分布
Fig. 6 Size-fraction distribution in Chl a concentration of phytoplankton in Chl a maximum concentration layer
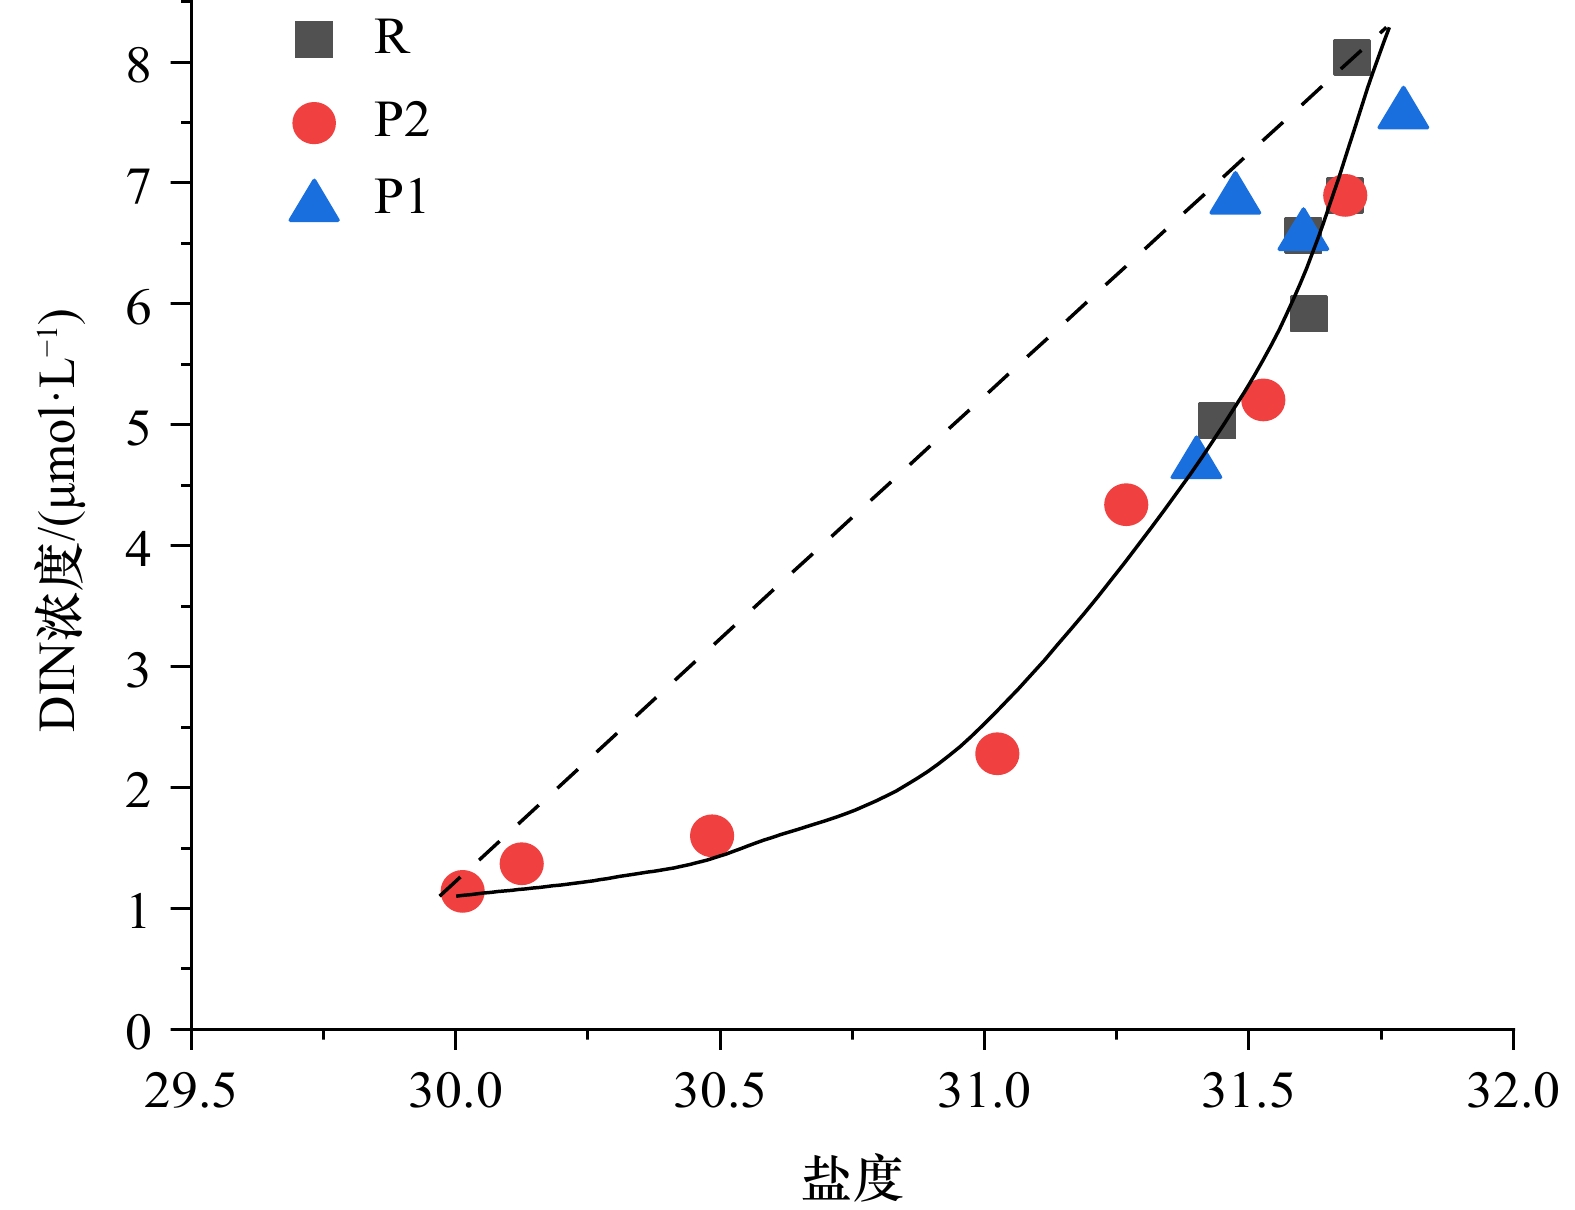
图 7 溶解无机氮(DIN)浓度与盐度关系
数据都取自 50 m,接近叶绿素a浓度最大层
Fig. 7 Relationship between dissolved inorganic nitrate (DIN) concentration and salinity
All data came from the 50 m depth, close to the Chl a concentration maximum layer
表 1 不同水团温度、盐度、密度的分布
Tab. 1 Distribution of temperature, salinity and density in different water mass
水团 温度/℃ 盐度 深度/m 密度/(kg·m−3) MW −1.7~−1.2 28~30.5 0~20 22~24.5 ACW −1.25~0.75 30~32 30~100 24~26 sBSW −1.5~−1.25 31~32 50~100 25~26 wBSW −1.6~−1 32~33 70~125 26~27 AW −1.5~−0.25 >33 >125 >27  下载: 导出CSV
表 2 分级叶绿素a浓度与环境因子的相关性
Tab. 2 Correlations of size-fraction chlorophyll a concentration and environmental factors
分级叶绿素 海冰密集度 盐度 温度 光强 DIN浓度 SRP浓度 Si (OH)4浓度 N/P Si/N 小型浮游植物Chl a −0.083 −0.605* 0.047 0.325 −0.735** −0.696** −0.674* −0.755** 0.707** 微型浮游植物Chl a −0.172 0 0.117 −0.205 −0.367 −0.408 −0.509 −0.239 0.025 微微型浮游植物Chl a −0.147 −0.05 0.719** −0.020 −0.091 −0.036 −0.147 −0.102 −0.111 注:*表示 p<0.05 水平下相关性显著;**表示 p<0.01 水平下的相关性显著。
下载: 导出CSV
-
[1] Ardyna M, Arrigo K R. Phytoplankton dynamics in a changing Arctic Ocean[J]. Nature Climate Change, 2020, 10(10): 892−903. doi: 10.1038/s41558-020-0905-y [2] Meier W N, Perovich D, Farrell S, et al. Sea Ice[R]. Colorado, USA: NOAA’s Arctic Program, 2021. [3] Stroeve J, Vancoppenolle M, Veyssiere G, et al. A multi-sensor and modeling approach for mapping light under sea ice during the ice-growth season[J]. Frontiers in Marine Science, 2021, 7: 592337. doi: 10.3389/fmars.2020.592337 [4] Arrigo K R, Perovich D K, Pickart R S, et al. Phytoplankton blooms beneath the sea ice in the Chukchi Sea[J]. Deep-Sea Research Part II: Topical Studies in Oceanography, 2014, 105: 1−16. doi: 10.1016/j.dsr2.2014.03.018 [5] Arrigo K R, Perovich D K, Pickart R S, et al. Massive phytoplankton blooms under Arctic sea ice[J]. Science, 2012, 336(6087): 1408−1408. doi: 10.1126/science.1215065 [6] Jönsson B F, Sathyendranath S, Platt T. Trends in winter light environment over the Arctic Ocean: a perspective from two decades of ocean color data[J]. Geophysical Research Letters, 2020, 47(16): e2020GL089037. [7] Lewis K M, Van Dijken G L, Arrigo K R. Changes in phytoplankton concentration now drive increased Arctic Ocean primary production[J]. Science, 2020, 369(6500): 198−202. doi: 10.1126/science.aay8380 [8] Kohlbach D, Graeve M, Lange B A, et al. The importance of ice algae-produced carbon in the central Arctic Ocean ecosystem: food web relationships revealed by lipid and stable isotope analyses[J]. Limnology and Oceanography, 2016, 61(6): 2027−2044. doi: 10.1002/lno.10351 [9] Frey K E, Perovich D K, Light B. The spatial distribution of solar radiation under a melting Arctic sea ice cover[J]. Geophysical Research Letters, 2011, 38(22): L22501. [10] Bélanger S, Babin M, Tremblay J É. Increasing cloudiness in Arctic damps the increase in phytoplankton primary production due to sea ice receding[J]. Biogeosciences, 2013, 10(6): 4087−4101. doi: 10.5194/bg-10-4087-2013 [11] Neeley A R, Harris L A, Frey K E. Unraveling phytoplankton community dynamics in the northern Chukchi Sea under sea-ice-covered and sea-ice-free conditions[J]. Geophysical Research Letters, 2018, 45(15): 7663−7671. doi: 10.1029/2018GL077684 [12] Lee S H, Yun M S, Kim B K, et al. Latitudinal carbon productivity in the Bering and Chukchi seas during the summer in 2007[J]. Continental Shelf Research, 2013, 59: 28−36. doi: 10.1016/j.csr.2013.04.004 [13] 张瑜, 邓永飞, 陈长胜. 白令海峡区域太平洋入流水主要特征及其影响因素研究进展[J]. 极地研究, 2020, 32(2): 151−163. doi: 10.13679/j.jdyj.20190045Zhang Yu, Deng Yongfei, Chen Changsheng. Main characteristics and influence factors of the Pacific inflow in the region of Bering Strait: a review[J]. Chinese Journal of Polar Research, 2020, 32(2): 151−163. doi: 10.13679/j.jdyj.20190045 [14] Steele M, Morison J, Ermold W, et al. Circulation of summer Pacific halocline water in the Arctic Ocean[J]. Journal of Geophysical Research: Oceans, 2004, 109(C2): C02027. [15] Regan H C, Lique C, Armitage T W K. The Beaufort Gyre extent, shape, and location between 2003 and 2014 from satellite observations[J]. Journal of Geophysical Research: Oceans, 2019, 124(2): 844−862. doi: 10.1029/2018JC014379 [16] Lin Peigen, Pickart R S, Våge K, et al. Fate of warm Pacific water in the Arctic basin[J]. Geophysical Research Letters, 2021, 48(20): e2021GL094693. [17] Proshutinsky A, Bourke R H, McLaughlin F A. The role of the Beaufort Gyre in Arctic climate variability: seasonal to decadal climate scales[J]. Geophysical Research Letters, 2002, 29(23): 15−1−15−4. [18] Proshutinsky A, Krishfield R, Timmermans M L, et al. Beaufort Gyre freshwater reservoir: state and variability from observations[J]. Journal of Geophysical Research: Oceans, 2009, 114(C1): C00A10. [19] 国家海洋局. HY/T 147.1−2013, 海洋监测技术规程 第1部分: 海水[S]. 北京: 中国标准出版社, 2013: 8−23, 33−35.State Oceanic Administration. HY/T 147.1−2013, Code of practice for marine monitoring technology. Part 1: Seawater[S]. Beijing: Standards Press of China, 2013: 8−23, 33−35. [20] 刘子琳, 陈建芳, 张涛, 等. 楚科奇海及其海台区粒度分级叶绿素a与初级生产力[J]. 生态学报, 2007, 27(12): 4953−4962. doi: 10.3321/j.issn:1000-0933.2007.12.003Liu Zilin, Chen Jianfang, Zhang Tao, et al. The size-fractionated chlorophyll a concentration and primary productivity in the Chukchi Sea and its northern Chukchi Plateau[J]. Acta Ecologica Sinica, 2007, 27(12): 4953−4962. doi: 10.3321/j.issn:1000-0933.2007.12.003 [21] Wang Xiaoyu, Zhao Jinping, Lobanov V B, et al. Distribution and transport of water masses in the East Siberian Sea and their impacts on the Arctic halocline[J]. Journal of Geophysical Research: Oceans, 2021, 126(8): e2020JC016523. [22] 刘子琳, 陈建芳, 刘艳岚, 等. 2008年夏季西北冰洋观测区叶绿素a和初级生产力粒级结构[J]. 海洋学报, 2011, 33(2): 124−133.Liu Zilin, Chen Jianfang, Liu Yanlan, et al. The size-fractionated chlorophyll a and primary productivity in the surveyed area of the western Arctic Ocean during the summer of 2008[J]. Haiyang Xuebao, 2011, 33(2): 124−133. [23] Nicklisch A, Shatwell T, Köhler J. Analysis and modelling of the interactive effects of temperature and light on phytoplankton growth and relevance for the spring bloom[J]. Journal of Plankton Research, 2008, 30(1): 75−91. [24] Spilling K, Ylöstalo P, Simis S, et al. Interaction effects of light, temperature and nutrient limitations (N, P and Si) on growth, stoichiometry and photosynthetic parameters of the cold-water diatom Chaetoceros wighamii[J]. PLoS One, 2015, 10(5): e0126308. doi: 10.1371/journal.pone.0126308 [25] van de Poll W H, Abdullah E, Visser R J W, et al. Taxon-specific dark survival of diatoms and flagellates affects Arctic phytoplankton composition during the polar night and early spring[J]. Limnology and Oceanography, 2020, 65(5): 903−914. doi: 10.1002/lno.11355 [26] Mills M M, Brown Z W, Laney S R, et al. Nitrogen limitation of the summer phytoplankton and heterotrophic prokaryote communities in the Chukchi Sea[J]. Frontiers in Marine Science, 2018, 5: 362. doi: 10.3389/fmars.2018.00362 [27] Ko E, Gorbunov M Y, Jung J, et al. Effects of nitrogen limitation on phytoplankton physiology in the western Arctic Ocean in summer[J]. Journal of Geophysical Research: Oceans, 2020, 125(11): e2020JC016501. [28] Joo H M, Lee S H, Jung S W, et al. Latitudinal variation of phytoplankton communities in the western Arctic Ocean[J]. Deep Sea Research Part II: Topical Studies in Oceanography, 2012, 81−84: 3−17. doi: 10.1016/j.dsr2.2011.06.004 [29] Smith W O Jr. Primary productivity and new production in the Northeast Water (Greenland) Polynya during summer 1992[J]. Journal of Geophysical Research: Oceans, 1995, 100(C3): 4357−4370. doi: 10.1029/94JC02764 [30] Officer C B. Discussion of the behaviour of nonconservative dissolved constituents in estuaries[J]. Estuarine and Coastal Marine Science, 1979, 9(1): 91−94. doi: 10.1016/0302-3524(79)90009-4 [31] Zhuang Yanpei, Jin Haiyan, Chen Jianfang, et al. Nutrient and phytoplankton dynamics driven by the Beaufort Gyre in the western Arctic Ocean during the period 2008−2014[J]. Deep-Sea Research Part I: Oceanographic Research Papers, 2018, 137: 30−37. doi: 10.1016/j.dsr.2018.05.002 [32] Coupel P, Jin H Y, Joo M, et al. Phytoplankton distribution in unusually low sea ice cover over the Pacific Arctic[J]. Biogeosciences, 2012, 9(11): 4835−4850. doi: 10.5194/bg-9-4835-2012 [33] Stroeve J C, Kattsov V, Barrett A, et al. Trends in Arctic sea ice extent from CMIP5, CMIP3 and observations[J]. Geophysical Research Letters, 2012, 39(16): L16502. [34] Jahn A, Kay J E, Holland M M, et al. How predictable is the timing of a summer ice-free Arctic?[J]. Geophysical Research Letters, 2016, 43(17): 9113−9120. doi: 10.1002/2016GL070067 [35] Timmermans M L, Toole J, Krishfield R. Warming of the interior Arctic Ocean linked to sea ice losses at the basin margins[J]. Science Advances, 2018, 4(8): eaat6773. doi: 10.1126/sciadv.aat6773 [36] Shimada K, Kamoshida T, Itoh M, et al. Pacific Ocean inflow: influence on catastrophic reduction of sea ice cover in the Arctic Ocean[J]. Geophysical Research Letters, 2006, 33(8): L08605. [37] Armitage T W K, Manucharyan G E, Petty A A, et al. Enhanced eddy activity in the Beaufort Gyre in response to sea ice loss[J]. Nature Communications, 2020, 11(1): 761. doi: 10.1038/s41467-020-14449-z [38] Proshutinsky A, Krishfield R, Toole J M, et al. Analysis of the Beaufort Gyre freshwater content in 2003−2018[J]. Journal of Geophysical Research: Oceans, 2019, 124(12): 9658−9689. doi: 10.1029/2019JC015281 [39] Aagaard K, Coachman L K, Carmack E. On the halocline of the Arctic Ocean[J]. Deep-Sea Research Part A. Oceanographic Research Papers, 1981, 28(6): 529−545. doi: 10.1016/0198-0149(81)90115-1 [40] Carmack E, Chapman D C. Wind-driven shelf/basin exchange on an Arctic shelf: the joint roles of ice cover extent and shelf-break bathymetry[J]. Geophysical Research Letters, 2003, 30(14): 1778. [41] Lewis K M, Arntsen A E, Coupel P, et al. Photoacclimation of Arctic Ocean phytoplankton to shifting light and nutrient limitation[J]. Limnology and Oceanography, 2019, 64(1): 284−301. doi: 10.1002/lno.11039 -

计量
- 文章访问数: 837
- HTML全文浏览量: 363
- PDF下载量: 95
- 被引次数: 0
