

In-situ monitoring of ammonia nitrogen and nitrite in seawater by fiber-coupled micro-channel reaction system
-
摘要: 原位监测海水中氨氮(NH3-N)和亚硝酸盐(
${\rm{NO}}_2^- $ )对于水体富营养化评价十分重要。针对现有的氨氮、亚硝酸盐原位监测仪器难以在同一检测模块中分别实现荧光和分光光度分析,仪器高效集成及利用受到限制等问题,本文基于光纤耦合微通道反应系统,通过光波长切割、光纤波导和微通道反应 Z 型检测池等技术集成和条件优化,提出了在同一光纤偶联微反应系统中实现氨氮荧光分析和亚硝酸盐分光光度分析的原位测定技术。结果表明,该技术实现了荧光和可见光光度法的模式切换并可分别测定NH3-N和${\rm{NO}}_2^- $ ;在恒温条件下,NH3-N测定荧光信号漂移小于−2.0%, ${\rm{NO}}_2^- $ 测定吸光度稳定;不同的盐度对氨氮和亚硝酸盐测定影响较小;不同浊度下氨氮测定误差为−6.6%~2.5%,浊度补偿校正后${\rm{NO}}_2^-$ 测定误差小于0.1%。将该仪器应用于养殖海水中开展氨氮和亚硝酸盐的原位分析,仪器原位监测值与实验室方法测定值相符合。本文所提出的技术在同一模块中分别实现了氨氮和亚硝酸盐的荧光和分光光度两种模式的原位监测,为海水营养盐原位监测仪器的集成化设计提供了新的思路。Abstract: In-situ monitoring of ammonia nitrogen (NH3-N) and nitrite (${\rm{NO}}_2^- $ ) in seawater is important for evaluating water eutrophication. To date, it is difficult to achieve fluorescence and spectrophotometric analysis of ammonia nitrogen and nitrite in a single detection module, and the efficient integration and utilization of instruments are limited. Herein, in view of this problem, a fiber-coupled micro-channel reaction system was proposed based on technologies such as optical wavelength cutting, optical fiber waveguide and micro-channel reaction Z-cell detection, and realized the fluorescence detection of ammonia nitrogen and the in-situ determination of nitrite by spectrophotometry in the same detection system. The results showed that the mode switching of fluorescence and visible photometry could be realized and NH3-N and${\rm{NO}}_2^- $ was accomplished by this technique, respectively. Under the constant temperature condition, the drift value of fluorescence signal in NH3-N measurement was less than −2.0%, and the absorbance intensity of${\rm{NO}}_2^- $ measurement was stable. Little effect on the determination of ammonia nitrogen and nitrite was provided by different salinity. The acceptable measurement error of ammonia nitrogen under different turbidity ranged in −6.6% to 2.5%, and the measurement error of${\rm{NO}}_2^- $ after turbidity compensation correction was less than 0.1%. The instrument was applied to the in-situ analysis of ammonia nitrogen and nitrite in aquaculture seawater, and the detection value achieve by this method was consistent with the standard method. This method realized in-situ automatic detection of ammonia nitrogen and nitrite in a same module, and provided a new idea for the better integration of in-situ monitoring instruments for real-time monitoring of NH3-N and${\rm{NO}}_2^- $ in seawater.-
Key words:
- in-situ monitoring /
- fiber-coupled /
- micro-channel reaction system /
- ammonia nitrogen /
- nitrite
-

图 1 光纤耦合微通道反应系统原位检测装置示意图
Fig. 1 Schematic of the fiber-coupled micro-channel reaction system for in-situ detection

图 2 不同浓度氨氮的荧光光谱(a)和亚硝酸盐的吸收光谱(b)
Fig. 2 Fluorescence spectra (a) and absorption spectra (b) of ammonia nitrogen and nitrite with different concentrations, respectively
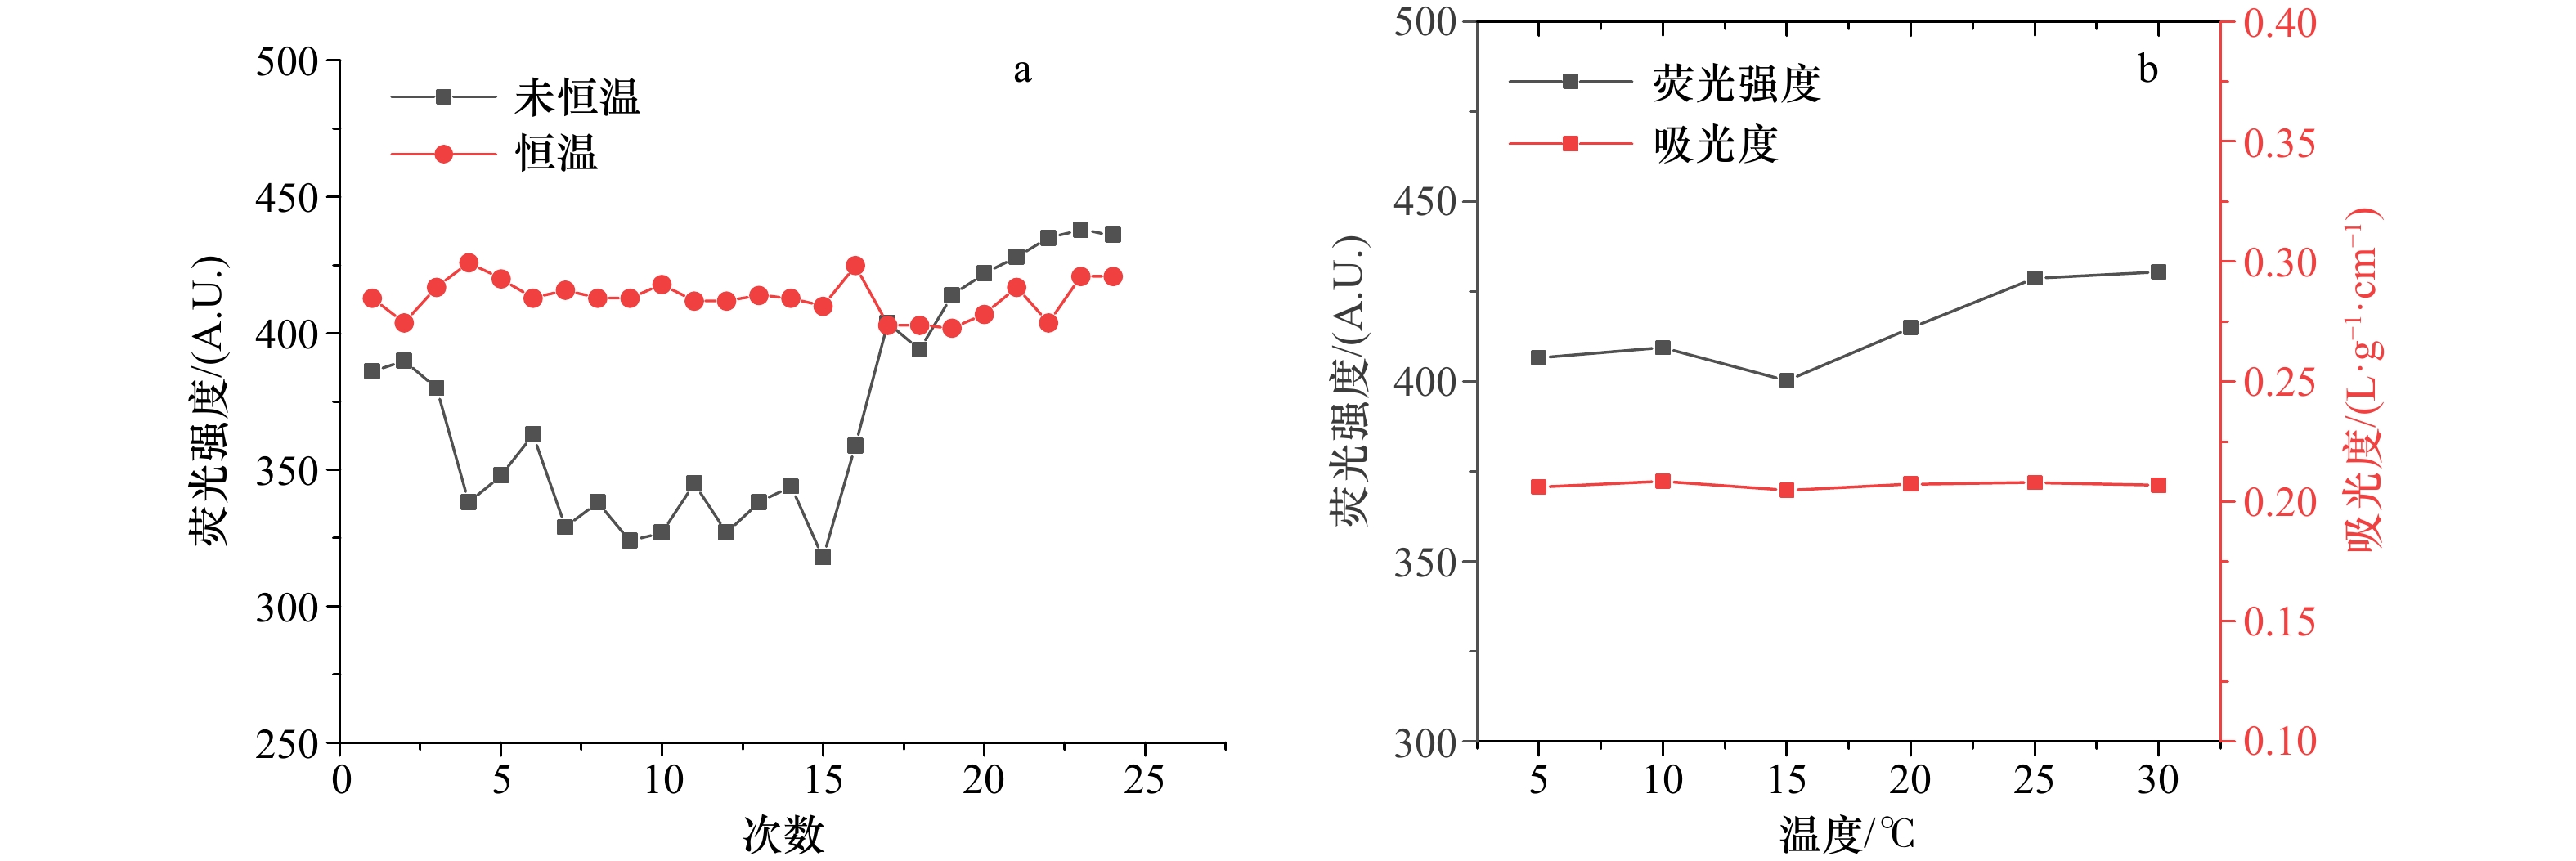
图 3 温度对氨氮检测荧光强度(a)和亚硝酸盐吸光度(b)的影响
Fig. 3 Effect of temperature on fluorescence intensity of ammonia nitrogen detection (a) and absorbance of nitrite (b)

图 4 pH对反应荧光强度和吸光度的影响
Fig. 4 Effects of pH on fluorescence intensity and absorbance of the reaction
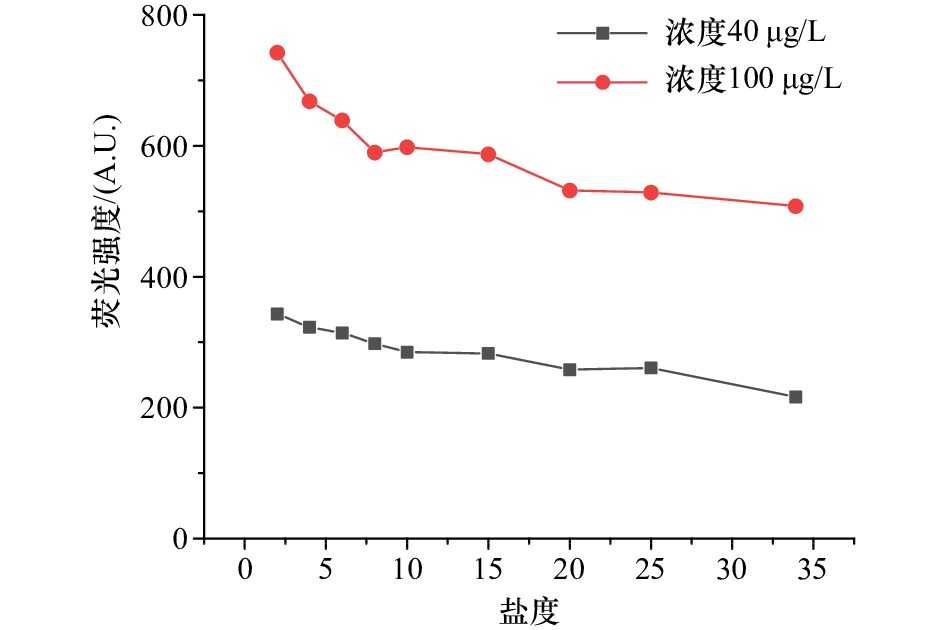
图 5 盐度对氨氮测定荧光强度的影响
Fig. 5 Effects of salinity on fluorescence intensity for ammonia nitrogen detection
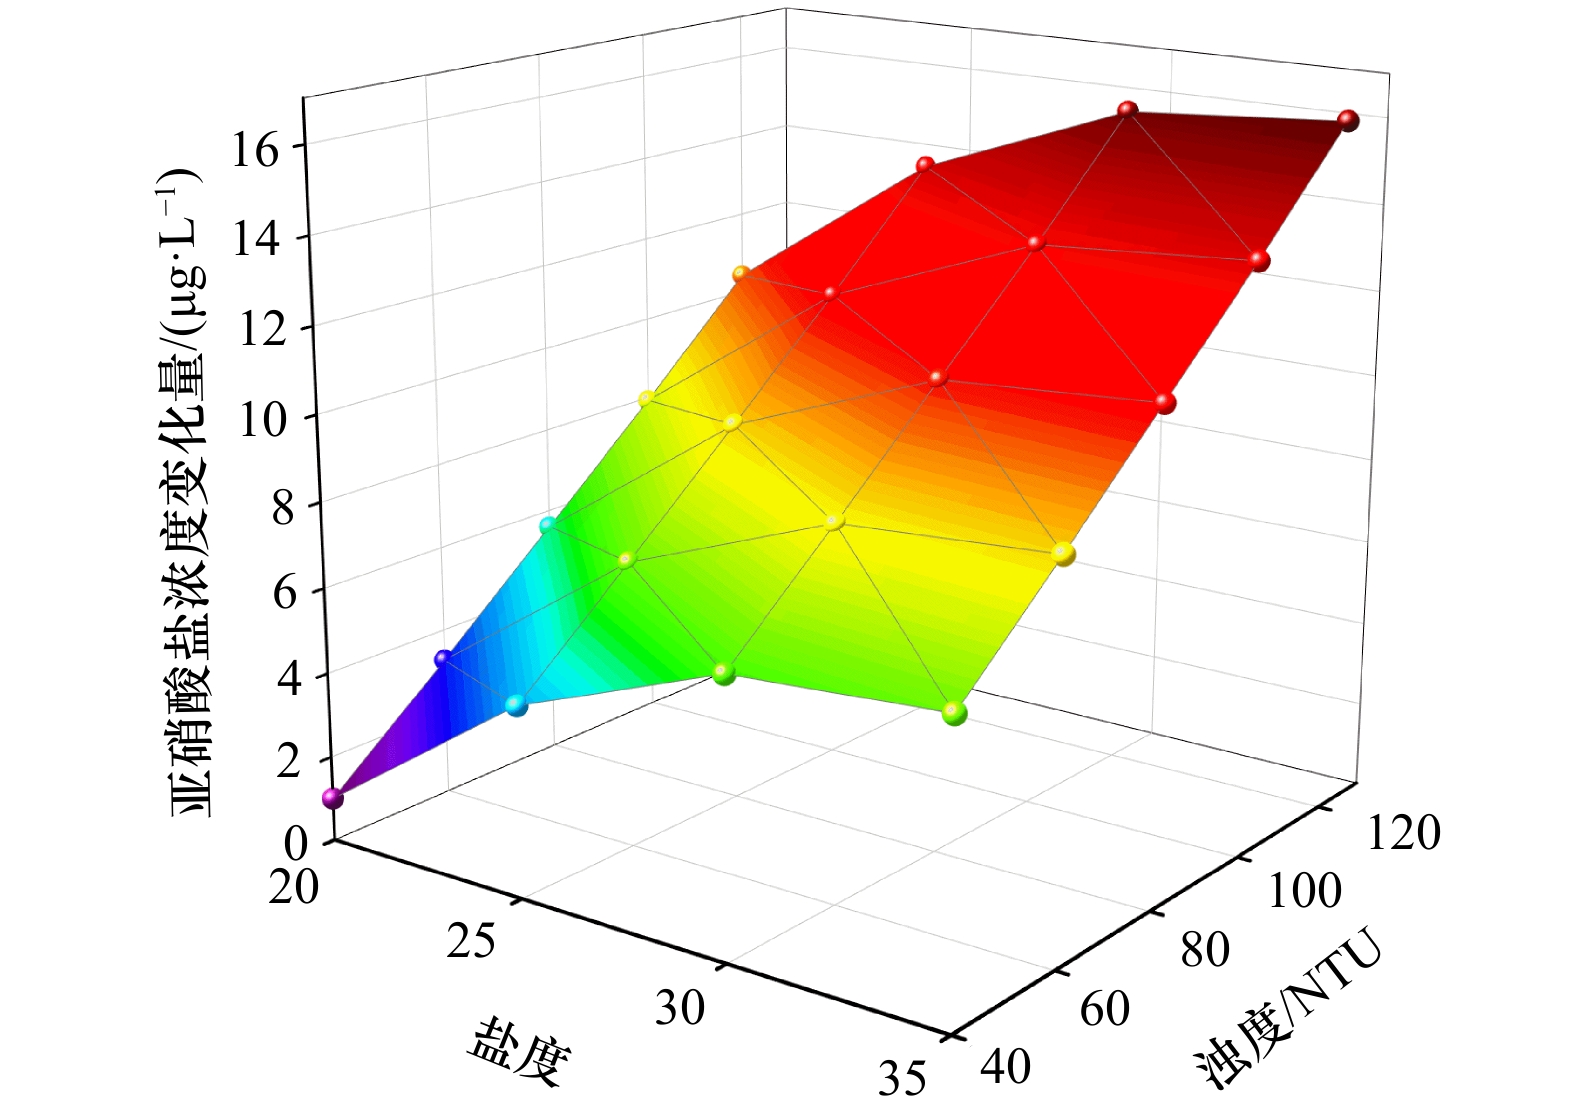
图 6 盐度−浊度−亚硝酸盐浓度变化量的曲面图
Fig. 6 Surface plot of salinity-turbidity-nitrite concentration variation
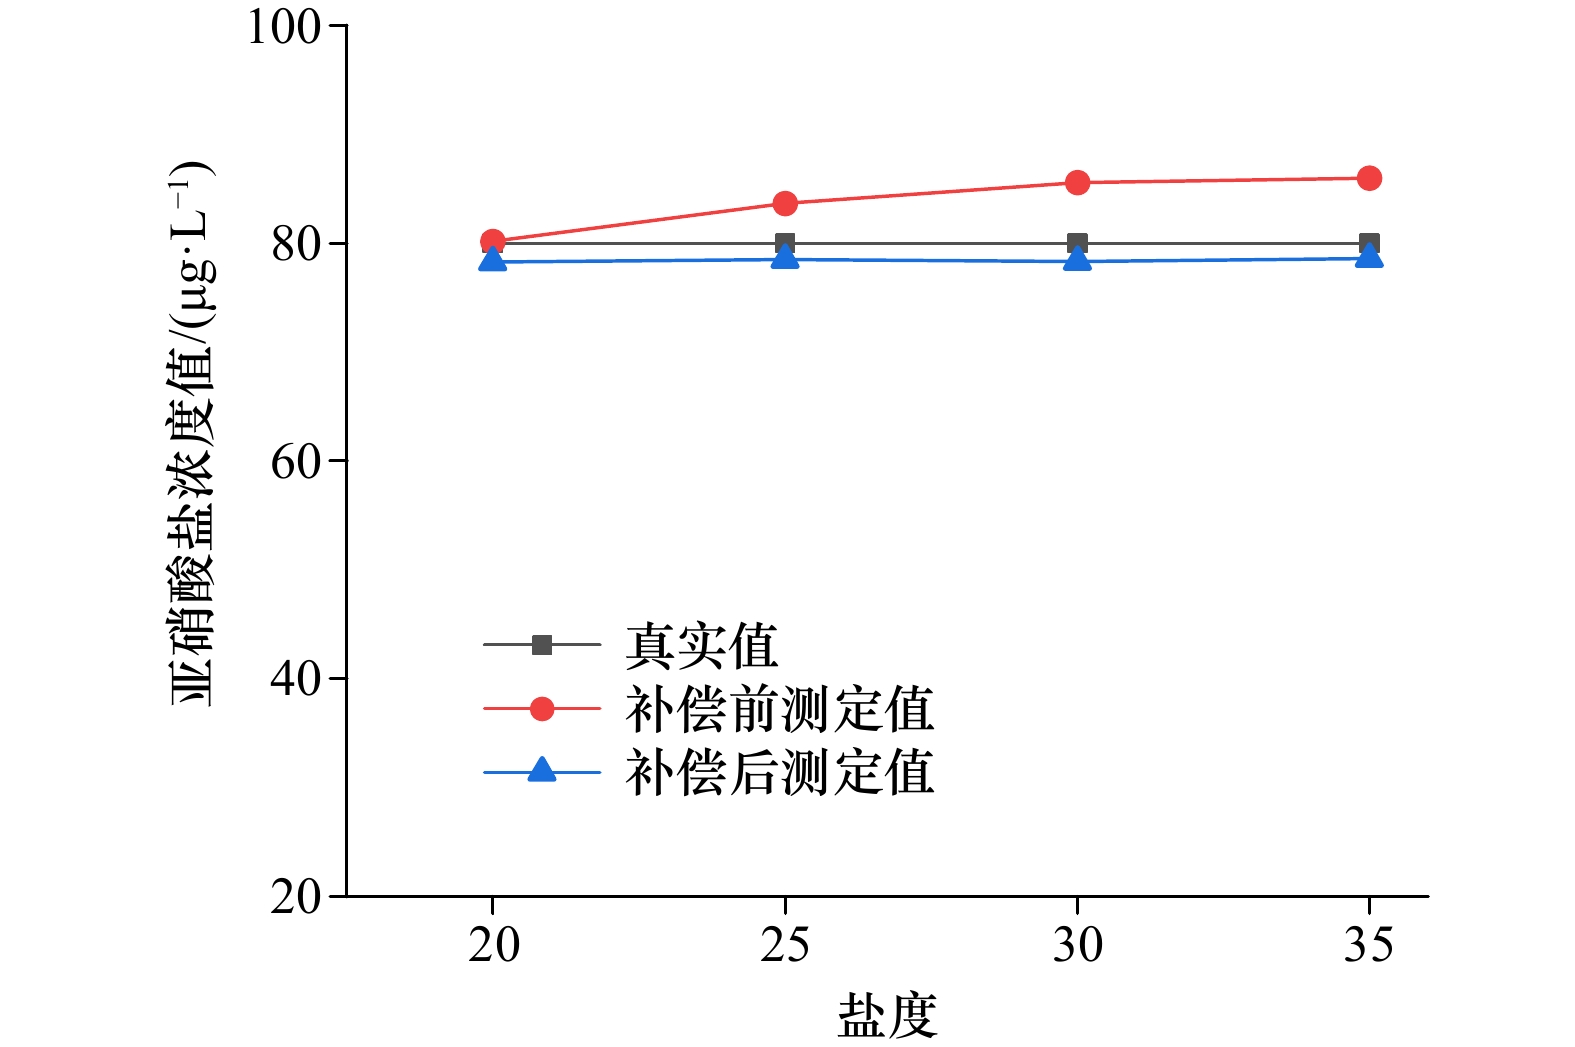
图 7 不同盐度下亚硝酸盐预测值及盐度补偿结果
Fig. 7 Predicted values of nitrite and salinity compensation results under different salinities
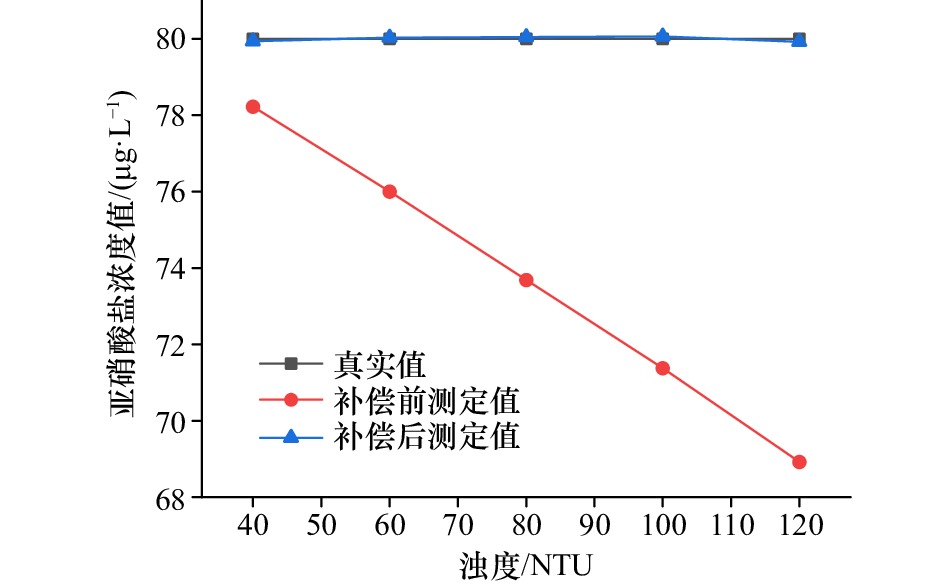
图 8 不同浊度下亚硝酸盐溶液预测值及补偿结果
Fig. 8 Predicted value and compensation result of nitrite under different turbidity
表 1 浊度对氨氮测定的影响
Tab. 1 Effects of turbidity on the determination of ammonia nitrogen
序号 浊度/
NTU直接检测
氨氮
浓度/(μg·L−1)0.45 μm过滤氨
氮浓度/(μg·L−1)过滤前后相
对误差/%1 50 110.0 111.6 −1.4 2 60 107.4 107.6 −0.2 3 70 114.9 112.0 2.5 4 80 113.4 121.4 −6.6 5 90 109.4 110.2 −0.7 6 50 120.0 120.2 −0.2 7 60 118.4 122.0 −3.0 8 70 118.4 122.0 −3.0 9 80 118.2 121.6 −2.8 10 90 124.8 123.8 0.8  下载: 导出CSV
表 2 实验室内氨氮检测结果对比
Tab. 2 Comparison of test results of ammonia nitrogen in laboratory
编号 海水水样 国标法检测浓度/
(μg·L−1)原位仪器法检测浓度/
(μg·L−1)相对误差/% 1 晋江海水1 100.2 104.8 4.6 2 晋江海水2 88.0 84.3 −4.1 3 晋江海水3 51.0 53.9 5.7 4 长乐海水1 62.4 64.6 3.6 5 长乐海水2 58.9 55.2 −6.3 6 长乐海水3 96.0 93.3 −2.8 7 长乐海水4 115.8 110.6 −4.5 8 长乐海水5 82.5 80.4 −2.5 9 长乐海水6 69.1 73.7 6.6
下载: 导出CSV
表 3 实验室内亚硝酸盐检测结果对比
Tab. 3 Comparison of test results of nitrite in laboratory
编号 海水水样 国标法检测浓度/
(μg·L−1)原位仪器法检测浓度/
(μg·L−1)相对误差/% 1 晋江海水1 68.4 65.6 −4.1 2 晋江海水2 58.7 60.1 2.4 3 晋江海水3 70.1 67.8 −3.3 4 长乐海水1 83.6 85.1 1.7 5 长乐海水2 51.6 53.5 3.5 6 长乐海水3 43.8 46.0 4.9 7 长乐海水4 79.9 76.6 −4.1 8 长乐海水5 64.4 67.2 4.4 9 长乐海水6 88.0 84.6 −3.8
下载: 导出CSV
表 4 现场水样氨氮原位监测结果对比
Tab. 4 Comparison of in-situ monitoring results of ammonia nitrogen in field water samples
监测批次
(n−m)实验室方法检测浓度/
(μg·L−1)原位仪器法检测浓度/
(μg·L−1)相对误差/% 1−1 38.1 34.0 −10.8 1−2 29.3 34.1 16.3 1−3 32.3 36.7 13.6 2−1 50.7 45.0 −11.2 2−2 54.0 47.0 −13.0 2−3 46.2 50.0 8.2 3−1 61.8 66.4 7.5 3−2 58.4 50.9 −12.9 3−3 51.0 42.4 −16.9 4−1 64.2 62.0 −3.4 4−2 66.1 57.5 −13.0 4−3 57.5 49.8 −13.4 5−1 83.5 77.0 −7.8 5−2 72.1 78.0 8.2 5−3 75.1 81.2 8.1 6−1 67.9 64.0 −5.7 6−2 64.0 55.9 −12.6 6−3 65.1 67.0 2.9 7−1 61.0 54.0 −11.5 7−2 61.3 68.2 11.3 7−3 61.1 62.1 1.7 8−1 64.5 62.5 −3.1 8−2 61.9 68.1 10.0 8−3 52.5 52.3 −0.3 9−1 58.8 69.9 18.8 9−2 58.6 61.2 4.5 9−3 63.9 68.2 6.8 10−1 53.7 45.2 −15.9 10−2 39.2 46.2 17.9 10−3 42.6 36.8 −13.6 11−1 21.3 21.8 2.4 12−1 20.8 24.2 16.4 12−3 16.4 15.8 −3.6 13−1 8.6 <10.0 / 13−2 6.0 <10.0 / 13−3 7.5 <10.0 / 14−1 69.0 57.7 −16.4 14−2 49.3 46.1 −6.4 14−3 36.1 40.1 11.2 注:n−m代表第n天第m批次,其中m为1~3时代表同一天内分别在3个时间段分别采样3次;/代表由于检测浓度低于仪器检测限,故而未进行计算。
下载: 导出CSV
表 5 亚硝酸盐原位检测结果对比
Tab. 5 Comparison of in situ detection results of nitrite in field water samples
监测批次
(n−m)实验室方法检测浓度/
(μg·L−1)原位仪器法检测浓度/
(μg·L−1)相对误差/% 1−1 6.6 7.0 6.1 1−2 7.1 7.0 −1.4 1−3 7.8 7.0 −10.3 2−1 4.8 <5.0 / 2−2 5.3 5.0 −5.7 2−3 7.1 7.1 −0.7 3−1 6.1 5.0 −18.0 3−2 6.3 5.3 −16.6 3−3 4.8 <5.0 / 4−1 5.6 6.0 7.1 4−2 7.8 6.8 −13.1 4−3 7.8 6.6 −15.1 5−1 4.1 <5.0 / 5−2 5.3 6.0 13.2 5−3 3.6 <5.0 / 6−1 2.6 <5.0 / 6−2 2.6 <5.0 / 6−3 2.8 <5.0 / 7−1 4.1 <5.0 / 7−2 4.3 <5.0 / 7−3 4.6 <5.0 / 8−1 5.6 6.0 7.1 8−2 5.3 5.0 −5.7 8−3 5.8 6.4 10.7 9−1 7.8 6.8 −13.1 9−2 7.1 7.0 −1.4 9−3 6.6 6.0 −9.1 10−1 5.3 5.0 −5.7 10−2 4.8 5.0 4.2 10−3 5.6 6.4 15.0 11−1 2.1 <5.0 / 12−1 2.3 <5.0 / 12−3 2.6 <5.0 / 13−1 2.1 <5.0 / 13−2 3.1 <5.0 / 13−3 2.8 <5.0 / 14−1 0.8 <5.0 / 14−2 1.1 <5.0 / 14−3 1.6 <5.0 / 注:n−m代表第n天第m批次,其中m为1~3时代表同一天内分别在3个时间段分别采样3次;/代表由于检测浓度低于仪器检测限,故而未进行计算。
下载: 导出CSV
-
[1] 张海波, 刘珂, 苏荣国, 等. 2018年南黄海浒苔绿潮迁移发展规律与营养盐相互关系探究[J]. 海洋学报, 2020, 42(8): 30−39. doi: 10.3969/j.issn.0253-4193.2020.08.004Zhang Haibo, Liu Ke, Su Rongguo, et al. Study on the coupling relationship between the development of Ulva prolifera green tide and nutrients in the southern Yellow Sea in 2018[J]. Haiyang Xuebao, 2020, 42(8): 30−39. doi: 10.3969/j.issn.0253-4193.2020.08.004 [2] 王菊英, 郑楠, 马德毅. 近海生态系统的人为营养盐输入及其控制对策浅析[J]. 海洋学报, 2020, 42(6): 1−8. doi: 10.3969/j.issn.0253-4193.2020.06.001Wang Juying, Zheng Nan, Ma Deyi. Anthropogenic inputs of nutrients to coastal ecosystem and mitigation actions[J]. Haiyang Xuebao, 2020, 42(6): 1−8. doi: 10.3969/j.issn.0253-4193.2020.06.001 [3] 刘建安, 于雪晴, 彭彤, 等. 近海海水养殖海域海底地下水排放的研究进展[J]. 地球科学进展, 2021, 36(12): 1235−1246. doi: 10.11867/j.issn.1001-8166.2021.115Liu Jian’an, Yu Xueqing, Peng Tong, et al. Research progress of submarine groundwater discharge in marine aquaculture[J]. Advances in Earth Science, 2021, 36(12): 1235−1246. doi: 10.11867/j.issn.1001-8166.2021.115 [4] 于仁成, 张清春, 孔凡洲, 等. 长江口及其邻近海域有害藻华的发生情况、危害效应与演变趋势[J]. 海洋与湖沼, 2017, 48(6): 1178−1186. doi: 10.11693/hyhz20170900247Yu Rencheng, Zhang Qingchun, Kong Fanzhou, et al. Status, impacts and long-term changes of harmful algal blooms in the sea area adjacent to the Changjiang River Estuary[J]. Oceanologia et Limnologia Sinica, 2017, 48(6): 1178−1186. doi: 10.11693/hyhz20170900247 [5] 皇甫咪咪, 曲建强, 李燕, 等. 水杨酸钠−次氯酸钠法海水氨氮快速检测方法研究[J]. 中国环境监测, 2017, 33(3): 126−132. doi: 10.19316/j.issn.1002-6002.2017.03.19Huangfu Mimi, Qu Jianqiang, Li Yan, et al. Study on the rapid detection of ammonia nitrogen in seawater using sodium salicylate and sodium hypochlorite method[J]. Environmental Monitoring in China, 2017, 33(3): 126−132. doi: 10.19316/j.issn.1002-6002.2017.03.19 [6] 马芮, 刘嘉骥, 刘永. 水杨酸法检测水质氨氮的改进方法[J]. 中国环境监测, 2019, 35(5): 160−164. doi: 10.19316/j.issn.1002-6002.2019.05.20Ma Rui, Liu Jiaji, Liu Yong. The improvement of salicylic acid method to determine ammonia nitrogen in water[J]. Environmental Monitoring in China, 2019, 35(5): 160−164. doi: 10.19316/j.issn.1002-6002.2019.05.20 [7] 时家辉, 于亚光, 杨普, 等. 基于微流控和比色光谱法的水产养殖海水氨氮含量检测[J]. 农业机械学报, 2020, 51(S1): 397−404. doi: 10.6041/j.issn.1000-1298.2020.S1.047Shi Jiahui, Yu Yaguang, Yang Pu, et al. Detection of ammonia nitrogen in seawater in aquaculture based on microfluidics and colorimetric spectroscopy[J]. Transactions of the Chinese Society for Agricultural Machinery, 2020, 51(S1): 397−404. doi: 10.6041/j.issn.1000-1298.2020.S1.047 [8] 严春梅, 刘鑫, 梁英, 等. 基于邻苯二甲醛-NH3-Na2SO3反应的固相荧光分析方法测定水样中的氨氮[J]. 分析测试学报, 2015, 34(11): 1271−1275. doi: 10.3969/j.issn.1004-4957.2015.11.010Yan Chunmei, Liu Xin, Liang Ying, et al. Determination of ammonia nitrogen in natural water sample using solid-phase fluorescence spectrometry based on OPA-NH3-sulfite reaction[J]. Journal of Instrumental Analysis, 2015, 34(11): 1271−1275. doi: 10.3969/j.issn.1004-4957.2015.11.010 [9] Amornthammarong N, Zhang Jiazhong. Shipboard fluorometric flow analyzer for high-resolution underway measurement of ammonium in seawater[J]. Analytical Chemistry, 2008, 80(4): 1019−1026. doi: 10.1021/ac701942f [10] Šraj L O, Almeida M I G S, Bassett C, et al. Gas-diffusion-based passive sampler for ammonia monitoring in marine waters[J]. Talanta, 2018, 181: 52−56. doi: 10.1016/j.talanta.2017.12.076 [11] Vrana B, Allan I J, Greenwood R, et al. Passive sampling techniques for monitoring pollutants in water[J]. TrAC Trends in Analytical Chemistry, 2005, 24(10): 845−868. doi: 10.1016/j.trac.2005.06.006 [12] Zabiegała B, Kot-Wasik A, Urbanowicz M, et al. Passive sampling as a tool for obtaining reliable analytical information in environmental quality monitoring[J]. Analytical and Bioanalytical Chemistry, 2010, 396(1): 273−296. doi: 10.1007/s00216-009-3244-4 [13] Singh P, Singh M K, Beg Y R, et al. A review on spectroscopic methods for determination of nitrite and nitrate in environmental samples[J]. Talanta, 2019, 191: 364−381. doi: 10.1016/j.talanta.2018.08.028 [14] 闫坤朋, 牛成洁, 宋志文, 等. 重氮偶联法测定水中亚硝酸盐氮的改进[J]. 中国环境监测, 2018, 34(3): 118−122. doi: 10.19316/j.issn.1002-6002.2018.03.17Yan Kunpeng, Niu Chengjie, Song Zhiwen, et al. Improvement of Diazo-coupling method for the determination of nitrite nitrogen in water[J]. Environmental Monitoring in China, 2018, 34(3): 118−122. doi: 10.19316/j.issn.1002-6002.2018.03.17 [15] Foreman R K, Segura-Noguera M, Karl D M. Validation of Ti(III) as a reducing agent in the chemiluminescent determination of nitrate and nitrite in seawater[J]. Marine Chemistry, 2016, 186: 83−89. doi: 10.1016/j.marchem.2016.08.003 [16] He Lijun, Zhang Kaige, Wang Caijuan, et al. Effective indirect enrichment and determination of nitrite ion in water and biological samples using ionic liquid-dispersive liquid-liquid microextraction combined with high-performance liquid chromatography[J]. Journal of Chromatography A, 2011, 1218(23): 3595−3600. doi: 10.1016/j.chroma.2011.04.014 [17] Zhang Shuxin, Peng Rong, Jiang Ran, et al. A high-throughput headspace gas chromatographic technique for the determination of nitrite content in water samples[J]. Journal of Chromatography A, 2018, 1538: 104−107. doi: 10.1016/j.chroma.2018.01.026 [18] García-Robledo E, Corzo A, Papaspyrou S. A fast and direct spectrophotometric method for the sequential determination of nitrate and nitrite at low concentrations in small volumes[J]. Marine Chemistry, 2014, 162: 30−36. doi: 10.1016/j.marchem.2014.03.002 [19] 蔡荣源, 陆德婵, 翁婷炜, 等. 利用重氮偶联反应双模式快速检测痕量亚硝酸盐[J]. 福建师范大学学报(自然科学版), 2021, 37(3): 48−53. doi: 10.12046/j.issn.1000-5277.2021.03.007Cai Rongyuan, Lu Dechan, Weng Tingwei, et al. Detection of nitrite by a dual-mode method based on Griess reaction[J]. Journal of Fujian Normal University (Natural Science Edition), 2021, 37(3): 48−53. doi: 10.12046/j.issn.1000-5277.2021.03.007 [20] 严霞, 贾文杰, 史晓凤, 等. 便携式SERS传感器的近岸海水中PAHs检测[J]. 红外与激光工程, 2019, 48(3): 197−202. doi: 10.3788/IRLA201948.0322003Yan Xia, Jia Wenjie, Shi Xiaofeng, et al. Detection of PAHs in coastal sea water using portable SERS sensor[J]. Infrared and Laser Engineering, 2019, 48(3): 197−202. doi: 10.3788/IRLA201948.0322003 [21] 中华人民共和国国家质量监督检验检疫总局, 中国国家标准化管理委员会. GB 17378.4−2007, 海洋监测规范 第4部分: 海水分析[S]. 北京: 中国标准出版社, 2008.General Administration of Quality Supervision, Inspection and Quarantine of the People’s Republic of China and China National Standardization Administration. GB 17378.4−2007, The specification for marine monitoring Part 4: Seawater analysis[S]. Beijing: Standards Press of China, 2008. [22] 中华人民共和国环境保护部. HJ442−2008, 近岸海域环境监测规范[S]. 北京: 中国环境科学出版社, 2009.General Administration of Quality Supervision Inspection and Quarantine of the People’s Republic of China. HJ442−2008, Specification for offshore environmental monitoring[S]. Beijing: China Environmental Press, 2009. -


计量
- 文章访问数: 1480
- HTML全文浏览量: 598
- PDF下载量: 80
- 被引次数: 0
