

Numerical investigations on seasonal variations and forcing factors to waves in the Beibu Gulf
-
摘要: 基于NCEP CFSV2再分析风场驱动SWAN模型,对南海至北部湾为期1年的海浪逐时过程进行了数值模拟,利用Jason-2卫星和近岸浮标整年观测数据检验了模拟效果。在此基础上,评估了模型空间网格尺度对北部湾内波浪模拟的影响,分析了波浪的季节变化特征,辨析了局地风和南海传入浪对海湾波浪的驱动贡献。研究显示:(1)较Jason-2卫星观测值,有效波高模拟值的均方根误差和分散系数分别约为0.4 m和0.2;较北部湾湾顶近岸浮标逐时观测值,有效波高的均方根误差和分散系数分别约为0.2 m和0.4,平均波周期的均方根误差和分散系数分别约为0.6 s和0.2,平均波向的均方根误差约为30°;(2)空间网格分辨率为12'×12'的模型对北部湾20 m以深开敞海域波浪的模拟效果良好,模拟值较2'×2'模型的平均相对偏差在10%以下;(3)北部湾冬季盛行东北向波,夏季盛行偏南向浪,季风转换期盛行东南向浪,全年波浪在季风期强于季风转换期,冬季最强、冬夏转换期最弱;(4)局地风对北部湾波浪的驱动贡献自湾口向湾内增强,季风期强于季风转换期;南海传入浪的驱动贡献自湾口向湾内减弱,季风转换期强于季风期;海湾中部和北部的波浪以局地风为主控因素,海南岛南部和东部水域以传入浪的影响为主,海南岛西南水域受局地风和传入浪的共同控制。Abstract: Driven by the reanalysis wind data NCEP CFSV2, the third-generation wave model SWAN is utilized in a self-nested grid system to simulate waves in the Beibu Gulf (BG), South China Sea (SCS) for a period of one year. The model accuracy is examined by comparing the numerical results with the Jason-2 satellite altimetry data and the near-shore buoy measurements. Based on the numerical simulations, the influence of spatial resolutions on model predication is evaluated, the seasonal characteristics of waves in the BG are analyzed, and the forcing contributions of local wind in BG and sea waves from SCS are discussed. The results show that: (1) Compared with the Jason-2 satellite data, the root-mean square bias (RMSB) and scatter index (SI) for significant wave height are approximately 0.4 m and 0.2, respectively. Compared with the near-shore buoy observations, the RMSB and SI for significant wave height are about 0.2 m and 0.4, respectively; the RMSB and SI for mean wave period are roughly 0.6 s and 0.2, respectively; and the RMSB for mean wave direction is around 30°. (2) The numerical model with the spatial resolution 12'×12' can predict reasonable results for the open sea area of BG, and the mean relative bias compared to the model results of 2'×2' is not exceeding 10%. (3) In the BG, the northeasterly waves prevail in winter monsoon, the southerly waves reign in summer monsoon, and the southeast waves predominate during the periods of monsoon transition (MT). Waves are stronger in monsoons than MTs, up to the strongest in winter monsoon and down to the weakest when winter goes to summer. (4) The driving contribution of local wind to waves in the BG increases gradually from the bay mouth to the inner bay, and the contribution is stronger in monsoons than MTs. The driving contribution of sea waves from SCS gradually weakens from the bay mouth to the inner bay, and the contribution is weaker during monsoons than MTs. In the middle and northern parts of BG, waves are mainly controlled by local wind. In the water areas to the south and east of Hainan Island, waves are mainly dominated by sea waves from SCS. While in the areas to the southwest of Hainan Island, waves are jointly affected by the both factors.
-
Key words:
- CFSV2 wind field /
- SWAN /
- Beibu Gulf /
- wave simulation /
- seasonal variation /
- forcing factors
-
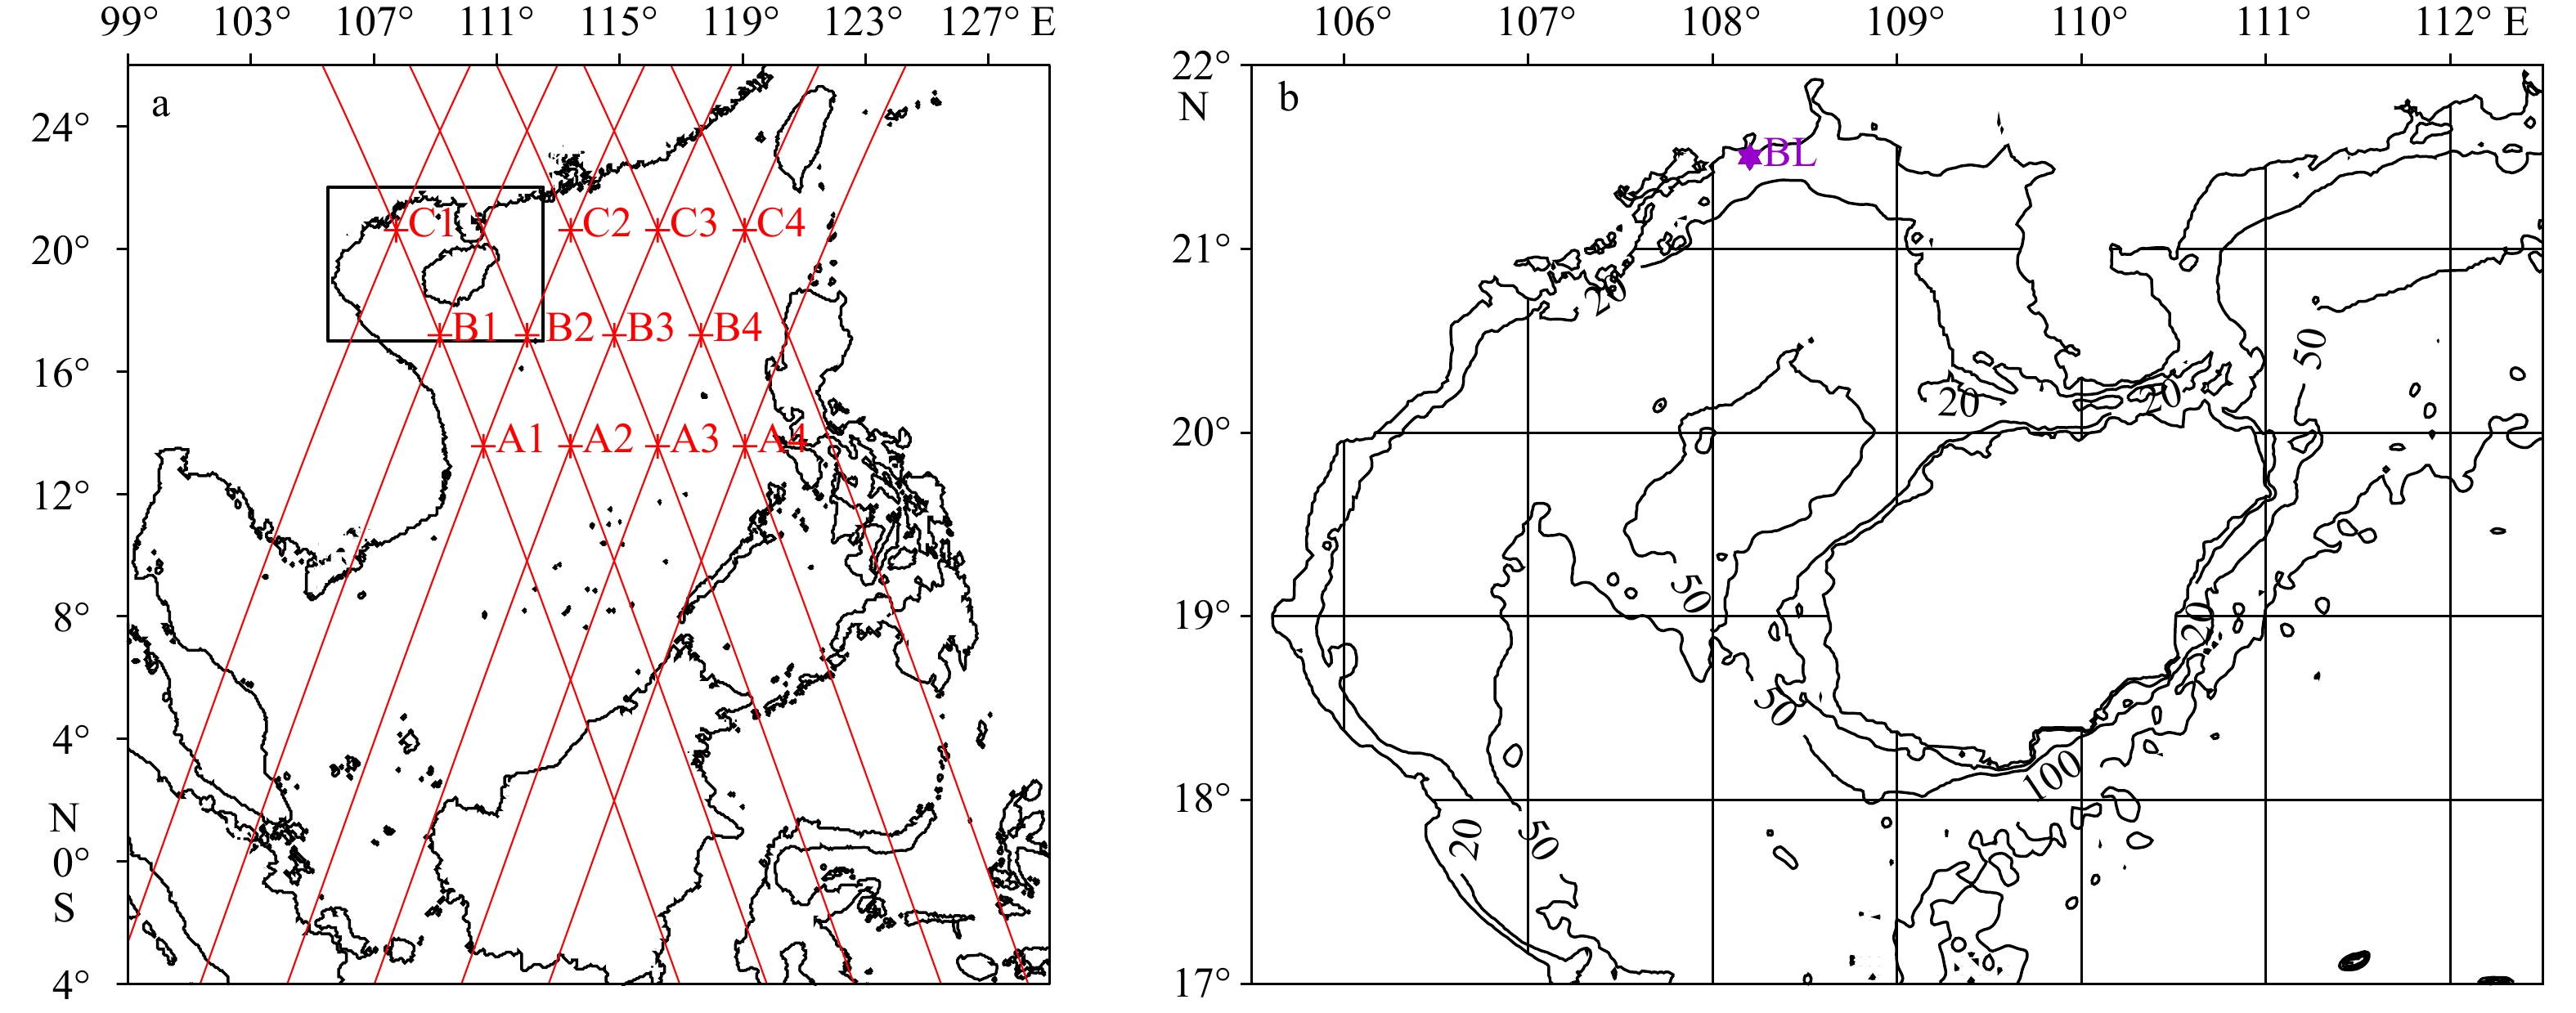
图 1 南海波浪模型(a)和北部湾波浪模型(b)的模拟范围
a. 红色实线是Jason-2卫星轨道路径,A1−A4、B1−B4、C1−C4是轨道路径交叉点;b. 站点BL是波浪近岸浮标观测点
Fig. 1 Simulation range of the South China Sea wave model (a) and the Beibu Gulf wave model (b)
a. The Jason-2 satellite ground tracks are drawn as red solid lines and the track intersections are numbered as points A1−A4, B1−B4 and C1−C4; b. the nearshore wave buoy location is labeled as Point BL
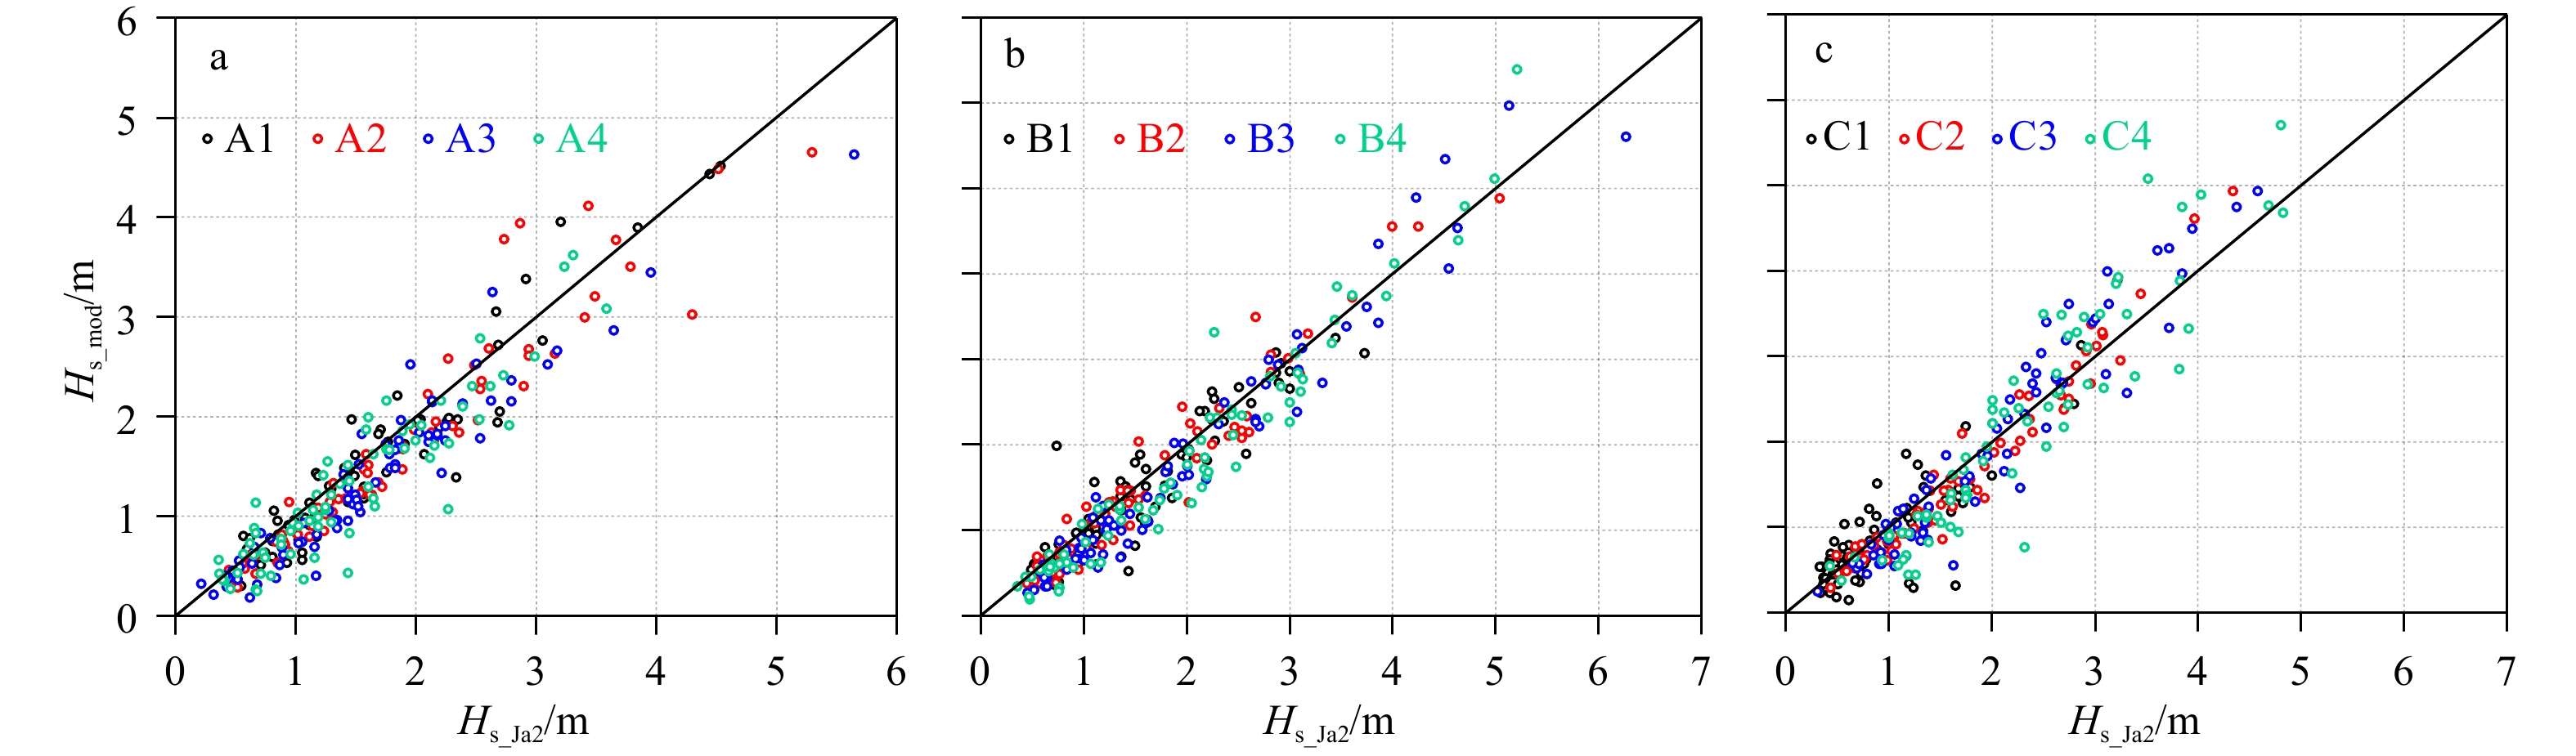
图 2 有效波高模拟值Hs_mod与Jason-2卫星观测值Hs_Ja2的散点分布
Fig. 2 Scatter diagrams for the results of significant wave height between model simulations Hs_mod and Jason-2 satellite observations Hs_Ja2

图 3 近岸浮标BL站点有效波高Hs(a)、平均波周期Tm(b)和平均波向Dir(c)的时间变化过程
Fig. 3 Time series of significant wave height Hs (a), mean wave period Tm (b) and mean wave direction Dir (c) at the nearshore buoy Point BL

图 4 南海模型有效波高模拟值较北部湾模型的均方根偏差(RMSB)(a−c)和平均相对偏差(MRAB)(d−f)的分布
Fig. 4 Distributions of RMSB (a−c) and MRAB (d−f) of significant wave height simulated by the South China Sea model compared with the Beibu Gulf model

图 5 南海各月平均有效波高Hs和平均波向Dir(a−d)、谱峰周期Tp(e−h)以及风速Vw(i−l)的分布
Fig. 5 Distributions of month averaged significant wave height Hs and mean wave direction Dir (a−d), spectral peak period Tp (e−h) and wind speed Vw (i−l) in the South China Sea

图 6 北部湾各月平均有效波高Hs和平均波向Dir(a−d)以及谱峰周期Tp(e−h)的分布
Fig. 6 Distributions of month averaged significant wave height Hs and mean wave direction Dir (a−d), and spectral peak period Tp (e−h) in the Beibu Gulf
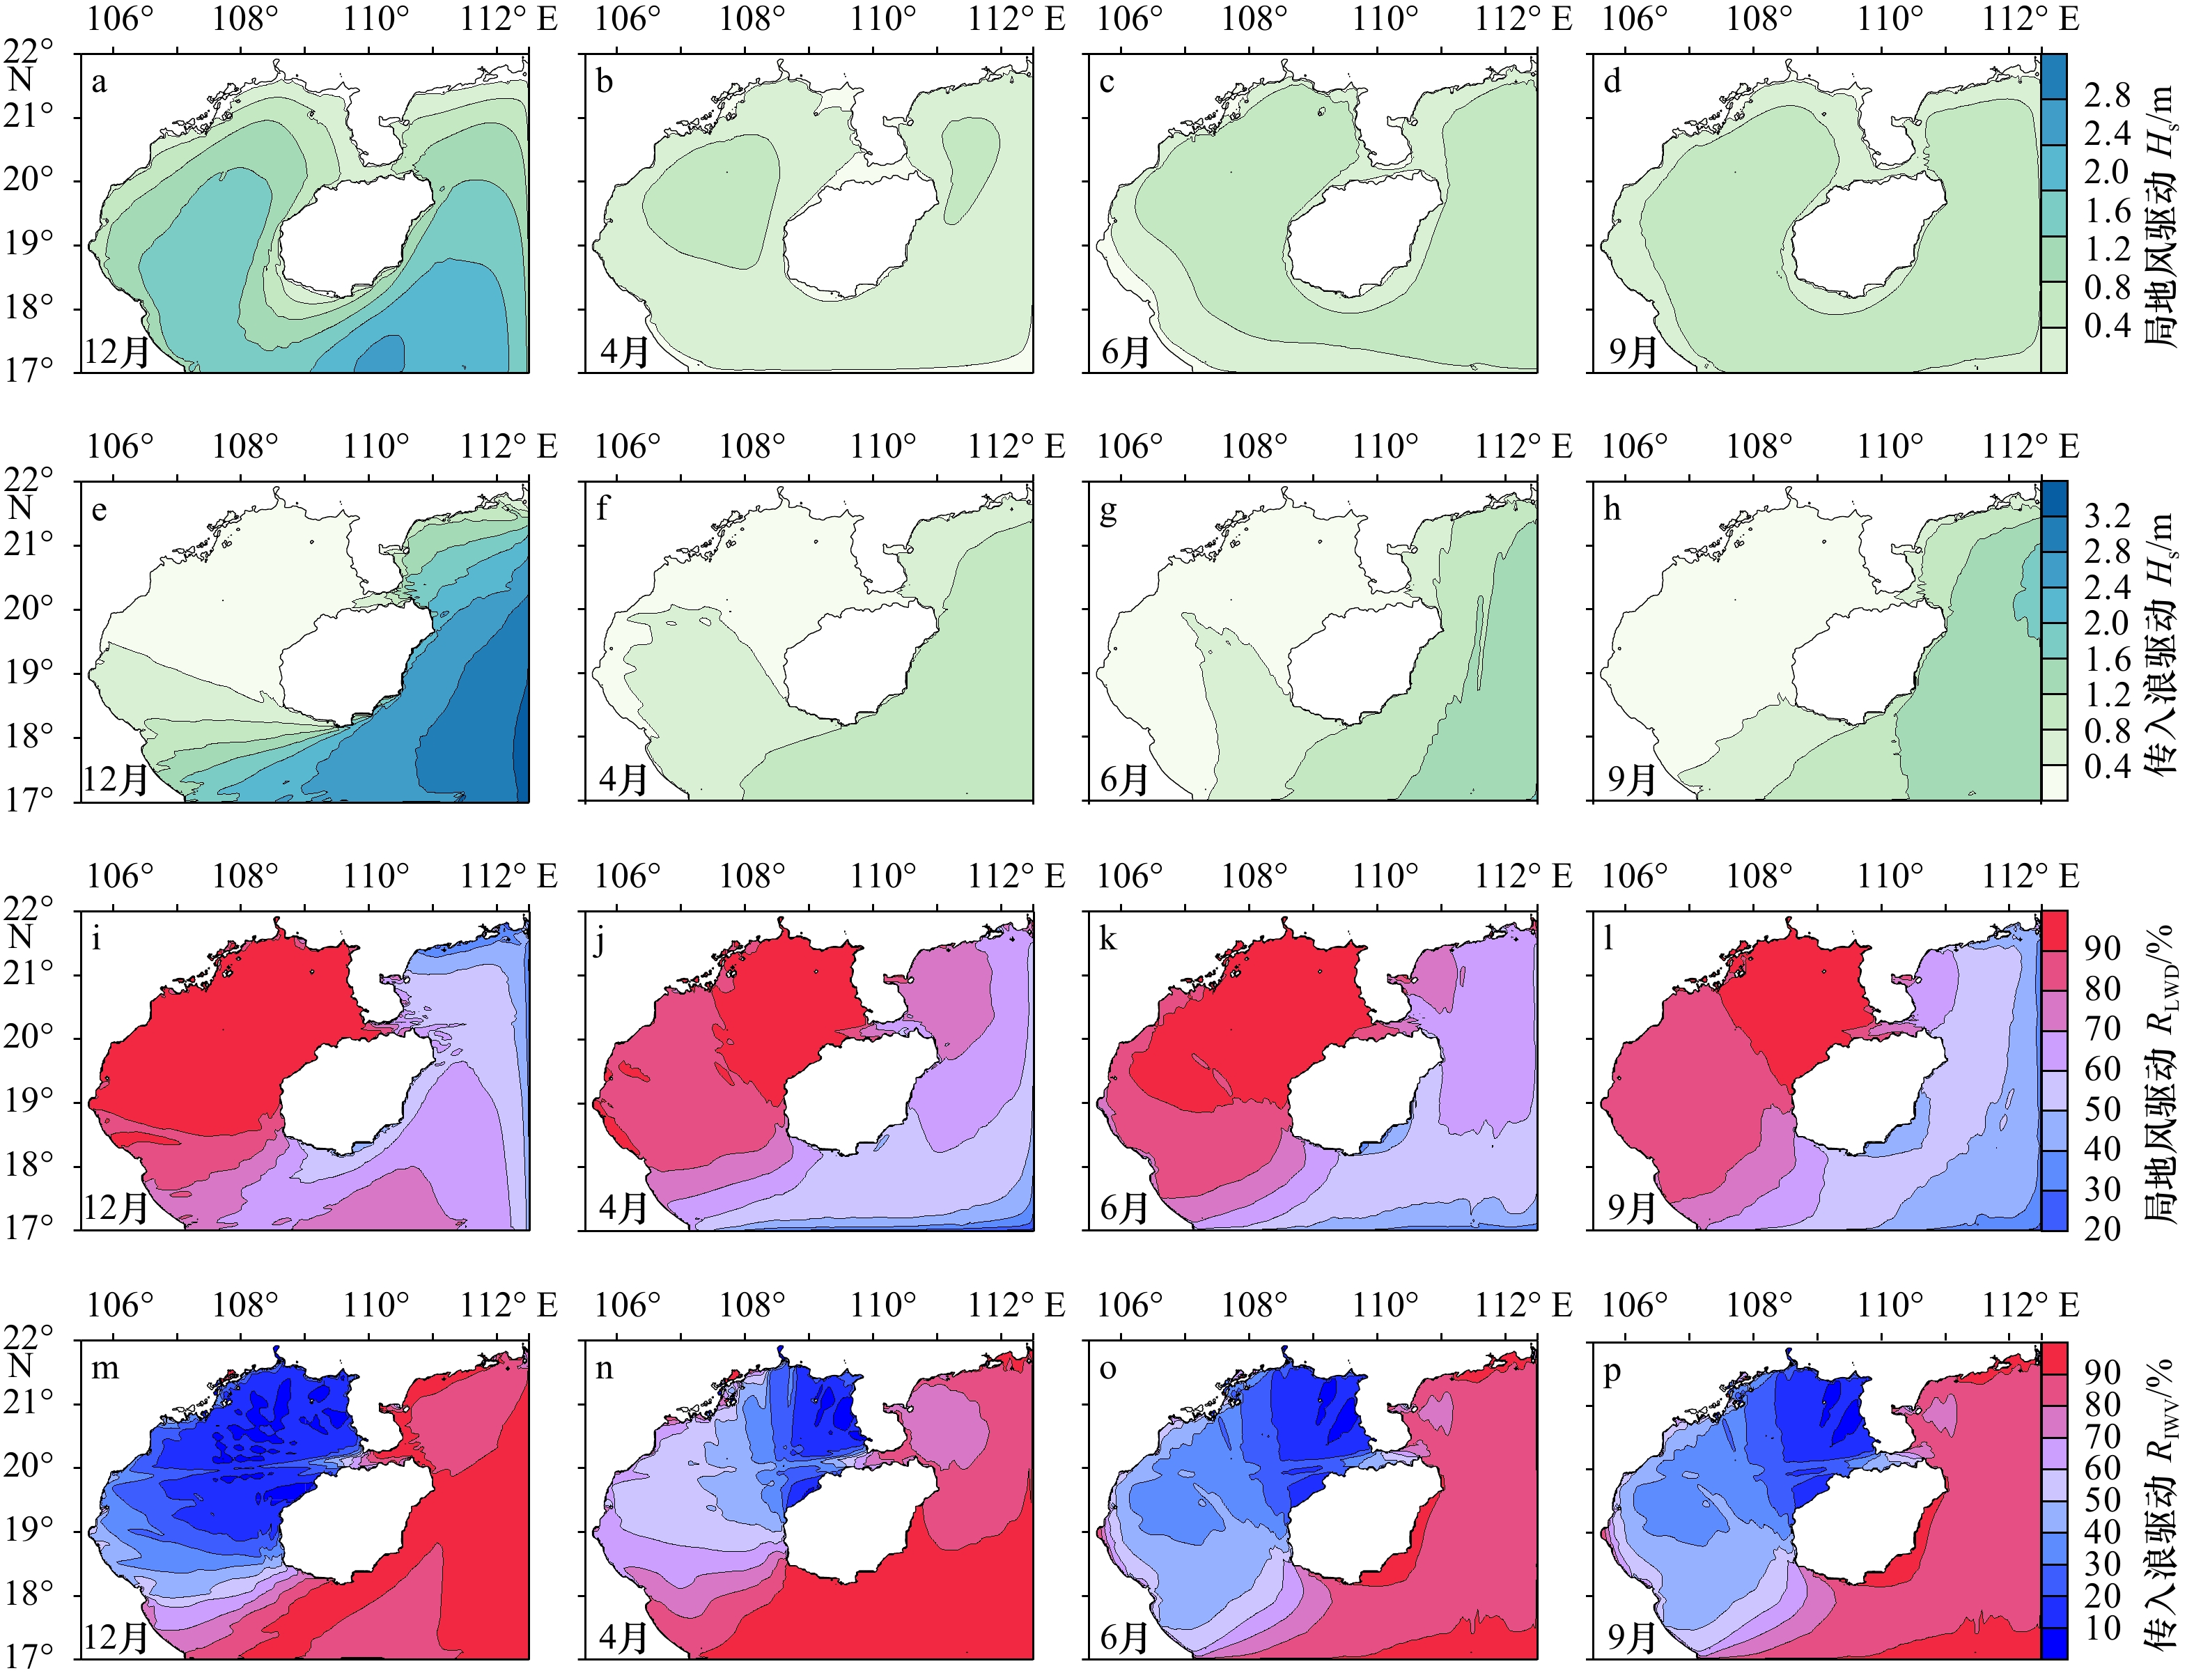
图 7 不同驱动因素模拟得到的月平均有效波高Hs(a−h)以及有效波高贡献比RLWD(i−l)和RIWV(m−p)
Fig. 7 Distributions of month averaged significant wave height Hs (a−h) and contribution percentage RLWD (i−1) and RIWV (m−p) to Hs by different driving factors
表 1 Jason-2卫星轨道交叉点附近的有效波高模拟值较卫星观测值的误差统计
Tab. 1 Error statistics for the simulated significant wave height against the Jason-2 observations at the satellite ground track intersections
点位 MB/m RMSB/m SI 点位 MB/m RMSB/m SI 点位 MB/m RMSB/m SI A1 −0.11 0.30 0.19 B1 −0.09 0.32 0.21 C1 −0.05 0.34 0.35 A2 −0.18 0.37 0.20 B2 −0.07 0.26 0.16 C2 −0.09 0.27 0.15 A3 −0.26 0.38 0.23 B3 −0.17 0.35 0.18 C3 0.01 0.44 0.21 A4 −0.16 0.35 0.24 B4 −0.19 0.38 0.19 C4 −0.07 0.52 0.23  下载: 导出CSV
表 2 近岸浮标BL站点有效波高Hs、平均波周期Tm和平均波向Dir模拟值较观测值的统计比较
Tab. 2 Statistics and comparisons for the results of significant wave height Hs, mean wave period Tm and mean wave direction Dir between numerical simulations and in-situ observations at the nearshore buoy Point BL
时
间参
数平均值 最大值 MB RMSB SI 模拟值 观测值 模拟值 观测值 夏季
风期Hs/m 0.51 0.54 1.68 1.77 −0.03 0.20 0.37 Tm/s 3.34 3.08 5.76 5.21 0.26 0.72 0.22 Dir/(°) 174 170 4 22 夏冬
转换Hs/m 0.33 0.39 3.03 3.30 −0.06 0.17 0.44 Tm/s 2.48 2.62 5.72 6.32 −0.14 0.47 0.18 Dir/(°) 107 117 −9 26 冬季
风期Hs/m 0.28 0.33 0.75 0.85 −0.04 0.12 0.37 Tm/s 2.29 2.45 5.13 4.92 −0.15 0.46 0.19 Dir/(°) 97 112 −16 28 冬夏
转换Hs/m 0.42 0.39 1.68 1.62 0.04 0.16 0.43 Tm/s 3.21 2.79 6.17 5.25 0.42 0.86 0.31 Dir/(°) 148 146 3 32
下载: 导出CSV
-
[1] Elko N, Feddersen F, Foster D, et al. The future of nearshore processes research[J]. Shore and Beach, 2015, 83(1): 13−38. [2] The WAMDI Group. The WAM model—A third generation ocean wave prediction model[J]. Journal of Physical Oceanography, 1988, 18(12): 1775−1810. doi: 10.1175/1520-0485(1988)018<1775:TWMTGO>2.0.CO;2 [3] Tolman H L. A third-generation model for wind waves on slowly varying, unsteady, and inhomogeneous depths and currents[J]. Journal of Physical Oceanography, 1991, 21(6): 782−797. doi: 10.1175/1520-0485(1991)021<0782:ATGMFW>2.0.CO;2 [4] Booij N, Ris R C, Holthuijsen L H. A third-generation wave model for coastal regions: 1. Model description and validation[J]. Journal of Geophysical Research: Oceans, 1999, 104(C4): 7649−7666. doi: 10.1029/98JC02622 [5] Rogers W E, Hwang P A, Wang D W. Investigation of wave growth and decay in the SWAN model: three regional-scale applications[J]. Journal of Physical Oceanography, 2003, 33(2): 366−389. doi: 10.1175/1520-0485(2003)033<0366:IOWGAD>2.0.CO;2 [6] Saha S, Moorthi S, Pan Hualu, et al. The NCEP climate forecast system reanalysis[J]. Bulletin of the American Meteorological Society, 2010, 91(8): 1015−1058. doi: 10.1175/2010BAMS3001.1 [7] Saha S, Moorthi S, Wu Xingren, et al. The NCEP climate forecast system version 2[J]. Journal of Climate, 2014, 27(6): 2185−2208. doi: 10.1175/JCLI-D-12-00823.1 [8] Dee D P, Uppala S M, Simmons A J, et al. The ERA-Interim reanalysis: configuration and performance of the data assimilation system[J]. Quarterly Journal of the Royal Meteorological Society, 2011, 137(656): 553−597. doi: 10.1002/qj.828 [9] Stopa J E, Cheung K F. Intercomparison of wind and wave data from the ECMWF reanalysis interim and the NCEP climate forecast system reanalysis[J]. Ocean Modelling, 2014, 75: 65−83. doi: 10.1016/j.ocemod.2013.12.006 [10] 林婧, 宋晓姜, 王彰贵. 中国近海ASCAT和ERA-Interim风场资料的评估[J]. 海洋预报, 2019, 36(1): 10−19.Lin Jing, Song Xiaojiang, Wang Zhanggui. Evaluation of ASCAT and ERA-interim wind data over China offshore seas[J]. Marine Forecasts, 2019, 36(1): 10−19. [11] Chawla A, Spindler D M, Tolman H L. Validation of a thirty year wave hindcast using the climate forecast system reanalysis winds[J]. Ocean Modelling, 2013, 70: 189−206. doi: 10.1016/j.ocemod.2012.07.005 [12] Shi Jian, Zheng Jinhai, Zhang Chi, et al. A 39-year high resolution wave hindcast for the Chinese coast: model validation and wave climate analysis[J]. Ocean Engineering, 2019, 183: 224−235. doi: 10.1016/j.oceaneng.2019.04.084 [13] He Hailun, Xu Yao. Wind-wave hindcast in the Yellow Sea and the Bohai Sea from the year 1988 to 2002[J]. Acta Oceanologica Sinica, 2016, 35(3): 46−53. doi: 10.1007/s13131-015-0786-5 [14] Liang Bingchen, Liu Xin, Li Huajun, et al. Wave climate hindcasts for the Bohai Sea, Yellow Sea, and East China Sea[J]. Journal of Coastal Research, 2016, 32(1): 172−180. [15] He Hailun, Song Jinbao, Bai Yefei, et al. Climate and extrema of ocean waves in the East China Sea[J]. Science China Earth Sciences, 2018, 61(7): 980−994. doi: 10.1007/s11430-017-9156-7 [16] 林刚. 南中国海风场和海浪场统计分析及其应用[D]. 大连: 大连理工大学, 2018.Lin Gang. Statistical analysis and application of wind field and sea wave field in South China Sea[D]. Dalian: Dalian University of Technology, 2018. [17] 韩树宗, 董杨杨, 张水平, 等. 南海波浪时空变化特征研究[J]. 海洋湖沼通报, 2020, 42(2): 1−9. doi: 10.13984/j.cnki.cn37-1141.2020.02.001Han Shuzong, Dong Yangyang, Zhang Shuiping, et al. Study of the temporal and spatial variations of wave in South China Sea[J]. Transactions of Oceanology and Limnology, 2020, 42(2): 1−9. doi: 10.13984/j.cnki.cn37-1141.2020.02.001 [18] Zhou Guoqing, Huang Jingjin, Yue Tao, et al. Temporal-spatial distribution of wave energy: a case study of Beibu Gulf, China[J]. Renewable Energy, 2015, 74: 344−356. doi: 10.1016/j.renene.2014.08.014 [19] Zhu Geli, Lin Wantao, Zhao Sen, et al. Spatial and temporal variation characteristics of ocean waves in the South China Sea during the boreal winter[J]. Acta Oceanologica Sinica, 2015, 34(1): 23−28. doi: 10.1007/s13131-015-0592-0 [20] Wang Huan, Fu Dongyang, Liu Dazhao, et al. Analysis and prediction of significant wave height in the Beibu Gulf, South China Sea[J]. Journal of Geophysical Research: Oceans, 2021, 126(3): e2020JC017144. [21] 陈奇礼, 冯伟忠, 蔡瑜瑄. 北部湾东北部的波浪特性[J]. 海洋通报, 1990, 9(1): 1−6.Chen Qili, Feng Weizhong, Cai Yuxuan. Wave characteristics in the northeastern Beibu Gulf[J]. Marine Science Bulletin, 1990, 9(1): 1−6. [22] Cavaleri L, Malanotte-Rizzoli P. Wind wave prediction in shallow water: theory and applications[J]. Journal Geophysical Research, 1981, 86(C11): 10961−10973. [23] Komen G J, Hasselmann S, Hasselmann K. On the existence of a fully developed wind-sea spectrum[J]. Journal of Physical Oceanography, 1984, 14: 1271−1285. [24] Hasselmann S, Hasselmann K, Allender J H, et al. Computations and parameterizations of the nonlinear energy transfer in a gravity wave spectrum. Part II: Parameterizations of the nonlinear transfer for application in wave models[J]. Journal of Physical Oceanography, 1985, 15(11): 1378−1391. [25] The SWAN Team. SWAN user manual—SWAN cycle III version 41.31AB[EB/OL]. [2022−03−01]. https://swanmodel.sourceforge.io/online_doc/swanuse/swanuse.html. [26] Collins J I. Prediction of shallow water spectra[J]. Journal Geophysical Research, 1972, 77(15): 2693−2707. [27] Yang Jingling, Jiang Shaocai, Wu Junshan, et al. Effects of wave-current interaction on the waves, cold-water mass and transport of diluted water in the Beibu Gulf[J]. Acta Oceanologica Sinica, 2020, 39(1): 25−40. doi: 10.1007/s13131-019-1529-9 [28] 王其松, 邓家泉, 刘诚, 等. 叠加风场在南海台风浪数值后报中的应用研究[J]. 海洋学报, 2017, 39(7): 70−79.Wang Qisong, Deng Jiaquan, Liu Cheng, et al. Application of superimposed wind fields to the hindcast modelling of typhoon-induced waves in the South China Sea[J]. Haiyang Xuebao, 2017, 39(7): 70−79. -

计量
- 文章访问数: 809
- HTML全文浏览量: 309
- PDF下载量: 143
- 被引次数: 0
