Study on the characteristics and diffusion fluxes of nutrients and metal elements in shallow sediment porewater of Shenzhen Bay and Maozhou River
-
摘要: 为了解湿地微环境中营养盐和金属元素的分布特征及其内在联系,并进一步估算两者在沉积物−水界面的扩散通量,本文借助薄膜扩散梯度技术获取深圳湾和茅洲河红树林湿地浅层沉积物孔隙水中营养盐和金属元素浓度以及二维高分辨有效态硫浓度分布。研究结果表明:除了
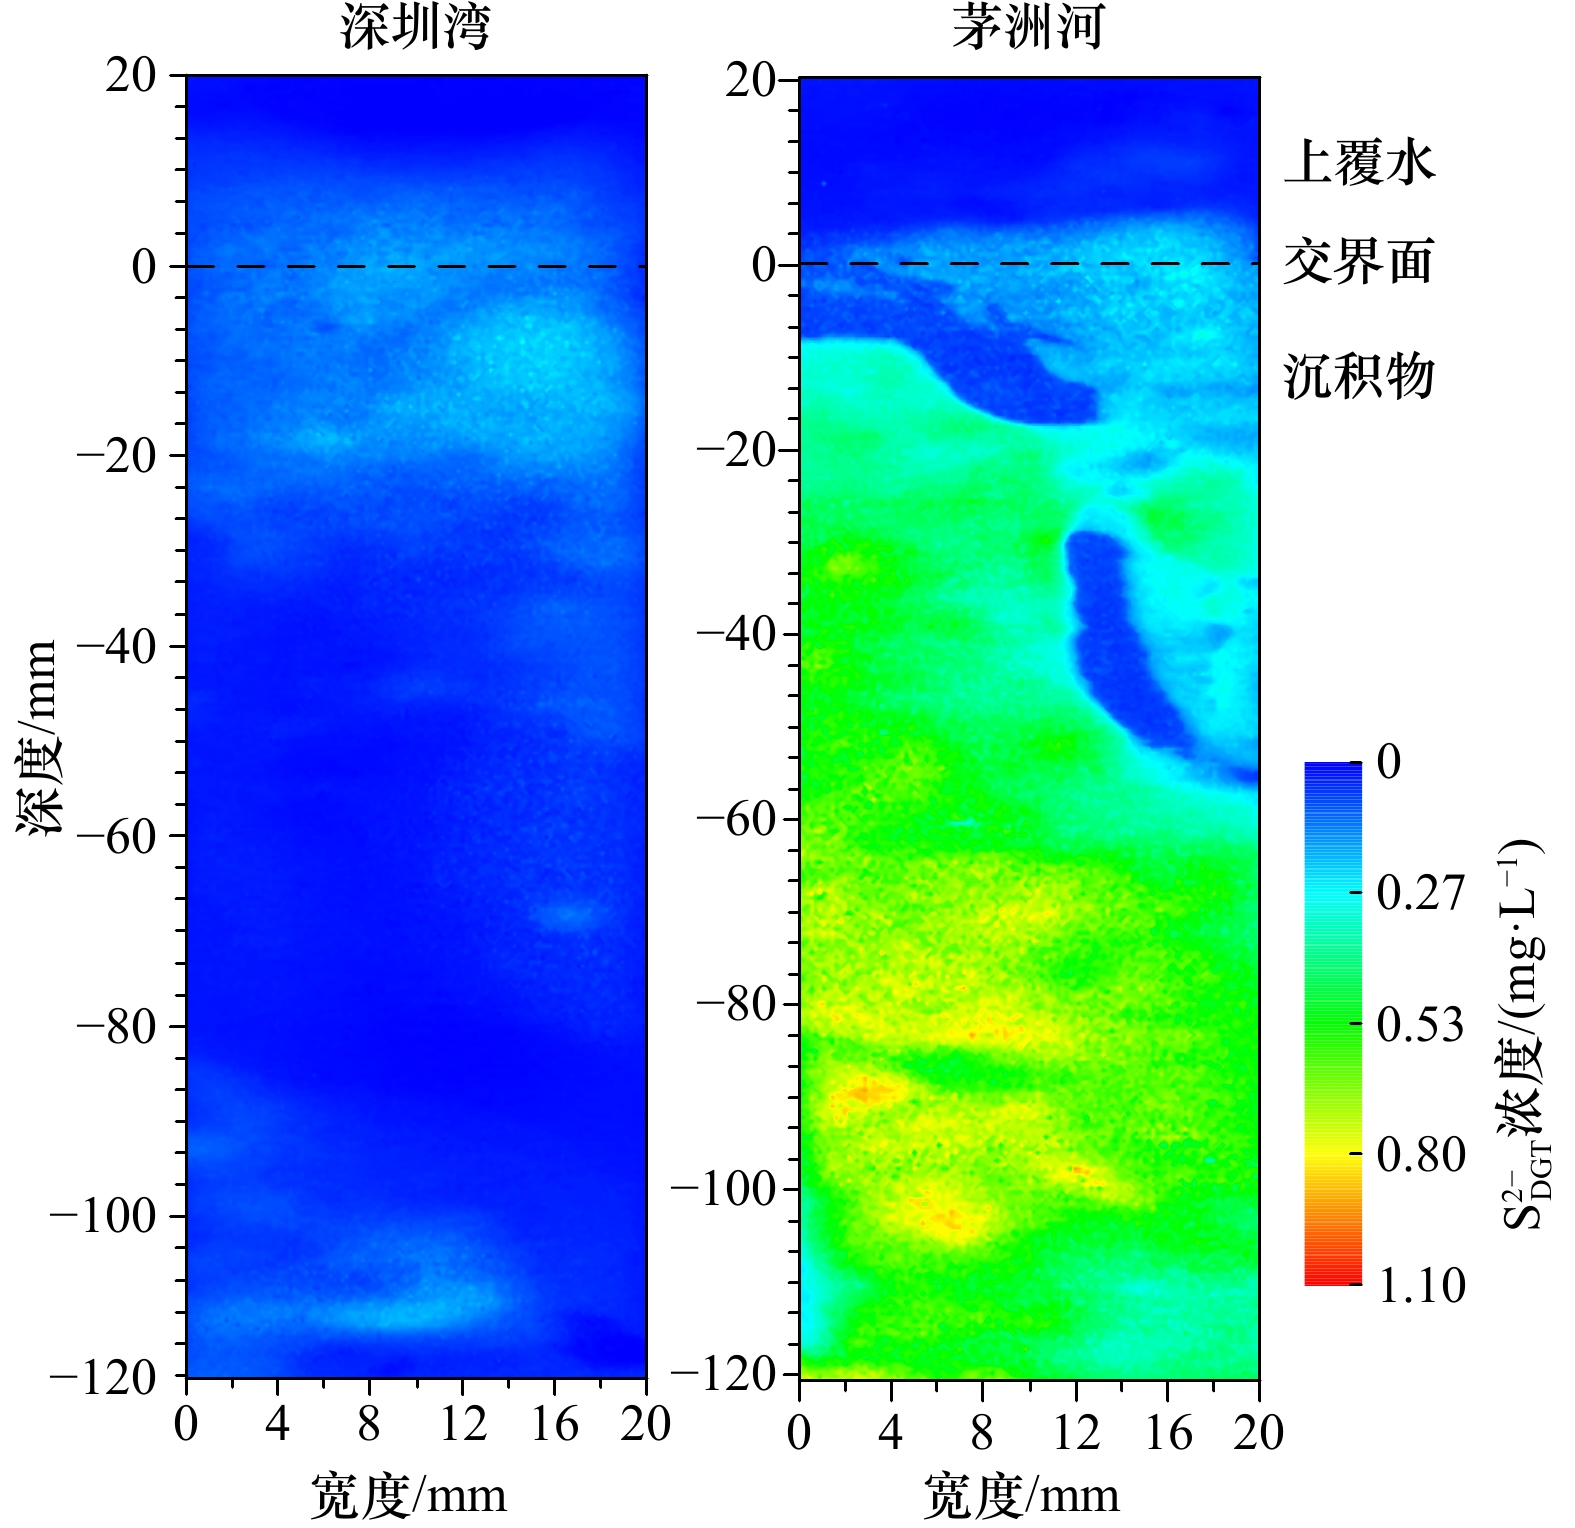
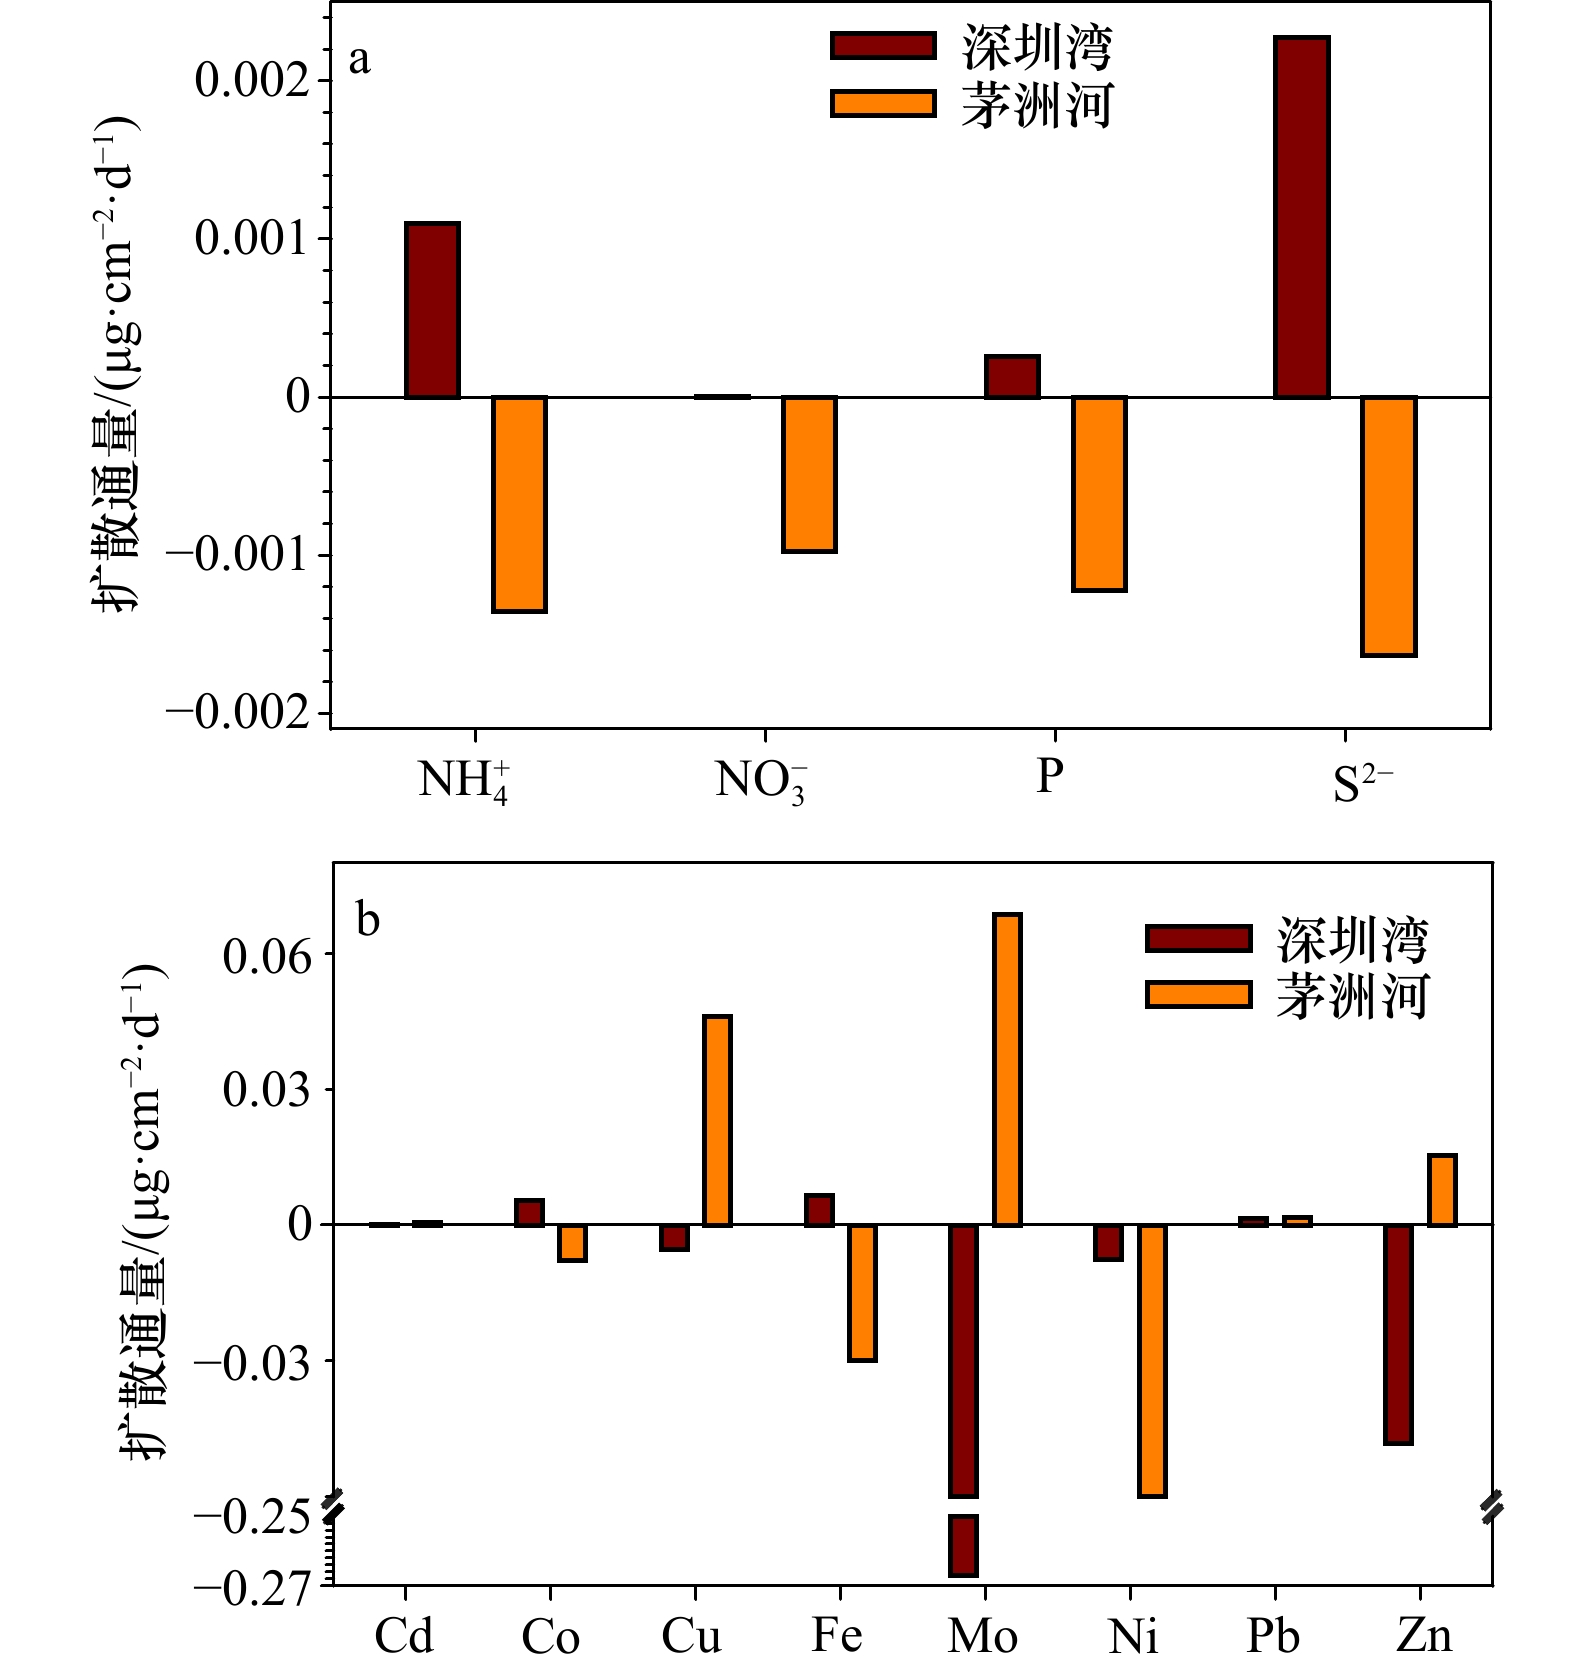
${\rm{NO}}_3^- $ 和Mo外,茅洲河沉积物孔隙水中${\rm{NH}}_4^+ $ 、P与S2−和重金属Cd、Co、Cu、Fe、Ni、Pb与Zn的平均浓度均高于上覆水和深圳湾水体中平均浓度,这说明茅洲河沉积物孔隙水的污染程度更高,但深圳湾水体中营养盐和金属元素等污染物来源多于茅洲河。茅洲河有效态硫浓度空间分布不均匀,存在明显的生物扰动通道,浓度值也随着沉积物深度逐渐增高。深圳湾在沉积物−水界面处营养盐和金属元素的扩散通量为−0.27~0.006 5 μg/(cm2·d),茅洲河的扩散通量为−0.061~0.069 μg/(cm2·d)。Abstract: In order to understand the distribution characteristics, relationships and diffusion fluxes of nutrients and metal elements across the sediment-water interface, we investigated the vertical profiles of nutrients and metal elements through the diffusive gradient in thin-films (DGT) technology in Shenzhen Bay (SZB) and Maozhou River (MZR). The two-dimensional high-resolution available sulfur (DGT-labile S) distributions were also synchronously measured. The results showed that the mean concentrations of${\rm{NH}}_4^+ $ , P and S2− and heavy metals of Cd, Co, Cu, Fe, Ni, Pb and Zn in porewater of MZR were significantly higher than those in the overlying water and the SZB, except for${\rm{NO}}_3^- $ and Mo. The pollution degree of nutrients and metal elements in porewater of MZR was generally higher than that in SZB, but the pollutants of nutrients and metal elements in SZB were more than those in MZR. The spatial distribution of DGT-labile S in MZR indicated the distinguish bioturbation-induced tubes, which enhanced the spatial heterogeneity and led the increasing of solute concentrations with sediment depths. The diffusion fluxes of nutrients and metal elements ranged from −0.27 μg/(cm2·d) to 0.0065 μg/(cm2·d) in SZB, and from −0.061μg/(cm2·d) to 0.069 μg/(cm2·d) in MZR.-
Key words:
- Shenzhen /
- diffusive gradient in thin-films /
- sediment /
- nutrients /
- heavy metals
-
图 3 沉积物−水界面上DGT有效态氮、磷和硫浓度垂向分布
SZB和MZR分别代表深圳湾和茅洲河;蓝色和黄色背景颜色分别表示上覆水和沉积物中孔隙水
Fig. 3 Vertical distribution of DGT-labile N, DGT-labile P and DGT-labile S concentrations at sediment-water interface
SZB and MZR represent Shenzhen Bay and Maozhou River, respectively; blue and yellow backgrounds indicate the overlying water and pore water in sediment, respectively
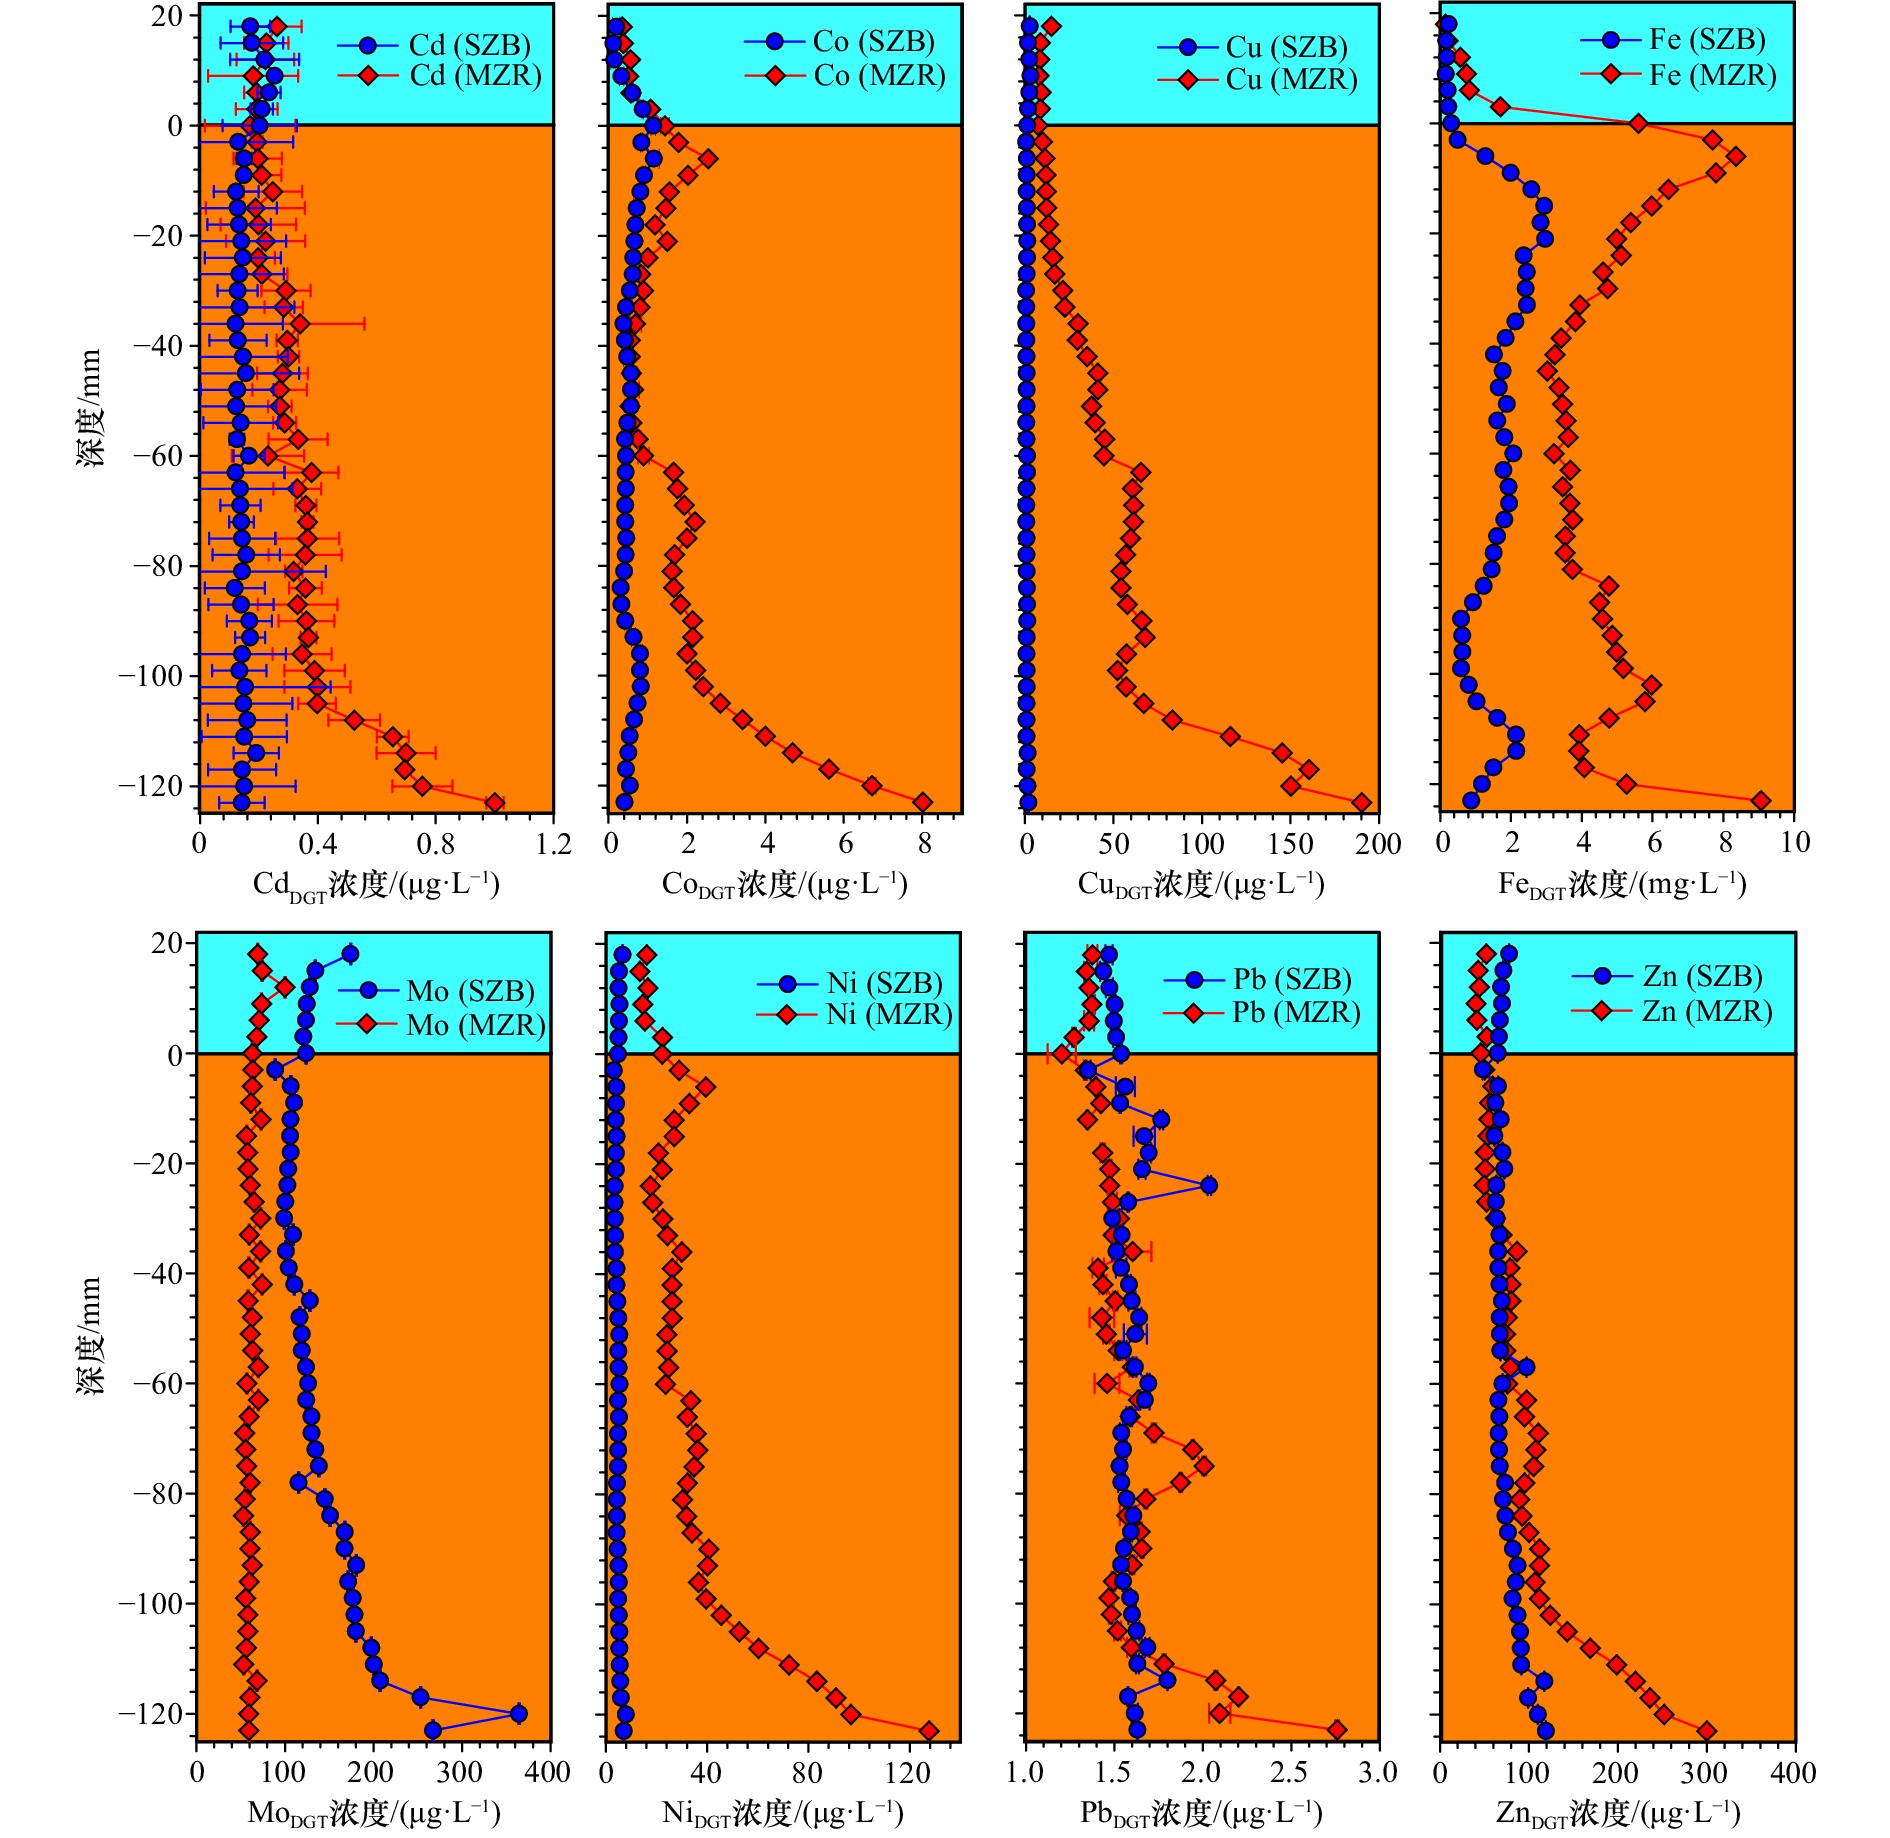
图 4 沉积物−水界面上DGT有效态金属元素浓度垂向分布
SZB和MZR分别代表深圳湾和茅洲河;蓝色和黄色背景颜色分别表示上覆水和沉积物中孔隙水
Fig. 4 Vertical distribution of DGT-labile metal elements concentration across the sediment-water interface
SZB and MZR represent Shenzhen Bay and Maozhou River, respectively; blue and yellow backgrounds indicate the overlying water and pore water in sediment, respectively
表 1 各种参数在水体中的提取率和上覆水中的扩散系数
Tab. 1 Extraction rate in water and diffusion coefficient in overlying water of various parameters
参数 $ {{\rm{NH}}_4^+} $ ${ {\rm{NO}}_3^-} $ P S2− Cd Co Cu Fe Mo Ni Pb Zn 提取效率 0.84 1.03 0.96 0.95 0.94 0.98 1.03 0.89 0.98 1.05 0.96 0.88 扩散系数 23.96 7.53 8.22 21.59 7.64 7.82 7.89 7.67 8.27 7.83 10.07 8.25 注:扩散系数单位为10−6 cm2/s,参数获取网址为http://www.easysensor.net/。 表 2 深圳湾和茅洲河在上覆水和孔隙水中DGT有效态氮、磷和硫浓度(单位:mg/L)
Tab. 2 The concentrations of DGT-labile N, DGT-labile P and DGT-labile S in overlying water and pore water of Shenzhen Bay and Maozhou River (unit: mg/L)
站点 ${{\rm{NH}}_{4 {\rm{DGT}}}^+ }$ ${{\rm{NO}}_{3 {\rm{DGT}}}^- }$ ${\rm{P}}_{\rm{DGT}} $ ${{\rm{S}}_{ {\rm{DGT} } }^{2-}}$ 深圳湾 上覆水 范围 0.05~0.20 0.07~0.09 0.04~0.10 0.003~0.12 均值 0.12 0.08 0.06 0.05 孔隙水 范围 0.04~0.24 0.06~0.13 0.06~0.29 0.01~0.15 均值 0.07 0.09 0.16 0.07 茅洲河 上覆水 范围 0.07~0.13 0.39~0.54 0.07~0.45 0.01~0.13 均值 0.10 0.45 0.21 0.06 孔隙水 范围 0.05~0.30 0.09~0.40 0.53~2.52 0.15~0.68 均值 0.11 0.17 0.89 0.45 表 3 深圳湾和茅洲河在上覆水和孔隙水中DGT有效态金属元素浓度
Tab. 3 The concentrations of DGT-labile metal elements in overlying water and pore water of Shenzhen Bay and Maozhou River
站点 CdDGT浓度/
(μg·L−1)CoDGT浓度/
(μg·L−1)CuDGT浓度/
(μg·L−1)FeDGT浓度/
(mg·L−1)MoDGT 浓度/
(μg·L−1)NiDGT浓度/
(μg·L−1)PbDGT浓度/
(μg·L−1)ZnDGT浓度/
(μg·L−1)深圳湾 上覆水 范围 0.17~0.25 0.12~1.14 1.33~3.16 0.16~0.32 120.77~174.03 4.82~6.59 1.44~1.54 65.03~77.74 均值 0.21 0.49 2.27 0.22 132.77 5.32 1.49 69.55 孔隙水 范围 0.12~0.19 0.31~1.16 0.72~2.05 0.49~2.97 88.90~364.31 3.16~7.88 1.35~2.04 48.31~119.09 均值 0.14 0.57 1.05 1.68 145.54 4.71 1.61 75.91 茅洲河 上覆水 范围 0.17~0.26 0.35~1.44 7.51~15.09 0.15~5.60 63.19~100.08 13.43~22.35 1.20~1.38 40.53~52.90 均值 0.21 0.70 9.43 1.40 74.18 17.27 1.33 45.71 孔隙水 范围 0.19~1.00 0.55~8.02 10.03~190.22 3.03~9.07 52.99~74.25 17.62~127.62 1.34~2.76 49.52~300.03 均值 0.36 2.05 54.98 4.70 61.17 39.02 1.62 104.70 表 4 不同地点沉积物−水界面处磷和金属元素的扩散通量(单位:10−3 μg/(cm2·d))
Tab. 4 Diffusion fluxes of phosphorus and metal elements at sediment-water interface in different sites (unit: 10−3 μg/(cm2·d))
地点 P Cd Co Cu Fe Mo Ni Pb Zn 文献 太湖 −21~65 nd nd nd nd nd nd nd nd 文献[35] 洞庭湖 −3~20 nd nd nd nd nd nd nd nd 文献[12] 泰国宋卡湖 nd −0.015~0.004 7 0~0.58 −0.34~0.19 −94.95~2580.27 nd 0~0.53 −0.25~0.33 −7.85~2.09 文献[36] 珠江口 nd nd nd −44~24 nd nd −56~18 nd −3.5~11 文献[37] 白洋淀 nd 0.17 nd −43~30 nd nd −160~79 0.86~720 −41~1 420 文献[38] 三峡水库 nd nd nd nd nd −120~300 nd nd nd 文献[39] 营口湾 nd 0.75 −0.21 −126.90 −1 623.00 nd −1.22 18.46 −0.11 文献[40] 深圳湾 0.26 0.13 5.55 −5.36 6.55 −267.06 −7.7 1.4 −48.29 本文 茅洲河 −1.22 0.57 −7.88 46.12 −29.78 68.73 −61.44 1.76 15.49 本文 注:表中“nd”代表没有数据。 -
[1] Fones G R, Davison W, Holby O, et al. High-resolution metal gradients measured by in situ DGT/DET deployment in Black Sea sediments using an autonomous benthic lander[J]. Limnology and Oceanography, 2001, 46(4): 982−988. doi: 10.4319/lo.2001.46.4.0982 [2] 范成新. 湖泊沉积物−水界面研究进展与展望[J]. 湖泊科学, 2019, 31(5): 1191−1218. doi: 10.18307/2019.0514Fan Chengxin. Advances and prospect in sediment-water interface of lakes: a review[J]. Journal of Lake Sciences, 2019, 31(5): 1191−1218. doi: 10.18307/2019.0514 [3] Cai Pinghe, Shi Xiangming, Moore W S, et al. 224Ra: 228Th disequilibrium in coastal sediments: implications for solute transfer across the sediment-water interface[J]. Geochimica et Cosmochimica Acta, 2014, 125: 68−84. doi: 10.1016/j.gca.2013.09.029 [4] Conley D J, Paerl H W, Howarth R W, et al. Controlling eutrophication: nitrogen and phosphorus[J]. Science, 2009, 323(5917): 1014−1015. doi: 10.1126/science.1167755 [5] 张小勇, 杨茜, 孙耀, 等. 黄东海陆架区沉积物中磷的形态分布及生物可利用性[J]. 生态学报, 2013, 33(11): 3509−3519. doi: 10.5846/stxb201203100324Zhang Xiaoyong, Yang Qian, Sun Yao, et al. The distribution of phosphorus forms and bioavailability in sediments from Huang Dong Hai continental shelf[J]. Acta Ecologica Sinica, 2013, 33(11): 3509−3519. doi: 10.5846/stxb201203100324 [6] Di Toro D M, Mahony J D, Hansen D J, et al. Acid volatile sulfide predicts the acute toxicity of cadmium and nickel in sediments[J]. Environmental Science & Technology, 1992, 26(1): 96−101. [7] Wang Haotian, Wang Jiawei, Liu Ruimin, et al. Spatial variation, environmental risk and biological hazard assessment of heavy metals in surface sediments of the Yangtze River Estuary[J]. Marine Pollution Bulletin, 2015, 93(1/2): 250−258. [8] Shaheen S M, Abdelrazek M A S, Elthoth M, et al. Potentially toxic elements in saltmarsh sediments and common reed (Phragmites australis) of Burullus coastal lagoon at North Nile Delta, Egypt: a survey and risk assessment[J]. Science of the Total Environment, 2019, 649: 1237−1249. doi: 10.1016/j.scitotenv.2018.08.359 [9] Hao Zhe, Chen Lihong, Wang Chenglong, et al. Heavy metal distribution and bioaccumulation ability in marine organisms from coastal regions of Hainan and Zhoushan, China[J]. Chemosphere, 2019, 226: 340−350. doi: 10.1016/j.chemosphere.2019.03.132 [10] Liu Xianbin, Li Deliang, Song Guisheng. Assessment of heavy metal levels in surface sediments of estuaries and adjacent coastal areas in China[J]. Frontiers of Earth Science, 2017, 11(1): 85−94. doi: 10.1007/s11707-016-0569-0 [11] 潘峰, 郭占荣, 刘花台, 等. 潮滩沉积物−水界面磷、铁的高分辨率分布特征及生物地球化学行为[J]. 地球科学, 2018, 43(11): 4109−4119.Pan Feng, Guo Zhanrong, Liu Huatai, et al. High-resolution distribution and biogeochemical behavior of phosphorus and iron at sediment-water interface of tidal flat[J]. Earth Science, 2018, 43(11): 4109−4119. [12] Ding Shiming, Han Chao, Wang Yanping, et al. In situ, high-resolution imaging of labile phosphorus in sediments of a large eutrophic lake[J]. Water Research, 2015, 74: 100−109. doi: 10.1016/j.watres.2015.02.008 [13] Ding Shiming, Chen Musong, Gong Mengdan, et al. Internal phosphorus loading from sediments causes seasonal nitrogen limitation for harmful algal blooms[J]. Science of the Total Environment, 2018, 625: 872−884. doi: 10.1016/j.scitotenv.2017.12.348 [14] Rong Nan, Lu Wenzhou, Zhang Chaoyu, et al. In situ high-resolution measurement of phosphorus, iron and sulfur by diffusive gradients in thin films in sediments of black-odorous rivers in the Pearl River Delta region, South China[J]. Environmental Research, 2020, 189: 109918. doi: 10.1016/j.envres.2020.109918 [15] Pan Feng, Liu Huatai, Guo Zhanrong, et al. Metal/metalloid and phosphorus characteristics in porewater associated with manganese geochemistry: a case study in the Jiulong River Estuary, China[J]. Environmental Pollution, 2019, 255: 113134. doi: 10.1016/j.envpol.2019.113134 [16] Pan Feng, Guo Zhanrong, Cai Yu, et al. High-resolution imaging of labile P & S in coastal sediment: insight into the kinetics of P mobilization associated with sulfate reduction[J]. Marine Chemistry, 2020, 225: 103851. doi: 10.1016/j.marchem.2020.103851 [17] 潘峰, 郭占荣, 蔡宇, 等. 厦门潮间带沉积物磷、铁和硫的时空分布及磷释放风险研究[J]. 海洋学报, 2021, 43(4): 14−26.Pan Feng, Guo Zhanrong, Cai Yu, et al. Spatio-temporal variation of phosphorus, iron and sulfur in intertidal sediments of Xiamen and associated release risk of phosphorus[J]. Haiyang Xuebao, 2021, 43(4): 14−26. [18] Pan Feng, Cai Yu, Guo Zhanrong, et al. Kinetic characteristics of mobile Mo associated with Mn, Fe and S redox geochemistry in estuarine sediments[J]. Journal of Hazardous Materials, 2021, 418: 126200. doi: 10.1016/j.jhazmat.2021.126200 [19] Lin Tao, Yu Huiqing, Wang Qi, et al. Surface water quality assessment based on the integrated water quality index in the Maozhou River Basin, Guangdong, China[J]. Environmental Earth Sciences, 2021, 80(10): 368. doi: 10.1007/s12665-021-09670-y [20] Wang Guanying, Zhang Yizhang, Wang Jinhua, et al. Spatial distribution and ecological risk assessment of heavy metals in sediments of a heavily polluted Maozhou River, southern China[J]. Bulletin of Environmental Contamination and Toxicology, 2021, 106(5): 844−851. doi: 10.1007/s00128-021-03202-x [21] Yan Qi, Cheng Tingting, Song Junting, et al. Internal nutrient loading is a potential source of eutrophication in Shenzhen Bay, China[J]. Ecological Indicators, 2021, 127: 107736. doi: 10.1016/j.ecolind.2021.107736 [22] 万由鹏, 毛献忠. 深圳湾TIN和 $ {{\rm{PO}}_4^{3-}} $ -P数值模拟及减排效果分析[J]. 环境科学, 2011, 32(2): 384−391.Wan Youpeng, Mao Xianzhong. Simulation and evaluation on TIN and${{\rm{PO}}_4^{3-}} $ -P reduction in Deep Bay, China[J]. Environmental Science, 2011, 32(2): 384−391.[23] 时运红, 李明远, 李波, 等. 深圳湾沉积物重金属污染时空分布特征[J]. 海洋环境科学, 2017, 36(2): 186−191, 208.Shi Yunhong, Li Mingyuan, Li Bo, et al. Spatial and temporal distribution of heavy metals in the sediment of Shenzhen Bay[J]. Marine Environmental Science, 2017, 36(2): 186−191, 208. [24] 王琳, 陈上群. 深圳湾自然条件特征及治理应注意的问题[J]. 人民珠江, 2001(6): 4−7. doi: 10.3969/j.issn.1001-9235.2001.06.002Wang Lin, Chen Shangqun. Features of natural condition of Shenzhen Bay and problems needed to pay attention to during improvement[J]. Pearl River, 2001(6): 4−7. doi: 10.3969/j.issn.1001-9235.2001.06.002 [25] Zhou Yun, Wang Linlin, Zhou Yanyan, et al. Eutrophication control strategies for highly anthropogenic influenced coastal waters[J]. Science of the Total Environment, 2020, 705: 135760. doi: 10.1016/j.scitotenv.2019.135760 [26] 黄徐, 罗欢, 吴琼, 等. 不同方法评价深圳湾富营养化问题的研究[J]. 生态科学, 2020, 39(4): 226−232.Huang Xu, Luo Huan, Wu Qiong, et al. Study on the evaluation of eutrophication in Shenzhen Bay by different methods[J]. Ecological Science, 2020, 39(4): 226−232. [27] Zhang Shiyan, Mao Xianzhong. Hydrology, sediment circulation and long-term morphological changes in highly urbanized Shenzhen River Estuary, China: a combined field experimental and modeling approach[J]. Journal of Hydrology, 2015, 529: 1562−1577. doi: 10.1016/j.jhydrol.2015.08.027 [28] 仝晓辉, 汪银龙, 刘晓宁, 等. 深圳河水体污染特征分析及整治措施[J]. 中国给水排水, 2020, 36(7): 52−59.Tong Xiaohui, Wang Yinlong, Liu Xiaoning, et al. Pollution characteristics analysis and control measures of Shenzhen River[J]. China Water & Wastewater, 2020, 36(7): 52−59. [29] Xu Di, Wu Wei, Ding Shiming, et al. A high-resolution dialysis technique for rapid determination of dissolved reactive phosphate and ferrous iron in pore water of sediments[J]. Science of the Total Environment, 2012, 421−422: 245−252. doi: 10.1016/j.scitotenv.2012.01.062 [30] Wang Yan, Liu Ruhai, Zhang Yuqing, et al. Transport of heavy metals in the Huanghe River Estuary, China[J]. Environmental Earth Sciences, 2016, 75(4): 288. doi: 10.1007/s12665-015-4908-3 [31] Ding Shiming, Wang Yan, Xu Di, et al. Gel-based coloration technique for the submillimeter-scale imaging of labile phosphorus in sediments and soils with diffusive gradients in thin films[J]. Environmental Science & Technology, 2013, 47(14): 7821−7829. [32] 王文彬. 深圳市南山区软土工程地质特性及其固结沉降分析[D]. 广州: 广州大学, 2011.Wang Wenbin. geological characteristics and consolidation settlement analysis of soft soil in Nanshan Shenzhen[D]. Guangzhou: Guangzhou University, 2011. [33] Gao Bo, Gao Li, Xu Dongyu, et al. A novel method for evaluating the potential release of trace metals associated with rainfall leaching/runoff from urban soils[J]. Science of the Total Environment, 2019, 664: 37−44. doi: 10.1016/j.scitotenv.2019.01.418 [34] Ullman W J, Aller R C. Diffusion coefficients in nearshore marine sediments[J]. Limnology and Oceanography, 1982, 27(3): 552−556. doi: 10.4319/lo.1982.27.3.0552 [35] Gao Yulu, Liang Tao, Tian Shuhan, et al. High-resolution imaging of labile phosphorus and its relationship with iron redox state in lake sediments[J]. Environmental Pollution, 2016, 219: 466−474. doi: 10.1016/j.envpol.2016.05.053 [36] Pradit S, Gao Yue, Faiboon A, et al. Application of DET (diffusive equilibrium in thin films) and DGT (diffusive gradients in thin films) techniques in the study of the mobility of sediment-bound metals in the outer section of Songkhla Lake, southern Thailand[J]. Environmental Monitoring & Assessment, 2013, 185(5): 4207−4220. [37] Liu Wei, Lu Guangyuan, Wang Wenxiong. In situ high-resolution two-dimensional profiles of redox sensitive metal mobility in sediment-water interface and porewater from estuarine sediments[J]. Science of the Total Environment, 2022, 820: 153034. doi: 10.1016/j.scitotenv.2022.153034 [38] 王健康. 白洋淀典型重金属的沉积物−水界面过程及其迁移转化机制研究[D]. 重庆: 重庆大学, 2020.Wang Jiankang. Study on the migration and transformation mechanism of typical heavy metals in sediment-water interface process of Baiyangdian Lake[D]. Chongqing: Chongqing University, 2020. [39] Gao Li, Gao Bo, Peng Wenqi, et al. Assessing potential release tendency of As, Mo and W in the tributary sediments of the Three Gorges Reservoir, China[J]. Ecotoxicology and Environmental Safety, 2018, 147: 342−348. doi: 10.1016/j.ecoenv.2017.08.036 [40] Wu Zhihao, Wang Shengrui, He Mengchang, et al. The measurement of metals by diffusive gradients in thin films (DGT) at sediment/water interface (SWI) of bay and remobilization assessment[J]. Environmental Earth Sciences, 2015, 73(10): 6283−6295. doi: 10.1007/s12665-014-3851-z [41] Luo Manhua, Zhang Yan, Li Hailong, et al. Pollution assessment and sources of dissolved heavy metals in coastal water of a highly urbanized coastal area: the role of groundwater discharge[J]. Science of the Total Environment, 2021, 807: 151070. [42] 何怡, 门彬, 杨晓芳, 等. 生物扰动对沉积物中重金属迁移转化影响的研究进展[J]. 生态毒理学报, 2016, 11(6): 25−36.He Yi, Men Bin, Yang Xiaofang, et al. Bioturbation effect on the migration and transformation of heavy metals in sediment: a review[J]. Asian Journal of Ecotoxicology, 2016, 11(6): 25−36. -


 下载:
下载:
