

Impact of medium and high spatial resolution wide band optical satellite sensor parameters on red tide detection
-
摘要: 中高空间分辨率宽波段光学卫星已成为赤潮监测的主要数据源,但与水色卫星传感器不同,中高空间分辨率卫星传感器主要面向陆地应用,其波段数量少、宽度大,由此对赤潮探测带来的影响尚待研究。为此,本文基于不同优势种赤潮实测高光谱数据、时空同步的GF-1 WFV2、GF-1 WFV3传感器影像、Sentinel-2A MSI传感器影像及GF-6 WFV传感器影像,探究了波段设置、光谱响应函数、信噪比及空间分辨率对赤潮探测的影响,并分析了红边波段赤潮探测优势。结果表明:波段设置对赤潮探测影响大,特别是红光波段和红边波段的中心波长和波段宽度;波段设置相同的情况下,赤潮探测精度受光谱响应函数的影响大,受信噪比的影响较小;空间分辨率对赤潮探测的影响较大,空间分辨率的提升有助于提高赤潮探测的精度。红边波段赤潮探测实验表明,较之红光波段,基于红边波段的赤潮探测具有明显的优势,平均F1-Score提高了11%。本文的研究结果一方面可为赤潮中高空间分辨率卫星探测的数据选取提供理论依据,另一方面可为中高空间分辨率卫星传感器的设计提供参考。Abstract: Medium and high spatial resolution wide-band optical satellites have become the main data source for red tide monitoring, but unlike the ocean color satellite sensors, the medium and high spatial resolution satellite sensors are mainly oriented to terrestrial applications with a small number of bands and a large band width, and the resulting impact on red tide detection has yet to be studied. Therefore, this paper explores the effects of band settings, spectral response functions, signal-to-noise ratio and spatial resolution on red tide detection based on the actual hyperspectral data of different dominant species of red tide, spatio-temporally synchronized GF-1 WFV2 and GF-1 WFV3 sensor images, Sentinel-2A MSI sensor images and GF-6 WFV sensor images, and analyzes the advantages of red-edge band on red tide detection. Our results show that: the band settings have a great influence on the red tide detection, especially the central wavelength and band width of the red band and the red edge band; the red tide detection accuracy is greatly influenced by the spectral response function and less influenced by the signal-to-noise ratio under the same band settings; the spatial resolution has a greater influence on the red tide detection, and the improvement of spatial resolution helps to improve the accuracy of red tide detection. The experiments of red-edge band red tide detection show that red-edge band red tide detection has obvious advantages over red-light band red tide detection, and the F1-Score is improved by 11% on average. The results of this paper provide a theoretical basis for the data selection of red tide detection from medium and high spatial resolution satellites on the one hand, and a reference for the design of medium and high spatial resolution satellite sensors on the other hand.
-
Key words:
- medium and high spatial resolution /
- wide band /
- satellite sensor /
- red tide detection
-
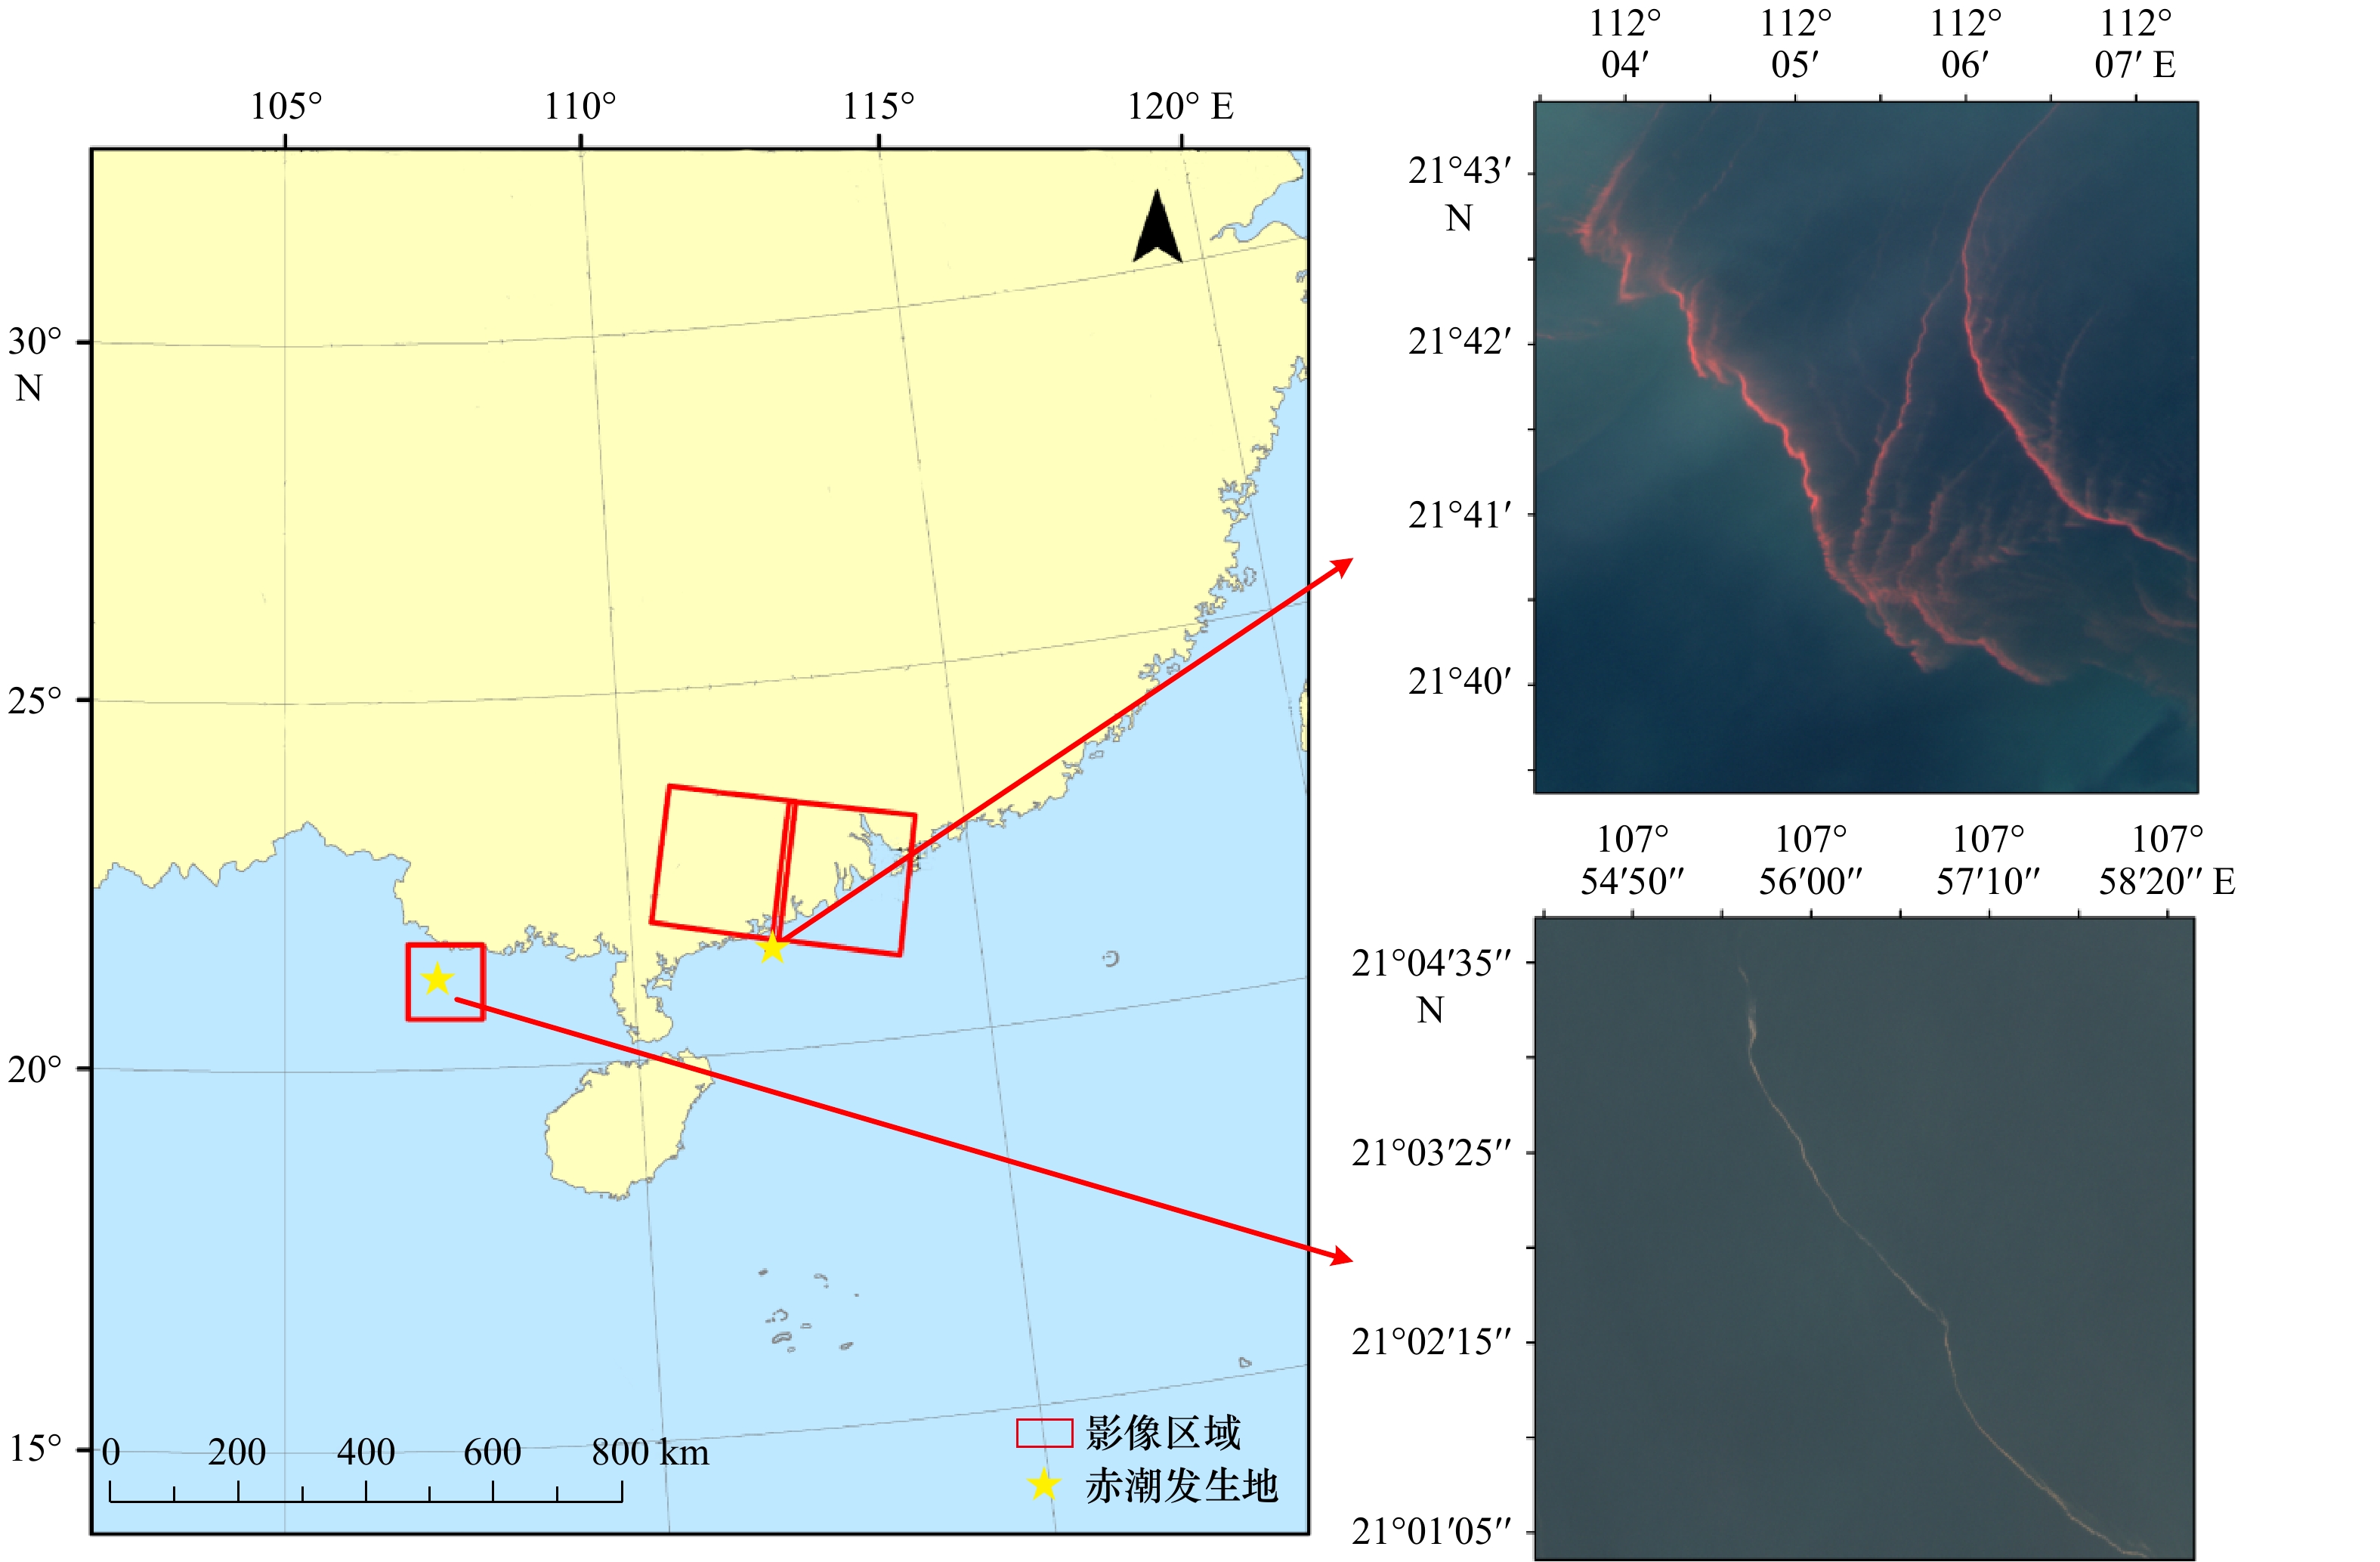
图 1 研究区及赤潮卫星影像示意图
Fig. 1 Schematic diagram of the study area and satellite images of red tide
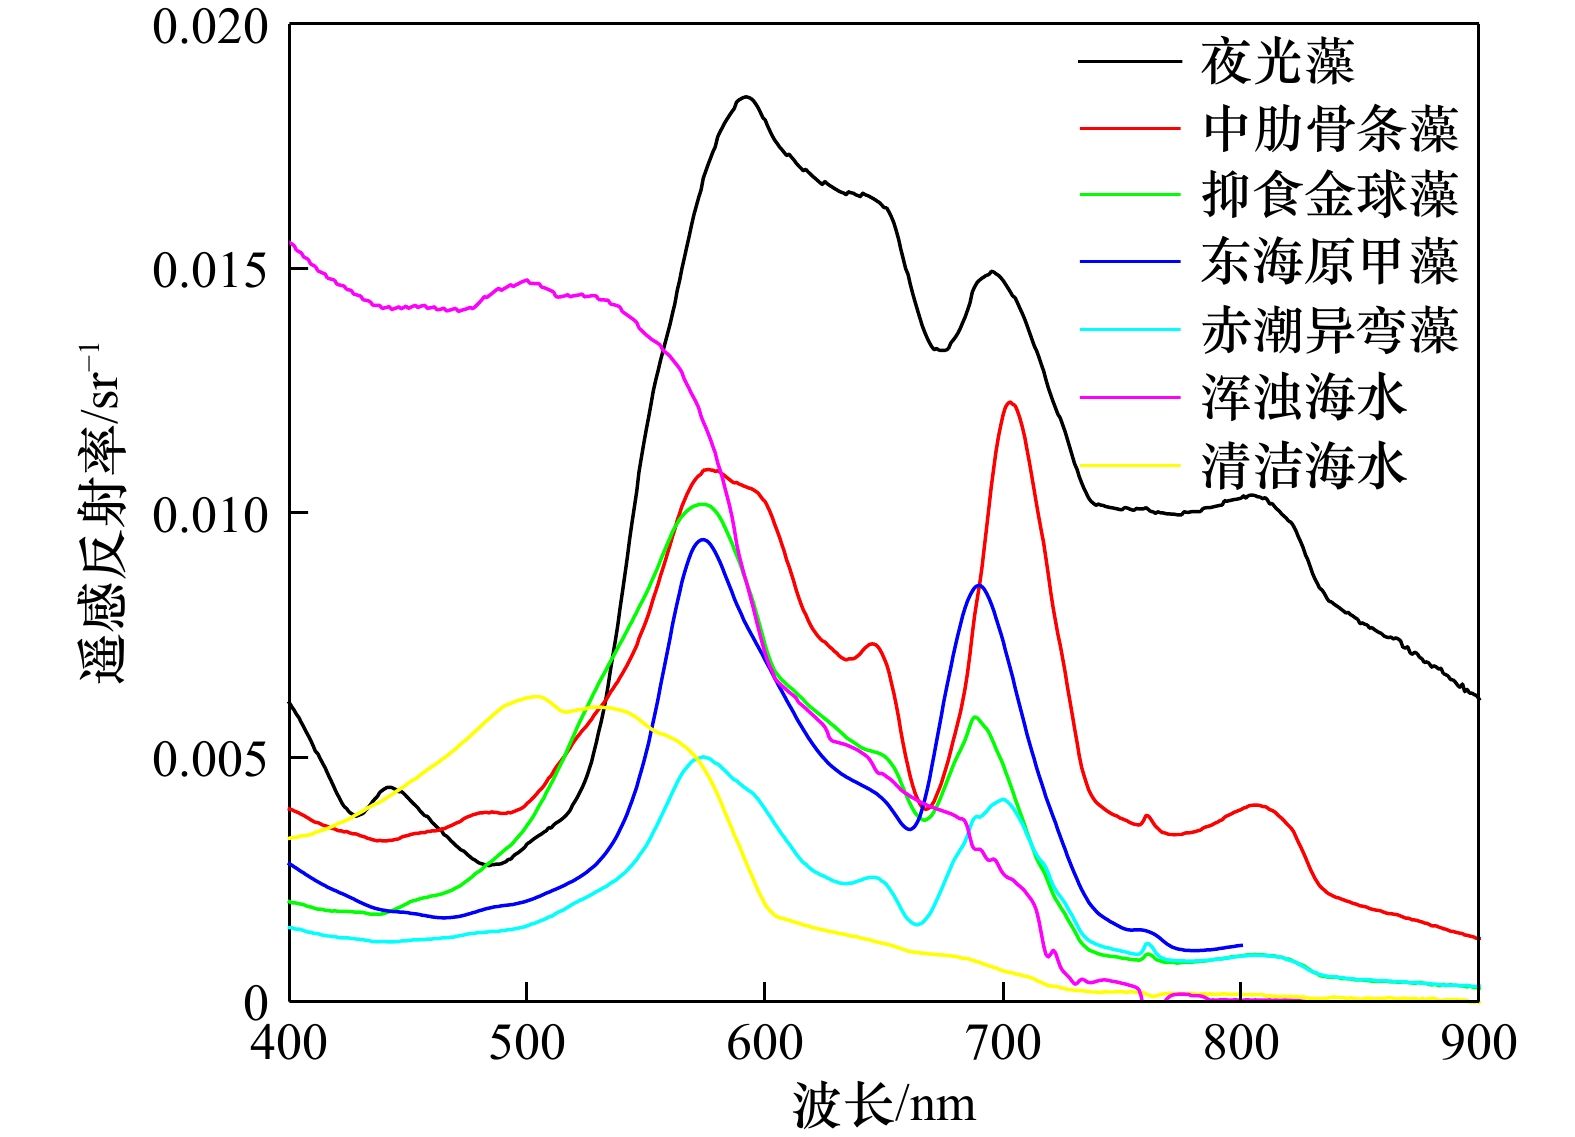
图 2 不同优势种赤潮及不同类型海水实测高光谱数据
Fig. 2 Hyperspectral data of different dominant species of red tide and different types of seawater
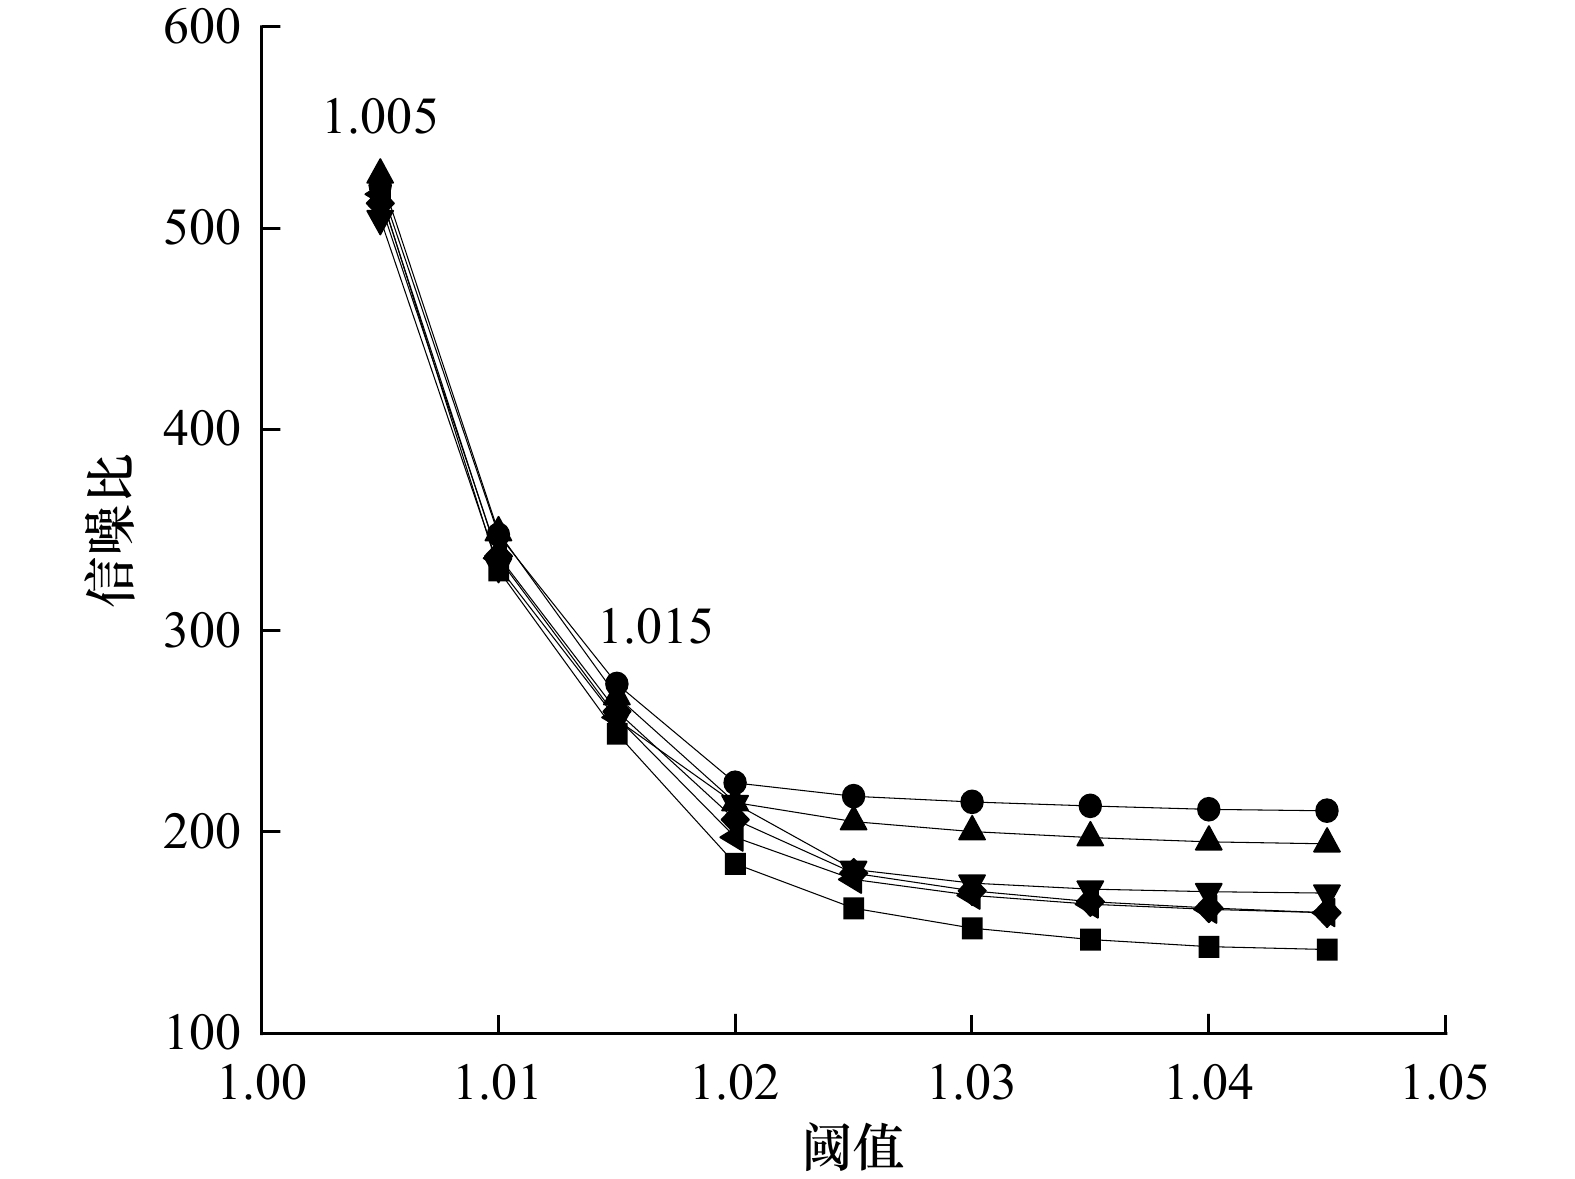
图 4 6景宽幅相机影像蓝光波段不同阈值对应不同信噪比
Fig. 4 Different signal-to-noise ratios were obtained by calculating different thresholds at the blue band of six wide field of view images

图 6 宽幅相机传感器绿光、红光、近红外波段噪声分布
Fig. 6 Distribution of noise in the green, red and near-infrared bands of the wide field of view sensor

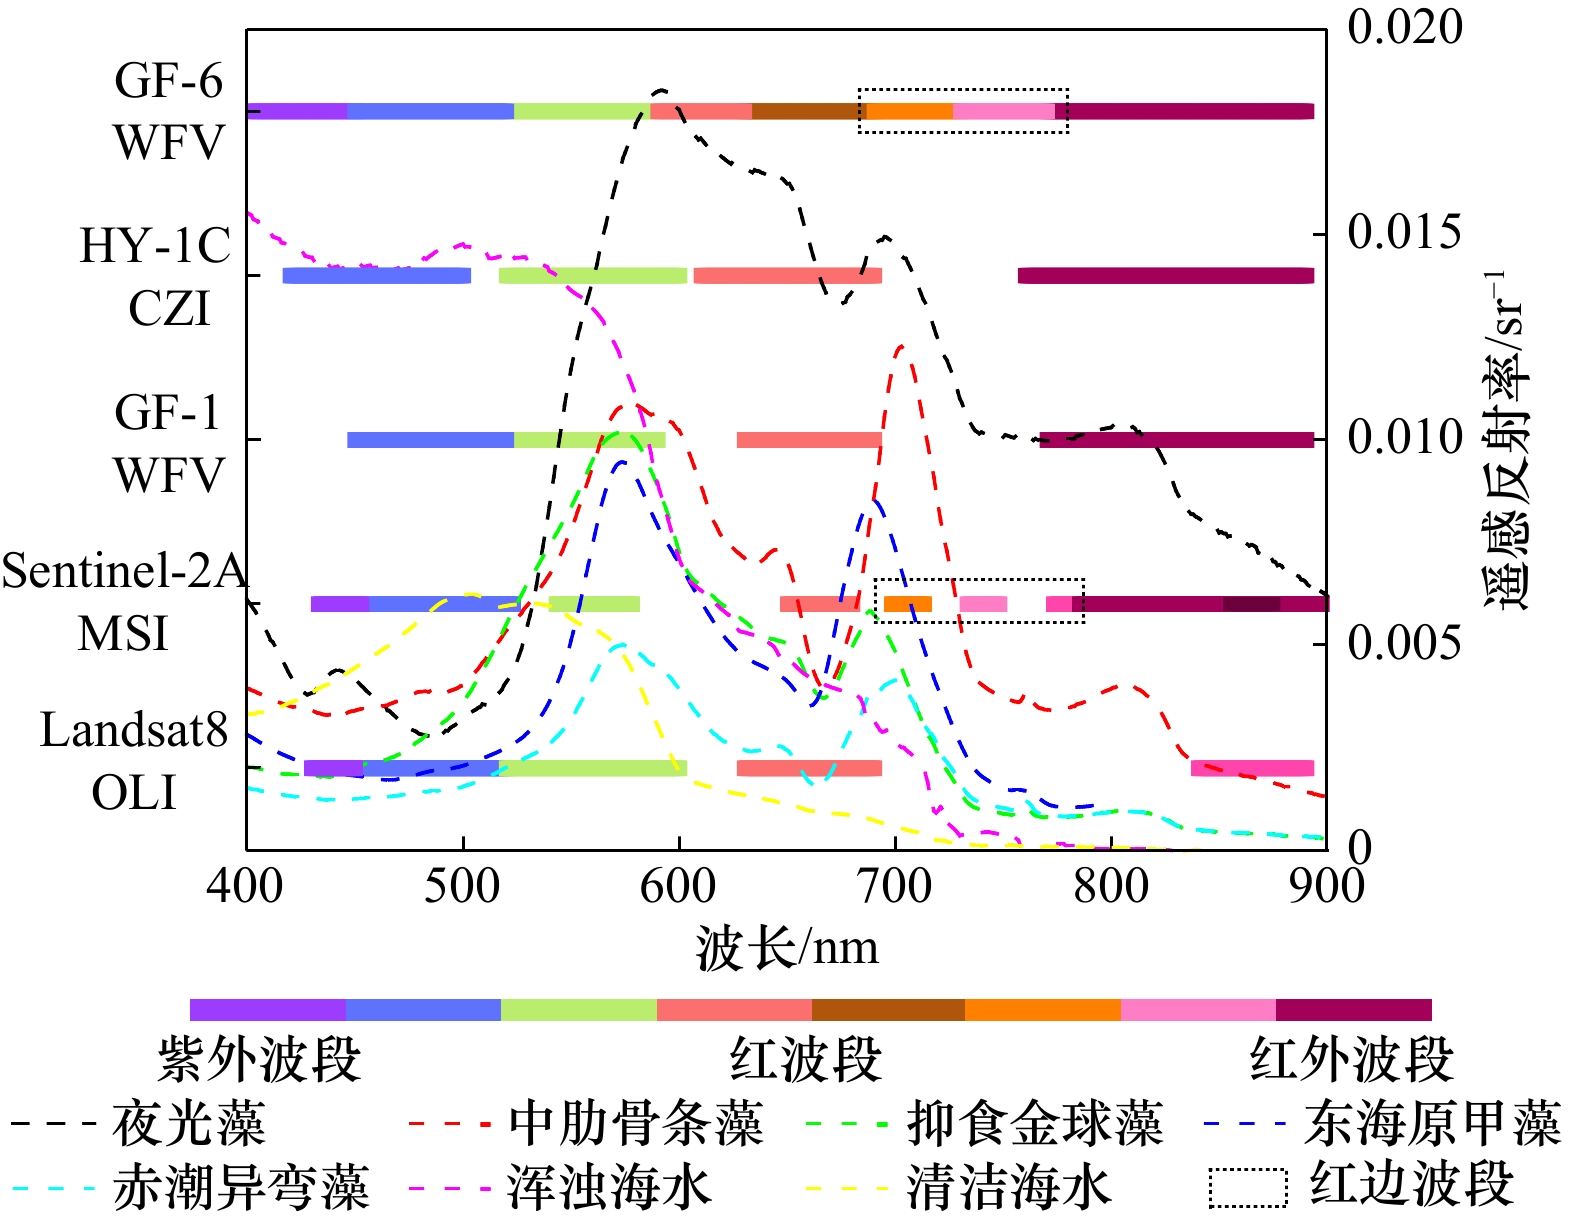
图 9 不同优势种赤潮及不同类型海水中高空间分辨率宽波段卫星模拟遥感反射率
Fig. 9 Medium and high resolution broad-band satellite remote sensing reflectance simulated from different dominant species of red tide and different types of seawater
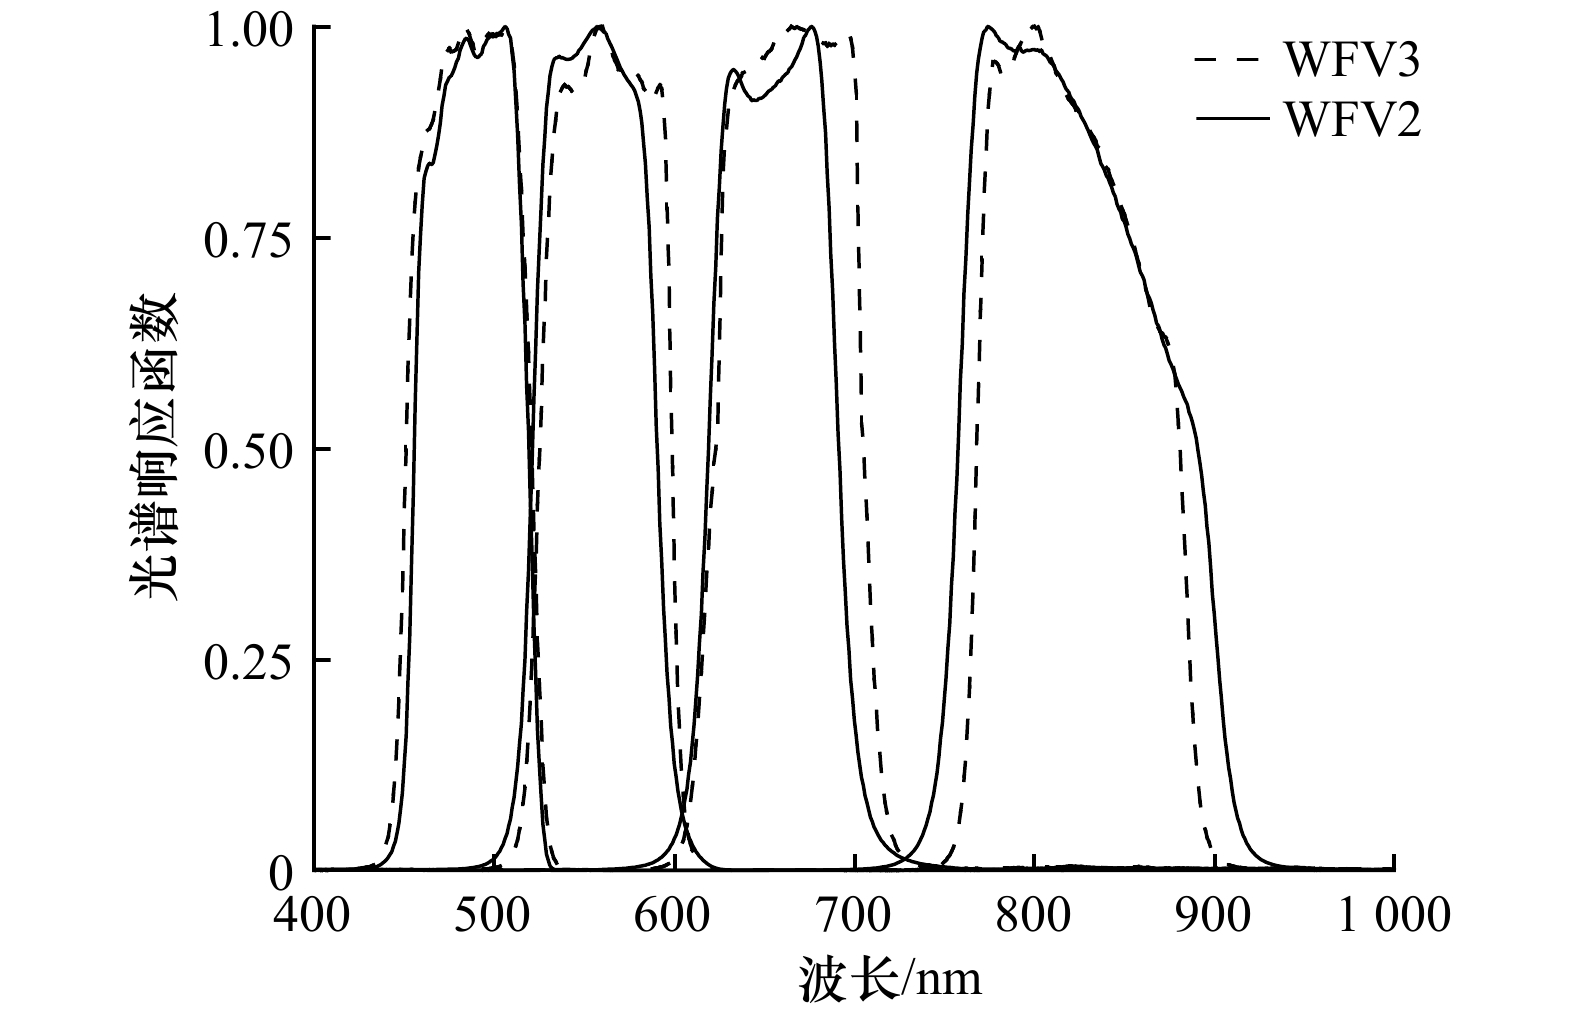
图 11 GF-1 WFV2、GF-1 WFV3光谱响应函数
Fig. 11 Spectral response functions of GF-1 WFV2 and GF-1 WFV3
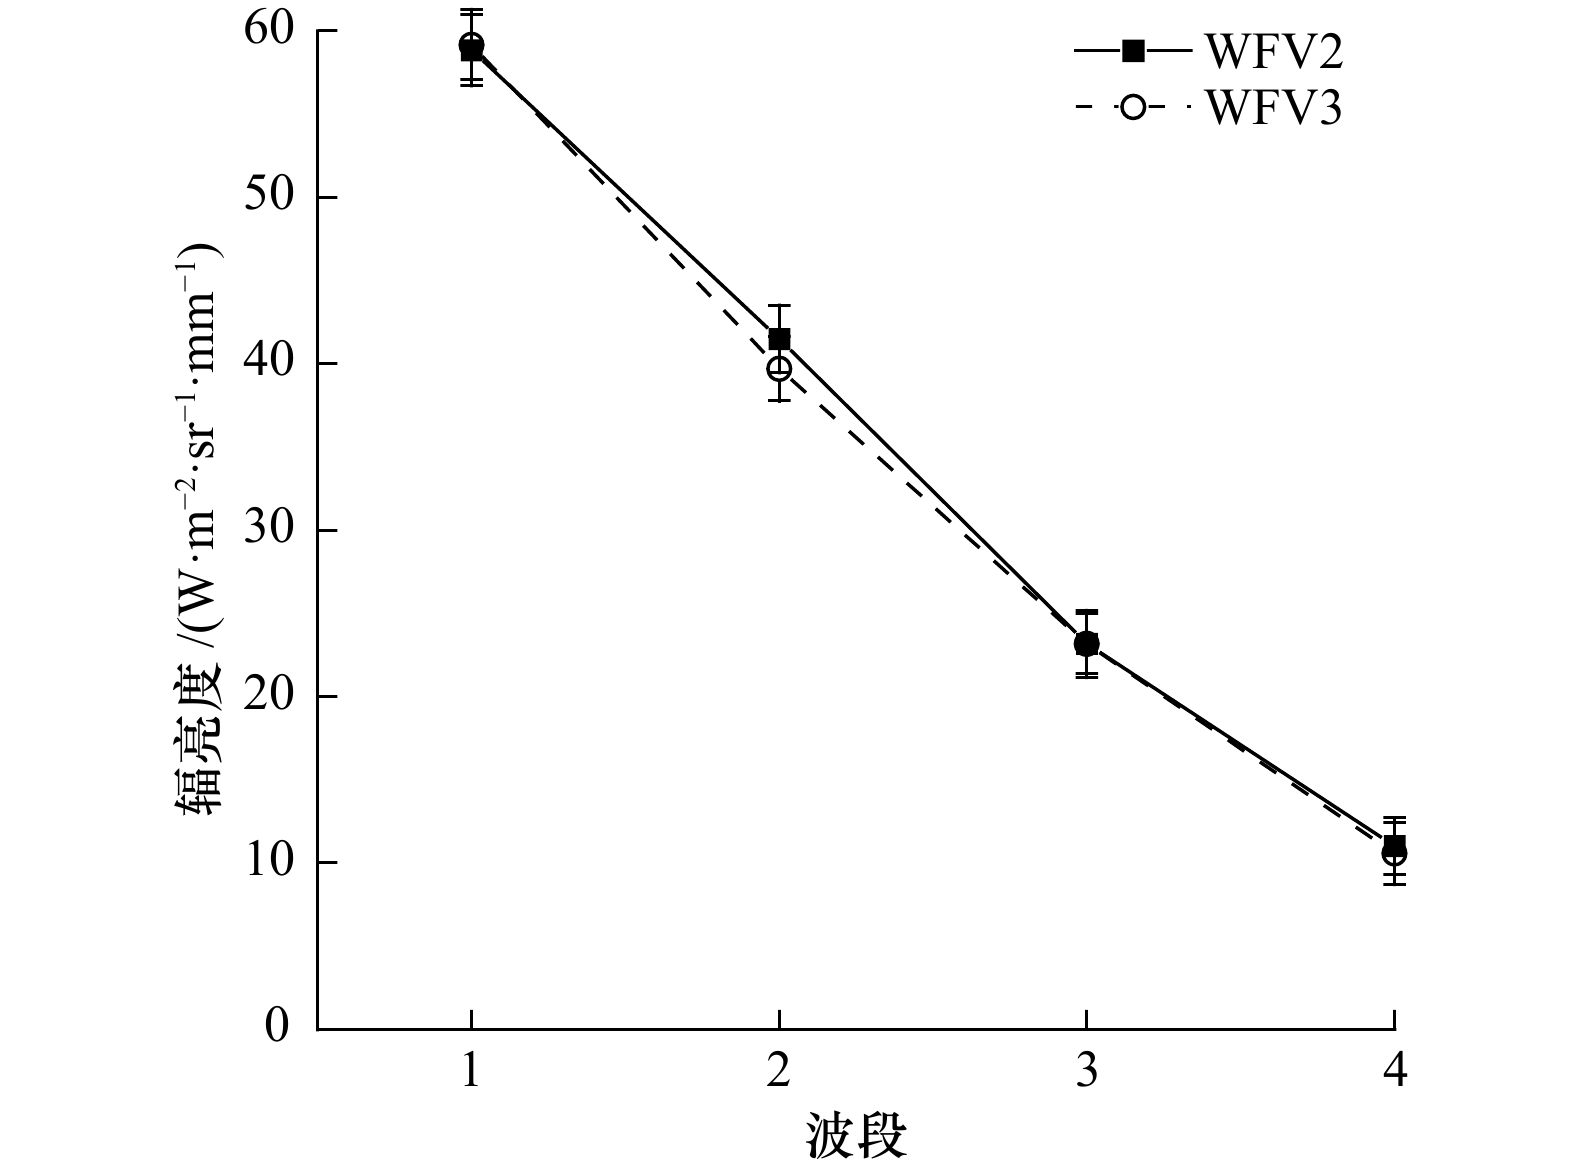
图 12 GF-1 WFV3检测出赤潮GF-1 WFV2未检测出赤潮像元辐亮度
Fig. 12 Irradiance of image elements where red tide was detected by GF-1 WFV3 but not by GF-1 WFV2

图 13 GF-1 WFV3与GF-1 WFV2 GF1_RI指数散点图
Fig. 13 Scatter plot of GF1_RI index calculated by GF-1 WFV3 and GF-1 WFV2

图 14 不同空间分辨率Sentinel-2A MSI影像赤潮检测结果
Fig. 14 Results of red tide detection with Sentinel-2A MSI images at different spatial resolutions

图 15 赤潮Sentinel-2A MSI影像探测结果
Fig. 15 Red tide detection results from Sentinel-2A MSI images
表 1 中高空间分辨率卫星传感器参数
Tab. 1 Medium and high spatial resolution satellite sensor parameters
卫星传感器 波段 光谱范围/nm 中心波长/nm 空间分辨率/m 幅宽/km 重访周期/d 卫星发射时间 GF-1 WFV 1 450~520 485 16 800 2 2013年 2 520~600 555 16 800 2 2013年 3 630~690 660 16 800 2 2013年 4 770~890 830 16 800 2 2013年 HY-1C CZI 1 420~500 460 50 950 3 2018年 2 520~600 560 50 950 3 2018年 3 610~690 650 50 950 3 2018年 4 760~890 825 50 950 3 2018年 GF-6 WFV 1 450~520 485 16 800 2 2018年 2 520~590 555 16 800 2 2018年 3 630~690 660 16 800 2 2018年 4 770~890 830 16 800 2 2018年 5 690~730 710 16 800 2 2018年 6 730~770 750 16 800 2 2018年 7 400~450 425 16 800 2 2018年 8 590~630 610 16 800 2 2018年 Landsat8 OLI 1 433~453 443 30 170 16 2013年 2 450~515 483 30 170 16 2013年 3 525~600 563 30 170 16 2013年 4 630~680 655 30 170 16 2013年 5 845~885 865 30 170 16 2013年 Sentinel-2A MSI 1 433~453 443 60 290 10 2015年 2 458~523 490 10 290 10 2015年 3 543~578 560 10 290 10 2015年 4 650~680 665 10 290 10 2015年 5 698~713 705 20 290 10 2015年 6 733~748 740 20 290 10 2015年 7 773~793 783 20 290 10 2015年 8 785~900 842 10 290 10 2015年  下载: 导出CSV
表 2 GF-1 WFV2、GF-1 WFV3传感器信噪比评估结果
Tab. 2 Signal-to-noise ratio evaluation results of GF-1 WFV2 and GF-1 WFV3 sensors
波长/nm WFV2
SNRWFV3
SNR差异 Ltypical/
(mW·cm−2·μm−1·sr−1)Ltypical
标准差485 263 258 5 5.23 1.01 555 107 84 23 2.85 0.61 660 79 64 15 1.27 0.30 830 61 44 17 0.43 0.11
下载: 导出CSV
表 3 GF-1 WFV2、GF-1 WFV3传感器赤潮探测精度
Tab. 3 Red tide detection accuracy of GF-1 WFV2 and GF-1 WFV3 sensors
影像 OA/% Recall/% Precision/% F1-Score Kappa系数 WFV2 94.47 73.15 98.51 0.84 0.807 WFV3 97.27 92.73 93.43 0.93 0.914
下载: 导出CSV
表 4 不同空间分辨率赤潮探测精度
Tab. 4 Accuracy of red tide detection at different spatial resolutions
分辨率/m OA/% Recall/% F1-Score Kappa系数 10 99.62 62.75 0.765 0.763 20 99.55 60.00 0.748 0.746 60 98.80 43.64 0.608 0.603 100 98.33 36.70 0.537 0.530 200 97.18 15.38 0.267 0.260
下载: 导出CSV
表 5 Sentinel-2A MSI不同波段GF1_RI指数赤潮探测精度
Tab. 5 Accuracy of GF1_RI index red tide detection at different wavelengths calculated by Sentinel-2A MSI
波段 Recall/% F1-Score Kappa系数 红光波段 44.1 0.59 0.58 红边波段 60.8 0.70 0.69
下载: 导出CSV
表 6 GF-6 WFV不同波段GF1_RI指数赤潮探测精度
Tab. 6 Accuracy of GF1_RI index red tide detection at different wavelengths calculated by GF-6 WFV
波段 Recall/% F1-Score Kappa系数 红光波段 79.8 0.87 0.86 红边波段 82.6 0.90 0.90
下载: 导出CSV
-
[1] 马毅. 赤潮航空高光谱遥感探测技术研究[D]. 青岛: 中国科学院海洋研究所, 2003.Ma Yi. Research on red tide detection technology by aerial hyperspectral remote sensing[D]. Qingdao: The Institute of Oceanology, Chinese Academy of Sciences, 2003. [2] Liu Rongjie, Zhang Jie, Cui Bin’ge, et al. Red tide detection based on high spatial resolution broad band satellite data: a case study of GF-1[J]. Journal of Coastal Research, 2019, 90(SI): 120−128. [3] Liu Rongjie, Xiao Yanfang, Ma Yi, et al. Red tide detection based on high spatial resolution broad band optical satellite data[J]. ISPRS Journal of Photogrammetry and Remote Sensing, 2022, 184: 131−147. doi: 10.1016/j.isprsjprs.2021.12.009 [4] Zhao Xin, Liu Rongjie, Ma Yi, et al. Red tide detection method for HY-1D coastal zone imager based on U-Net convolutional neural network[J]. Remote Sensing, 2021, 14(1): 88. doi: 10.3390/rs14010088 [5] Lee M S, Park K A, Chae J, et al. Red tide detection using deep learning and high-spatial resolution optical satellite imagery[J]. International Journal of Remote Sensing, 2020, 41(15): 5838−5860. doi: 10.1080/01431161.2019.1706011 [6] Cao Mengmeng, Qing Song, Jin E, et al. A spectral index for the detection of algal blooms using Sentinel-2 Multispectral Instrument (MSI) imagery: a case study of Hulun Lake, China[J]. International Journal of Remote Sensing, 2021, 42(12): 4514−4535. doi: 10.1080/01431161.2021.1897186 [7] Trishchenko A P, Cihlar J, Li Zhanqing. Effects of spectral response function on surface reflectance and NDVI measured with moderate resolution satellite sensors[J]. Remote Sensing of Environment, 2002, 81(1): 1−18. doi: 10.1016/S0034-4257(01)00328-5 [8] 刘三超, 柳钦火, 高懋芳, 等. 波谱响应函数和波宽对地表温度反演的影响[J]. 遥感信息, 2007(5): 3−6.Liu Sanchao, Liu Qinhuo, Gao Maofang, et al. A study on effects of spectral response function and band width on land surface temperature inversion[J]. Remote Sensing Information, 2007(5): 3−6. [9] Cao Zhigang, Ma Ronghua, Duan Hongtao, et al. Effects of broad bandwidth on the remote sensing of inland waters: implications for high spatial resolution satellite data applications[J]. ISPRS Journal of Photogrammetry and Remote Sensing, 2019, 153: 110−122. doi: 10.1016/j.isprsjprs.2019.05.001 [10] 邹寒月, 毛智慧, 邓磊. 传感器波段设置对植被遥感参数反演的影响研究[J]. 地理信息世界, 2021, 28(3): 25−33.Zou Hanyue, Mao Zhihui, Deng Lei. The influence of sensor band settings on vegetation parameter inversion[J]. Geomatics World, 2021, 28(3): 25−33. [11] Chen Shuguo, Du Keping, Lee Z, et al. Performance of COCTS in global ocean color remote sensing[J]. IEEE Transactions on Geoscience and Remote Sensing, 2021, 59(2): 1634−1644. doi: 10.1109/TGRS.2020.3002460 [12] Cao Zhigang, Duan Hongtao, Song Qingjun, et al. Evaluation of the sensitivity of China’s next-generation ocean satellite sensor MWI onboard the Tiangong-2 space lab over inland waters[J]. International Journal of Applied Earth Observation and Geoinformation, 2018, 71: 109−120. doi: 10.1016/j.jag.2018.05.012 [13] 张靖玮, 丘仲锋. 针对海洋水域的FY-3D MERSI Ⅱ数据质量评估[J]. 光学学报, 2021, 41(12): 11−30.Zhang Jingwei, Qiu Zhongfeng. Evaluation of data quality of FY-3D satellite sensor MERSI II over marine waters[J]. Acta Optica Sinica, 2021, 41(12): 11−30. [14] Li Jian, Chen Xiaoling, Tian Liqiao, et al. Improved capabilities of the Chinese high-resolution remote sensing satellite GF-1 for monitoring suspended particulate matter (SPM) in inland waters: radiometric and spatial considerations[J]. ISPRS Journal of Photogrammetry and Remote Sensing, 2015, 106: 145−156. doi: 10.1016/j.isprsjprs.2015.05.009 [15] Tang Rugang, Shen Fang, Pan Yanqun, et al. Multi-source high-resolution satellite products in Yangtze Estuary: cross-comparisons and impacts of signal-to-noise ratio and spatial resolution[J]. Optics Express, 2019, 27(5): 6426−6441. doi: 10.1364/OE.27.006426 [16] Gray A, Krolikowski M, Fretwell P, et al. Remote sensing phenology of Antarctic green and red snow algae using World View satellites[J]. Frontiers in Plant Science, 2021, 12: 671981. doi: 10.3389/fpls.2021.671981 [17] Mueller J L, Fargion G S, Mc Clain C R, et al. Ocean Optics Protocols for Satellite Ocean Color Sensor Validation, Revision 4, Volumn Ⅲ: Radiometric Measurements and Data Analysis Protocols[M]. Maryland: National Aeronautical and Space Administration, 2003, 21–30. [18] Qi Lin, Lee Z, Hu Chuanmin, et al. Requirement of minimal signal-to-noise ratios of ocean color sensors and uncertainties of ocean color products[J]. Journal of Geophysical Research: Oceans, 2017, 122(3): 2595−2611. doi: 10.1002/2016JC012558 [19] Hu Chuanmin, Feng Lin, Lee Z, et al. Dynamic range and sensitivity requirements of satellite ocean color sensors: learning from the past[J]. Applied Optics, 2012, 51(25): 6045−6062. doi: 10.1364/AO.51.006045 [20] 崔廷伟, 张杰, 马毅, 等. 赤潮光谱特征及其形成机制[J]. 光谱学与光谱分析, 2006, 26(5): 884−886.Cui Tingwei, Zhang Jie, Ma Yi, et al. Study of red tide spectral characteristics and its mechanism[J]. Spectroscopy and Spectral Analysis, 2006, 26(5): 884−886. -


计量
- 文章访问数: 753
- HTML全文浏览量: 427
- PDF下载量: 65
- 被引次数: 0
