

The impact of assimilation of Himawari-8 clear-sky data from the new generation geostationary meteorological satellite on the forecast of super Typhoon Hato
-
摘要: 本文以2017年第13号台风“天鸽”(Hato)为例,在WRFDA同化系统中结合日本葵花8号(Himawari-8)资料,通过同化Himawari-8晴空红外辐射率资料并进一步考察其对台风“天鸽”的结构、强度、路径分析和预报的影响。研究结果表明:同化Himawari-8晴空红外辐射率资料对台风背景场的水汽相关变量分析有显著改进,对背景场中的台风水汽信息有一定的改进作用。与控制实验,即没有同化Himawari-8晴空红外辐射率资料的实验相比,加入同化实验对台风“天鸽”的风场、500 hPa气压场的分析效果有所提高,台风气旋性环流加强,并进一步改进了对台风“天鸽”的路径、台风中心最低气压和近中心最大风速的预报。平均路径误差和降水预报相对于常规观测变量的均方根误差均有所改善。Abstract: Based on the Typhoon Hato in 2017, the Himawari-8 AHI infrared radiance data are assimilated under the clear-sky condition in WRFDA system to investigate its impact on the typhoon forecast. The structure, strength, as well as the track forecasts are also studied for the Typhoon Hato. The results show that the clear-sky assimilation of Himawari-8 infrared radiance data provides obvious increment of cyclonic winds in the typhoon core and an obvious increase of typhoon in background field. Compared with the control experiment without assimilating Himawari-8 AHI infrared radiance data, the experiment that assimilates Himawari-8 AHI data strengthens the wind field of Typhoon Hato, 500 hPa pressure field analysis, and typhoon cyclonic circulation. In addition, the AHI radiance assimilation further improves the forecast of track, minimum sea level pressure, and the maximum wind speed of the Typhoon Hato. The average track error, the precipitation distribution, the root mean square error against the conventional data are also improved.
-
Key words:
- Himawari-8 /
- WRF model /
- 3D Var /
- Typhoon Hato
-
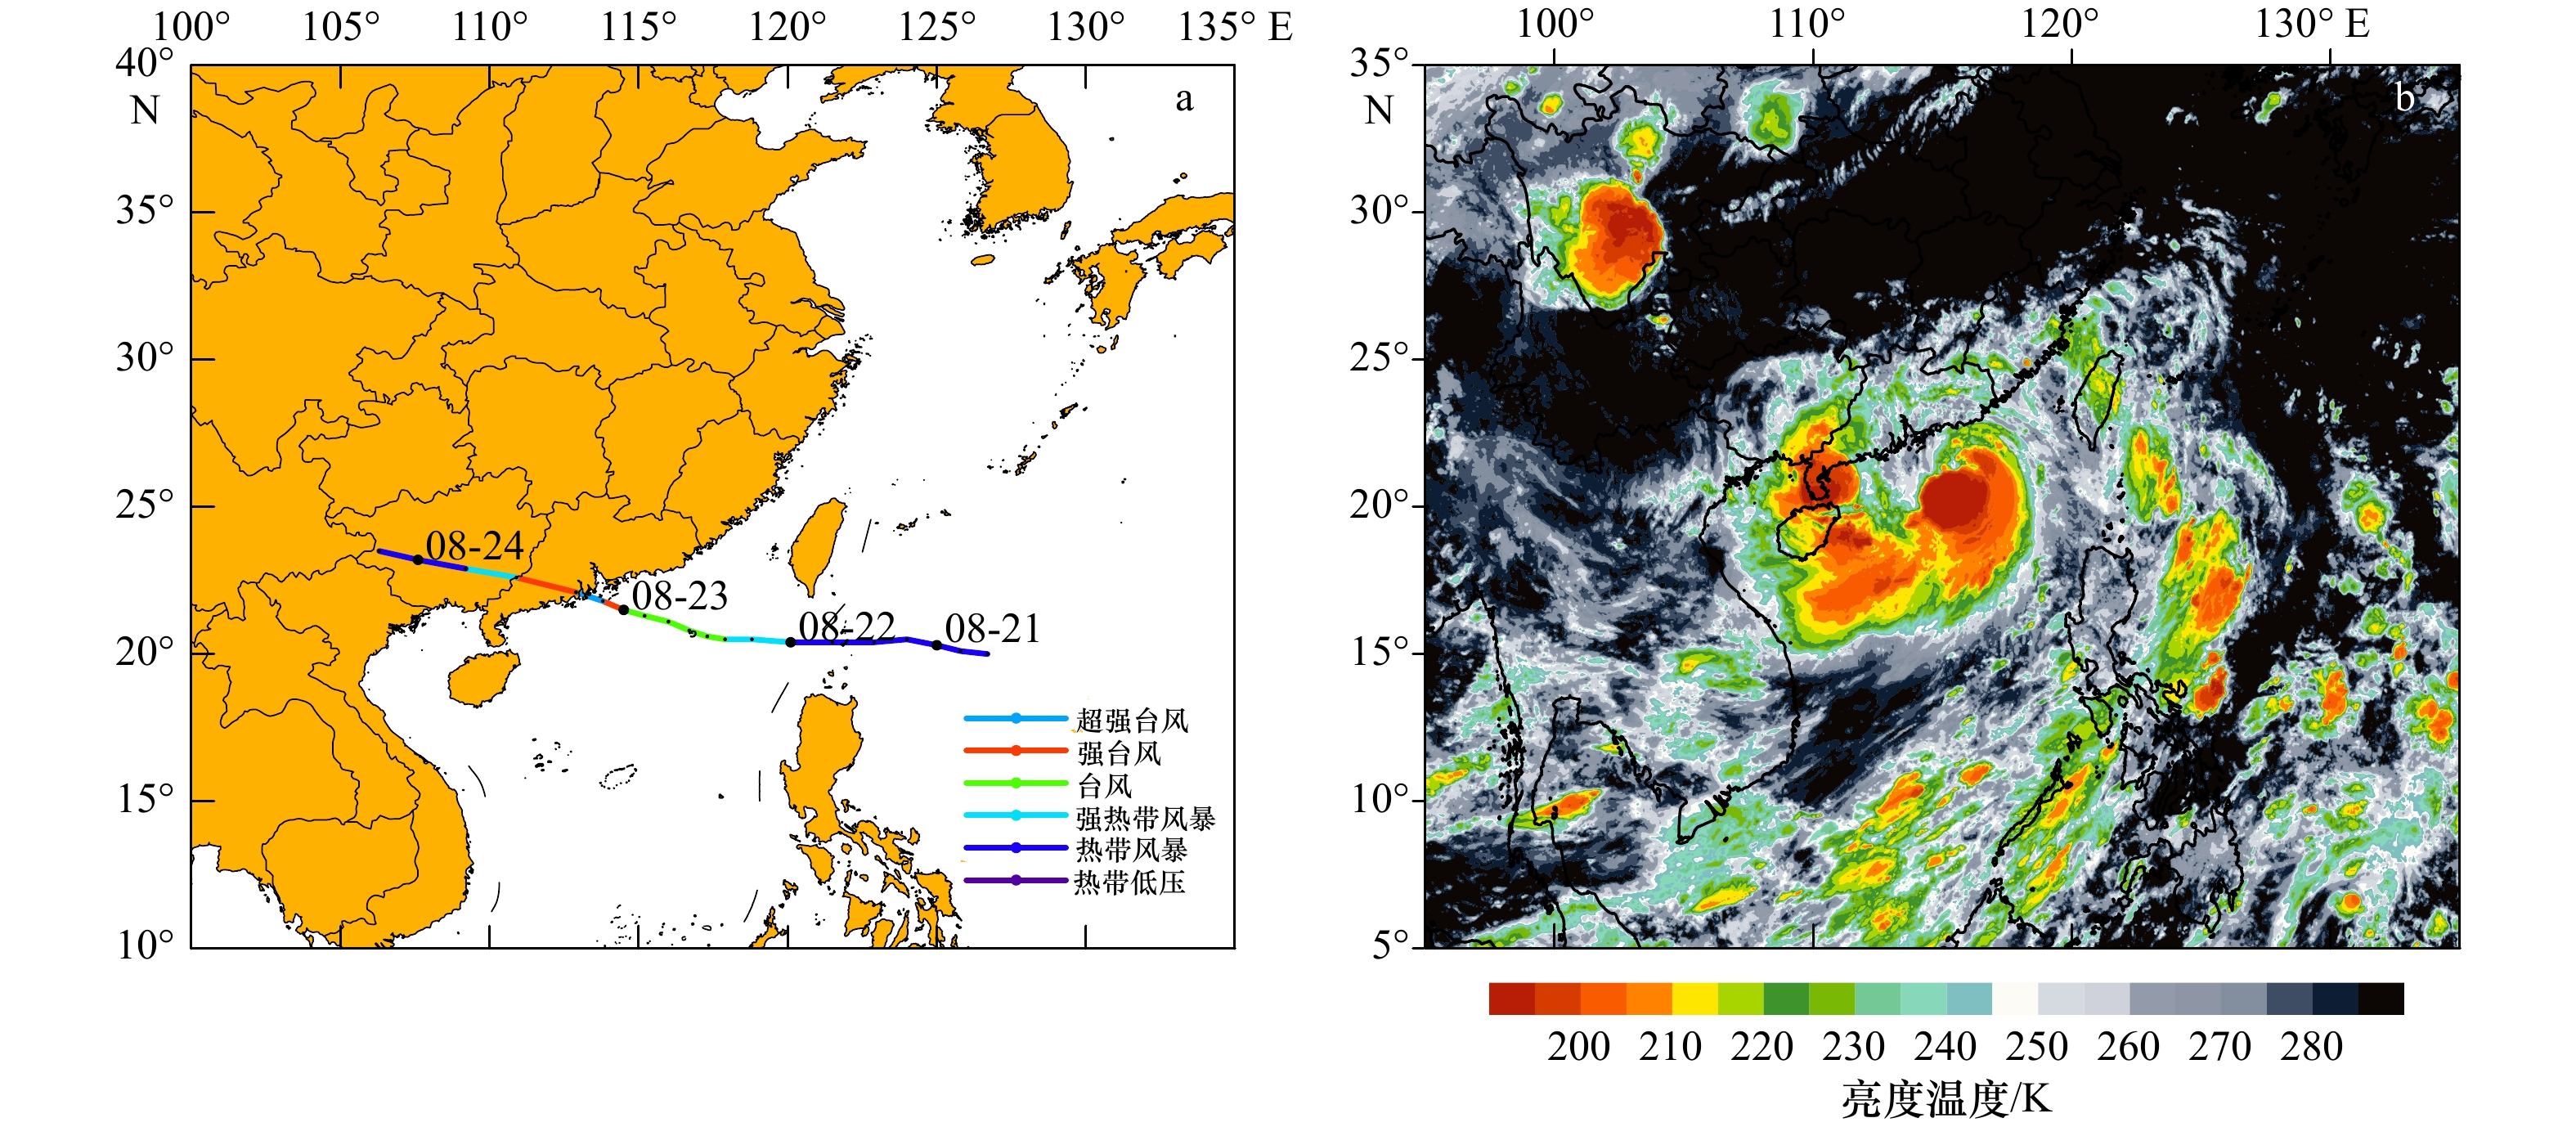
图 2 台风“天鸽”的观测路径(a)以及2017年8月22日18时Himawari-8 AHI 通道13的亮度温度(b)
Fig. 2 The observation track of Typhoon Hato (a) and the brightness temperature of band 13 of the Himawari-8 AHI at 18:00 UTC on August 22, 2017 (b)
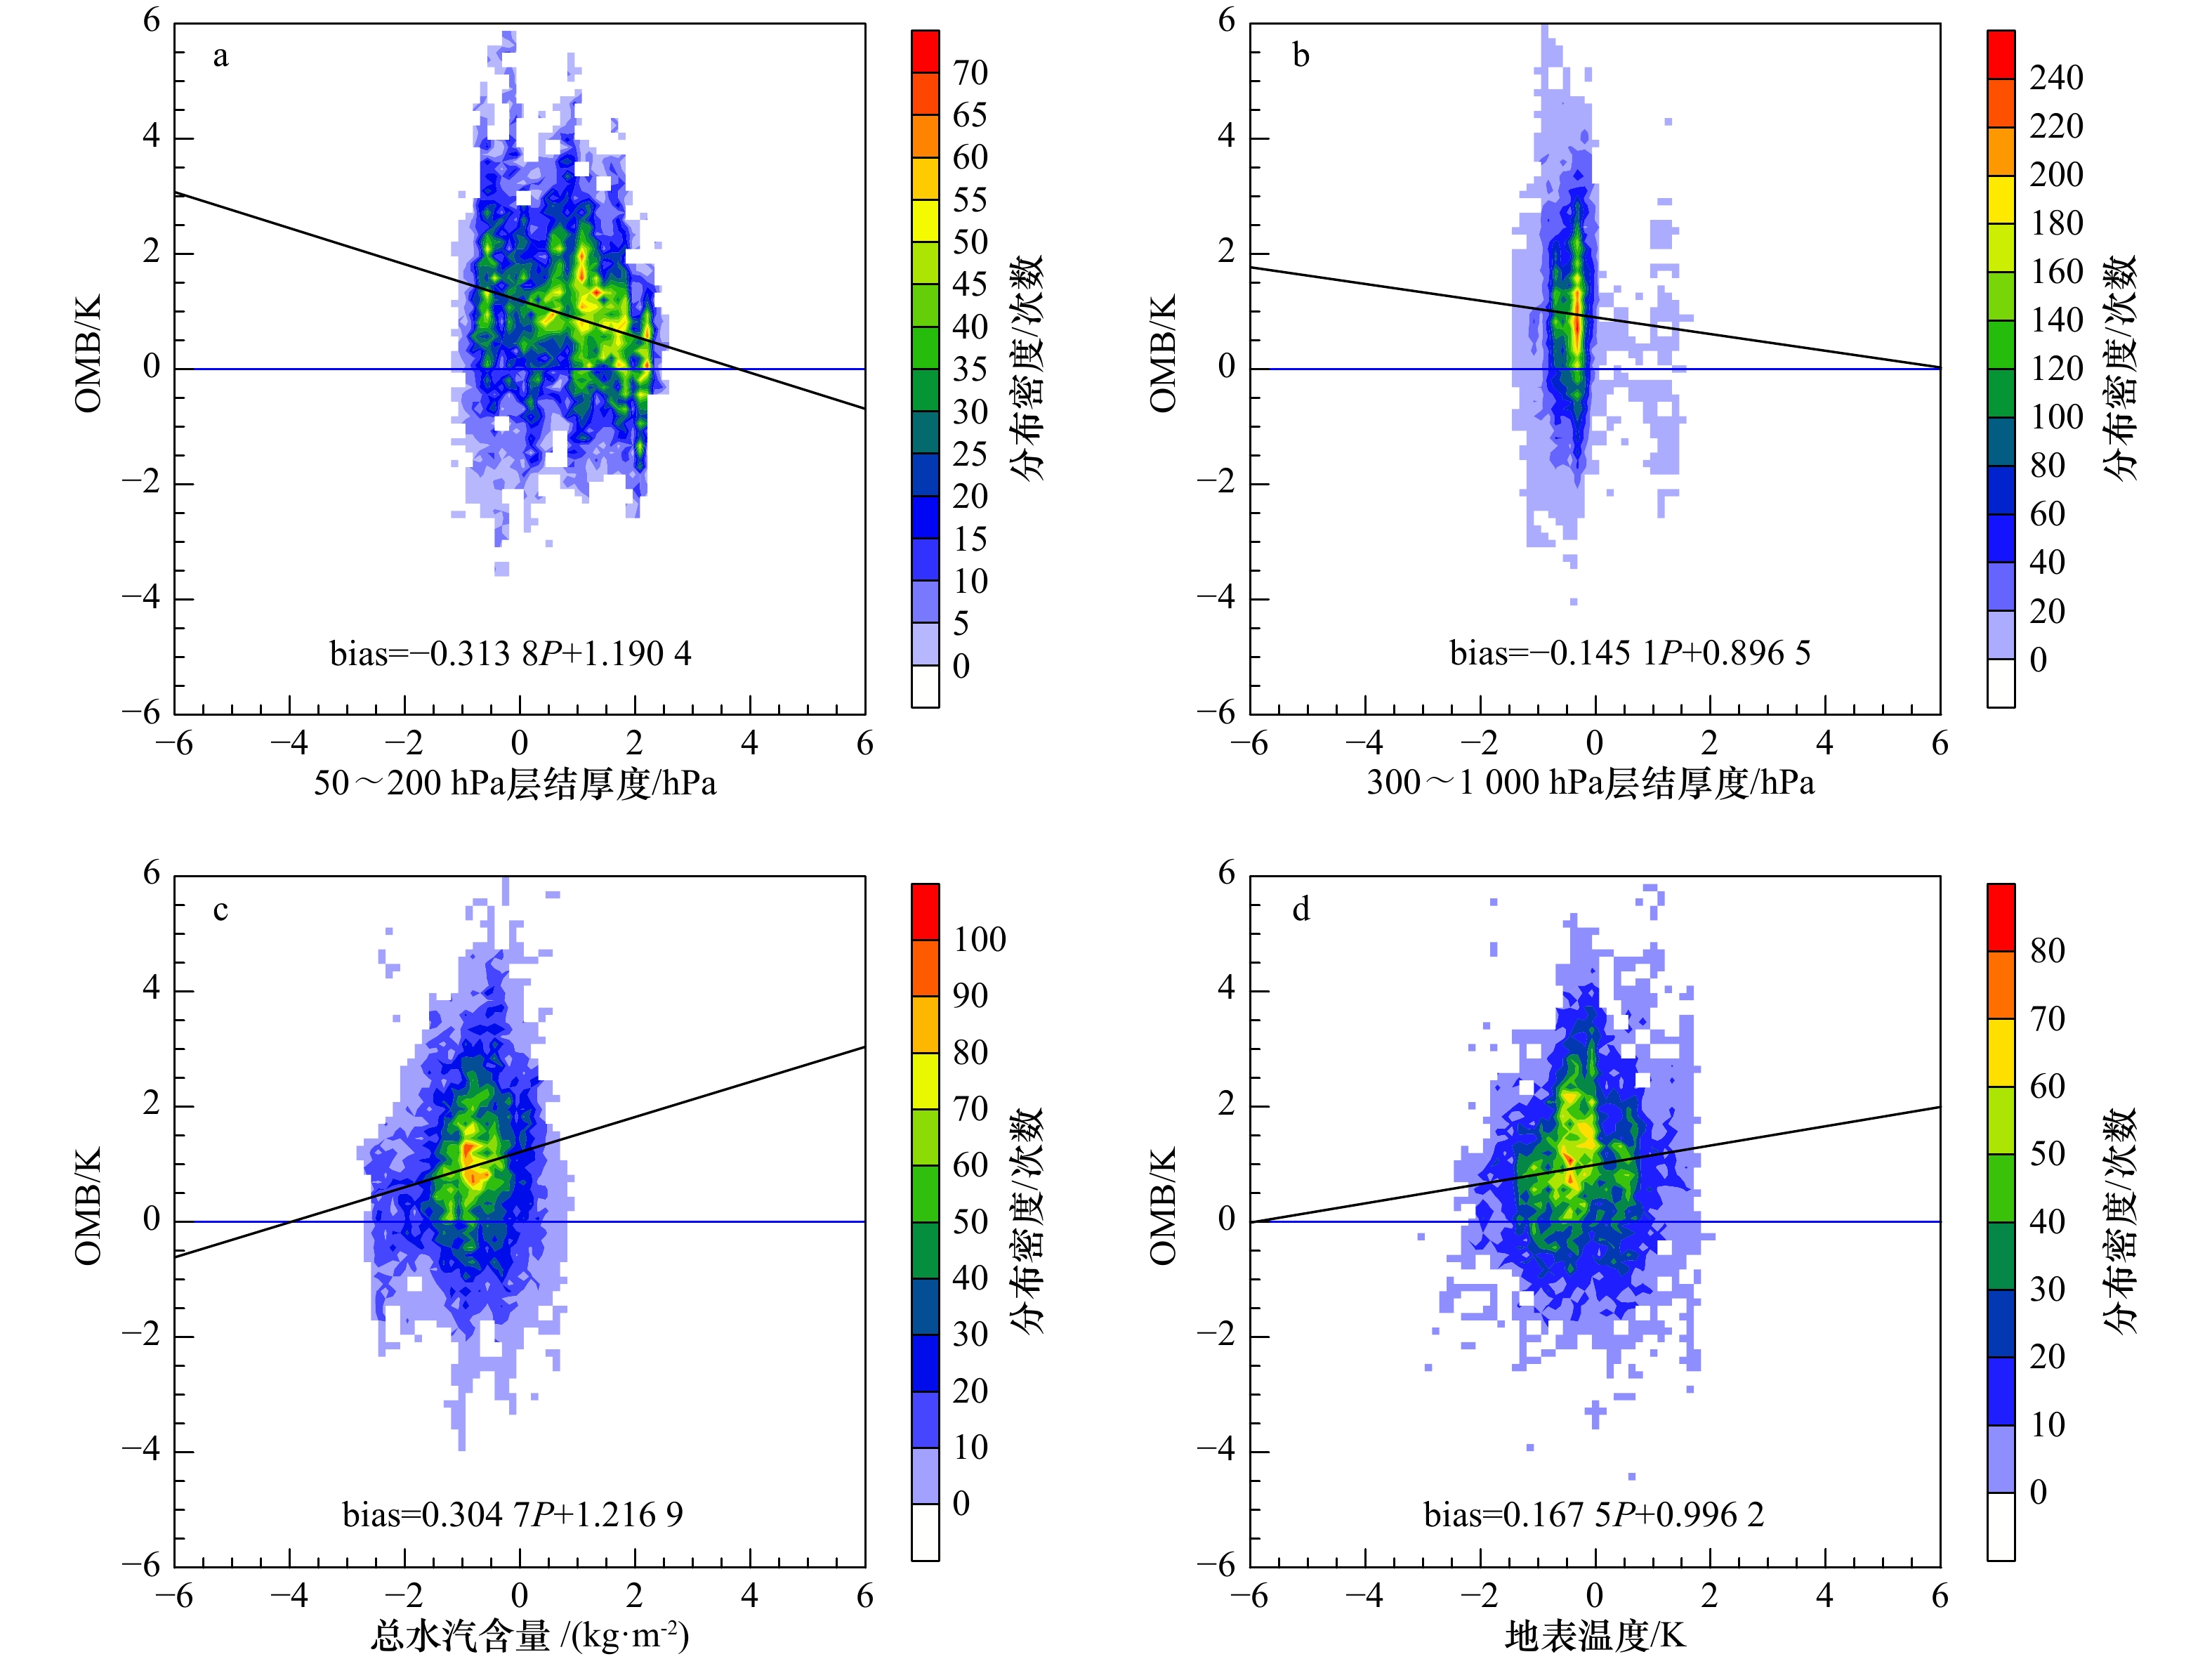
图 5 OMB和预报因子50~200 hPa层结厚度(a)、300~1 000 hPa层结厚度(b)、总水汽含量(c)和地表温度(d)的分布散点图
图中的阴影显示是分布密度以及偏差bias和预报因子P的相关函数
Fig. 5 Scatter plots of OMB and predictors of 50~200 hPa layer thickness (a), 300~1 000 hPa layer thickness (b), total moisture content (c), and surface temperature (d)
The shadow in figure shows distribution density and bias and correlation function of predictor
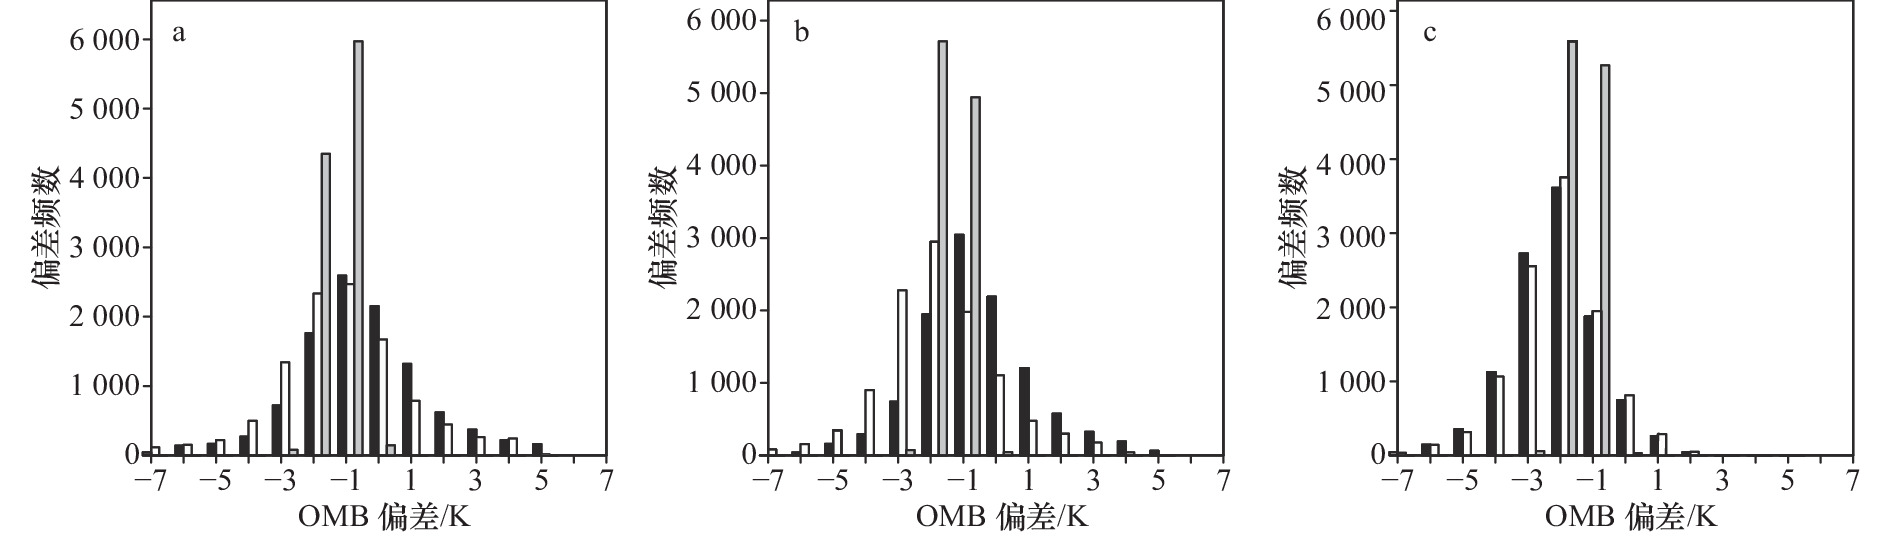
图 6 2017年8月22日12时AHI资料通道8(a)、通道9(b)、通道10(c)观测与偏差订正前背景场模拟的辐射率值差异分布直方图(黑色)、观测与偏差订正后背景场模拟的辐射率值差异分布直方图(白色)以及观测与分析场模拟的辐射率值差异分布直方图(灰色)
Fig. 6 Histogram of AHI observation minus simulated radiance from the background without bias correction (black), observation minus simulated radiance from the background with bias correction (white), and observation minus simulated radiance from the analysis (gray) for band 8 (a), band 9 (b) and band 10 (c) at 12:00 UTC on August 22th, 2017

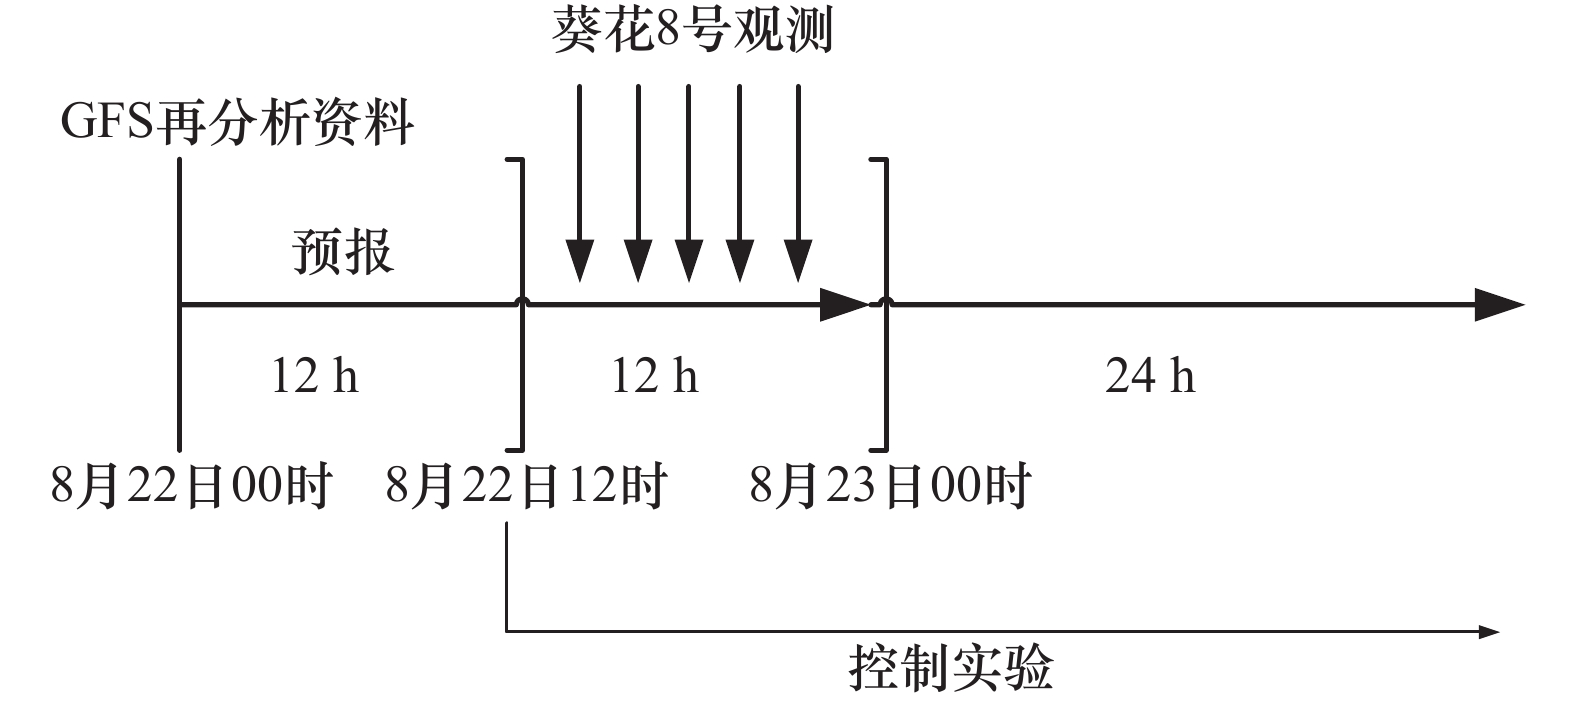
图 7 2017年8月22日12时到8月23日00时通道8(a)、通道9(b)、通道10(c)逐小时(共13次)的观测数目(上),偏差平均(中)和偏差的标准偏差(下)
Fig. 7 Time series of hourly data counts (top), the averaged bias (middle) and the stdv of the bias (bottom) for band 8 (a), band 9 (b), band 10 (c) from 12:00 UTC August 22, 2017 to 00:00 UTC August 23, 2017 for total 13 cycles
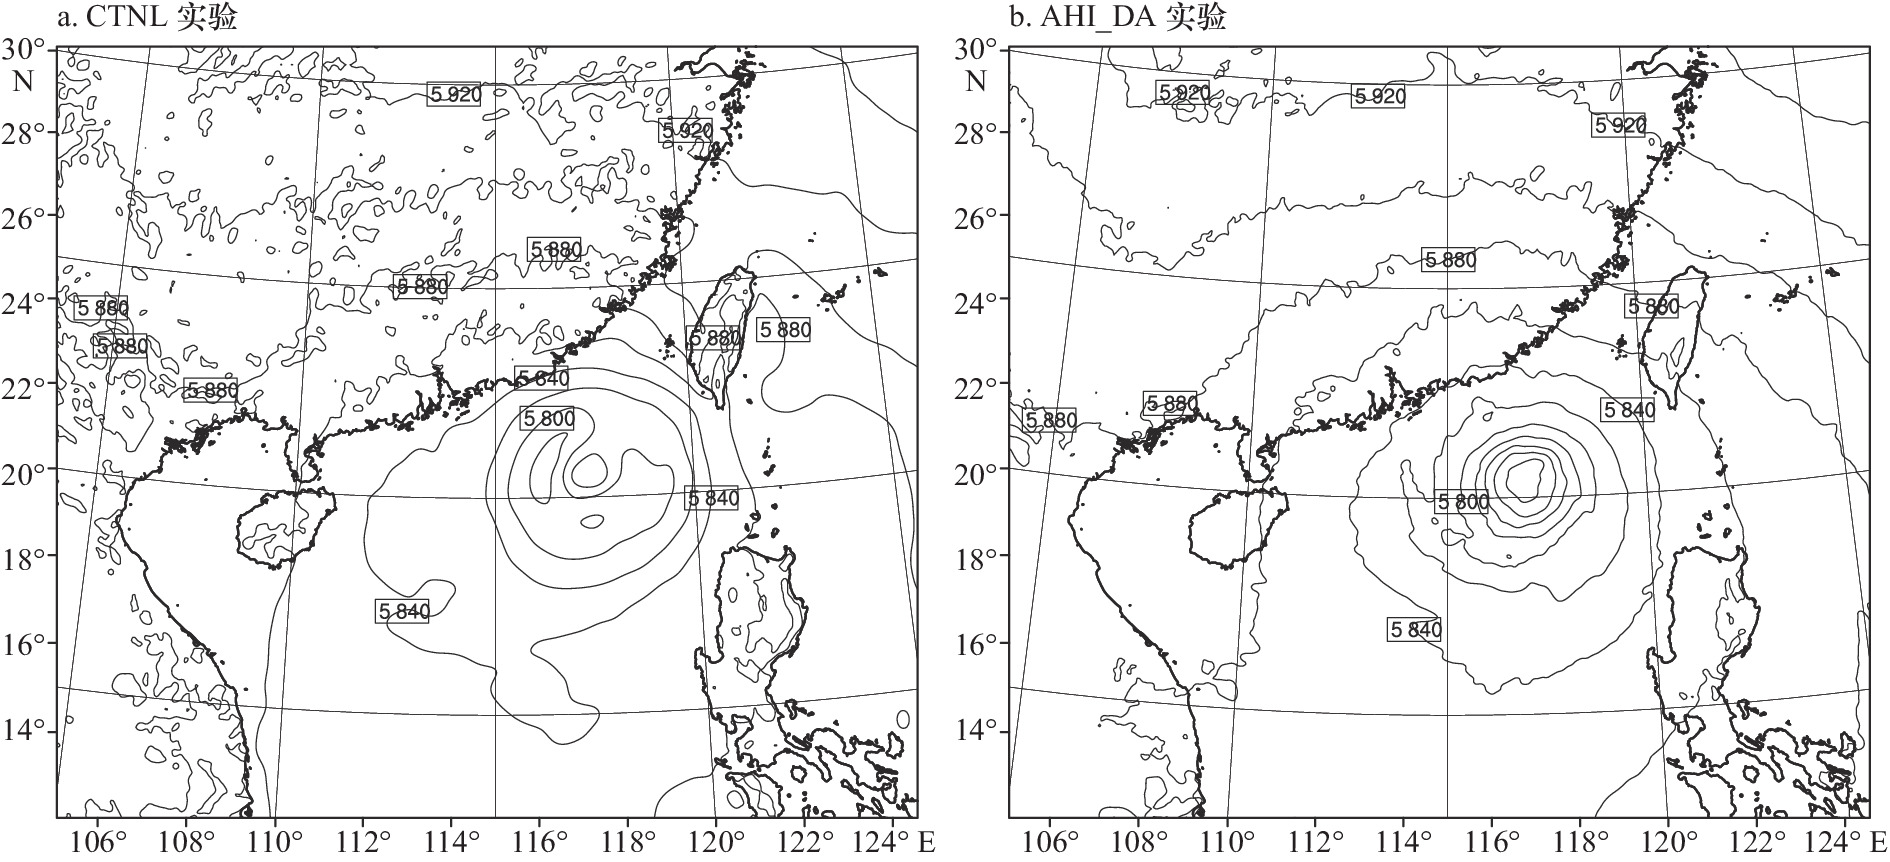
图 8 2017年8月22日12时00分500 hPa位势高度场对比
Fig. 8 500 hPa geopotential height field at 12:00 UTC on August 22, 2017
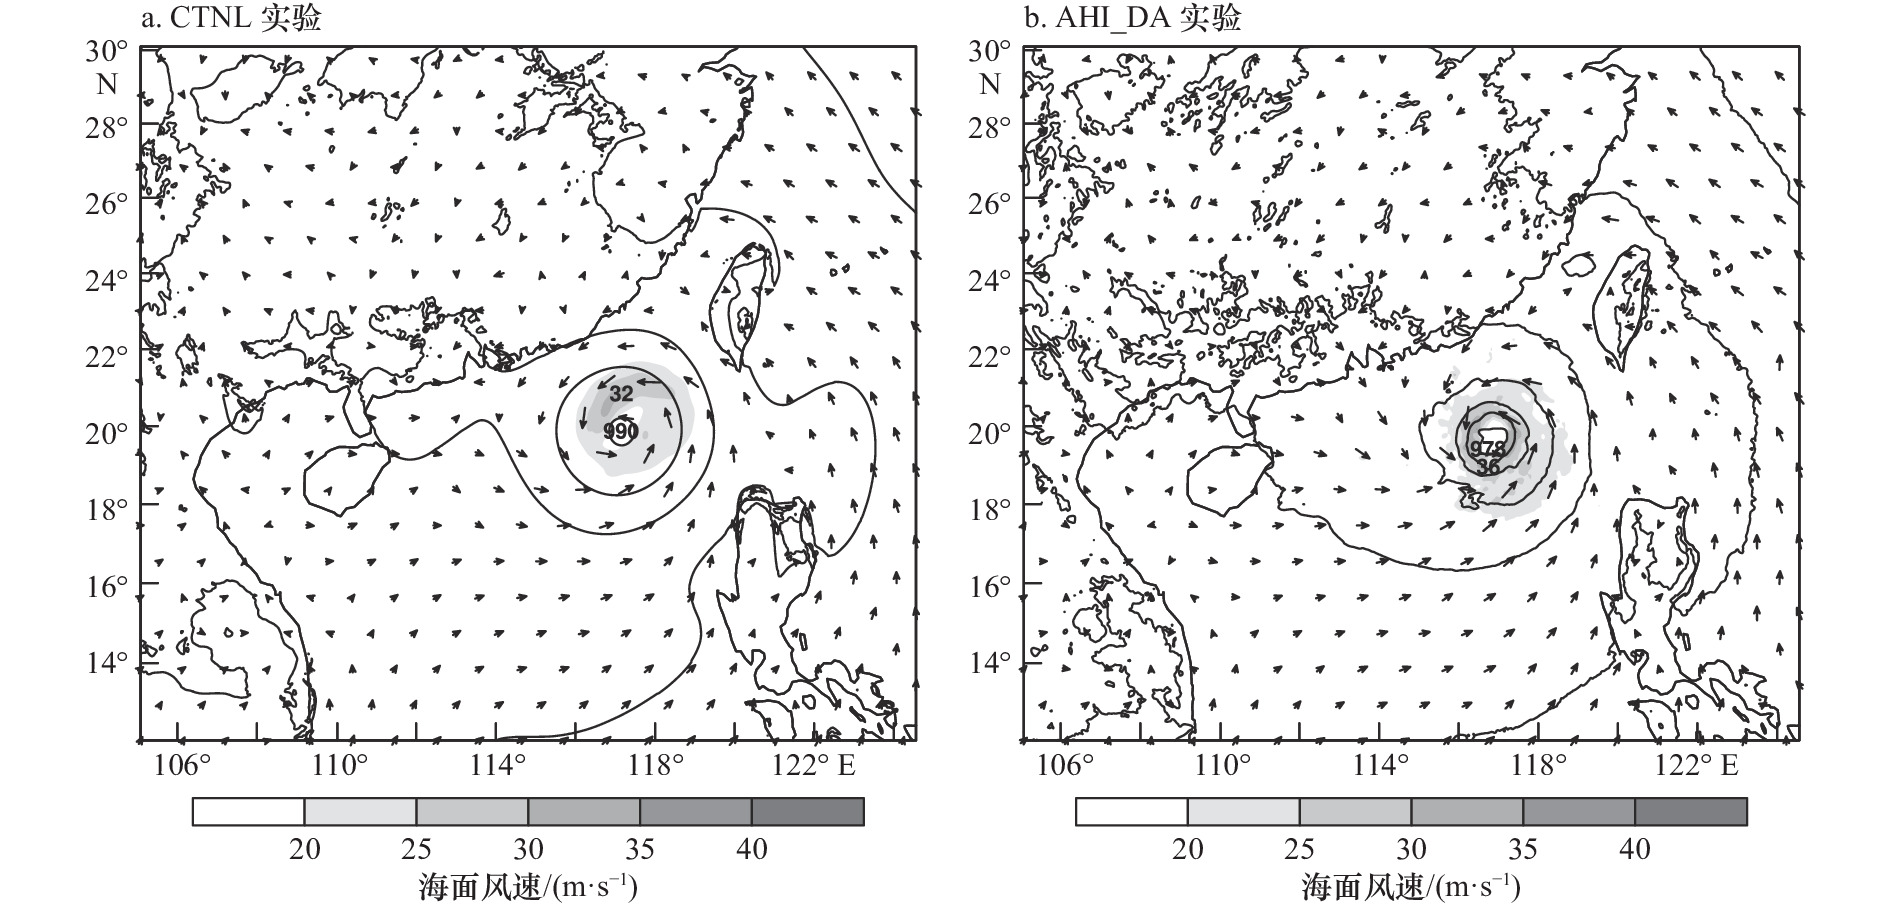
图 9 2017年8月22日12时00分海平面气压场风场对比
海平面气压等值线范围为980~1 010 hPa(间隔为5 hPa)
Fig. 9 Sea level pressure and wind at 12:00 UTC on August 22, 2017
Sea level pressure is from 980 hPa to 1 010 hPa by 5 hPa

图 10 同化分析场相对于常规观测资料的RMSE均值的垂直廓线
Fig. 10 The averaged RMSE of the analyses against the conventional data

图 11 2017年8月22日18时到23日00时6 h累积降水
a. 观测值;b. CTNL实验预报;c. AHI_DA实验预报
Fig. 11 Accumulated 6 hour precipitation initialized from 18:00 UTC on August 22, 2017
a. Observed value; b. CTNL test forecast; c. AHI_DA test forecast
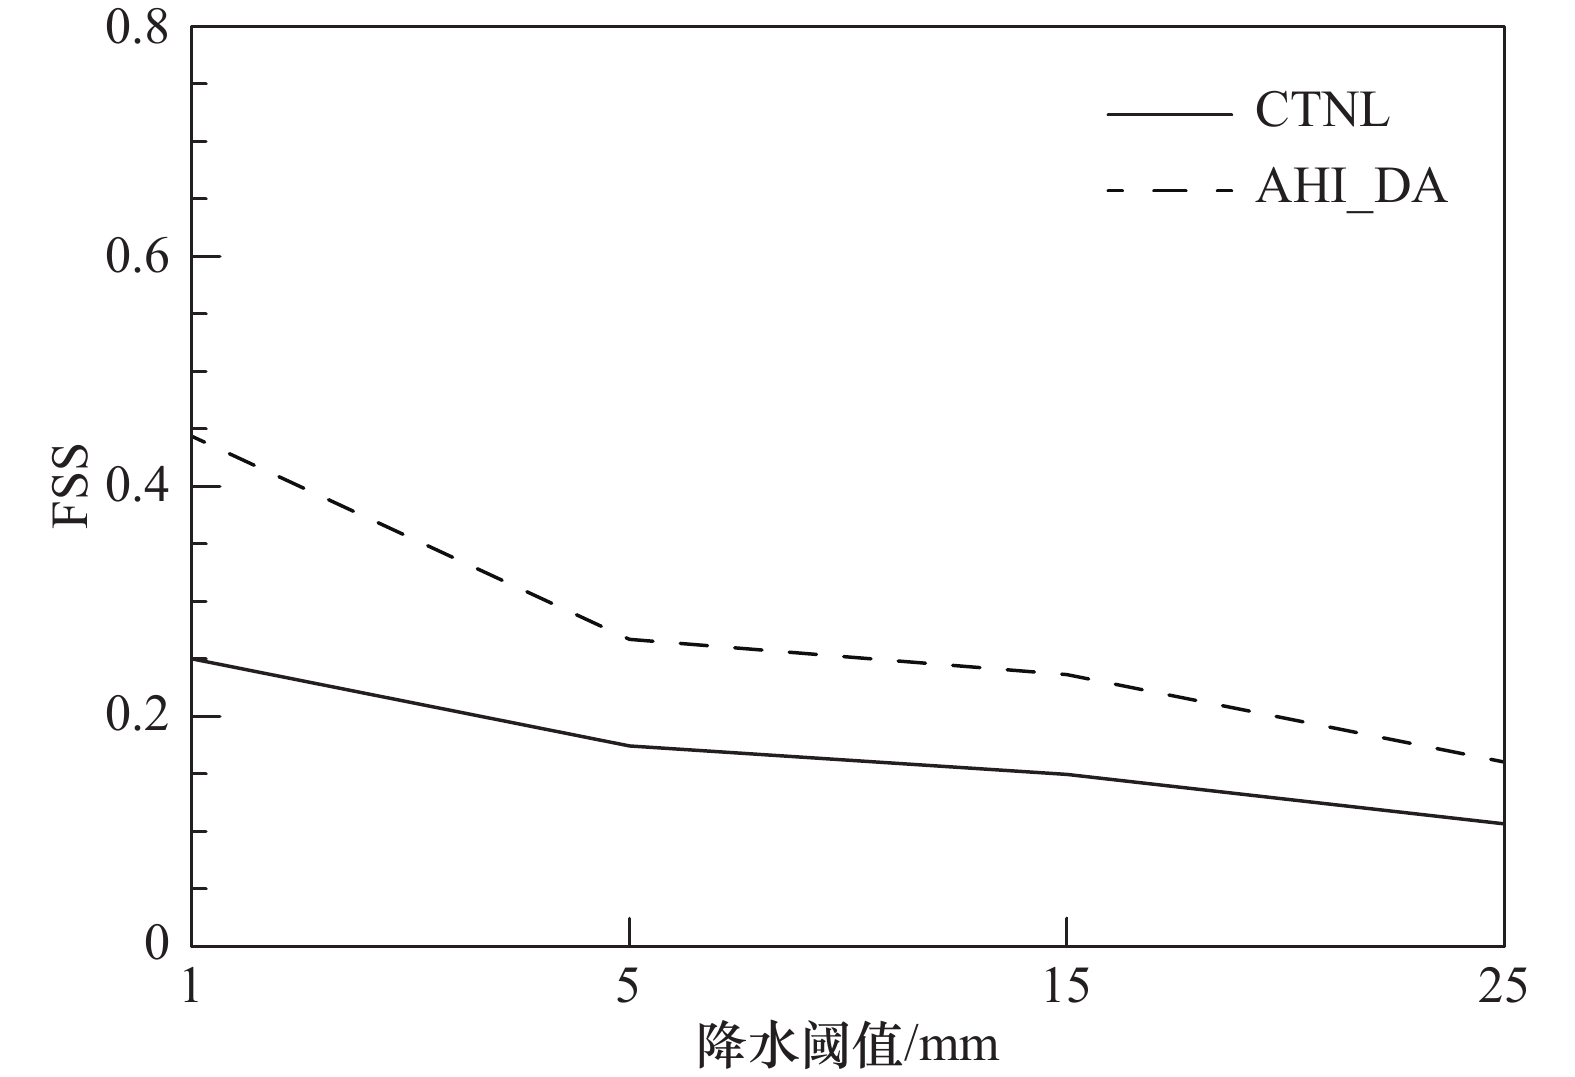
图 12 各量级6 h累计降水量的FSS评分
Fig. 12 FSS scores of accumulated 6 hour precipitation for different thresholds
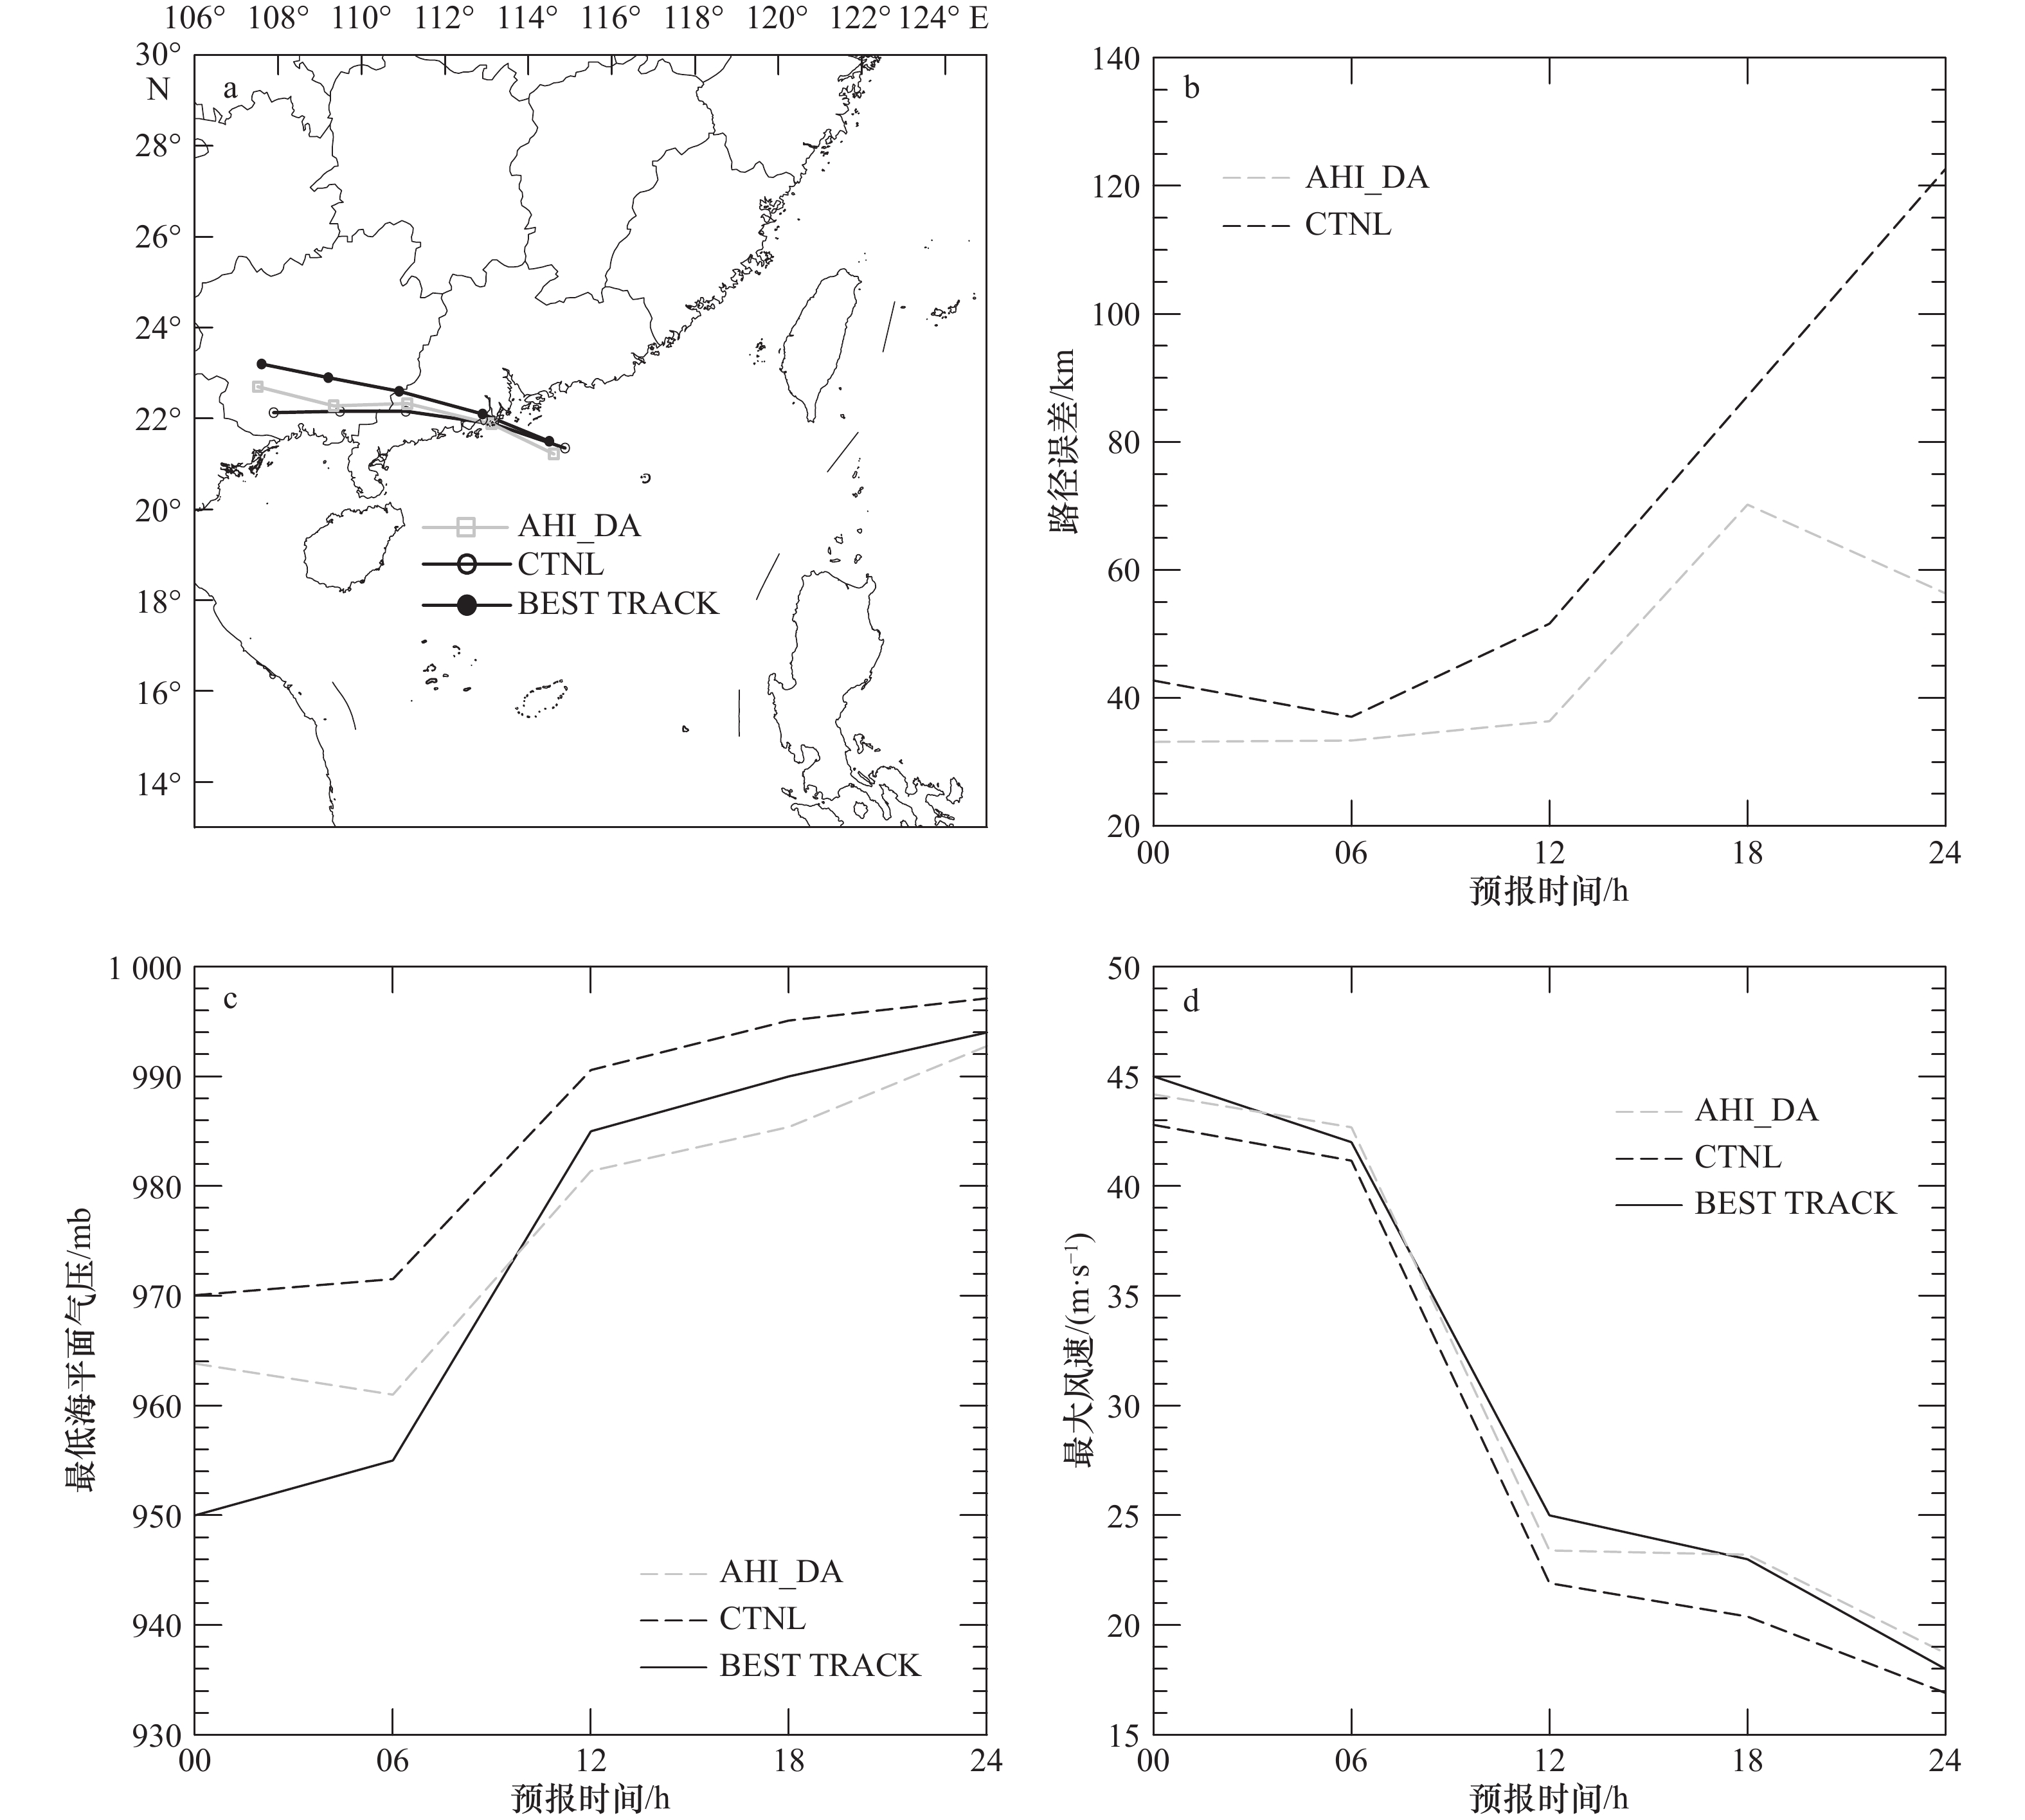
图 13 2017年8月23日00时后24 h确定性预报的实际路径和预报路径(a),路径误差随预报时间变化分布(b),最低海平面气压随预报时间变化分布(c)和最大风速随预报时间变化分布(d)
Fig. 13 24-hour deterministic forecast at 00:00 UTC on August 23, 2017, the best track and forecast track (a), the track error with the forecast leading time (b), minimum sea level pressure with the forecast leading time (c) and maximum wind speed with the forecast leading time (d)
表 1 AHI 16个通道的中心波长
Tab. 1 The central wavelength of 16 AHI bands
频带名称 波段类别 中心波长/μm 1 可见光 0.47 2 可见光 0.51 3 可见光 0.64 4 近红外线 0.86 5 近红外线 1.6 6 近红外线 2.3 7 红外线 3.9 8 红外线 6.2 9 红外线 6.9 10 红外线 7.3 11 红外线 8.6 12 红外线 9.6 13 红外线 10.4 14 红外线 11.2 15 红外线 12.3 16 红外线 13.3  下载: 导出CSV
表 2 模拟实验方案设置
Tab. 2 Simulation experiment scheme setting
实验 说明 CTNL 常规观测资料 AHI_DA 常规观测资料和AHI观测资料
下载: 导出CSV
-
[1] 沈菲菲, 许冬梅, 闵锦忠, 等. 云尺度雷达资料的混合同化对台风“桑美”的数值模拟研究[J]. 海洋学报, 2018, 40(5): 48−61.Shen Feifei, Xu Dongmei, Min Jinzhong, et al. Assimilation of radar observations with En3DVAR at cloud-resolving scale for the prediction of Typhoon Saomai[J]. Haiyang Xuebao, 2018, 40(5): 48−61. [2] 沈菲菲, 闵锦忠, 许冬梅, 等. 双多普勒雷达资料同化在飓风“艾克”预报中的应用研究[J]. 海洋学报, 2016, 38(11): 60−72.Shen Feifei, Min Jinzhong, Xu Dongmei, et al. Application of assimilating dual doppler radar data in forecast of Hurricane Ike[J]. Haiyang Xuebao, 2016, 38(11): 60−72. [3] 沈菲菲, 闵锦忠, 陈鹏, 等. 多普勒雷达资料同化在台风“桑美”预报中的应用研究[J]. 海洋学报, 2015, 37(3): 25−36.Shen Feifei, Min Jinzhong, Chen Peng, et al. Experiments of assimilating doppler radar data in forecast of typhoon Saomai[J]. Haiyang Xuebao, 2015, 37(3): 25−36. [4] 李秋阳, 沈菲菲, 许冬梅, 等. 不同初始场资料对台风“桑美”数值模拟的影响[J]. 气象科技, 2019, 47(3): 460−468.Li Qiuyang, Shen Feifei, Xu Dongmei, et al. Influence of different initial fields on numerical simulation of typhoon Saomai[J]. Meteorological Science and Technology, 2019, 47(3): 460−468. [5] Miyoshi T, Kunii M. Using AIRS retrievals in the WRF-LETKF system to improve regional numerical weather prediction[J]. Tellus A: Dynamic Meteorology and Oceanography, 2012, 64(1): 18408. doi: 10.3402/tellusa.v64i0.18408 [6] Zou X, Qin Zhengkun, Zheng Y. Improved tropical storm forecasts with GOES-13/15 imager radiance assimilation and asymmetric vortex initialization in HWRF[J]. Monthly Weather Review, 2015, 143(7): 2485−2505. doi: 10.1175/MWR-D-14-00223.1 [7] 俞兆文, 刘健文, 黄江平, 等. AMSR2微波成像资料同化试验及其对台风预报的影响[J]. 气象海洋水文仪器, 2017, 34(2): 1−8.Yu Zhaowen, Liu Jianwen, Huang Jiangping, et al. Assimilation experiment of AMSR2 microwave imaging data and its influence on typhoon forecasting[J]. Meteorological, Hydrological and Marine Instruments, 2017, 34(2): 1−8. [8] 耿晓雯, 闵锦忠, 杨春, 等. FY-4A AGRI辐射率资料偏差特征分析及订正试验[J]. 大气科学, 2020, 44(4): 679−694.Geng Xiaowen, Min Jinzhong, Yang Chun, et al. Analysis of FY-4A AGRI radiance data bias characteristics and a correction experiment[J]. Chinese Journal of Atmospheric Sciences (in Chinese), 2020, 44(4): 679−694. [9] Wang Y, Liu Z, Yang S, et al. Added value of assimilating Himawari-8 AHI water vapor radiances on analyses and forecasts for “7.19” severe storm over north China[J]. Journal of Geophysical Research, 2018, 123: 3374−3394. [10] Honda T, Miyoshi T, Lien G Y, et al. Assimilating all-sky Himawari-8 satellite infrared radiances: A case of typhoon soudelor (2015)[J]. Monthly Weather Review, 2018, 146(1): 213−229. doi: 10.1175/MWR-D-16-0357.1 [11] 朱文刚. 高光谱大气红外探测器AIRS资料云检测及晴空通道应用技术初步研究[D]. 南京: 南京信息工程大学, 2012.Zhu Wengang. Impliment study on hyperspectral atmospheric infrared detectors AIRS cloud detect and clear channels application technology[D]. Nanjing: Nanjing University of Information Science & Technology, 2012. [12] Goldberg M D, Qu Y, Mcmillin L M, et al. AIRS near-real-time products and algorithms in support of operational numerical weather prediction[J]. IEEE Transactions on Geoscience and Remote Sensing, 2003, 41(2): 379−389. doi: 10.1109/TGRS.2002.808307 [13] 官莉. 卫星红外超光谱资料及其在云检测、晴空订正和大气廓线反演方面的应用[D]. 南京: 南京信息工程大学, 2005.Guan Li. A study on infrared hyperspectral measurements and its applications on cloud detection, cloud-clearing and atmospheric sounding profile[D]. Nanjing: Nanjing University of Information Science & Technology, 2005. [14] 官莉, 王振会. 用空间匹配的MODIS云产品客观确定AIRS云检测[J]. 气象科学, 2007, 27(5): 516−521. doi: 10.3969/j.issn.1009-0827.2007.05.007Guan Li, Wang Zhenhui. Objective determination of AIRS cloud mask using co-located MODIS cloud mask[J]. Scientia Meteorologica Sinica, 2007, 27(5): 516−521. doi: 10.3969/j.issn.1009-0827.2007.05.007 [15] Bauer P, Ohring G, Kummerow C, et al. Assimilating satellite observations of clouds and precipitation into NWP models[J]. Bulletin of the American Meteorological Society, 2011, 92(6): ES25−ES28. doi: 10.1175/2011BAMS3182.1 [16] Otkin J A. Assimilation of water vapor sensitive infrared brightness temperature observations during a high impact weather event[J]. Journal of Geophysical Research: Atmospheres, 2012, 140(D19): D19203. [17] Bessho K, Date K, Hayashi M, et al. An introduction to Himawari-8/9—Japan’s new-generation geostationary meteorological satellite[J]. Journal of the Meteorological Society of Japan, 2016, 94(2): 151−183. doi: 10.2151/jmsj.2016-009 [18] Honda T, Kotsuki S, Lien G Y, et al. Assimilation of himawari-8 all-sky radiances every 10 minutes: Impact on precipitation and flood risk prediction[J]. Journal of Geophysical Research: Atmospheres, 2018, 123(2): 965−976. doi: 10.1002/2017JD027096 [19] Qin Z, Zou X, Weng F. Impacts of assimilating all or GOES-like AHI infrared channels radiances on QPFs over eastern China[J]. Tellus A: Dynamic Meteorology and Oceanography, 2017, 69(1): 1345265. doi: 10.1080/16000870.2017.1345265 [20] Barker D, Huang Xiangyu, Liu Zhiquan, et al. The weather research and forecasting model’s community variational/ensemble data assimilation system: WRFDA[J]. Bulletin of the American Meteorological Society, 2012, 93(6): 831−843. doi: 10.1175/BAMS-D-11-00167.1 [21] Ide K, Courtier P, Ghil M, et al. Unified notation for data assimilation: Operational, sequential and variational[J]. Journal of the Meteorological Society of Japan. Ser. II, 1997, 75(1): 181−189. [22] Zhuge X, Zou X. Test of a modified infrared-only ABI cloud mask algorithm for AHI radiance observations[J]. Journal of Applied Meteorology and Climatology, 2016, 55(11): 2529−2546. doi: 10.1175/JAMC-D-16-0254.1 [23] 张涛, 姜立鹏, 师春香, 等. AMSU-A全空辐射率资料同化对台风“天鸽”的预报影响研究[J]. 大气科学学报, 2019, 42(5): 705−714.Zhang Tao, Jiang Lipeng, Shi Chunxiang, et al. The impact of AMSU-A all-sky data assimilation on the forecast of super typhoon HATO[J]. Transactions of Atmospheric Sciences, 2019, 42(5): 705−714. [24] Roberts N M, Lean H W. Scale-selective verification of rainfall accumulations from high-resolution forecasts of convective events[J]. Monthly Weather Review, 2008, 136(1): 78−97. doi: 10.1175/2007MWR2123.1 [25] 王天驹, 齐琳琳, 朱江, 等. HY-2卫星高度计波高资料在集合最优插值同化中的应用研究——以台风“Lipee”为例[J]. 海洋学报, 2017, 39(2): 29−38.Wang Tianju, Qi Linlin, Zhu Jiang, et al. Application studies of using HY-2 satellite altimeter wave data in ensemble optimal interpolation method—“Lipee” for instance[J]. Haiyang Xuebao, 2017, 39(2): 29−38. -

计量
- 文章访问数: 1272
- HTML全文浏览量: 785
- PDF下载量: 136
- 被引次数: 0
