

Low frequency variation of deep current at Niulang Seamount based on submarine mooring observation
-
摘要: 本文利用在西太平洋牛郎海山布放的两套锚系潜标获取的长时间海流观测数据,分析了深海的海洋动力环境特征,着重阐释了该海域海流的全水深垂向结构及其低频变化特征。结果表明:(1)年平均海流及其变化幅度均在上层最大、中层和深层次之、中深层最小;(2)年平均上,150 m以浅的海流为东向的副热带逆流,150 m以深和中层为西向流;山顶处的近底层海流为较稳定的弱南向流,山底处的近底层海流为西南向流;(3)在山顶和山底,各深度层次的海流在全年均表现出100 d左右的振荡周期;在2 000 m以浅,各深度层次的海流振荡的位相基本一致,振荡幅度在表层最强、随深度的增加而减小;在2 000 m以深,海流变化的位相与2 000 m以浅相反,振荡幅度在4 000 m最强。Abstract: Based on the long-term observation obtained from two sets of submarine mooring system deployed at Niulang Seamount in the western Pacific, the vertical distribution of the deep currents and the temporal variation characteristics were analyzed in the paper. The results show that: (1) The annual mean ocean currents and the variations were the largest in the upper layer, the second in the middle and deep layers, and the smallest in the middle-deep layers. (2) The subtropical countercurrent was at the depth shallower than 150 m, and the northward current was at depth deeper than 150 m and at the middle layers; the near bottom current was weak southward at the summit of the seamount, but southwestward at the bottom of the seamount. (3) Both at the summit and bottom of the seamount, the currents showed a seasonal oscillation with the most energetic oscillation at a period of about 100 d throughout the water column; at depth above 2 000 m, currents showed a synchronous oscillation in the throughout the water column, with the oscillation amplitude decreasing with depth; current oscillation at deep layers (below 2 000 m) were in opposite phase with that at the upper layers, and the oscillation amplitude was the strongest at 4 000 m.
-
Key words:
- Niulang Seamount /
- mooring system /
- deep current /
- low frequency variation
-

图 1 潜标位置和地形
地形数据取自GEBCO1
Fig. 1 Mooring sites and topography
Topography data are extracted from GEBCO1

图 2 MX1观测的不同深度层次的3日平均流矢图
Fig. 2 Time series of 3-day averaged flow vectors from MX1 at different depths
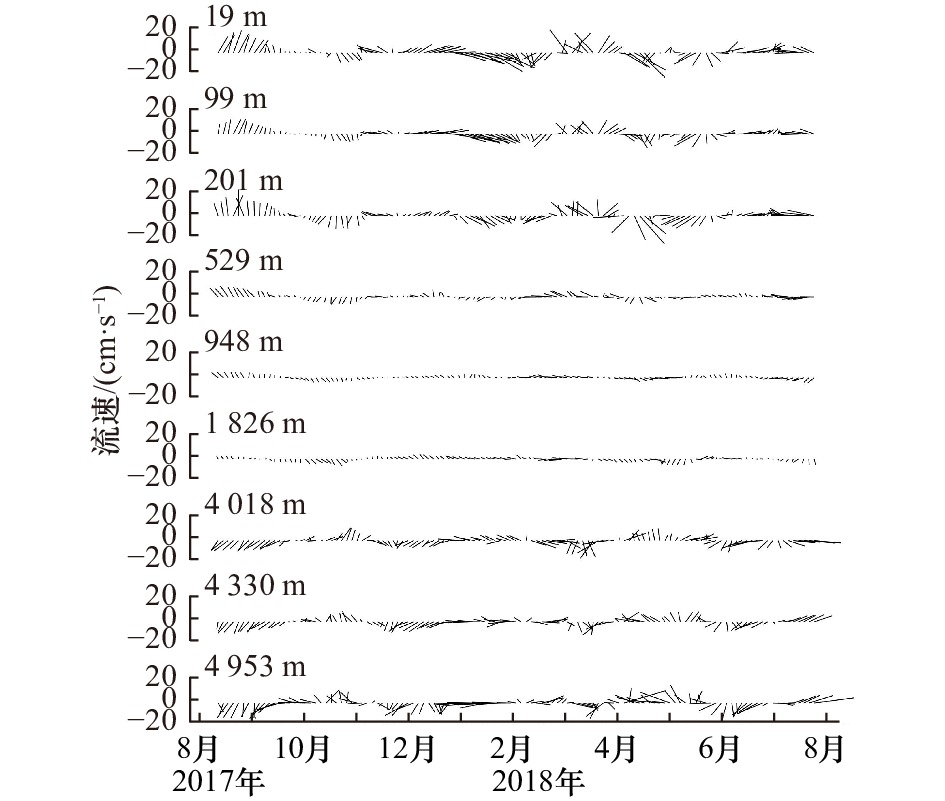
图 3 MX2观测的不同深度层次的3日平均流矢图
Fig. 3 Time series of 3-day averaged flow vectors from MX2 at different depths
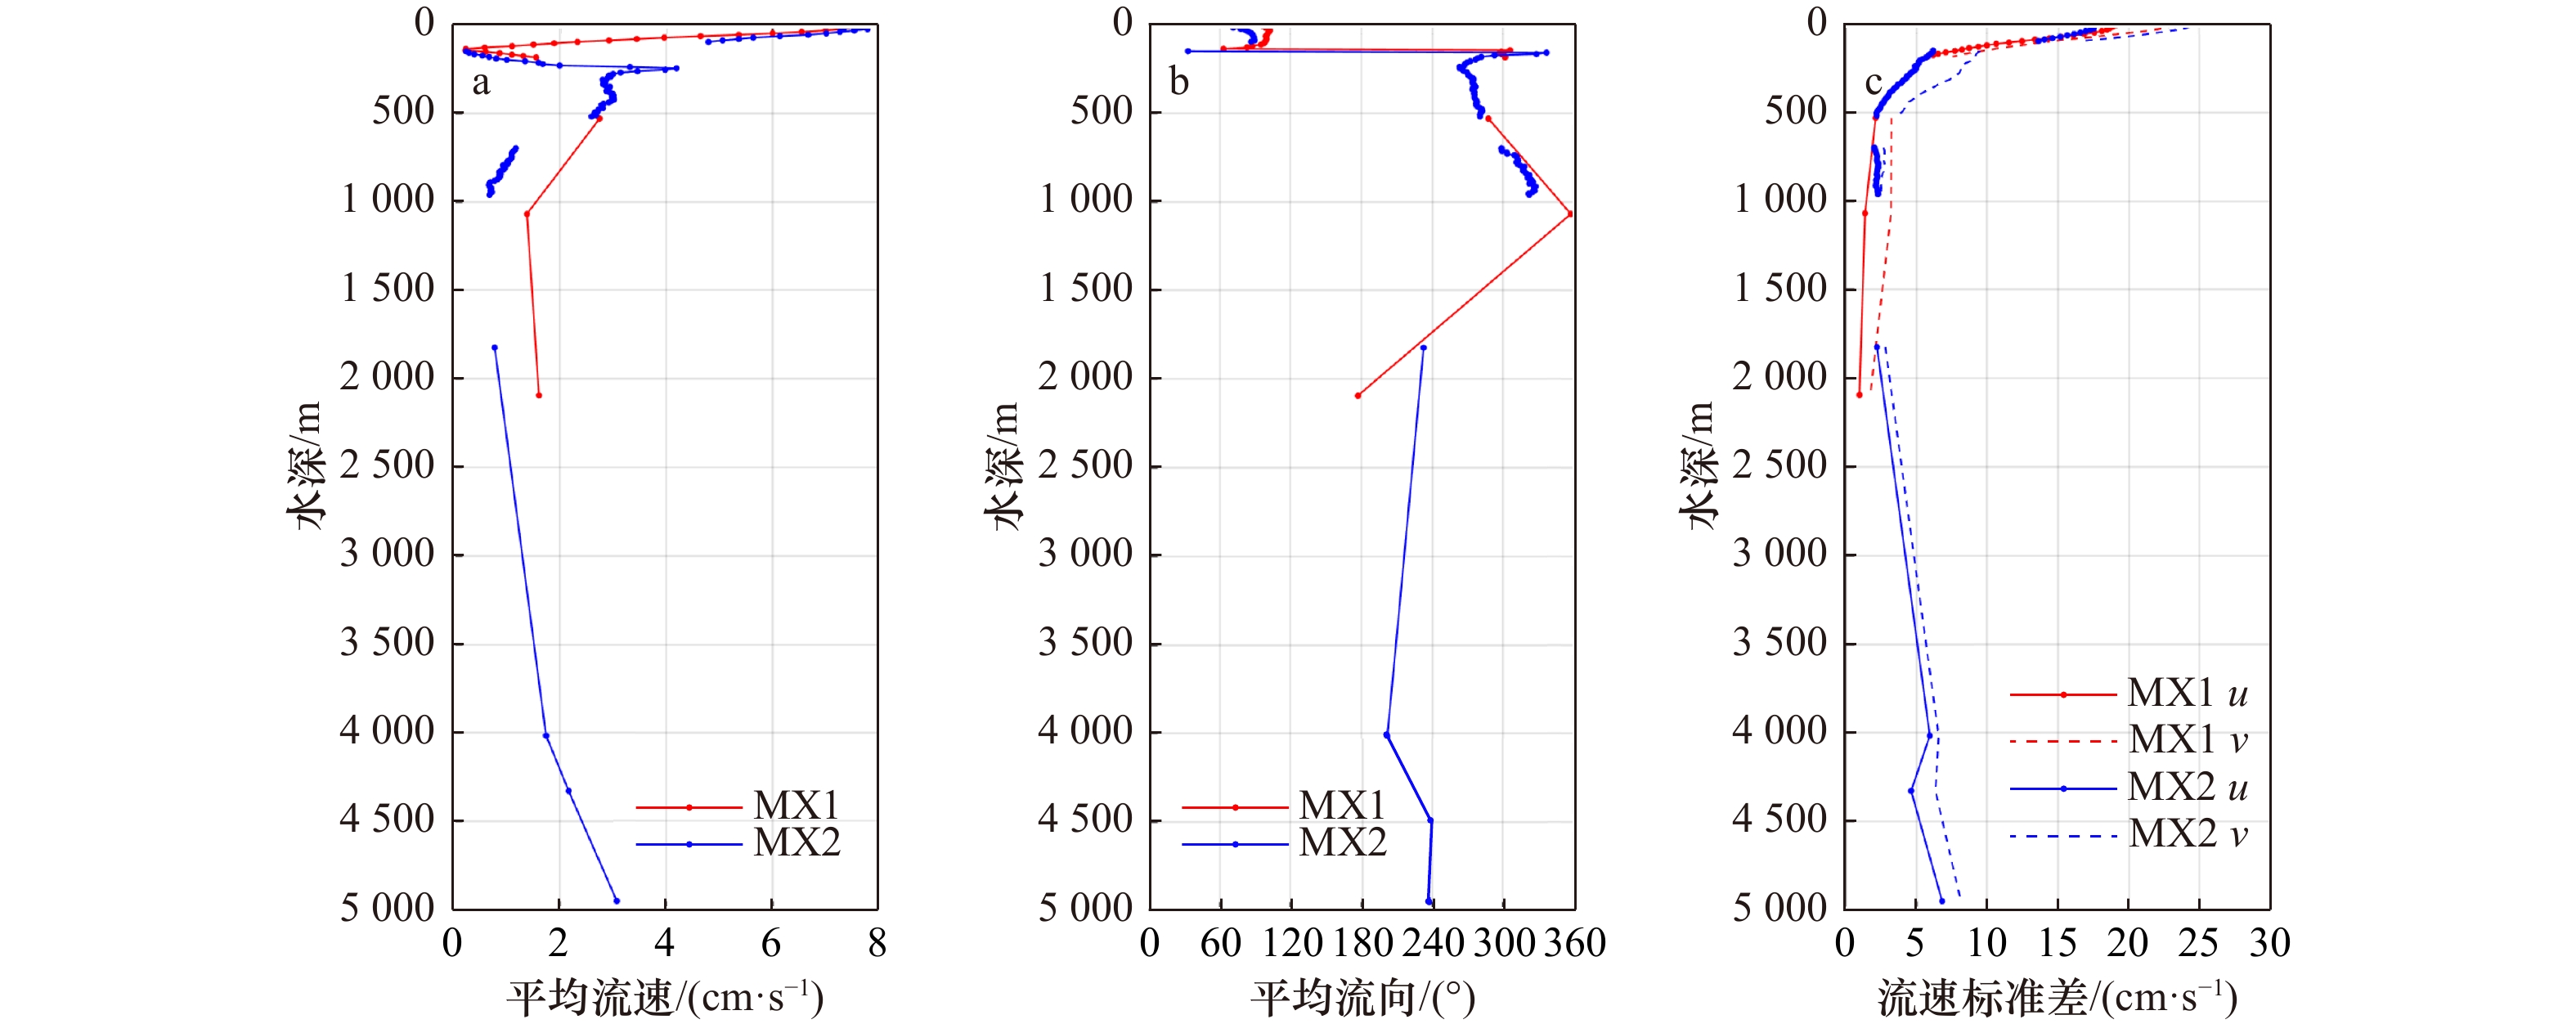
图 4 低频海流(3 d低通滤波)的平均流速(a)、平均流向(b)和流速标准差(c)
u代表纬向流速,v代表经向流速
Fig. 4 Averaged current (3 d low-pass filtered) velocity (a), direction (b) and stand deviation (c)
u denote the zonal velocity and v denote the meridional velocity
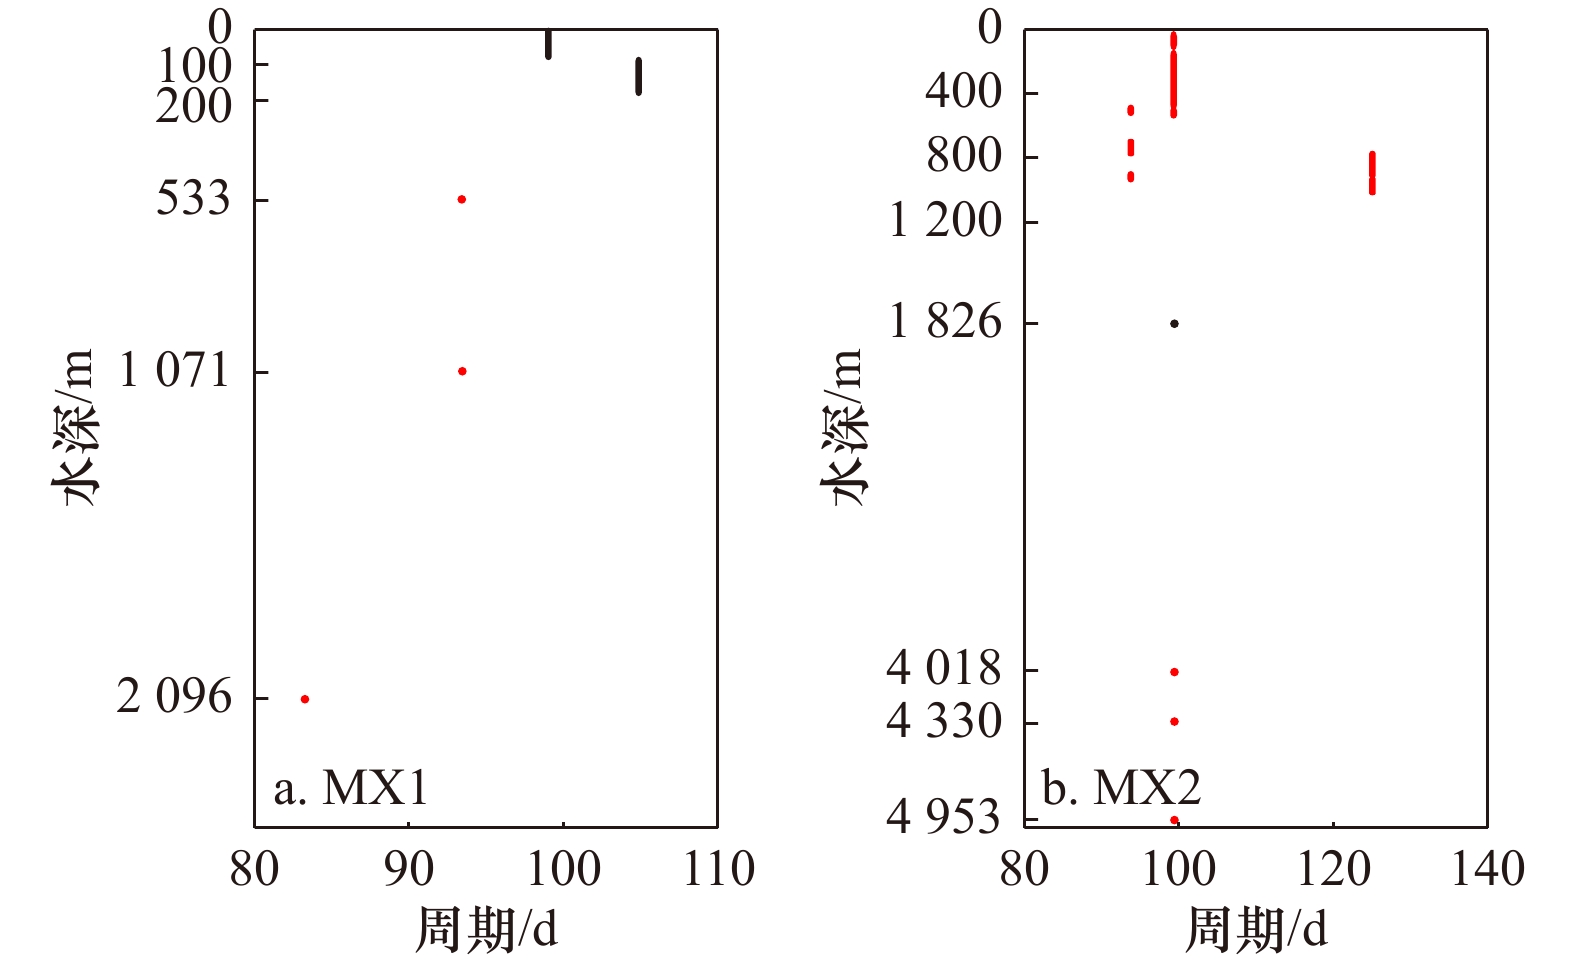
图 5 MX1和MX2各深度层次日平均经向流速的主振荡周期
红色点代表该周期的计算值通过了95%显著性检验
Fig. 5 Periods of the dominant oscillations of daily-averaged meridional velocity at MX1 and MX2
The red dots denote values that are above the 95% significance level

图 6 MX1观测的山顶各层次日平均经向流速的小波谱(WPS)和全球功率谱(GWS)
填色图为小波功率谱,曲线图为全球功率谱。填色图中粗黑线包围的范围通过了a=0.05显著性水平下的红噪声标准谱的检验;细黑线为影响锥曲线,在该曲线以外的功率谱由于受到边界效应的影响而不予考虑且显示为浅色阴影。曲线图中蓝色实线为全球功率谱密度,红色虚线为a=0.05显著性水平下的红噪声标准谱
Fig. 6 Wavelet power spectrum (WPS) and global wavelet spectrum (GWS) analysis of daily meridional currents at different depths from MX1
The color filled maps represent wavelet power spectrum and the curves on the right represent global wavelet spectrum. In the color maps, the thick black contours denote the 5% significance level against red noise, the thin black line is the influence cone curve, and the cone of influence where edge effects might distort the picture is shown as in lighter shades. In the curve map, the blue line denote the global wavelet density, and the dotted red line denote the 5% significance level against red noise
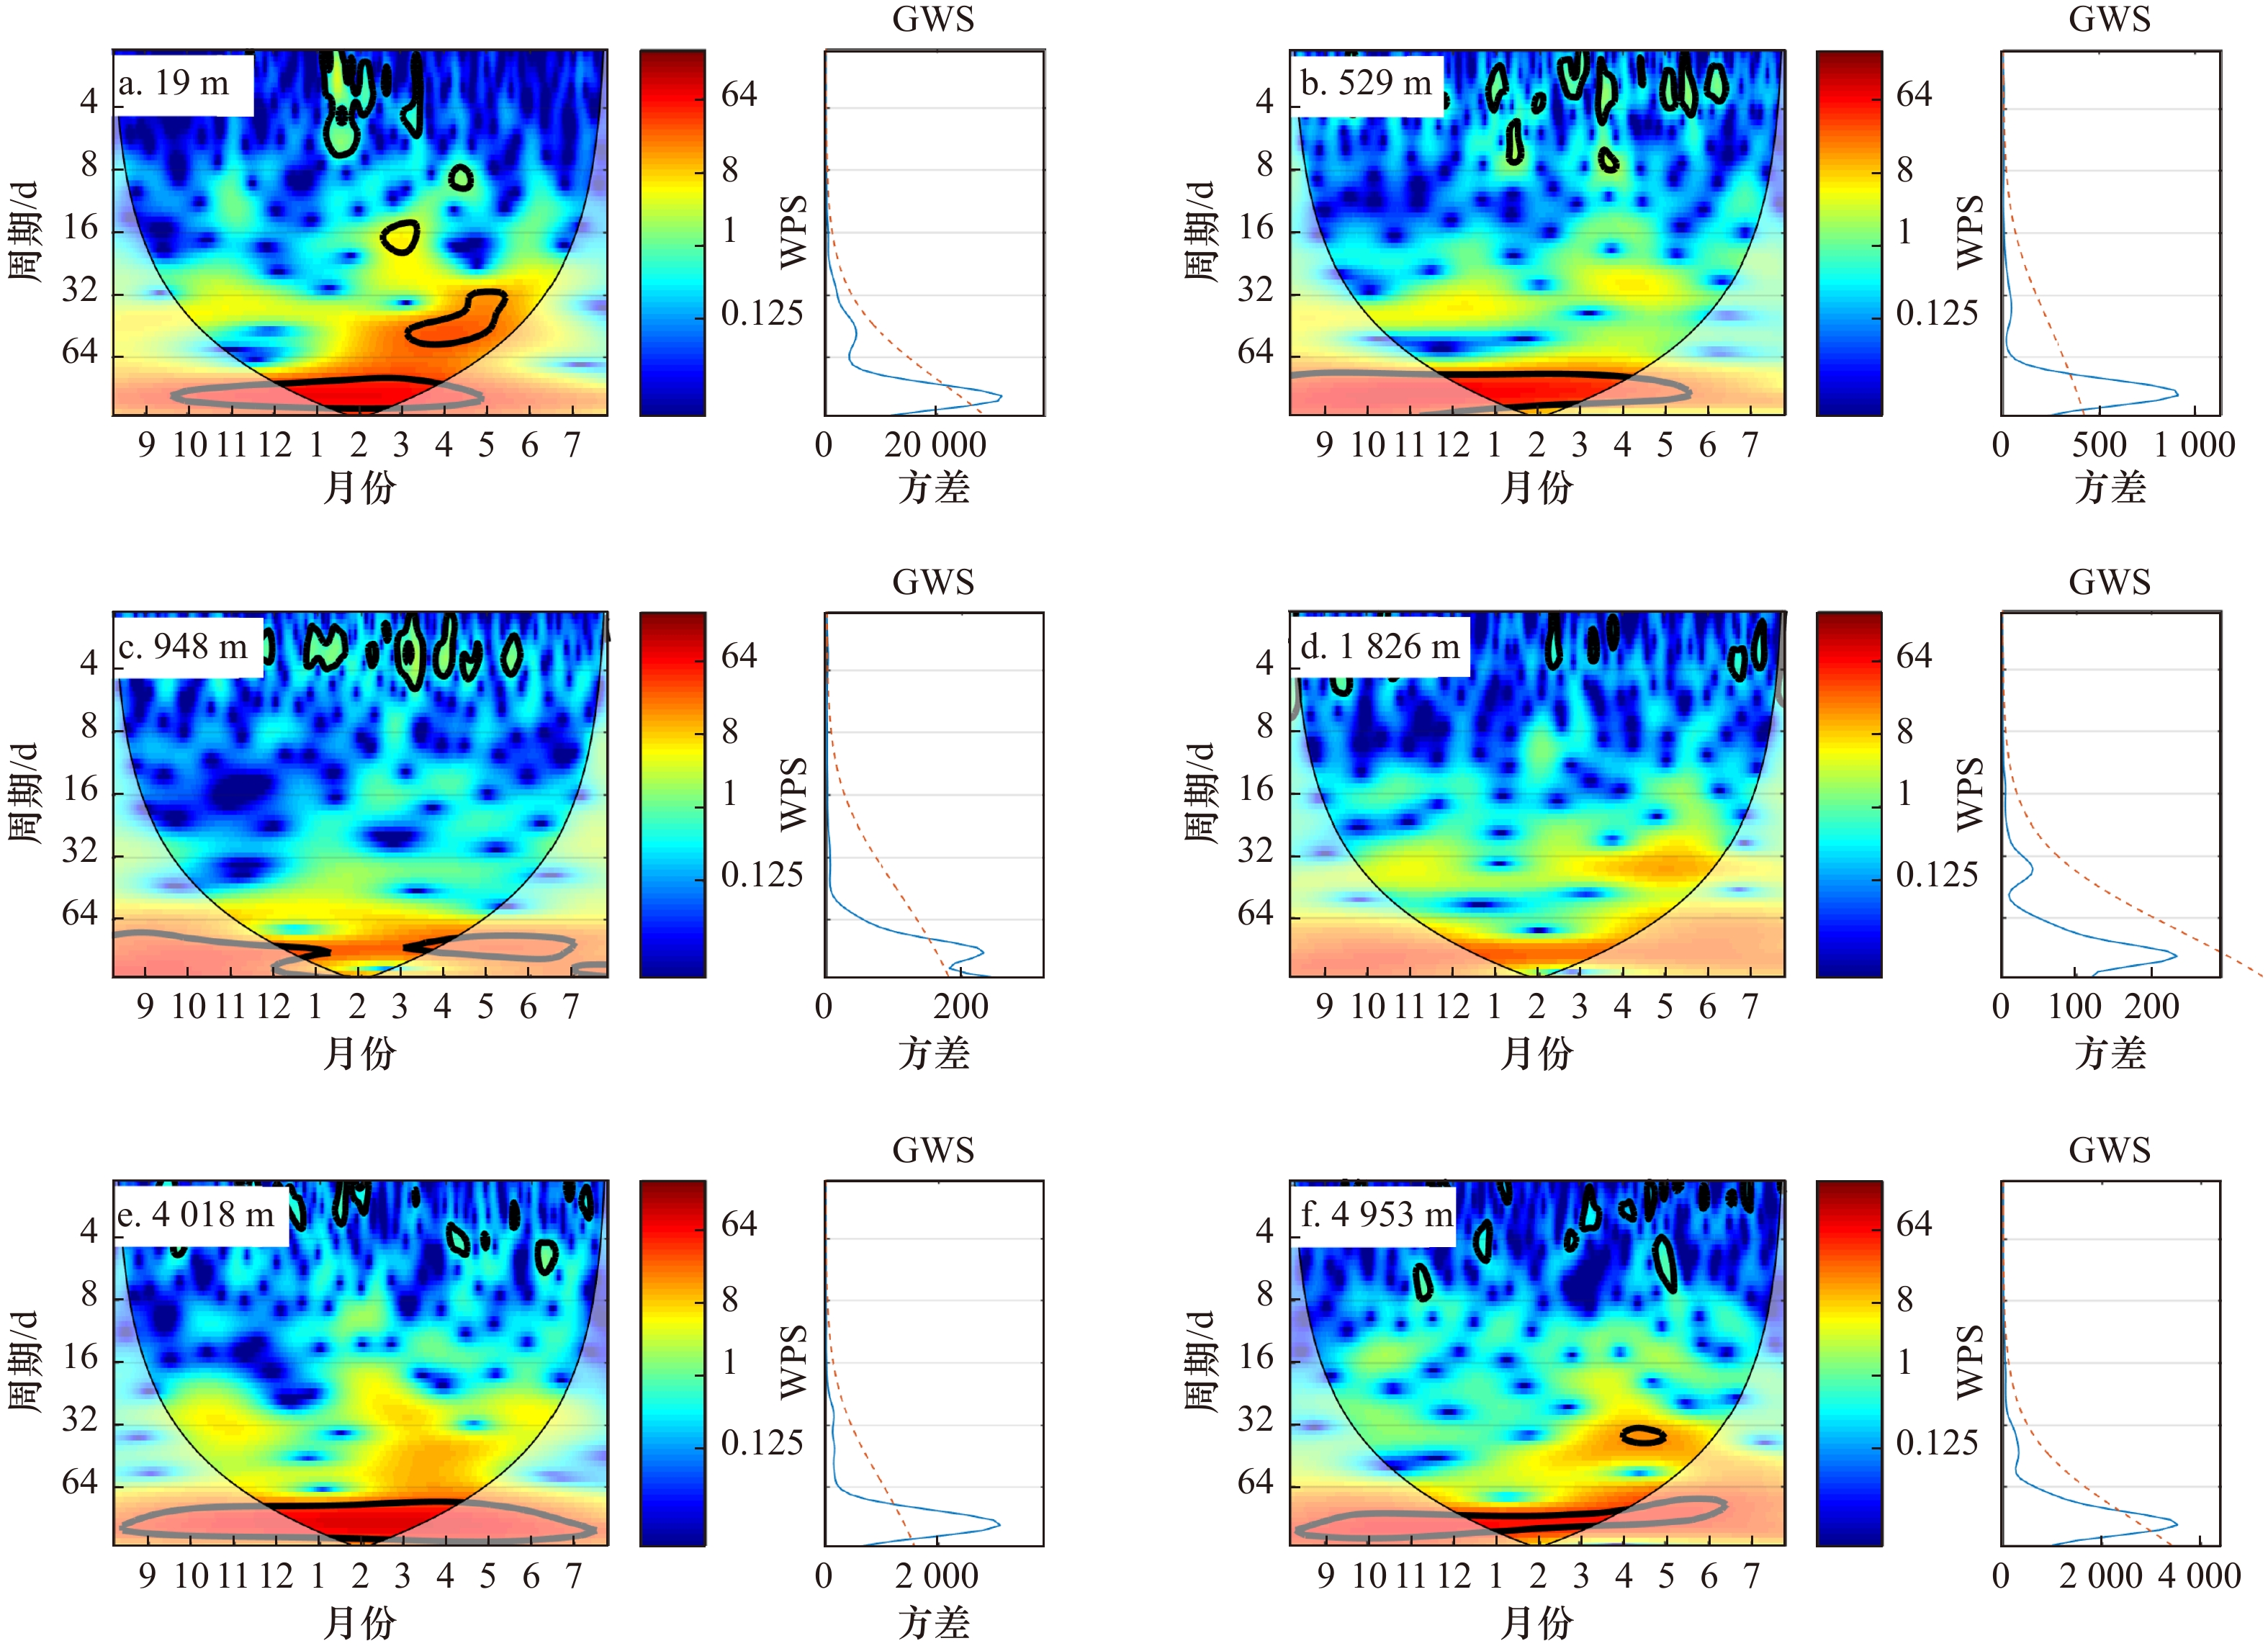
图 7 MX2观测的各深度层次日平均经向流速的小波谱和全球功率谱
填色图为小波功率谱,曲线图为全球功率谱。填色图中粗黑线包围的范围通过了a=0.05显著性水平下的红噪声标准谱的检验;细黑线为影响锥曲线,在该曲线以外的功率谱由于受到边界效应的影响而不予考虑且显示为浅色阴影
Fig. 7 Wavelet power spectrum (WPS) and global wavelet spectrum (GWS) analysis of daily meridional currents at different depths from MX2
The color filled maps represent wavelet power spectrum and the curves on the right represent global wavelet spectrum. In the color maps, the thick black contours denote the 5% significance level against red noise, the thin black line is the influence cone curve, and the cone of influence where edge effects might distort the picture is shown as in lighter shades

图 8 经向流速的近100 d振荡的垂向结构(80~120 d滤波)
Fig. 8 Vertical structures of meridional currents at about 100 d bands (80−120 d bandpass filtered)

图 9 MX2日平均海流矢量相关系数(a)和偏角(b)
Fig. 9 Complex vector correlation coefficients (a) and rotation angles in degrees (b) of current from different depths at MX2
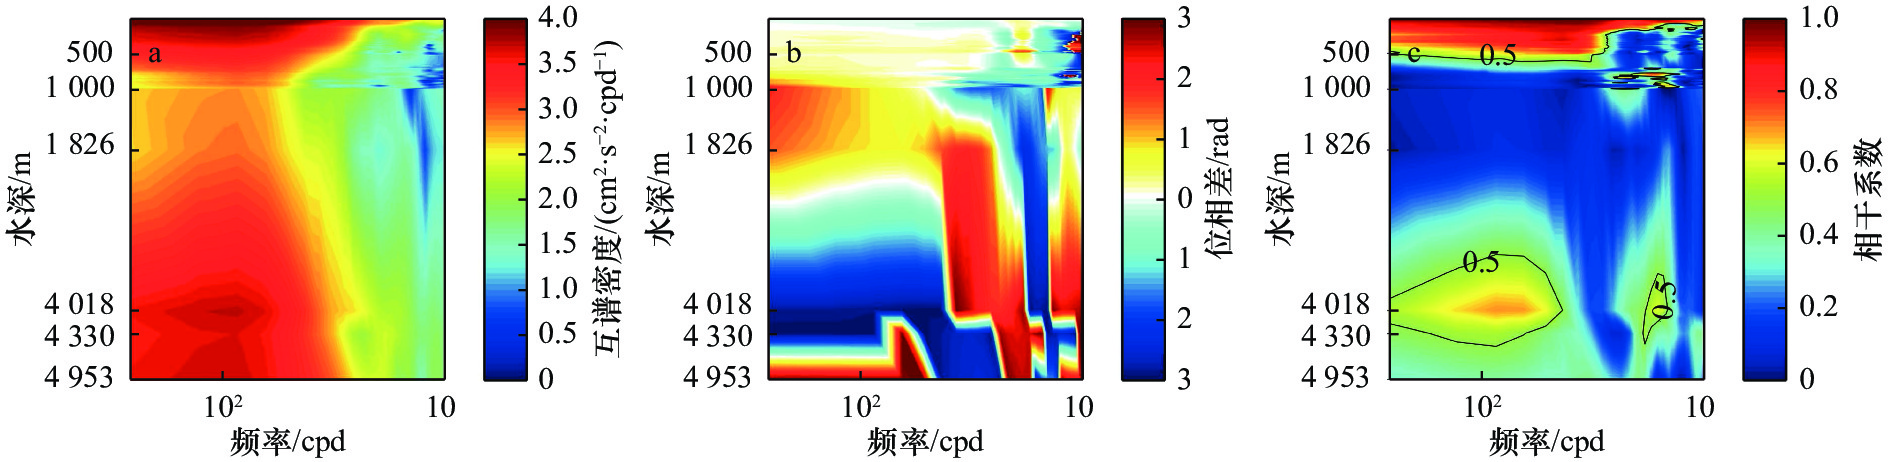
图 10 各层次与表层(19 m)的经向流速的互谱分析
a. 互谱密度; b. 位相差;c. 相干系数
Fig. 10 Cross spectrum analysis between the surface meridional current (19 m) and those at other depths
a. Cross power spectral density; b. cross power spectral phase lag; c. magnitude-squared coherence

图 11 MX2观测位置的正压模态和前4个斜压模态
Fig. 11 The barotropic mode and the first four baroclinic modes at the mooring site of MX2

图 12 经向流速的时间–深度分布观测值(a)、正压模态和前4个斜压模态重构值(b)
Fig. 12 Meridional velocity along the time-depth section observation (a), reconstructed from the barotropic mode and the first four baroclinic modes (b)
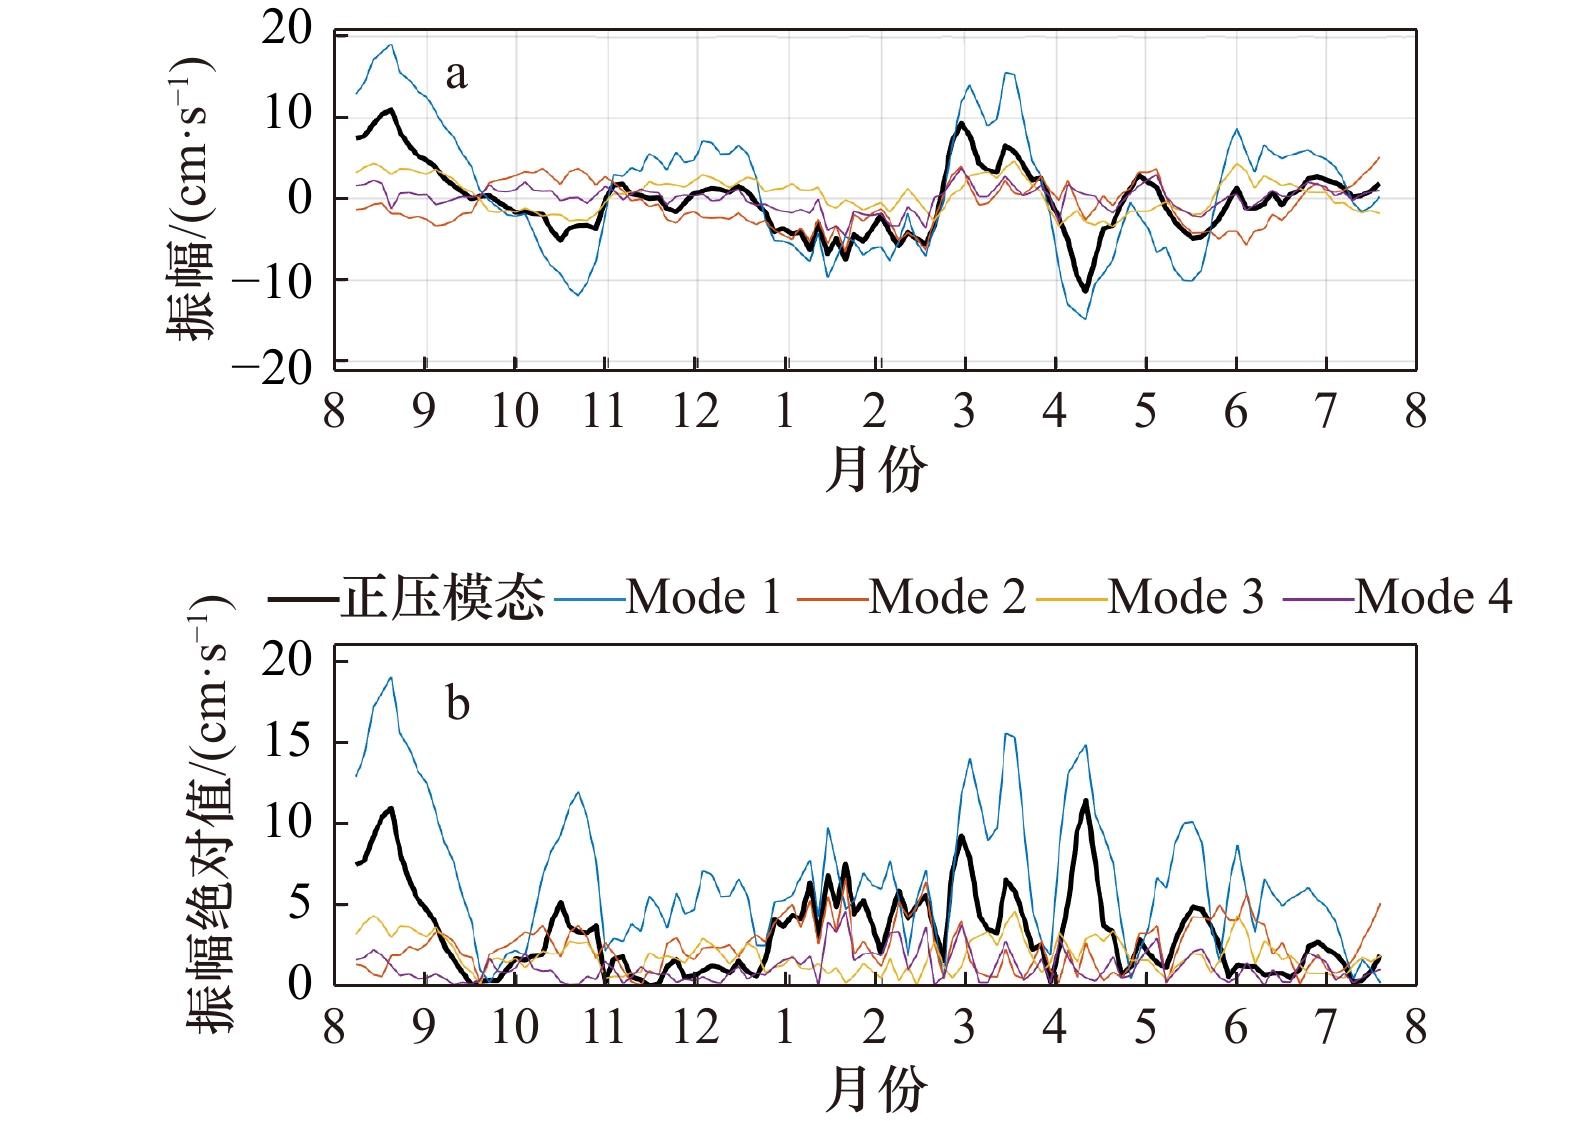
图 13 正压模态和前4个斜压模态的振幅
Fig. 13 Amplitudes of the barotropic mode and the first four baroclinic modes
表 1 MX1和MX2邻近深度层次低频海流的矢量相关系数
Tab. 1 Complex vector correlation coefficients and rotation angles of current at adjacent depths from MX1 and MX2
水深/m 相关系数 偏角/(°) 20 0.52 –1 50 0.51 –1 100 0.53 –3 200 0.45 –11 530 0.67 –1 1 000 0.64 –28 2 000 0.20 –2  下载: 导出CSV
-
[1] 乔方利, Tal E, 袁业立. 全球海洋高频波动主振荡周期的纬向带状分布特征[J]. 海洋学报, 2004, 26(3): 1−7.Qiao Fangli, Tal E, Yuan Yeli. The zonal distribution features of high frequency oscillations in the oceans derived from satellite altimeter data[J]. Haiyang Xuebao, 2004, 26(3): 1−7. [2] 刘秦玉, 王启. 热带太平洋海平面高度季节内振荡的空间分布特征[J]. 青岛海洋大学学报, 1999, 29(4): 549−555.Liu Qinyu, Wang Qi. Spatial distribution of the sea surface height intraseasonal oscillation in the Tropical Pacific[J]. Journal of Ocean University of Qingdao, 1999, 29(4): 549−555. [3] 刘秦玉, 潘爱军, 刘征宇. 太平洋北赤道流区上层海洋季节内振荡及斜压稳定性[J]. 海洋与湖沼, 2003, 34(1): 94−100. doi: 10.3321/j.issn:0029-814X.2003.01.012Liu Qinyu, Pan Aijun, Liu Zhengyu. Intraseasonal oscillation and baroclinic instability of upper layer ocean in the North Equator current[J]. Oceanologia et Limnologia Sinica, 2003, 34(1): 94−100. doi: 10.3321/j.issn:0029-814X.2003.01.012 [4] Uda M, Hasunuma K. The eastward subtropical countercurrent in the western North Pacific Ocean[J]. Journal of the Oceanographical Society of Japan, 1969, 25(4): 201−210. doi: 10.5928/kaiyou1942.25.201 [5] Yoshida K, Kidokoro T. A subtropical counter-curreut in the North Pacific-an eastward flow near the subtropical convergence[J]. Journal of the Oceanographical Society of Japan, 1967, 23(2): 88−91. doi: 10.5928/kaiyou1942.23.88 [6] 顾玉荷, 孙湘平, 许兰英. 137°E经向断面上的副热带逆流[J]. 海洋学报, 1999, 21(5): 22−30.Gu Yuhe, Sun Xiangping, Xu Lanying. Subtropical countercurrent at the 137°E longitudinal section[J]. Haiyang Xuebao, 1999, 21(5): 22−30. [7] 李薇, 刘海龙, 刘秦玉. 北太平洋副热带海区的两支东向逆流[J]. 大气科学, 2003, 27(5): 811−820. doi: 10.3878/j.issn.1006-9895.2003.05.03Li Wei, Liu Hailong, Liu Qinyu. Two branches of the eastward countercurrent in the subtropical region of the North Pacific[J]. Chinese Journal of Atmospheric Sciences, 2003, 27(5): 811−820. doi: 10.3878/j.issn.1006-9895.2003.05.03 [8] 孙湘平. 西北太平洋副热带逆流、北赤道流、北赤道逆流几个特征的比较[J]. 黄渤海海洋, 2000, 18(1): 1−12.Sun Xiangping. A comparison of characteristics between the subtropical countercurrent, the North Equatorial current and the North Equatorial countercurrent in the northwestern Pacific Ocean[J]. Journal of Oceanography of Huanghai & Bohai Seas, 2000, 18(1): 1−12. [9] Qiu Bo. Seasonal eddy field modulation of the North Pacific subtropical countercurrent: TOPEX/Poseidon observations and theory[J]. Journal of Physical Oceanography, 1999, 29(10): 2471−2486. doi: 10.1175/1520-0485(1999)029<2471:SEFMOT>2.0.CO;2 [10] 刘秦玉, 杨海军, 鲍洪彤, 等. 北太平洋副热带逆流的气候特征[J]. 大气科学, 2000, 24(3): 363−372. doi: 10.3878/j.issn.1006-9895.2000.03.08Liu Qinyu, Yang Haijun, Bao Hongtong, et al. Climatic features of subtropical countercurrent in the North Pacific[J]. Chinese Journal of Atmospheric Sciences, 2000, 24(3): 363−372. doi: 10.3878/j.issn.1006-9895.2000.03.08 [11] 潘爱军, 刘秦玉, 胡瑞金, 等. 北太平洋副热带逆流区海流的准90天振荡[J]. 青岛海洋大学学报, 2002, 32(1): 18−24.Pan Aijun, Liu Qinyu, Hu Ruijin, et al. Quasi 90-day oscillation of the current in the area of subtropical countercurrent in the North Pacific[J]. Journal of Ocean University of Qingdao, 2002, 32(1): 18−24. [12] Yoshioka N, Endoh M, Ishizaki H. Observation of the abyssal current in the West Mariana Basin[J]. Journal of the Oceanographical Society of Japan, 1988, 44(1): 33−39. doi: 10.1007/BF02303148 [13] 梁楚进, 侯一筠, 陈琪, 等. 中国多金属结核开辟区近底低频流动特征[J]. 科学通报, 2004, 49(11): 1184−1189. doi: 10.1360/03wd0300Liang Chujin, Hou Yijun, Chen Qi, et al. Characteristics of low-frequency components of the near-bottom current in the Chinese pioneer area[J]. Chinese Science Bulletin, 2004, 49(11): 1184−1189. doi: 10.1360/03wd0300 [14] Kawabe M, Fujio S, Yanagimoto D. Deep-water circulation at low latitudes in the western North Pacific[J]. Deep-Sea Research Part I: Oceanographic Research Papers, 2003, 50(5): 631−656. doi: 10.1016/S0967-0637(03)00040-2 [15] Liu Yansong, Yu Fei, Nan Feng, et al. Intraseasonal oscillation of deep currents influenced by mesoscale eddies in the Kuroshio extension region[J]. Scientific Reports, 2019, 9(1): 4147. doi: 10.1038/s41598-019-39567-7 [16] Wang Fujun, Zhang Linlin, Hu Dunxin, et al. The vertical structure and variability of the western boundary currents east of the Philippines: case study from in situ observations from December 2010 to August 2014[J]. Journal of Oceanography, 2017, 73(6): 743−758. doi: 10.1007/s10872-017-0429-x [17] 旷芳芳, 潘爱军, 张俊鹏, 等. 基于潜标观测的吕宋海峡以东深海海流的低频变异[J]. 海洋学报, 2020, 42(9): 1−8.Kuang Fangfang, Pan Aijun, Zhang Junpeng, et al. Low frequency variation of abyssal current east of the Luzon Strait: cast study fromin situ observation[J]. Haiyang Xuebao, 2020, 42(9): 1−8. [18] Liu Lintao, Hsu H, Grafarend E W. Normal Morlet wavelet transform and its application to the Earth’s polar motion[J]. Journal of Geophysical Research: Solid Earth, 2007, 112(B8): B08401. [19] Liang Xinfeng, Thurnherr A M. Subinertial variability in the deep ocean near the East Pacific Rise between 9° and 10°N[J]. Geophysical Research Letters, 2011, 38(6): L06606. [20] Zhang Yanwei, Liu Zhifei, Zhao Yulong, et al. Effect of surface mesoscale eddies on deep-sea currents and mixing in the northeastern South China Sea[J]. Deep-Sea Research Part II: Topical Studies in Oceanography, 2015, 122: 6−14. doi: 10.1016/j.dsr2.2015.07.007 [21] Ma Qiang, Wang Fan, Wang Jianing, et al. Intensified deep ocean variability induced by topographic Rossby waves at the Pacific yap-Mariana junction[J]. Journal of Geophysical Research: Oceans, 2019, 124(11): 8360−8374. doi: 10.1029/2019JC015490 [22] Shu Yeqiang, Xue Huijie, Wang Dongxiao, et al. Persistent and energetic bottom-trapped topographic Rossby waves observed in the southern South China Sea[J]. Scientific Reports, 2016, 6: 24338. doi: 10.1038/srep24338 -

计量
- 文章访问数: 659
- HTML全文浏览量: 254
- PDF下载量: 36
- 被引次数: 0
