

Cause of Beaufort Sea low ice condition in the summer of 2019
-
摘要: 波弗特海海冰的剧烈变化对区域内生态系统以及经济活动具有重要影响。基于美国国家冰雪数据中心发布的海冰密集度数据,本文对2019年波弗特海夏季海冰面积出现极端低值的机制进行了探讨。2019年融冰季(5–9月)海冰覆盖面积为1.38×10⁵ km2,远低于1998–2020年平均面积2.28×10⁵ km2,统计2019年前秋(2018年10–12月)和前冬季节(2019年1–4月)海冰覆盖面积,发现其与1998–2019年多年平均结果无显著差异;先前季节的海冰冰况不是造成极端低值事件的主要原因。综合海冰漂移场、海冰厚度、10 m风场以及海表面净热通量数据发现,2019年5月份海冰面积减小2.33×10⁵ km2,是1998年以来5月海冰损失量最大的年份,占融冰季节海冰面积减小量的62%。与1998年、2008年、2012年以及2016年波弗特海夏季发生海冰覆盖面积极端低值现象的机制不同,不断减小的海冰厚度以及2019年5月异常强的风场,促使海冰快速向外输出,波弗特海南部5月16日就形成开阔水域;伴随着异常高的海表面净热通量使得海冰更多地融化,造成了2019年夏季海冰的异常现象。随着海冰厚度的不断变薄,海冰对风场的响应越来越强,海冰消退时间不断提前,波弗特海夏季海冰的极端低值现象可能更为频繁地出现。Abstract: The dramatic change of sea ice in the Beaufort Sea has an important impact on the regional ecosystem and economic activities. Based on the sea ice concentration released by the National Ice and Snow Center of the United States, the mechanism of extremely low summer sea ice in the Beaufort Sea in 2019 is discussed. The sea ice area in the melt season (May–September) of 2019 is 1.38×10⁵ km2, far lower than the average of 2.28×10⁵ km2 from 1998 to 2020. According to the statistics of the sea ice area in the preceding autumn (October–December 2018) and winter (January–April 2019) of 2019, there is no significant difference between the 2019 and the average results of 1998–2019, so it is not the main reason for the extremely low ice event. Combining the data of sea ice drift field, sea ice thickness, 10 m wind field, and net sea surface heat flux, it is found that the sea ice in May of 2019 decreased by 2.33×10⁵ km2, which is the largest of sea ice loss in May since 1998, accounting for 62% of the loss of sea ice area in the melt season. Different from the mechanism of extremely low summer sea ice area in 1998, 2008, 2012, and 2016, decreasing sea ice thickness and abnormally strong wind field in May 2019 contribute to the rapid sea ice export, resulting in the formation of open water in the south of Beaufort Sea on May 16, 2019. The abnormally high sea surface net heat flux makes the sea ice melt more, resulting in the abnormal phenomenon of sea ice in the summer of 2019. With the continuous thinning of sea ice thickness, the response of sea ice to wind field is stronger and stronger, and the time of sea ice retreat is advanced, the phenomenon of extremely low summer ice condition in the Beaufort Sea may appear more frequently.
-
Key words:
- Beaufort Sea /
- sea ice area /
- abnormal year /
- mechanism analysis
-
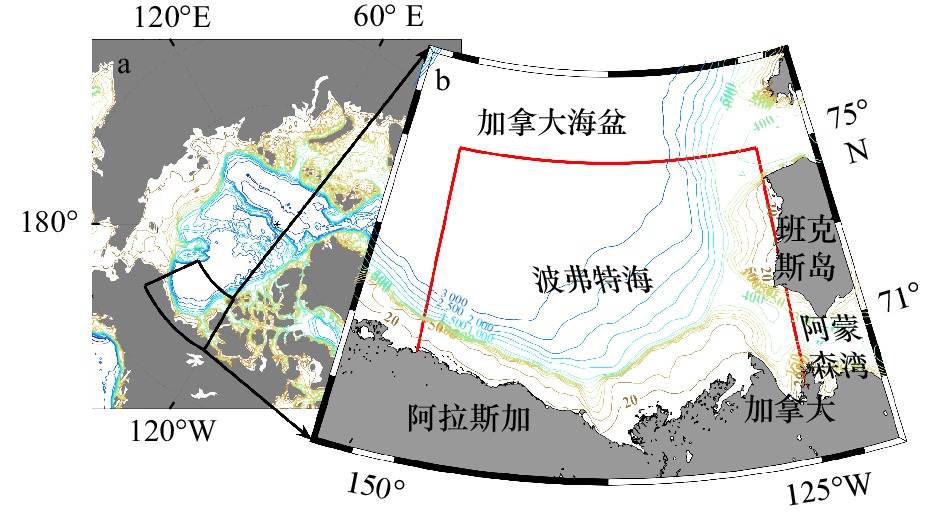
图 1 研究区域
红色粗实线为波弗特海范围(125º~150ºW, 75ºN以南),彩色背景线为等深线
Fig. 1 Study area
The bold solid red line represents the cover of Beaufort Sea (125º−150ºW and south of 75ºN),the colored background lines are isobath lines

图 2 1979–2020年波弗特海融冰季海冰覆盖面积年际变化
Fig. 2 Inter-annual variation of sea ice cover in the melt season of Beaufort Sea during 1979–2020

图 3 1998–2019年多年平均以及2019年融冰季海冰密集度
a–e为1998–2019年平均;f–j为2019年;k–o为2019年与1998–2019年平均之间的差异;黑色粗实线为图1b中波弗特海区域
Fig. 3 Sea ice concentration in the melt season of multi-year average of 1998–2019 and 2019
a–e are the average of 1998–2019; f–j are the 2019, and k–o are the difference between 2019 and 1998–2019; the bold black line represents the cover of Beaufort Sea in Fig. 1b

图 4 1998–2019年多年平均以及2019年前秋、前冬、融冰季海冰密集度
a–c为1998–2019年平均;d–f为2019年平均;g–i为2019年与1998–2019年平均之间的差异;黑色粗实线为图1b中波弗特海区域
Fig. 4 Sea ice concentration in the preceding fall, preceding winter, melt season of multi-year average of 1998–2019 and 2019
a–c are the average of 1998–2019; d–f are the 2019, and g–i are the difference of 2019 and 1998–2019; the bold black line represents the cover of Beaufort Sea in Fig. 1b

图 5 1998–2019年前秋(a)、前冬(b)以及融冰季节(c)内海冰面积总变化量(ΔSIAtotal)、动力输出贡献(ΔSIAdynamic)和热力融化贡献(ΔSIAthermal)
Fig. 5 Total variation (ΔSIAtotal), dynamic contribution (ΔSIAdynamic), and thermal contribution (ΔSIAthermal) of sea ice area in the preceding fall (a), preceding winter (b), melt season (c) of 1998–2019

图 6 1998–2019年5月海冰面积收支(a)以及2019年5月海冰面积总变化量(ΔSIAtotal)(b)、动力输出贡献(ΔSIAdynamic)(c)、热力融化贡献(ΔSIAthermal)(d)日均累积量
Fig. 6 Sea ice area budget in the May of 1998–2019 (a) and cumulative of the total variation of sea ice area (ΔSIAtotal) (b), dynamic contribution (ΔSIAdynamic) (c), and thermal contribution (ΔSIAthermal) (d) in May of 2019
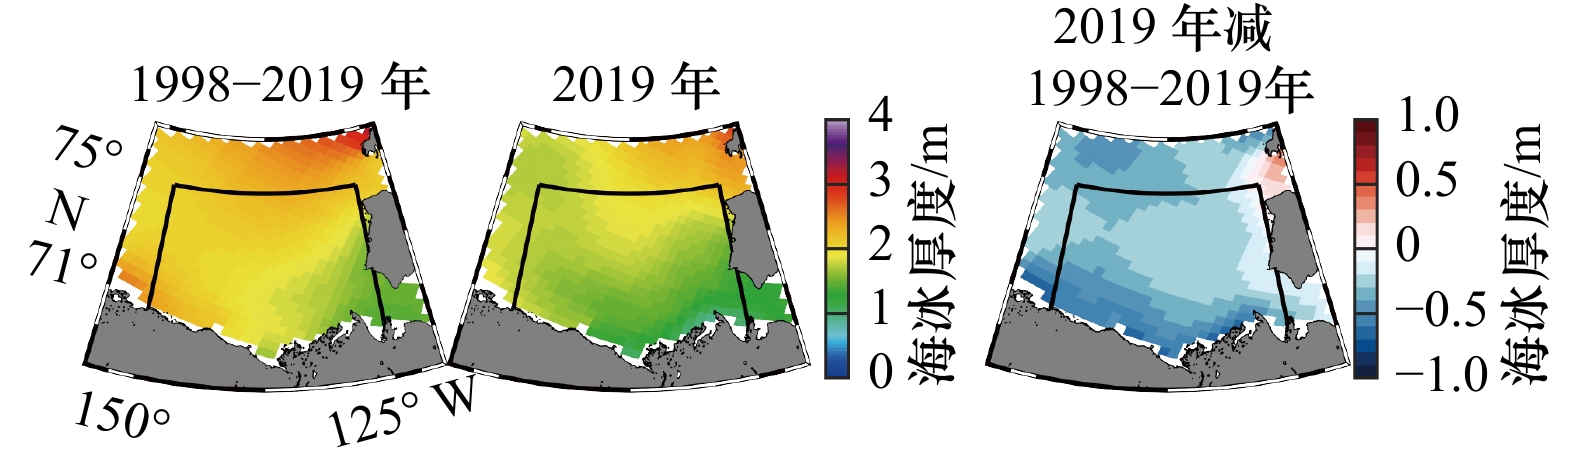

图 8 波弗特海2019年5月10 m风场、逐日海冰面积减少量(a)、海表面净热通量(b)、短波辐射吸收量(c)和1998–2019年5月累积短波辐射和长波辐射年际变化(d)
Fig. 8 10 m wind field and daily decrease of sea ice area (a), net sea surface heat flux (b), and solar absorption (c) over the Beaufort Sea in May of 2019, and inter-annual variation of cumulative solar radiation and thermal radiation in May during 1998–2019 (d)
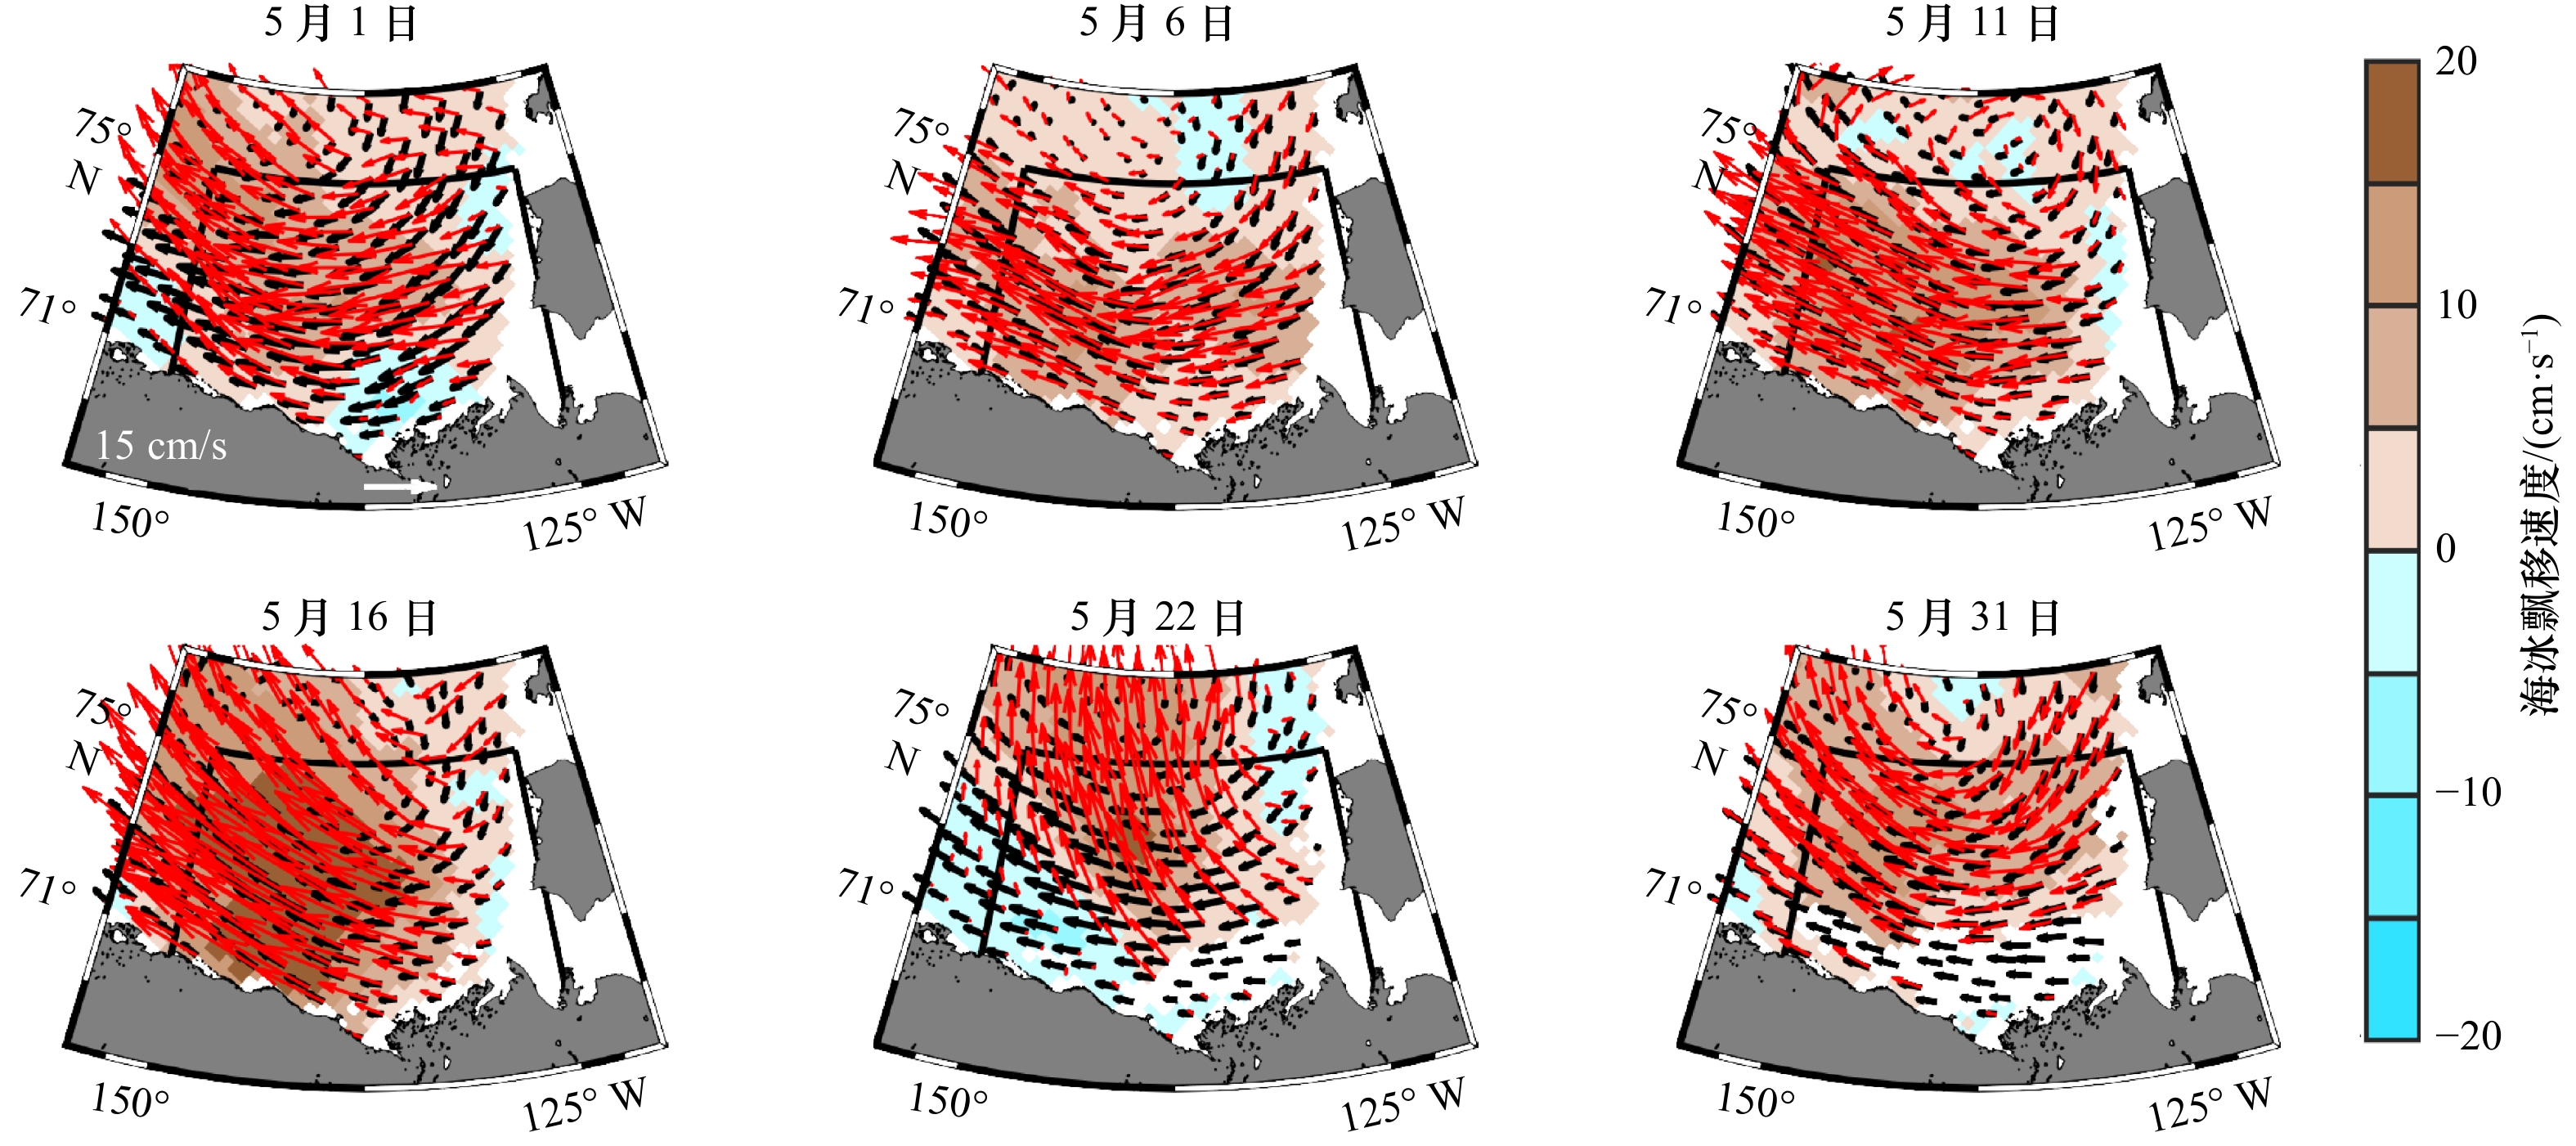
图 9 5月海冰漂移场
黑色箭头为1998–2019年平均,红色箭头为2019年,底色为2019年与多年平均之间的差异;黑色粗实线为图1b中波弗特海区域
Fig. 9 The spatial distribution of sea ice drift in May
The black arrows represent the average for 1998–2019, the red represent the 2019, and the color shading shows the difference between 2019 and 1998–2019; the bold black line represents the cover of Beaufort Sea in Fig. 1b
表 1 2019年前秋、前冬以及融冰季节北边界、西边界面积通量及计算误差(括号内为误差)
Tab. 1 Ice transport and the uncertainty across the northern and western gates of 2019 in the preceding fall, preceding winter and melt season (the uncertainty is in brackets)
北边界 西边界 前秋面积/(104 km2) 12.69(0.72) –24.40(0.95) 前冬面积/(104 km2) 5.41(0.68) –27.25(0.82) 融冰季面积/(104 km2) 14.63(0.76) –14.07(1.08)  下载: 导出CSV
表 2 2019年5月海冰面积收支
Tab. 2 Sea ice area budget in May of 2019
1–31日 1–15日 16–31日 总量/(104 km2) –23.31(–7.03) –8.01(–2.31) –15.30(–4.72) 动力贡献/(104 km2) –7.95(–2.79) –4.91(–1.01) –3.03(–1.78) 热力贡献/(104 km2) –15.36(–4.23) –3.10(–1.29) –12.27(–2.94) 注:括号内为1998–2019年平均。
下载: 导出CSV
-
[1] Lu Xiaomei, Hu Yongxiang, Liu Zhaoyan, et al. Observations of Arctic snow and sea ice cover from CALIOP lidar measurements[J]. Remote Sensing of Environment, 2017, 194: 248−263. doi: 10.1016/j.rse.2017.03.046 [2] Onarheim I H, Eldevik T, Smedsrud L H, et al. Seasonal and regional manifestation of Arctic sea ice loss[J]. Journal of Climate, 2018, 31(12): 4917−4932. doi: 10.1175/JCLI-D-17-0427.1 [3] Wang Yunhe, Bi Haibo, Huang Hanxia, et al. Satellite-observed trends in the Arctic sea ice concentration for the period 1979–2016[J]. Journal of Oceanology and Limnology, 2019, 37(1): 18−37. doi: 10.1007/s00343-019-7284-0 [4] Boeke R C, Taylor P C. Seasonal energy exchange in sea ice retreat regions contributes to differences in projected Arctic warming[J]. Nature Communications, 2018, 9(1): 5017. doi: 10.1038/s41467-018-07061-9 [5] Nadaï G, Nöthig E M, Fortier L, et al. Early snowmelt and sea ice breakup enhance algal export in the Beaufort Sea[J]. Progress in Oceanography, 2021, 190: 102479. doi: 10.1016/j.pocean.2020.102479 [6] Kwok R, Cunningham G F. Contribution of melt in the Beaufort Sea to the decline in Arctic multiyear sea ice coverage: 1993–2009[J]. Geophysical Research Letters, 2010, 37(20): L20501. [7] Wang Qiang, Wekerle C, Danilov S, et al. Arctic sea ice decline significantly contributed to the unprecedented liquid freshwater accumulation in the Beaufort gyre of the Arctic Ocean[J]. Geophysical Research Letters, 2018, 45(10): 4956−4964. doi: 10.1029/2018GL077901 [8] 胡晓芳, 蔡敬标. 北极航道航行船舶操纵性设计需求分析[J]. 中国舰船研究, 2015, 10(3): 37−44. doi: 10.3969/j.issn.1673-3185.2015.03.007Hu Xiaofang, Cai Jingbiao. Analysis on the requirement of maneuverability for ships navigating through Arctic passage[J]. Chinese Journal of Ship Research, 2015, 10(3): 37−44. doi: 10.3969/j.issn.1673-3185.2015.03.007 [9] Galley R J, Key E, Barber D G, et al. Spatial and temporal variability of sea ice in the southern Beaufort Sea and Amundsen Gulf: 1980–2004[J]. Journal of Geophysical Research: Oceans, 2008, 113(C5): C05S95. [10] Maslanik J, Stroeve J, Fowler C, et al. Distribution and trends in Arctic sea ice age through spring 2011[J]. Geophysical Research Letters, 2011, 38(13): L13502. [11] Galley R J, Babb D, Ogi M, et al. Replacement of multiyear sea ice and changes in the open water season duration in the Beaufort Sea since 2004[J]. Journal of Geophysical Research: Oceans, 2016, 121(3): 1806−1823. doi: 10.1002/2015JC011583 [12] Kwok R, Rothrock D A. Decline in Arctic sea ice thickness from submarine and ICESat records: 1958–2008[J]. Geophysical Research Letters, 2009, 36(15): L15501. [13] Galley R J, Else B G T, Prinsenberg S J, et al. Summer sea ice concentration, motion, and thickness near areas of proposed offshore oil and gas development in the Canadian Beaufort Sea–2009[J]. Arctic, 2013, 66(1): 105−116. [14] Stroeve J C, Serreze M C, Fetterer F, et al. Tracking the Arctic's shrinking ice cover: another extreme September minimum in 2004[J]. Geophysical Research Letters, 2005, 32(4): L04501. [15] Maslanik J A, Fowler C, Stroeve J, et al. A younger, thinner Arctic ice cover: increased potential for rapid, extensive sea-ice loss[J]. Geophysical Research Letters, 2007, 34(24): L24501. doi: 10.1029/2007GL032043 [16] Hutchings J K, Rigor I G. Role of ice dynamics in anomalous ice conditions in the Beaufort Sea during 2006 and 2007[J]. Journal of Geophysical Research: Oceans, 2012, 117(C8): C00E04. [17] Maslanik J A, Serreze M C, Agnew T. On the record reduction in 1998 western Arctic sea-ice cover[J]. Geophysical Research Letters, 1999, 26(13): 1905−1908. doi: 10.1029/1999GL900426 [18] Perovich D K, Richter-Menge J A, Jones K F, et al. Arctic sea-ice melt in 2008 and the role of solar heating[J]. Annals of Glaciology, 2011, 52(57): 355−359. doi: 10.3189/172756411795931714 [19] Babb D G, Galley R J, Barber D G, et al. Physical processes contributing to an ice free Beaufort Sea during September 2012[J]. Journal of Geophysical Research: Oceans, 2016, 121(1): 267−283. doi: 10.1002/2015JC010756 [20] Babb D G, Landy J C, Barber D G, et al. Winter sea ice export from the Beaufort Sea as a preconditioning mechanism for enhanced summer melt: a case study of 2016[J]. Journal of Geophysical Research: Oceans, 2019, 124(9): 6575−6600. doi: 10.1029/2019JC015053 [21] Zhang Yongli, Wei Hao, Lu Youyu, et al. Dependence of Beaufort Sea low ice condition in the summer of 1998 on ice export in the prior winter[J]. Journal of Climate, 2020, 33(21): 9247−9259. doi: 10.1175/JCLI-D-19-0943.1 [22] Rigor I G, Wallace J M. Variations in the age of Arctic sea-ice and summer sea-ice extent[J]. Geophysical Research Letters, 2004, 31(9): L09401. [23] Perovich D K, Richter-Menge J A, Jones K F, et al. Sunlight, water, and ice: extreme Arctic sea ice melt during the summer of 2007[J]. Geophysical Research Letters, 2008, 35(11): L11501. doi: 10.1029/2008GL034007 [24] Steele M, Zhang Jinlun, Ermold W. Mechanisms of summertime upper Arctic Ocean warming and the effect on sea ice melt[J]. Journal of Geophysical Research: Oceans, 2010, 115(C11): C11004. doi: 10.1029/2009JC005849 [25] Simmonds I, Rudeva I. The great Arctic cyclone of August 2012[J]. Geophysical Research Letters, 2012, 39(23): L23709. [26] Parkinson C L, Comiso J C. On the 2012 record low Arctic sea ice cover: combined impact of preconditioning and an August storm[J]. Geophysical Research Letters, 2013, 40(7): 1356−1361. doi: 10.1002/grl.50349 [27] Cavalieri D J, Parkinson C L, Gloersen P, et al. Sea ice concentrations from nimbus-7 SMMR and DMSP SSM/I-SSMIS passive microwave data, version 1[R]. Boulder, Colorado USA: NASA National Snow and Ice Data Center Distributed Active Archive Center, 1996. [28] Tschudi M, Meier W N, Stewart J S, et al. Polar pathfinder daily 25 km EASE-Grid sea ice motion vectors, version 4[R]. Boulder, Colorado USA: NASA National Snow and Ice Data Center Distributed Active Archive Center, 2019. [29] Zhang Jinlun, Rothrock D A. Modeling global sea ice with a thickness and enthalpy distribution model in generalized curvilinear coordinates[J]. Monthly Weather Review, 2003, 131(5): 845−861. doi: 10.1175/1520-0493(2003)131<0845:MGSIWA>2.0.CO;2 [30] Schweiger A, Lindsay R, Zhang Jinlun, et al. Uncertainty in modeled Arctic sea ice volume[J]. Journal of Geophysical Research: Oceans, 2011, 116(C8): C00D06. [31] Laxon S W, Giles K A, Ridout A L, et al. CryoSat-2 estimates of Arctic sea ice thickness and volume[J]. Geophysical Research Letters, 2013, 40(4): 732−737. doi: 10.1002/grl.50193 [32] 周璐, 徐世明, 曾刚. 20世纪90年代以来北极海冰减少的热动力分析——基于PIOMAS模式结果[J]. 大气科学, 2017, 41(1): 57−70.Zhou Lu, Xu Shiming, Zeng Gang. Dynamic and thermodynamic analysis of arctic sea ice decrease since the 1990s based on PIOMAS simulations[J]. Chinese Journal of Atmospheric Sciences, 2017, 41(1): 57−70. [33] Ogi M, Rigor I G, McPhee M G, et al. Summer retreat of Arctic sea ice: role of summer winds[J]. Geophysical Research Letters, 2008, 35(24): L24701. doi: 10.1029/2008GL035672 [34] Comiso J C, Nishio F. Trends in the sea ice cover using enhanced and compatible AMSR-E, SSM/I, and SMMR data[J]. Journal of Geophysical Research: Oceans, 2008, 113(C2): C02S07. [35] Kwok R. Baffin Bay ice drift and export: 2002–2007[J]. Geophysical Research Letters, 2007, 34(19): L19501. doi: 10.1029/2007GL031204 [36] Lindsay R, Schweiger A. Arctic sea ice thickness loss determined using subsurface, aircraft, and satellite observations[J]. The Cryosphere Discussions, 2014, 8: 4545−4580. [37] Comiso J C. Large decadal decline of the Arctic multiyear ice cover[J]. Journal of Climate, 2012, 25(4): 1176−1193. doi: 10.1175/JCLI-D-11-00113.1 [38] Petty A A, Hutchings J K, Richter-Menge J A, et al. Sea ice circulation around the Beaufort Gyre: the changing role of wind forcing and the sea ice state[J]. Journal of Geophysical Research: Oceans, 2016, 121(5): 3278−3296. doi: 10.1002/2015JC010903 [39] Howell S E L, Brady M, Derksen C, et al. Recent changes in sea ice area flux through the Beaufort Sea during the summer[J]. Journal of Geophysical Research: Oceans, 2016, 121(4): 2659−2672. doi: 10.1002/2015JC011464 [40] 赵进平, 史久新, 王召民, 等. 北极海冰减退引起的北极放大机理与全球气候效应[J]. 地球科学进展, 2015, 30(9): 985−995.Zhao Jinping, Shi Jiuxin, Wang Zhaomin, et al. Arctic amplification produced by sea ice retreat and its global climate effects[J]. Advances in Earth Science, 2015, 30(9): 985−995. [41] Stroeve J C, Markus T, Boisvert L, et al. Changes in Arctic melt season and implications for sea ice loss[J]. Geophysical Research Letters, 2014, 41(4): 1216−1225. doi: 10.1002/2013GL058951 [42] 杨毅, 聂红涛, 董春明, 等. 基于海冰密集度的消退起始时间判别方法改进研究与应用[J]. 海洋学报, 2021, 43(7): 152−161.Yang Yi, Nie Hongtao, Dong Chunming, et al. Improved estimation method of retreat onset dates based on sea ice concentration[J]. Haiyang Xuebao, 2021, 43(7): 152−161. -

计量
- 文章访问数: 664
- HTML全文浏览量: 278
- PDF下载量: 63
- 被引次数: 0
