

Dating the age of surficial snow in the Arctic Ocean by 210Po-210Pb activity disequilibria
-
摘要: 远离河流和大陆的北冰洋冰区,大气沉降是210Po、210Bi、210Pb和7Be核素等最重要的来源。降雪一旦形成即被标记具有特定的210Po/210Pb活度比值,并降落到海冰表面,进入封闭状态。在封闭体系的冰雪中,随着时间推移,210Po从相对于210Pb强烈亏损的状态逐渐达到210Po-210Pb平衡状态。因此可以通过分析北冰洋表层冰雪中210Po-210Pb活度不平衡特征,量化冰区表层冰雪的表观年龄。本文搜集整理了北极地区气溶胶的210Po/210Pb活度比值,结合2018年中国第9次北极科学考察航次和2015年美国GEOTRACES 北冰洋航次中若干冰站表层冰雪的210Po/210Pb活度比特征,估算了北冰洋表层冰雪的表观年龄。结果表明,2018年中国冰站采集的表层冰雪年龄变化范围为106~272 d,远大于2015年美国冰站采集的表层冰雪的年龄;而两国冰站表层冰雪的年龄都呈现一定的纬度效应,即随着采样站位越靠近北极点,总体上表层冰雪的年龄呈现越来越大的特点,表明北极冰区表层冰雪越靠近北极点,表层冰雪被保留的时间会越长。210Po-210Pb 活度不平衡定年法可以作为一种评估北冰洋冰雪年龄的方法并与遥感技术协同使用。
-
关键词:
- 210Po-210Pb活度不平衡 /
- 定年 /
- 冰雪年龄 /
- 北冰洋
Abstract: Atmospheric deposition is the most important source for 210Po, 210Bi, 210Pb and 7Be radionuclides in the Arctic sea ice regions far away from the influence of rivers and continents. Once the precipitation or snow forms in the Arctic, the falling snow underneath the cloud would be tagged with the specific 210Po/210Pb activity ratio and be locked into a closed environment; as time elapses, this ratio in snow increases to equilibrium state of 210Po-210Pb due to 210Po ingrowth from the decay of 210Pb. From the measured 210Po/210Pb activity disequilibria in the surficial snow of the Arctic Ocean, its age can be constrained. Here, this research compiled the 210Po/210Pb activity ratio of aerosol in the Arctic region as the initial ratio for dating snow. The apparent ages of surficial snow in the Arctic Ocean were estimated based on the measured 210Po/210Pb activity ratio in the surficial snow from the ice stations during the Chinese Ninth Arctic cruise in 2018 and the US GEOTRACES Arctic cruise in 2015. The results showed that the age of snow collected by Chinese ice stations in 2018 ranged from 106 d to 272 d, which was much older than that of snow collected by US ice stations in 2015. The ages of surficial snow showed an obvious latitude effect for both two cruises, indicating that the closer the surficial snow in the Arctic was to the North Pole, the older the snow was. 210Po-210Pb activity disequilibrium can be used as an effective dating tool combined with passive microwave satellite remote sensing technology to constrain the age of ice/snow in the polar region.-
Key words:
- 210Po-210Pb activity disequilibria /
- dating /
- age of snow /
- Arctic Ocean
-
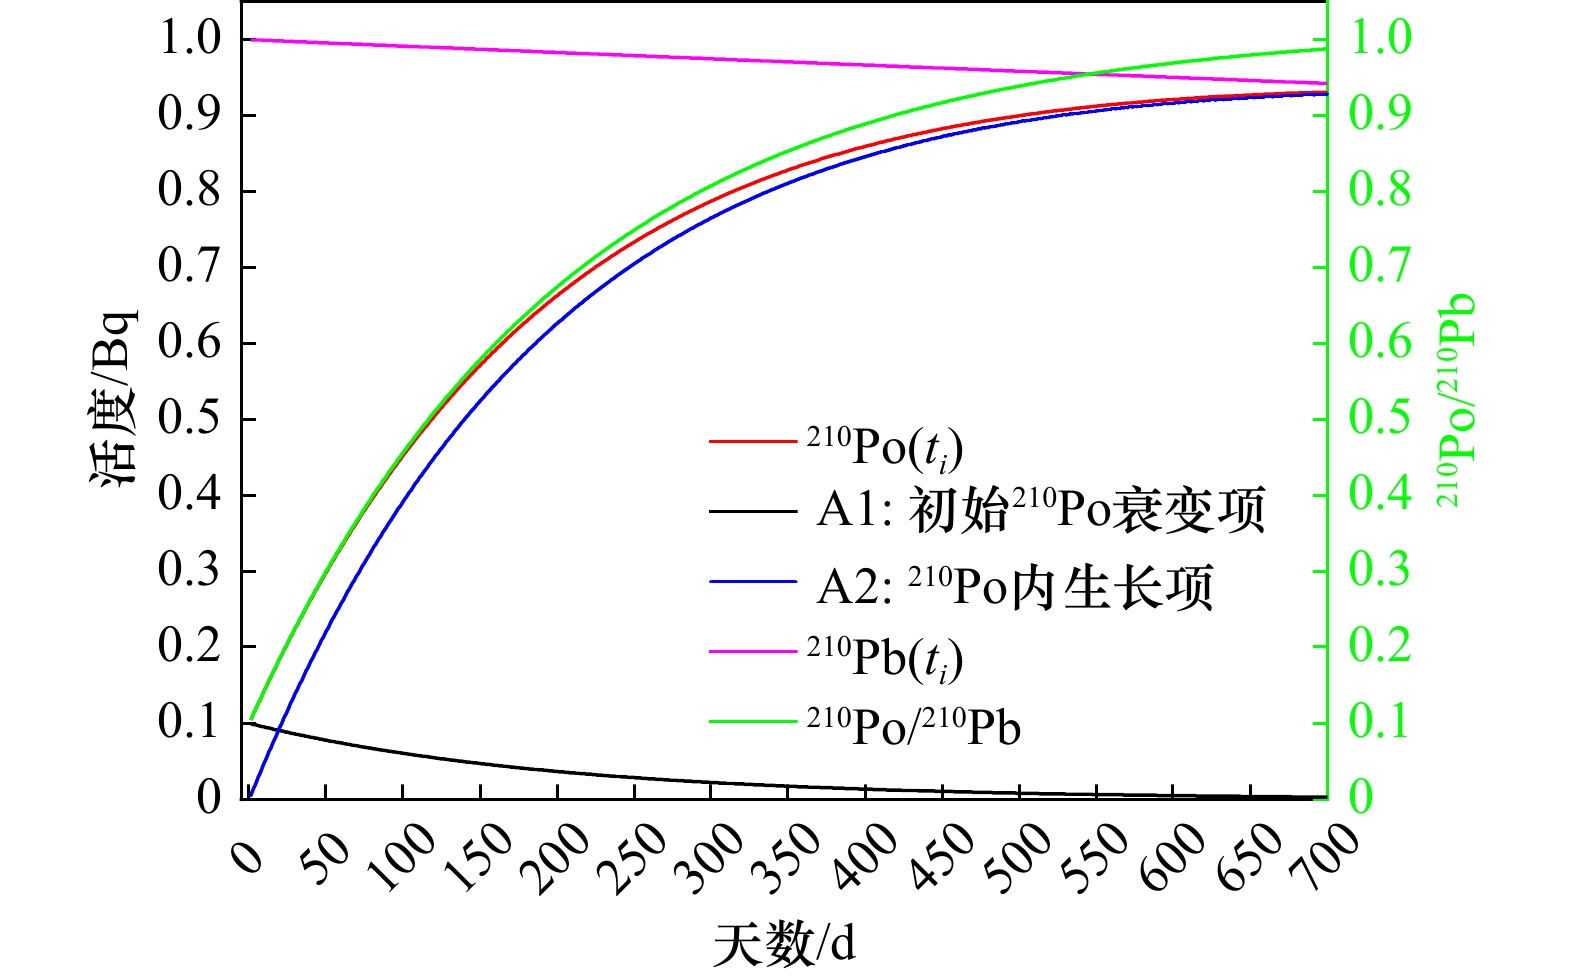
图 1 210Po/210Pb活度比随时间的理论变化曲线
假设条件为:210Po的初始活度为0.1 Bq,210Pb的初始活度为1 Bq。210Po由两部分构成,一部分是初始时刻210Po随时间衰变后剩余的部分(A1),另一部分是母体210Pb衰变内生长生产的210Po(A2)。图中红线、粉线和绿线分别代表任意时刻210Po、210Pb和210Po/210Pb活度比随时间的变化关系。黑线A1代表初始210Po的衰变曲线,蓝线A2代表210Po的内生长曲线
Fig. 1 Theoretical curve of 210Po/210Pb activity ratio versus time
Assumption: the initial activity of 210Po is 0.1 Bq and the initial activity of 210Pb is 1 Bq. 210Po is composed of two parts, one is the remaining part (A1) after the decay of 210Po, and the other part is the ingrowth of 210Po from 210Pb decay. The red line, pink line, and green line represent the change curves of 210Po, 210Pb, and 210Po/210Pb activity ratio, respectively. The black A1 line denotes the decay curve of initial 210Po and the bule A2 line denotes the ingrowth curve of 210Po from 210Pb decay
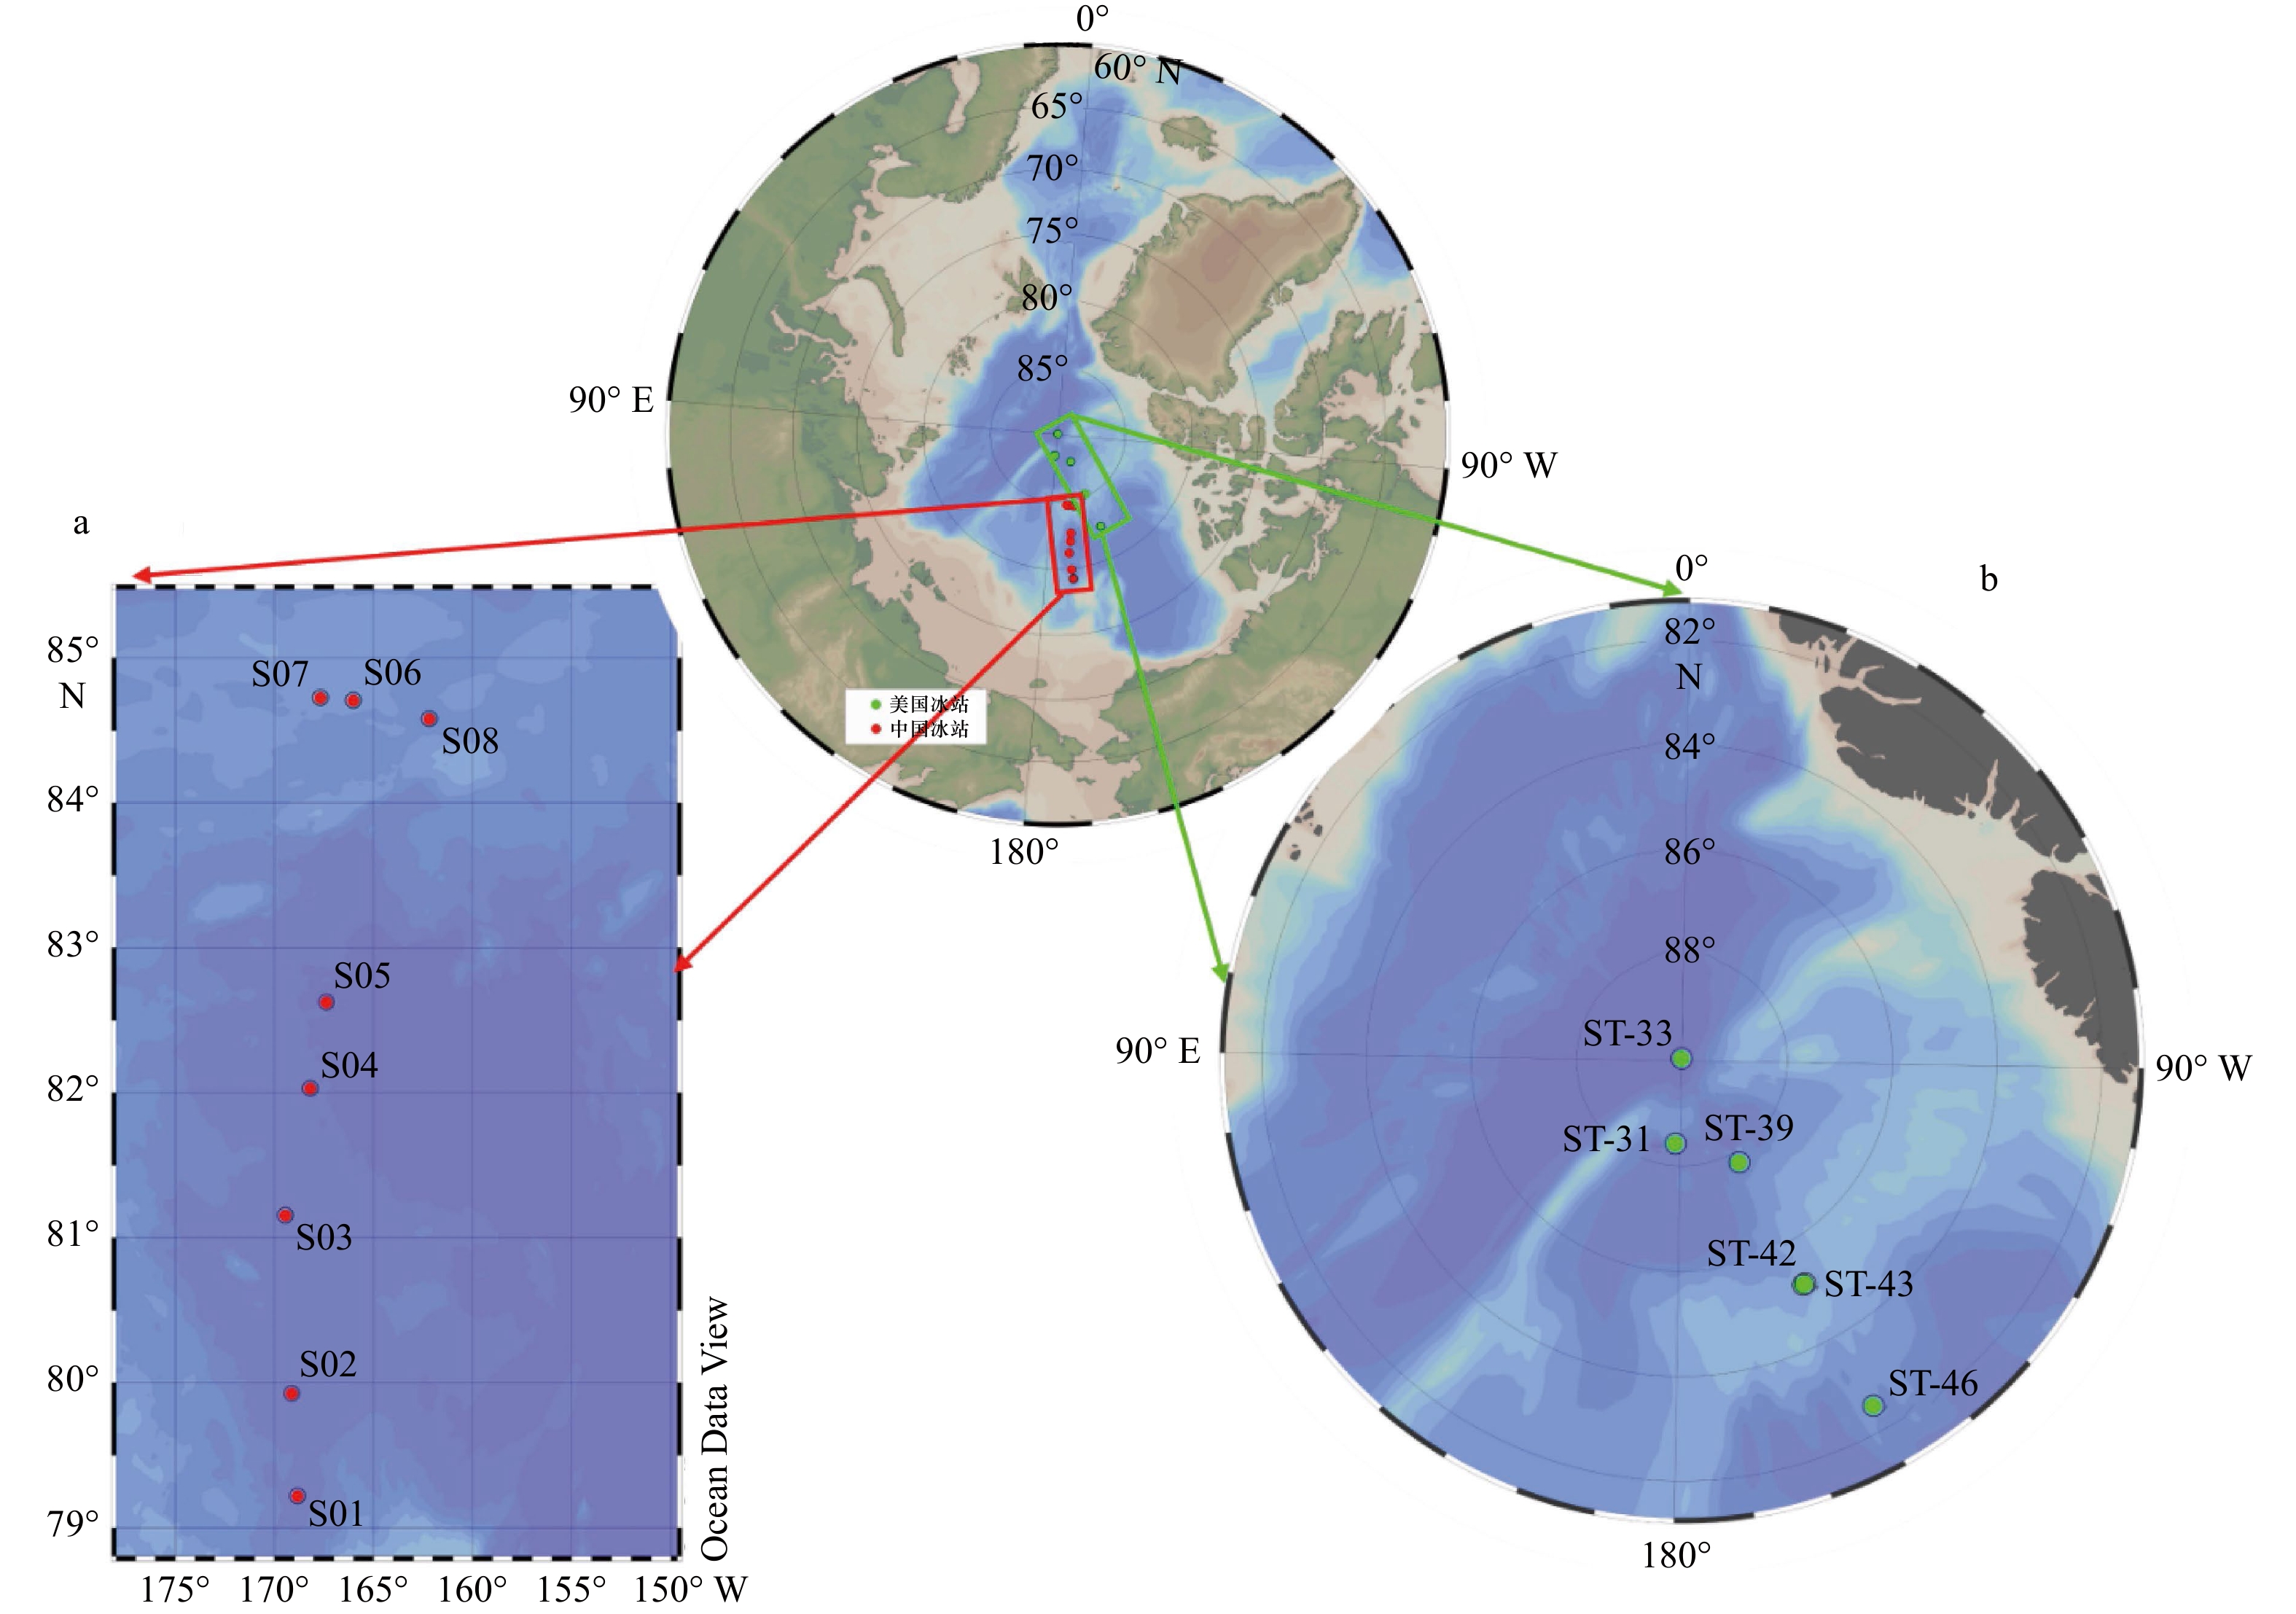
图 2 2018年中国第9次北极科考航次(a)和2015年美国GEOTRACES北冰洋航次(b)在冰区的表层冰雪采样站位
Fig. 2 Sampling stations of surficial snow in the Arctic Ocean by the Chinese Ninth Arctic cruise in 2018 (a) and the US GEOTRACES Arctic cruise in 2015 (b)
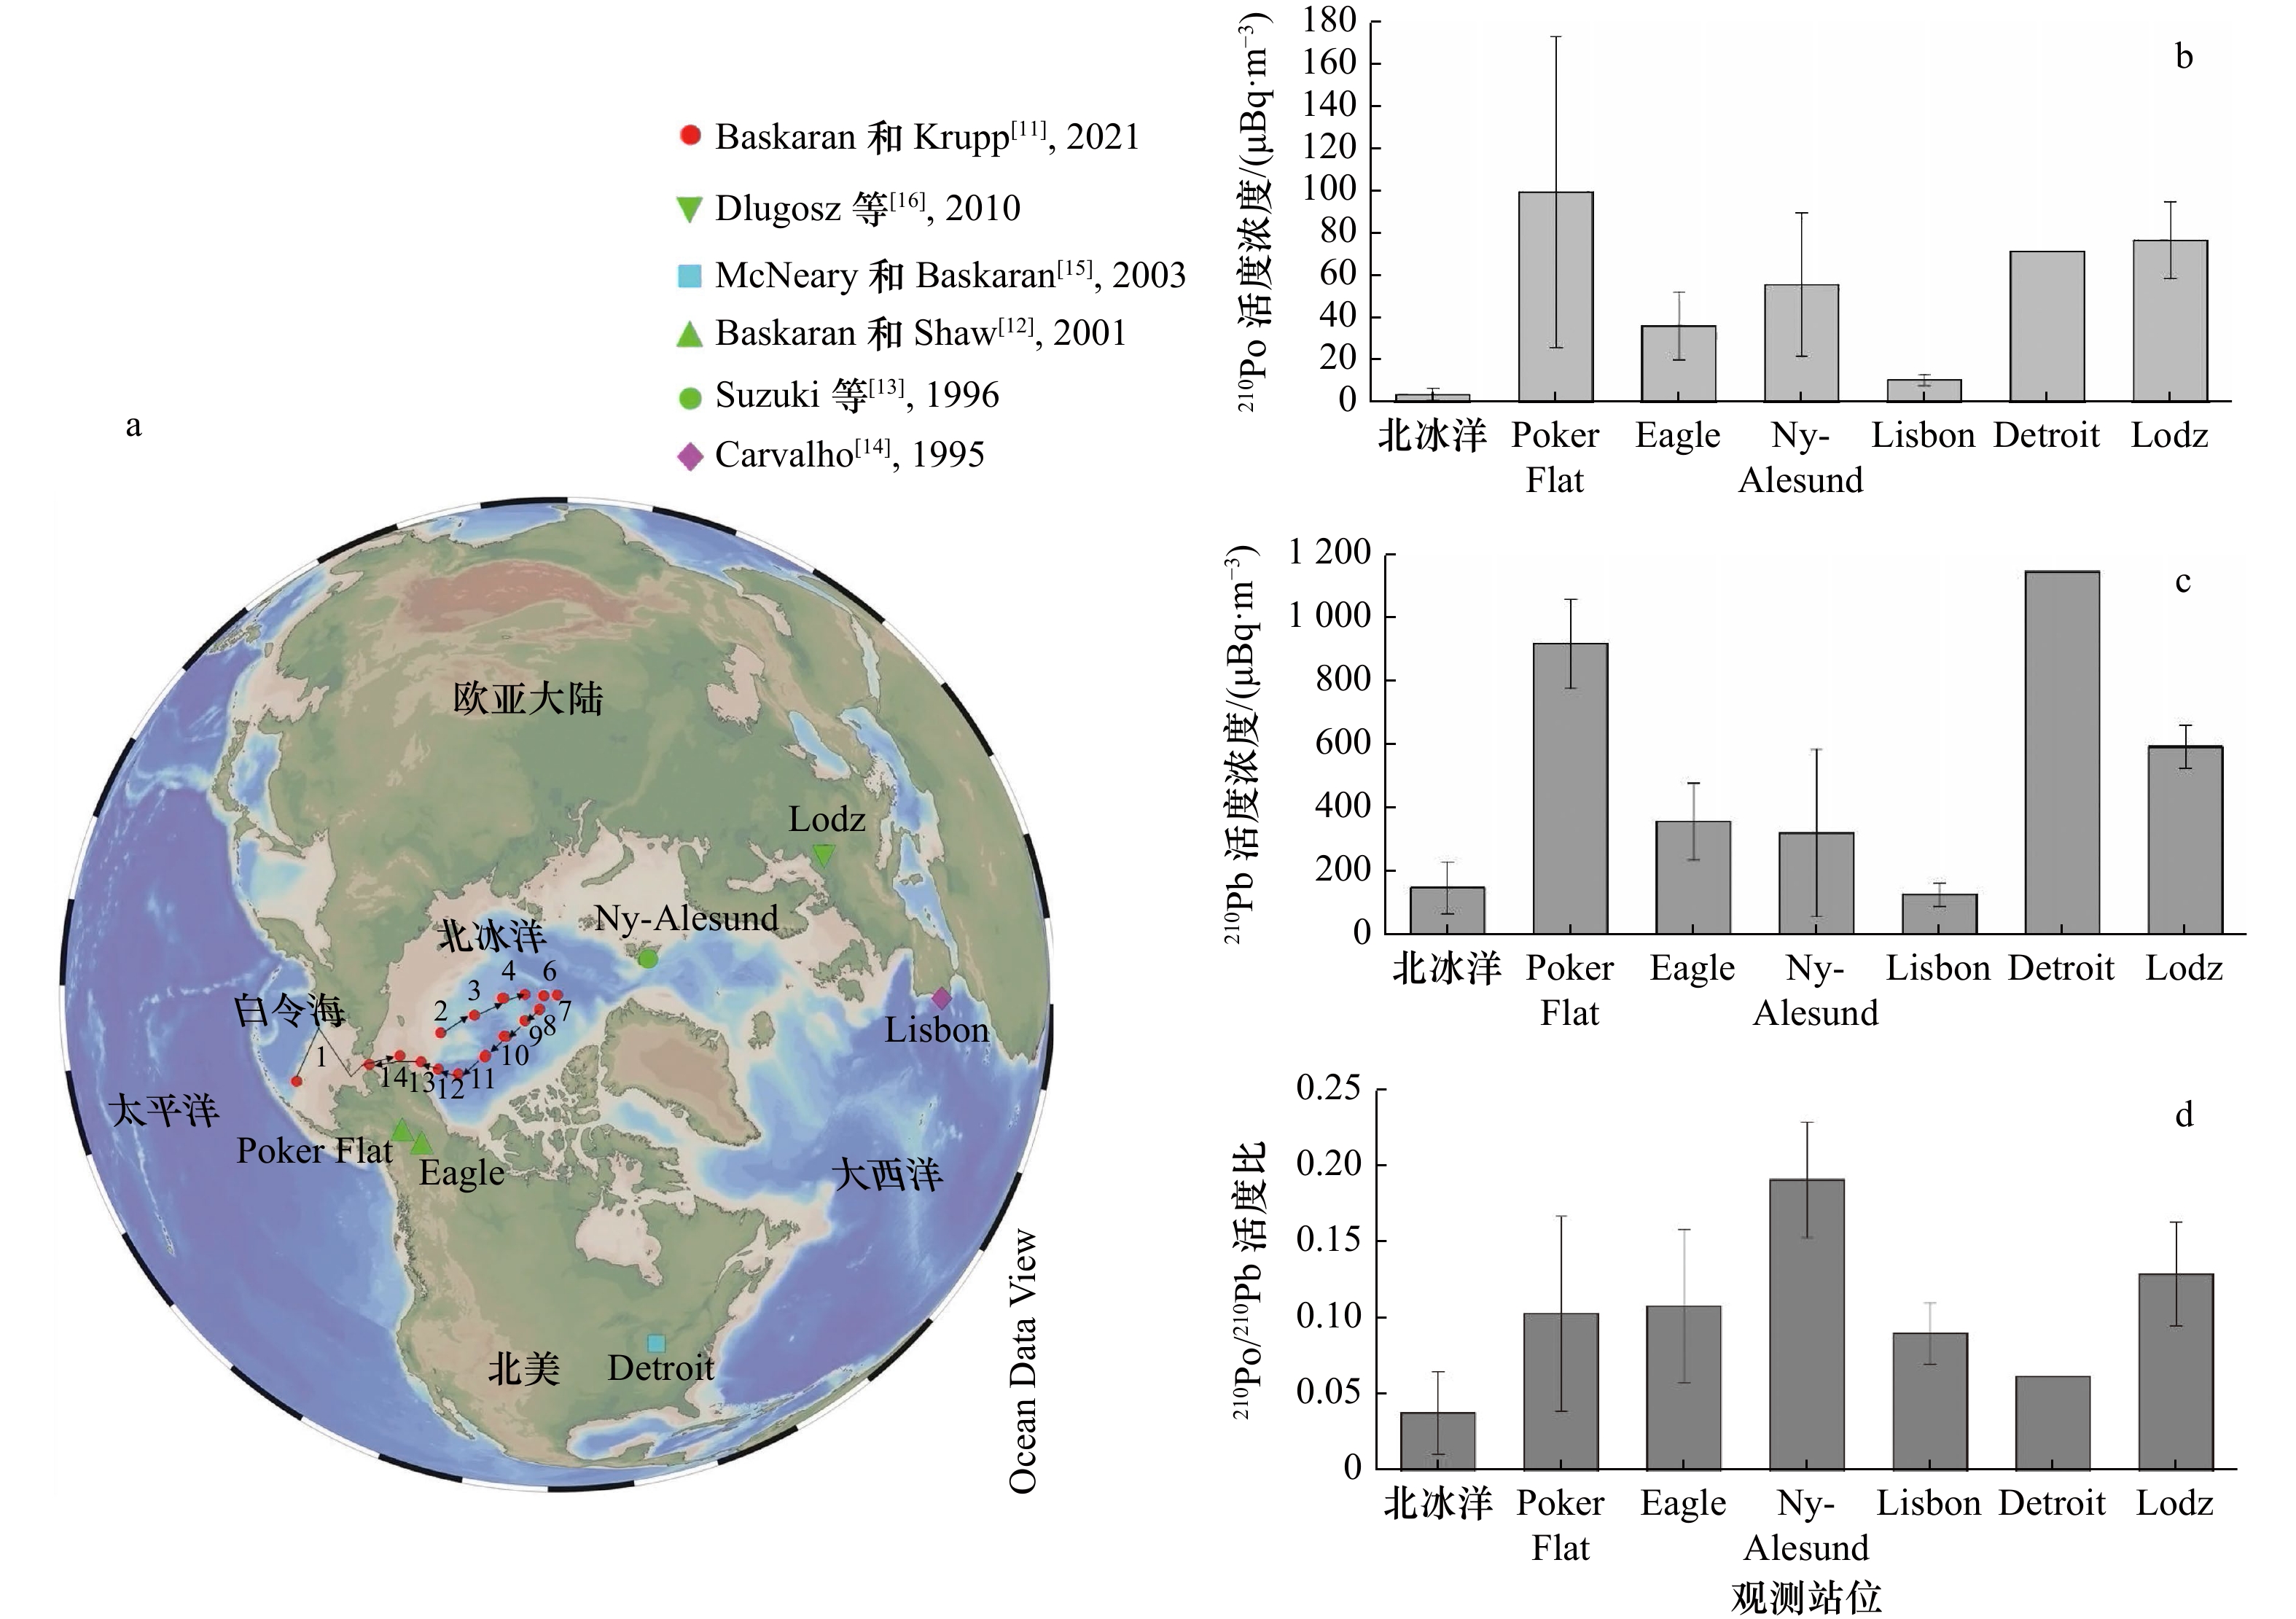
图 3 北极地区表层大气气溶胶观测站位(a)以及各站位气溶胶的210Po活度浓度(b)、210Pb活度浓度(c)和210Po/210Pb活度比(d)
Fig. 3 Spatial distribution of aerosol observation stations (a), 210Po activity concentration (b), 210Pb activity concentration (c) and 210Po/210Pb activity ratio (d) in the lower atmosphere over the Arctic region

图 4 北冰洋表层冰雪210Po活度、210Pb活度和210Po/210Pb活度比随纬度的变化关系
Fig. 4 Variations of 210Po activity, 210Pb activity, and 210Po/210Pb activity ratio with latitude in the surficial snow of Arctic Ocean

图 5 北冰洋表层冰雪表观年龄的空间分布(单位:d)
a. 2018年中国“九北”科考航次冰站;b. 2015年美国GEOTRACES北冰洋航次冰站
Fig. 5 Spatial distribution of age of snow in the Arctic Ocean (unit: d)
a. Ice stations during the Chinese Ninth Arctic cruise in 2018; b. ice stations during the US GEOTRACES Arctic cruise in 2015
表 1 2018年中国第9次北极科考航次和2015年美国GEOTRACES北冰洋航次表层冰雪中210Po活度、210Pb活度和210Po/210Pb活度比汇编
Tab. 1 Compilation of 210Po activity, 210Pb activity and 210Po/210Pb activity ratio in the surficial snow of the Arctic Ocean from the 2018 Chinese Ninth Arctic cruise and the 2015 US GEOTRACES Arctic cruise
站位名 采样时间 纬度 经度 雪融化后的
体积/L冰雪融化
后的盐度210Po活度浓度/
(mBq·kg−1)210Pb活度浓度/
(mBq·kg−1)210Po/210Pb
活度比参考文献 2018年中国第9次北极科学考察航次 文献[10] S01 2018年8月10日 79.22°N 168.83°W 26 0 55.3±2.6 79.0±5.2 0.70±0.06 S02 2018年8月12日 79.93°N 169.11°W 27 0 49.1±2.1 62.8±3.7 0.78±0.06 S03 2018年8月13日 81.16°N 169.44°W 40 0.2 36.2±1.8 30.9±2.1 1.17±0.10 S04 2018年8月14日 82.03°N 168.19°W 17 0.5 72.6±4.1 49.1±3.7 1.48±0.14 S05 2018年8月14日 82.62°N 167.36°W 32 0 87.5±3.5 194±7 0.45±0.02 S06 2018年8月20日 84.71°N 166.01°W 39 0.1 64.7±3.0 84.2±5.4 0.77±0.06 S07 2018年8月21日 84.72°N 167.67°W 24 0.2 87.1±3.8 64.5±4.4 1.35±0.11 S08 2018年8月23日 84.58°N 162.17°W 23 0 63.1±3.0 83.9±5.3 0.75±0.06 2015年美国GEOTRACES北冰洋航次 文献[11] ST-31 2015年9月2日 88.42°N 176.67°E 11.6 0.2 53.8±1.2 232±9 0.20±0.01 ST-33 2015年9月4日 89.96°N 3.53°E 14.5 0.6 21.2±0.5 145±5 0.13±0.01 ST-39 2015年9月8日 87.78°N 149.61°W 17.5 0.1 1.03±0.03 26.3±0.8 0.032±0.001 ST-42 2015年9月11日 85.16°N 150.54°W 9.8 0.7 5.13±0.15 39.7±1.3 0.11±0.01 ST-43 2015年9月13日 85.16°N 150.00°W 17.5 0.2 6.10±0.17 92.2±3.2 0.063±0.003 ST-46 2015年9月16日 82.49°N 149.93°W 18.25 0.1 1.64±0.06 78.2±3.0 0.021±0.001  下载: 导出CSV
表 2 北极地区表层大气气溶胶中210Po活度、210Pb活度及210Po/210Pb活度比的数据汇总
Tab. 2 Summary of 210Po activity, 210Pb activity and 210Po/210Pb activity ratio in aerosols of the lower atmosphere over the Arctic regions
站位名 观测时间 纬度 经度 210Po活度/
(μBq·m−3)210Pb活度/
(μBq·m−3)210Po/
210Pb活度比参考文献 起点 终点 起点 终点 北冰洋-1 2015年8月10–17日 56.074°N 69.926°N 170.509°W 167.688°W 0.7±0.1 9.3±0.5 0.075±0.007 文献[11] 北冰洋-2 2015年8月20–23日 75.566°N 79.997°N 170.75°W 174.953°W 3.8±0.2 70.0±1.7 0.055±0.003 北冰洋-3 2015年8月23–27日 80.001°N 83.572°N 174.953°W 174.731°E 5.5±0.3 105±5 0.052±0.004 北冰洋-4 2015年8月27–30日 83.757°N 86.244°N 175.043°E 170.654°E 8.2±0.7 107±3 0.077±0.007 北冰洋-6 2015年9月4–8日 88.408°N 89.945°N 176.752°E 97.848°W 4.8±0.3 105±3 0.046±0.003 北冰洋-7 2015年9月8–12日 89.941°N 87.352°N 104.19°W 149.43°W 2.0±0.2 105±3 0.019±0.002 北冰洋-8 2015年9月12–16日 87.27°N 85.145°N 149.044°W 149.855°W 0.17±0.02 56.7±3.3 0.002 9±0.000 3 北冰洋-9 2015年9月17–20日 85.163°N 82.259°N 150.395°W 149.377°W 0.07±0.05 71.7±3.3 0.000 9±0.000 7 北冰洋-10 2015年9月21–26日 82.101°N 78.974°N 150.811°W 148.501°W 1.4±0.1 100±3 0.014±0.001 北冰洋-11 2015年9月26–29日 78.804°N 75.047°N 148.093°W 150.176°W 5.8±0.5 358±30 0.016±0.002 北冰洋-12 2015年9月29日至10月3日 75.06°N 73.426°N 150.215°W 156.793°W 4.7±0.3 125±5 0.037±0.003 北冰洋-13 2015年10月3–7日 73.397°N 71.998°N 156.766°W 162.562°W 5.2±0.3 158±7 0.033±0.003 北冰洋-14 2015年10月7–9日 72.004°N 65.95°N 162.56°W 168.449°W 9.2±0.7 127±8 0.072±0.007 北冰洋平均值 4.0±2.9#(n=13) 152±82#(n=13) 0.038±0.027#(n=13) Poker Flat 1996年1月8日至2月26日 65.1°N 147.5°W 99.8±73.5*(n=2) 922±141*(n=2) 0.103±0.064*(n=2) 文献[12] Eagle 1996年1月10日至3月15日 65.9°N 141.2°W 36.5±16.2*(n=6) 361±122*(n=6) 0.108±0.050*(n=6) Ny-Alesund 1995年2–3月 78.93°N 11.87°E 56±34*(n=18) 325±265*(n=18) 0.191±0.038*(n=18) 文献[13] Lisbon 1986–1989年 38.78°N 9.1°W 11.0±2.6*(n=16) 131±37*(n=16) 0.090±0.020*(n=16) 文献[14] Detroit 1999–2001年 42.417°N 83.017°W 71.7(n=30) 1150(n=30) 0.062(n=30) 文献[15] Lodz 2008年10月至2009年7月 51.7833°N 19.4667°E 77±18*(n=38) 597±69*(n=38) 0.129±0.034*(n=38) 文献[16] 注:#表示基于13个北冰洋表层大气气溶胶数据计算的平均值和标准偏差, *代表平均值±标准偏差。
下载: 导出CSV
表 3 基于210Po-210Pb活度不平衡法估算中美两国北冰洋航次表层冰雪年龄
Tab. 3 Estimated age of snow based on the 210Po-210Pb activity disequilibrium for the Chinese and American cruises in the Arctic Ocean
站位名 冰雪年龄/d 参考文献 2018年中国“九北”科考航次 本文 S01 217±63 S02 272±79 S03 / S04 / S05 106±31 S06 262±76 S07 / S08 249±73 2015年美国GEOTRACES北冰洋航次 文献[11] ST-31 34±2 ST-33 20±1 ST-39 / ST-42 15±1 ST-43 4.9±0.6 ST-46 / 注:“/”表示无法计算出结果。
下载: 导出CSV
-
[1] Mundy C J, Ehn J K, Barber D G, et al. Influence of snow cover and algae on the spectral dependence of transmitted irradiance through Arctic landfast first-year sea ice[J]. Journal of Geophysical Research: Oceans, 2007, 112(C3): C03007. [2] Notz D, Marotzke J. Observations reveal external driver for Arctic sea-ice retreat[J]. Geophysical Research Letters, 2012, 39(8): L08502. [3] Kipp L E, Charette M A, Moore W S, et al. Increased fluxes of shelf-derived materials to the central Arctic Ocean[J]. Science Advances, 2018, 4(1): eaao1302. doi: 10.1126/sciadv.aao1302 [4] Grenier M, François R, Soon M, et al. Changes in circulation and particle scavenging in the Amerasian Basin of the Arctic Ocean over the last three decades inferred from the water column distribution of geochemical tracers[J]. Journal of Geophysical Research: Oceans, 2019, 124(12): 9338−9363. doi: 10.1029/2019JC015265 [5] Stroeve J, Notz D. Changing state of Arctic sea ice across all seasons[J]. Environmental Research Letters, 2018, 13(10): 103001. doi: 10.1088/1748-9326/aade56 [6] Moore H E, Poet S E, Martell E A. 222Rn, 210Pb, 210Bi, and 210Po profiles and aerosol residence times versus altitude[J]. Journal of Geophysical Research, 1973, 78(30): 7065−7075. doi: 10.1029/JC078i030p07065 [7] Marley N A, Gaffney J S, Drayton P J, et al. Measurement of 210Pb, 210Po, and 210Bi in size-fractionated atmospheric aerosols: an estimate of fine-aerosol residence times[J]. Aerosol Science and Technology, 2000, 32(6): 569−583. doi: 10.1080/027868200303489 [8] Turekian K K, Nozaki Y, Benninger L K. Geochemistry of atmospheric radon and radon products[J]. Annual Review of Earth and Planetary Sciences, 1977, 5: 227−255. doi: 10.1146/annurev.ea.05.050177.001303 [9] Baskaran M. Po-210 and Pb-210 as atmospheric tracers and global atmospheric Pb-210 fallout: a review[J]. Journal of Environmental Radioactivity, 2011, 102(5): 500−513. doi: 10.1016/j.jenvrad.2010.10.007 [10] 刘楚越, 钟强强, 黄德坤, 等. 北冰洋表层积雪中7Be、210Po和210Pb的分布特征[J]. 海洋学报, 2021, 43(11): 70−76.Liu Chuyue, Zhong Qiangqiang, Huang Dekun, et al. Distribution characteristics of 7Be, 210Po and 210Pb in the surface snow of the Arctic Ocean[J]. Haiyang Xuebao, 2021, 43(11): 70−76. [11] Baskaran M, Krupp K. Novel application of 210Po-210Pb disequilibria to date snow, melt pond, ice core, and ice-rafted sediments in the Arctic Ocean[J]. Frontiers in Marine Science, 2021, 8: 692631. doi: 10.3389/fmars.2021.692631 [12] Baskaran M, Shaw G E. Residence time of Arctic haze aerosols using the concentrations and activity ratios of 210Po, 210Pb, and 7Be[J]. Journal of Aerosol Science, 2001, 32(4): 443−452. doi: 10.1016/S0021-8502(00)00093-8 [13] Suzuki T, Nakayama N, Igarashi M, et al. Concentrations of 210Pb and 210Po in the atmosphere of Ny-Alesund, Svalbard (scientific paper)[J]. Memoirs of National Institute of Polar Research, 1996, 51: 233−237. [14] Carvalho F P. Origins and concentrations of 222Rn, 210Pb, 210Bi and 210Po in the surface air at Lisbon, Portugal, at the Atlantic edge of the European continental landmass[J]. Atmospheric Environment, 1995, 29(15): 1809−1819. doi: 10.1016/1352-2310(95)00076-B [15] McNeary D, Baskaran M. Depositional characteristics of 7Be and 210Pb in southeastern Michigan[J]. Journal of Geophysical Research: Atmospheres, 2003, 108(D7): 4210. doi: 10.1029/2002JD003021 [16] Długosz M, Grabowski P, Bem H. 210Pb and 210Po radionuclides in the urban air of Lodz, Poland[J]. Journal of Radioanalytical and Nuclear Chemistry, 2010, 283(3): 719−725. doi: 10.1007/s10967-009-0407-x [17] 钟强强. 核素大气沉降过程及其对上层海洋POC输出通量研究的启示[D]. 上海: 华东师范大学, 2020.Zhong Qiangqiang. Atmospheric deposition of radionuclides and its application in POC export fluxes of the upper sea[D]. Shanghai: East China Normal University, 2020. [18] Fuller C, Hammond D E. The fallout rate of Pb-210 on the western coast of the United States[J]. Geophysical Research Letters, 1983, 10(12): 1164−1167. doi: 10.1029/GL010i012p01164 [19] McNeary D, Baskaran M. Residence times and temporal variations of 210Po in aerosols and precipitation from southeastern Michigan, United States[J]. Journal of Geophysical Research: Atmospheres, 2007, 112(D4): D04208. [20] Kim G, Kim T H, Church T M. Po-210 in the environment: biogeochemical cycling and bioavailability[M]//Baskaran M. Handbook of Environmental Isotope Geochemistry. Berlin, Heidelberg: Springer, 2012: 271−284. -

计量
- 文章访问数: 675
- HTML全文浏览量: 257
- PDF下载量: 44
- 被引次数: 0
