Spatial temporal patterns of chub mackerel fishing ground in the Northwest Pacific based on spatial autocorrelation model
-
摘要: 日本鲭(Scomber japonicus)是西北太平洋渔业捕捞的主要种类,了解其渔场变动对探究日本鲭种群分布、资源评估、开发利用和管理等意义重大。为获知其渔场的时空变动特征,本研究根据中国2014−2019年西北太平洋公海灯光围网渔业统计资料,运用全局莫兰指数、局部热点分析、重心迁移轨迹模型和标准差椭圆模型对西北太平洋日本鲭渔场时空分布模式、特征和变动趋势进行了研究。结果显示:(1)日本鲭渔获量主要集中在39°~44°N,147°~155°E范围内,地理上分布不均;年间产量先增后降,年间CPUE逐年降低;月间产量先增后降,其中6−10月均维持在较高水平,CPUE逐月增加;捕捞网次核密度显示,核密度高值发生区域与产量高值具有高度一致性;(2)日本鲭年间、月间渔获量均存在空间自相关并呈现显著聚集分布模式,月间空间自相关性比年间强;(3)年间、月间日本鲭渔获量分布的热点区和冷点区均表现出一定空间集聚特征,但是不同年份、月份的热点区和冷点区的分布区域、面积均存在较大差异;(4)日本鲭渔场重心年间移动轨迹呈右转约90°的扁“W”形状,总体上往西北移动;月间变化显示,从4月份开始逐渐向东北移动,8月到达东北端后向西南折返;(5)日本鲭渔场年间、月间变动方向一致,呈西南−东北格局,且方向性、向心力均较强,日本鲭渔场具有较高的聚集性。该研究引进了空间自相关模型及相关地理空间分析方法,为探讨西北太平洋日本鲭渔场变动特征提供了一种新思路。Abstract: Chub mackerel (Scomber japonicus) is a major target species in the Northwest Pacific fishery. Understanding changes in its fishing grounds is of great significance for assessing population size, resource, utilization, and management of the fishery. Based on catch data of high sea light purse seine fishery of China from 2014 to 2019, the spatial and temporal patterns of chub mackerel fishing grounds in the Northwest Pacific using the global Moran index, the local hot spot analysis, center of gravity migration trajectory model, and standard deviation ellipse are analyzed in this study. The results show that: (1) catches of chub mackerel mainly concentrates in the area between 39°−44°N and 147°−155°E, the annual catches show a trend of first increase and then decrease, the annual CPUE decrease year by year, the monthly catches show a trend of first increase and then decrease, which maintaines at a high level from June to October, and the monthly CPUE increases with month. (2) The spatial autocorrelations of annually and monthly chub mackerel catches are significant, and the monthly autocorrelations are stronger than annually ones, indicated highly aggregated distribution of the fishing grounds. (3) The distributions of chub mackerel hot spots and cold spots show a certain spatial agglomeration, but their distribution patterns and the areas cover varied apparently with years and months. (4) The gravity center of fishing ground generally show northwest shift from year to year, and in term of seasonal changes, moves northwest from April to August, and then turnes back to the southwest. (5) The annual and monthly shifts in directions of fishing grounds are consistent, showing an southwest-northeast pattern with strong directivity and aggregation. The spatial correlation models used in this analysis present a new look at spatial and temporal patterns of the chub mackerel fishing grounds, which may provide useful information for the rational development and utilization of the chub mackerel resource.
-
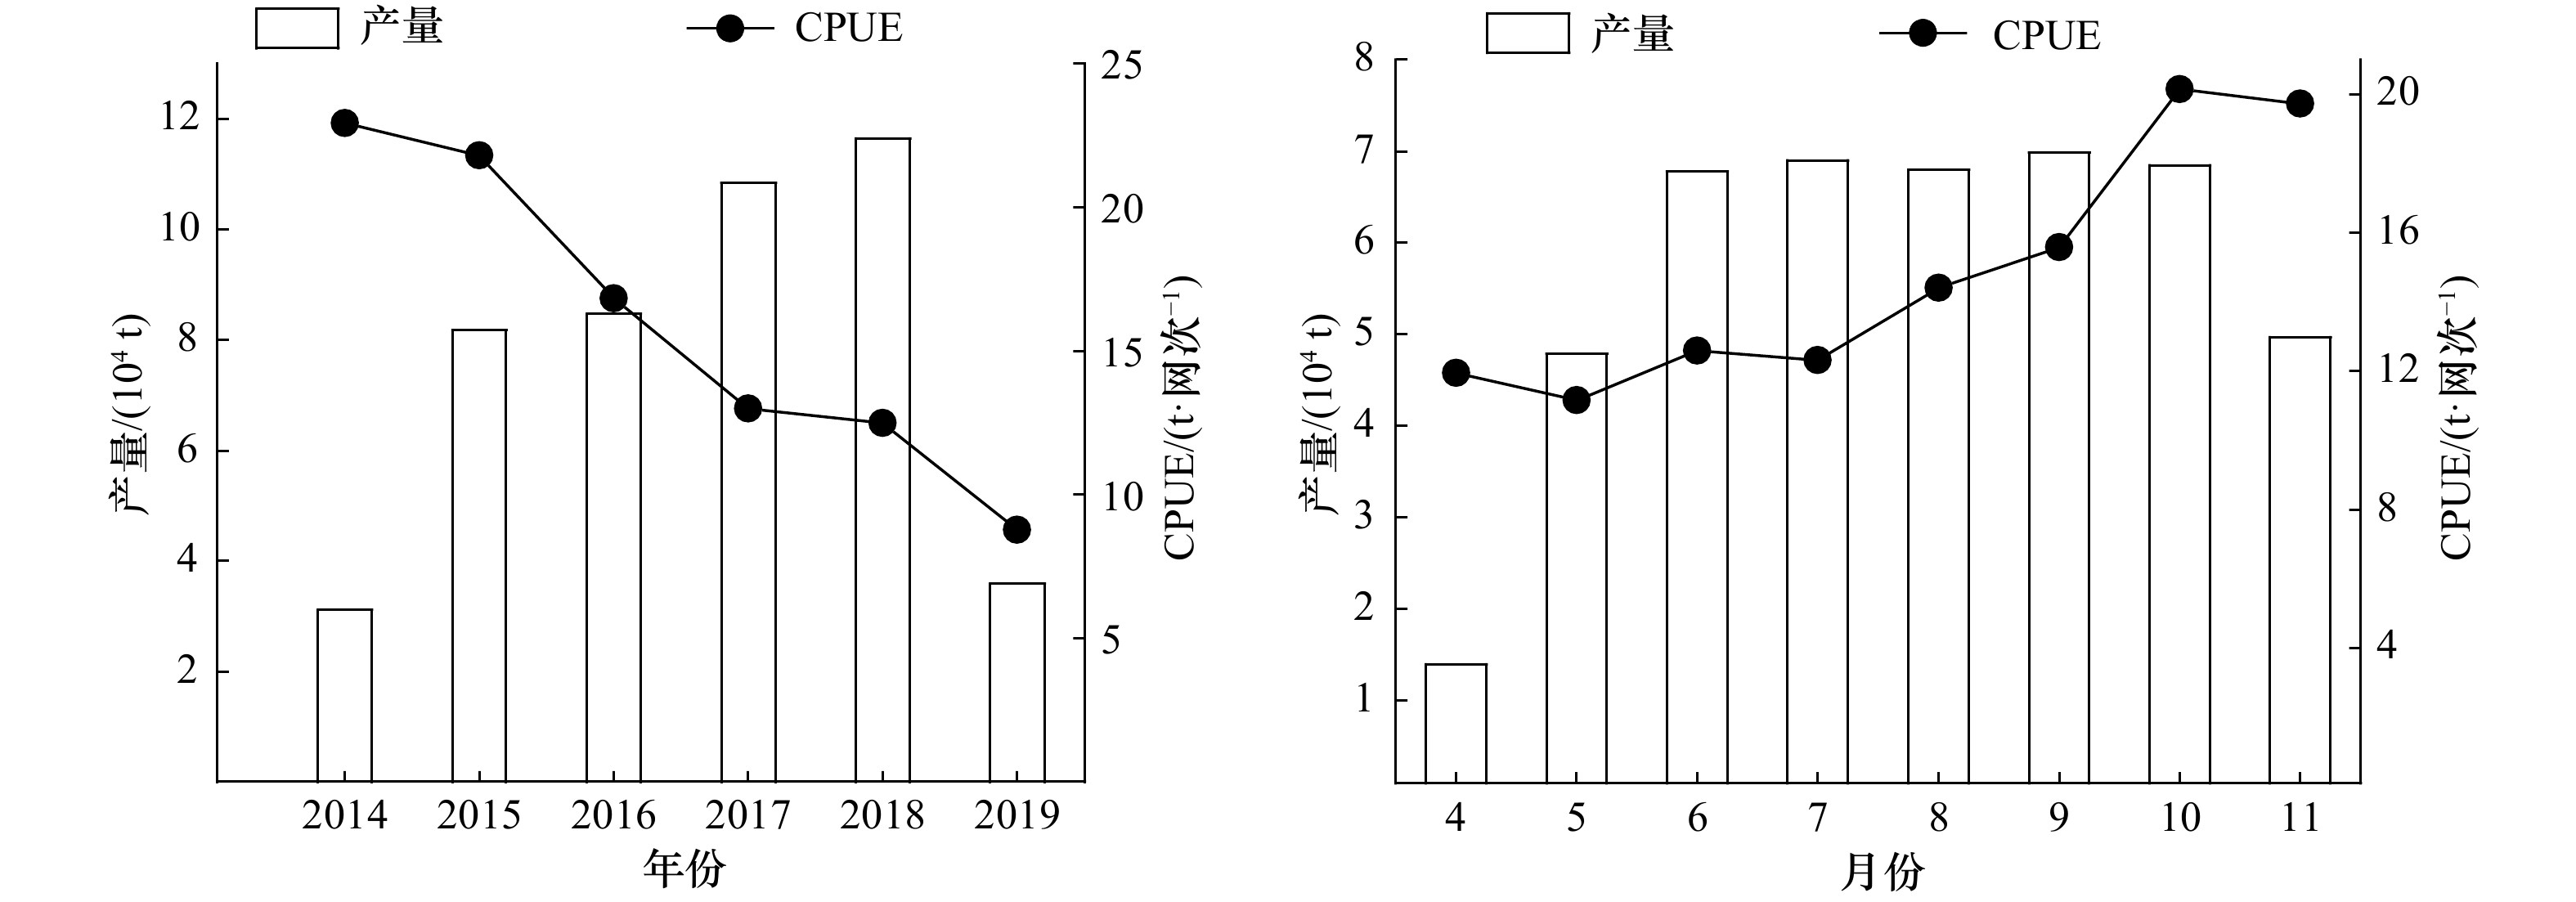
图 3 西北太平洋公海日本鲭产量和CPUE
每月的产量为2014−2019年同一月份的叠加值,每月的CPUE利用叠加后的产量和捕捞努力量求得
Fig. 3 Catch and CPUE of chub mackerel in the high seas of the Northwest Pacific
The monthly yield was the superposition value of the same month from 2014 to 2019, and the monthly CPUE was obtained by using the superimposed yield and fishing effort
表 1 日本鲭产量年间常规统计和全局空间自相关参数
Tab. 1 Ordinary statistics and global spatial autocorrelation parameters of annual catches of chub mackerel
年份 均值 标准差 偏态值 峰态值 变异系数 标准差的平方与均值的比值 全局莫兰指数 Z p 2014年 22.921 16.791 4.104 55.769 0.733 12.3 0.214 2.272 0.023 2015年 21.825 18.645 8.972 24.846 0.854 15.929 0.052 5.678 0 2016年 16.84 13.254 3.425 23.866 0.787 10.432 0.091 2.108 0.035 2017年 12.967 11.841 2.743 18.883 0.913 10.813 0.101 2.871 0.004 2018年 12.494 12.275 4.665 64.583 0.983 12.061 0.082 3.386 0 2019年 8.772 7.751 1.372 3.99 0.884 6.849 0.422 10.525 0 表 2 日本鲭产量月间常规统计和全局空间自相关参数
Tab. 2 Ordinary statistics and global spatial autocorrelation parameters of monthly catches of chub mackerel
月份 均值 标准差 偏态值 峰态值 变异系数 标准差的平方与均值的比值 全局莫兰指数 Z p 4月 11.973 15.493 7.343 87.131 1.294 20.046 0.344 18.202 0 5月 11.161 12.67 5.29 76.633 1.135 14.383 0.81 22.015 0 6月 12.6 12.259 2.444 11.388 0.973 11.928 0.434 16.871 0 7月 12.324 11.068 4.498 68.963 0.898 9.94 0.111 6.165 0 8月 14.392 11.713 2.803 24.059 0.814 9.533 0.497 22.269 0 9月 15.575 13.044 2.039 7.831 0.838 10.924 0.679 26.76 0 10月 20.119 18.258 10.479 302.955 0.907 16.569 0.149 4.674 0 11月 19.731 15.389 2.982 26.529 0.78 12.002 0.254 2.911 0 表 3 日本鲭年间、月间产量分布标准差椭圆形状参数
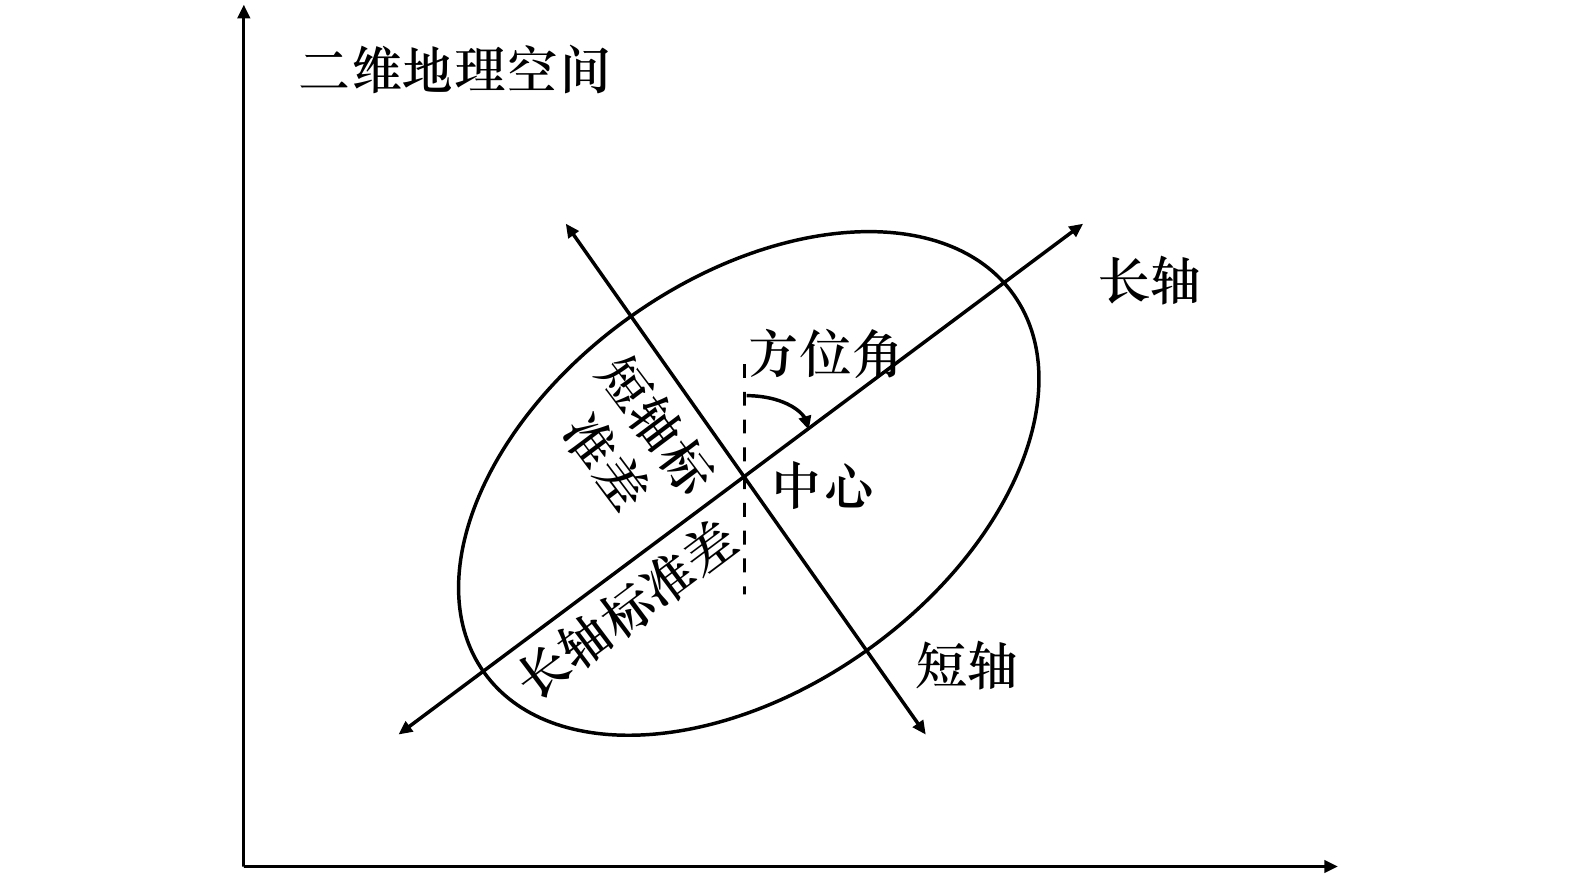
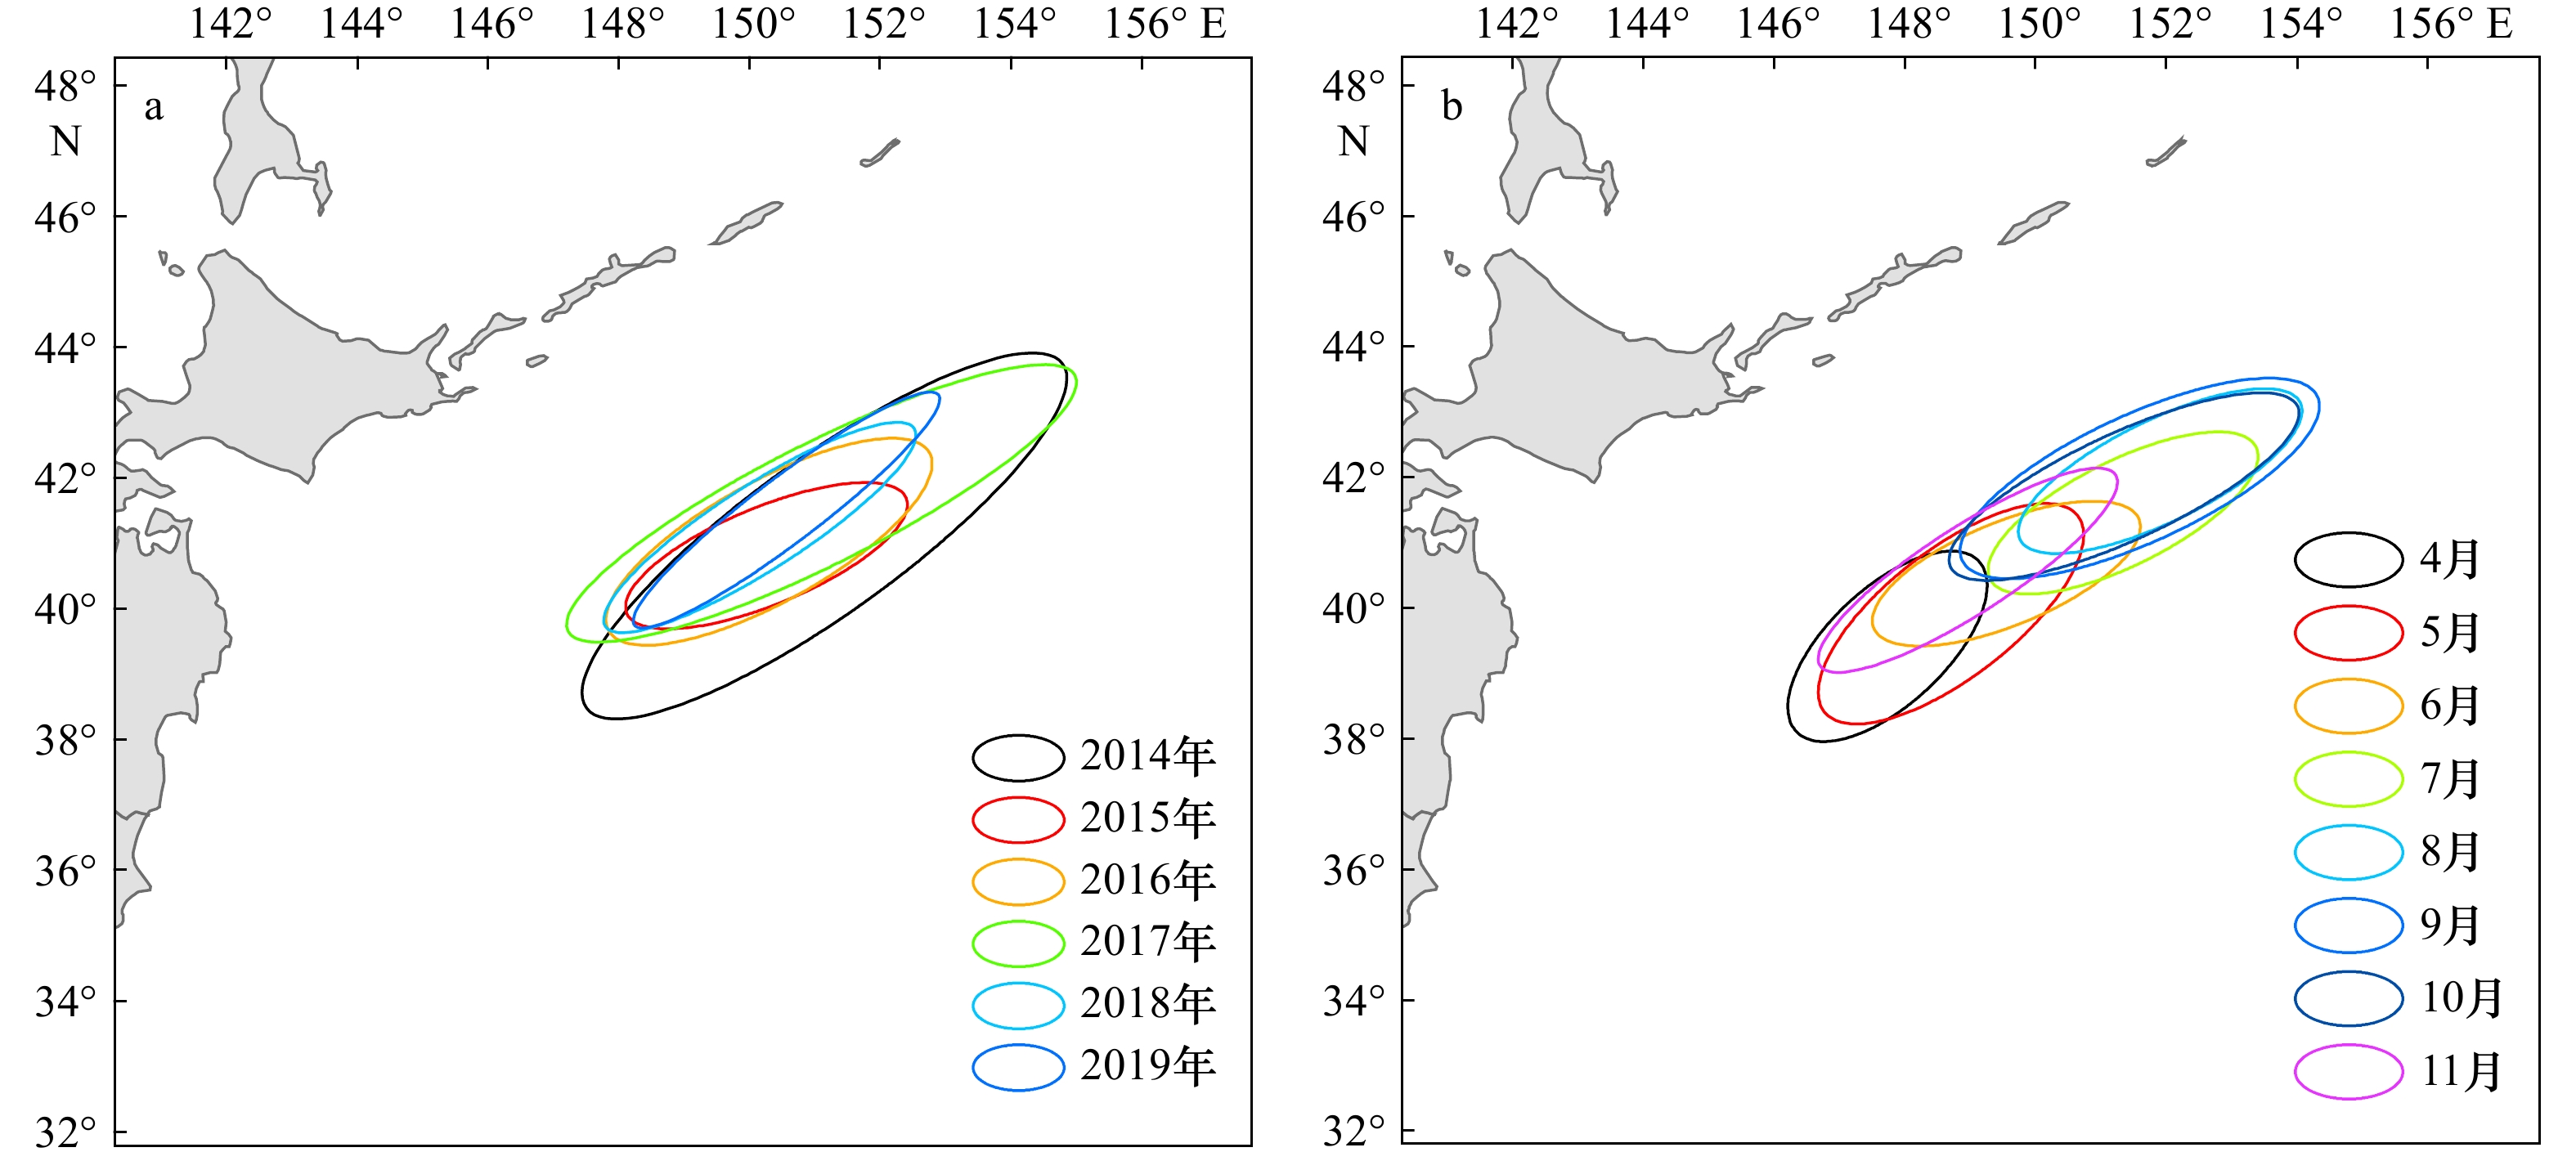
Tab. 3 Parameters of standard deviational ellipse of annual and monthly catch distributions of chub mackerel
时间 方位角/(°) 长轴/(°) 短轴/(°) 扁率 年份 2014年 54.15 4.5 1.18 3.81 2015年 67.62 2.31 0.75 3.10 2016年 60.96 2.81 0.92 3.04 2017年 63.27 4.35 0.93 4.68 2018年 57.36 2.81 0.65 4.31 2019年 52.84 2.92 0.5 5.88 月份 4月 47.01 1.91 0.89 2.13 5月 52.31 2.45 0.98 2.50 6月 67.64 2.19 0.79 2.78 7月 63.55 2.27 0.8 2.83 8月 63.94 2.39 0.78 3.06 9月 65.25 2.99 0.97 3.08 10月 65.17 2.93 0.82 3.59 11月 57.12 2.69 0.66 4.06 注:因为作图时使用经纬度作为度量单位,因此短轴、长轴只起提供距离比例和计算扁率作用。 -
[1] Wang Liangming, Ma Shuyang, Liu Yang, et al. Fluctuations in the abundance of chub mackerel in relation to climatic/oceanic regime shifts in the Northwest Pacific Ocean since the 1970s[J]. Journal of Marine Systems, 2021, 218: 103541. doi: 10.1016/j.jmarsys.2021.103541 [2] Yatsu A, Watanabe T, Ishida M, et al. Environmental effects on recruitment and productivity of Japanese sardine Sardinops melanostictus and chub mackerel Scomber japonicus with recommendations for management[J]. Fisheries Oceanography, 2005, 14(4): 263−278. doi: 10.1111/j.1365-2419.2005.00335.x [3] Bae J H, lim S Y. Chemical composition, antiproliferative and antioxidant properties of lipid classes in ordinary and dark muscles from chub mackerel (Scomber japonicus)[J]. Food and Chemical Toxicology, 2012, 50(3/4): 823−828. [4] Yukami R, Ohshimo S, Yoda M, et al. Estimation of the spawning grounds of chub mackerel Scomber japonicus and spotted mackerel Scomber australasicus in the East China Sea based on catch statistics and biometric data[J]. Fisheries Science, 2009, 75: 167−174. doi: 10.1007/s12562-008-0015-7 [5] 范秀梅, 唐峰华, 崔雪森, 等. 基于栖息地指数的西北太平洋日本鲭渔情预报模型构建[J]. 海洋学报, 2020, 42(12): 34−43.Fan Xiumei, Tang Fenghua, Cui Xuesen, et al. Habitat suitability index for chub mackerel (Scomber japonicus) in the Northwest Pacific Ocean[J]. Haiyang Xuebao, 2020, 42(12): 34−43. [6] 中央水产研究所. 令和2 (2020) 年度マサバ太平洋系群の資源評価[R]. 东京: 中央水产研究所, 2021: 11-15.Central Fisheries Research Institute. Resource evaluation of the masba Pacific Group in the year 2020[R]. Japan: Central Fisheries Research Institute, 2021: 11. [7] Shiraishi T, Ketkar S D, Katoh Y, et al. Spawning frequency of the Tsushima Current subpopulation of chub mackerel Scomber japonicus off Kyushu, Japan[J]. Fisheries Science, 2009, 75(3): 649−655. doi: 10.1007/s12562-009-0094-0 [8] 董秀强, 李灵智, 黄洪亮, 等. 西北太平洋公海2种灯光渔业渔获物组成的比较[J]. 海洋渔业, 2018, 40(4): 481−488. doi: 10.3969/j.issn.1004-2490.2018.04.011Dong Xiuqiang, Li Lingzhi, Huang Hongliang, et al. Comparison of two catches of light-fishing in the Northwest Pacific[J]. Marine Fisheries, 2018, 40(4): 481−488. doi: 10.3969/j.issn.1004-2490.2018.04.011 [9] 戴澍蔚, 唐峰华, 樊伟, 等. 北太平洋公海日本鲭资源分布及其渔场环境特征[J]. 海洋渔业, 2017, 39(4): 372−382. doi: 10.3969/j.issn.1004-2490.2017.04.002Dai Shuwei, Tang Fenghua, Fan Wei, et al. Distribution of resource and environment characteristics of fishing ground of Scomber japonicas in the North Pacific high seas[J]. Marine Fisheries, 2017, 39(4): 372−382. doi: 10.3969/j.issn.1004-2490.2017.04.002 [10] 徐博, 张衡, 唐峰华, 等. 基于GAM的北太平洋公海围网主要渔获种类渔场重心与环境因子的关系分析[J]. 南方水产科学, 2020, 16(5): 60−70. doi: 10.12131/20200006Xu Bo, Zhang Heng, Tang Fenghua, et al. Relationship between center of gravity and environmental factors of main catches of purse seine fisheries in North Pacific high seas based on GAM[J]. South China Fisheries Science, 2020, 16(5): 60−70. doi: 10.12131/20200006 [11] 王良明, 李渊, 张然, 等. 西北太平洋日本鲭资源丰度分布与表温和水温垂直结构的关系[J]. 中国海洋大学学报, 2019, 49(11): 29−38.Wang Liangming, Li Yuan, Zhang Ran, et al. Relationship between the resource distribution of Scomber japonicus and seawater temperature vertical structure of northwestern Pacific Ocean[J]. Periodical of Ocean University of China, 2019, 49(11): 29−38. [12] 吴玉鸣, 徐建华. 中国区域经济增长集聚的空间统计分析[J]. 地理科学, 2004, 24(6): 654−659. doi: 10.3969/j.issn.1000-0690.2004.06.003Wu Yuming, Xu Jianhua. A spatial analysis on China’s regional economic growth clustering[J]. Scientia Geographica Sinica, 2004, 24(6): 654−659. doi: 10.3969/j.issn.1000-0690.2004.06.003 [13] Mollalo A, Rivera K M, Vahabi N. Spatial statistical analysis of pre-existing mortalities of 20 diseases with COVID-19 mortalities in the continental United States[J]. Sustainable Cities and Society, 2021, 67: 102738. doi: 10.1016/j.scs.2021.102738 [14] 谢花林. 基于景观结构和空间统计学的区域生态风险分析[J]. 生态学报, 2008, 28(10): 5020−5026. doi: 10.3321/j.issn:1000-0933.2008.10.048Xie Hualin. Regional eco-risk analysis of based on landscape structure and spatial statistics[J]. Acta Ecologica Sinica, 2008, 28(10): 5020−5026. doi: 10.3321/j.issn:1000-0933.2008.10.048 [15] Santa Cruz F, Ernst B, Arata J A, et al. Spatial and temporal dynamics of the Antarctic krill fishery in fishing hotspots in the Bransfield Strait and South Shetland Islands[J]. Fisheries Research, 2018, 208: 157−166. doi: 10.1016/j.fishres.2018.07.020 [16] 原作辉, 杨东海, 樊伟, 等. 基于卫星AIS的中西太平洋金枪鱼延绳钓渔场分布研究[J]. 海洋渔业, 2018, 40(6): 649−659. doi: 10.3969/j.issn.1004-2490.2018.06.002Yuan Zuohui, Yang Donghai, Fan Wei, et al. On fishing grounds distribution of tuna longline based on satellite automatic identification system in the Western and Central Pacific[J]. Marine Fisheries, 2018, 40(6): 649−659. doi: 10.3969/j.issn.1004-2490.2018.06.002 [17] 蔡研聪, 黄梓荣, 李佳俊, 等. 南海北部近海新记录种——苏门答腊金线鱼资源分布特征[J]. 南方水产科学, 2020, 16(6): 1−11. doi: 10.12131/20200091Cai Yancong, Huang Zirong, Li Jiajun, et al. Stock distribution of a new record species Nemipterus mesoprion in offshore northern South China Sea[J]. South China Fisheries Science, 2020, 16(6): 1−11. doi: 10.12131/20200091 [18] Krafft B A, Skaret G, Knutsen T. An Antarctic krill (Euphausia superba) hotspot: population characteristics, abundance and vertical structure explored from a krill fishing vessel[J]. Polar Biology, 2015, 38(10): 1687−1700. doi: 10.1007/s00300-015-1735-7 [19] Pennino M G, Bellido J M, Conesa D, et al. The analysis of convergence in ecological indicators: An application to the Mediterranean fisheries[J]. Ecological Indicators, 2017, 78: 449−457. doi: 10.1016/j.ecolind.2017.03.041 [20] 任平, 吴涛, 周介铭. 基于GIS和空间自相关模型的耕地空间分布格局及变化特征分析——以成都市龙泉驿区为例[J]. 中国生态农业学报, 2016, 24(3): 325−334.Ren Ping, Wu Tao, Zhou Jieming. Analysis of spatial distribution pattern and evolutionary characteristics of cultivated lands based on spatial autocorrelation model and GIS platform—A case study of Longquanyi District, Chengdu, China[J]. Chinese Journal of Eco-Agriculture, 2016, 24(3): 325−334. [21] Ping J L, Green C J, Zartman R E, et al. Exploring spatial dependence of cotton yield using global and local autocorrelation statistics[J]. Field Crops Research, 2004, 89(2/3): 219−236. [22] Getis A, Ord J K. The analysis of spatial association by use of distance statistics[J]. Geographical Analysis, 1992, 24(3): 189−206. [23] Anselin L. Local indicators of spatial association—LISA[J]. Geographical Analysis, 2010, 27(2): 93−115. doi: 10.1111/j.1538-4632.1995.tb00338.x [24] 陈明发, 刘帆, 赵耀龙, 等. 1987−2017年粤港澳大湾区城市群的不透水地表扩张与梯度演化[J]. 地球信息科学学报, 2021, 23(3): 443−455. doi: 10.12082/dqxxkx.2021.200195Chen Mingfa, Liu Fan, Zhao Yaolong, et al. The Expansion and gradient evolution of impervious surface within the Guangdong-Hong Kong-Macao Greater Bay area from 1987 to 2017[J]. Journal of Geo-information Science, 2021, 23(3): 443−455. doi: 10.12082/dqxxkx.2021.200195 [25] Lefever D W. Measuring geographic concentration by means of the standard deviational ellipse[J]. American Journal of Sociology, 1926, 32(1): 88−94. doi: 10.1086/214027 [26] Suda M, Watanabe C, Akamine T. Two-species population dynamics model for Japanese sardine Sardinops melanostictus and chub mackerel Scomber japonicus off the Pacific coast of Japan[J]. Fisheries Research, 2008, 94(1): 18−25. doi: 10.1016/j.fishres.2008.06.012 [27] Ichinokawa M, Okamura H, Watanabe C, et al. Effective time closures: quantifying the conservation benefits of input control for the Pacific chub mackerel fishery[J]. Ecological Applications, 2015, 25(6): 1566−1584. doi: 10.1890/14-1216.1 [28] 崔国辰, 朱文斌, 戴乾, 等. 西北太平洋鲐鱼渔场的时空分布及其与海表温和叶绿素浓度的关系研究[J]. 海洋开发与管理, 2021, 38(8): 5 .Cui Guochen, Zhu Wenbin, Dai Qian, et al. Spatial and temporal distribution of chub mackerel in the Northwest Pacific and its relationship with sea surface temperature and chlorophyll concentration[J]. Ocean Development and Management, 2021, 38(8): 5. [29] 唐峰华, 戴澍蔚, 樊伟, 等. 西北太平洋公海日本鲭(Scomber japonicus)胃含物及其摄食等级研究[J]. 中国农业科技导报, 2020, 22(1): 138−148.Tang Fenghua, Dai Shuwei, Fan Wei, et al. Study on stomach composition and feeding level of chub mackerel in the Northwest Pacific[J]. Journal of Agricultural Science and Technology, 2020, 22(1): 138−148. [30] 庄之栋, 马超, 刘勇, 等. 北太平洋公海秋季鲐鱼生物学特性的初步研究[J]. 海洋湖沼通报, 2018(6): 125−131.Zhuang Zhidong, Ma Chao, Liu Yong, et al. A preliminary study on biological characteristics of Scomber japonicus in the North Pacific Ocean in autumn[J]. Transactions of Oceanology and Limnology, 2018(6): 125−131. [31] 薛嘉伦, 樊伟, 唐峰华, 等. 基于最大熵模型预测西北太平洋公海鲐潜在栖息地分布[J]. 南方水产科学, 2018, 14(1): 92−98. doi: 10.3969/j.issn.20950780.2018.01.012Xue Jialun, Fan Wei, Tang Fenghua, et al. Analysis of potential habitat distribution of Scomber japonicus in Northwest Pacific Ocean using maximum entropy model[J]. South China Fisheries Science, 2018, 14(1): 92−98. doi: 10.3969/j.issn.20950780.2018.01.012 [32] Nicol S, Foster J, Kawaguchi S. The fishery for Antarctic krill—recent developments[J]. Fish and Fisheries, 2012, 13(1): 30−40. doi: 10.1111/j.1467-2979.2011.00406.x [33] 冯永玖, 杨铭霞, 陈新军. 基于Voronoi图与空间自相关的西北太平洋柔鱼资源空间聚集特征分析[J]. 海洋学报, 2014, 36(12): 74−84.Feng Yongjiu, Yang Mingxia, Chen Xinjun. Aanlyzing spatial aggregation of Ommastrephes bartramii in the Northwest Pacific Ocean based on Voronoi diagram and spatial autocorrelation[J]. Haiyang Xuebao, 2014, 36(12): 74−84. [34] Ord K. Estimation methods for models of spatial interaction[J]. Journal of the American Statistical Association, 1975, 70(349): 120−126. doi: 10.1080/01621459.1975.10480272 [35] Zhang Xinfeng, Tang Danling, Li Zizhen, et al. Analysis of the spatio-temporal distribution of chlorophyll a in the eastern Indian Ocean near the time of the 2004 South Asian tsunami[J]. International Journal of Remote Sensing, 2010, 31(17/18): 4579−4593. doi: 10.1080/01431161.2010.485141 [36] 刘禹希, 王学锋, 吕少梁, 等. 南海北部海域大眼鲷空间自相关性[J]. 水产学报, 2021, 45(8): 13.Liu Yuxi, Wang Xuefeng, Lü Shaoliang, et al. Spatial autocorrelation of Priacanthus spp. resources in the northern South China Sea[J]. Journal of Fisheries of China, 2021, 45(8):13. [37] 都煜, 徐宾铎, 薛莹, 等. 海州湾日本枪乌贼和短蛸空间结构的季节变化[J]. 水产学报, 2017, 41(12): 1888−1895.Du Yu, Xu Binduo, Xue Ying, et al. Seasonal variations of spatial structure of Japanese squid (Loligo japonica) and octopus (Octopus ochellatus) in Haizhou Bay[J]. Journal of Fisheries of China, 2017, 41(12): 1888−1895. [38] 杨晓明, 戴小杰, 田思泉, 等. 中西太平洋鲣鱼围网渔业资源的热点分析和空间异质性[J]. 生态学报, 2014, 34(13): 3771−3778.Yang Xiaoming, Dai Xiaojie, Tian Siquan, et al. Hot spot analysis and spatial heterogeneity of skipjack tuna (Katsuwonus pelamis) purse seine resources in the western and central Pacific Ocean[J]. Acta Ecologica Sinica, 2014, 34(13): 3771−3778. [39] 赵斌, 蔡庆华. 地统计学分析方法在水生态系统研究中的应用[J]. 水生生物学报, 2000, 24(5): 514−520. doi: 10.3321/j.issn:1000-3207.2000.05.019Zhao Bin, Cai Qinghua. An application of geostatstical analysis in freshwater ecosystem[J]. Acta Hydrobiologica Sinica, 2000, 24(5): 514−520. doi: 10.3321/j.issn:1000-3207.2000.05.019 [40] 袁兴伟, 刘尊雷, 金艳, 等. 基于空间自相关的东海带鱼聚集特征年代际变化[J]. 应用生态学报, 2017, 28(10): 3409−3416.Yuan Xingwei, Liu Zunlei, Jin Yan, et al. Inter-decadal variation of spatial aggregation of Trichiurus japonicus in East China Sea based on spatial autocorrelation analysis[J]. Chinese Journal of Applied Ecology, 2017, 28(10): 3409−3416. [41] 王文宇, 邵全琴, 薛允传, 等. 西北太平洋柔鱼资源与海洋环境的GIS空间分析[J]. 地球信息科学, 2003(1): 39−44.Wang Wenyu, Shao Quanqin, Xue Yunchuan, et al. On the relationship between on the resources of Ommastrephes Bartramia and marine environment in the Northwest Pacific Ocean based on GIS[J]. Geo-information Science, 2003(1): 39−44. [42] Kang S, Lee J B, Hollowed A, et al. The impact of climate changes on the distribution and abundance of mackerels in the Northwestern Pacific[J]. Proceedings of the Korean Society of Industrial Applied Mathematics, 2010, 5(S3/4): 37−37. [43] Cheung W W, Watson R, Pauly D. Signature of ocean warming in global fisheries catch[J]. Nature, 2013, 497(7449): 365−368. doi: 10.1038/nature12156 [44] Watanabe C. Effects of density-dependence and sea surface temperature on interannual variation in length-at-age of chub mackerel (Scomber japonicus) in the Kuroshio-Oyashio area during 1970−1997[J]. Fishery Bulletin, 2004, 102(1): 196−206. [45] Watanabe C, Yatsu A. Long-term changes in maturity at age of chub mackerel (Scomber japonicus) in relation to population declines in the waters off northeastern Japan[J]. Fisheries Research, 2006, 78(2/3): 323−332. doi: 10.1016/j.fishres.2006.01.001 [46] 陈新军. 渔业资源与渔场学[M]. 北京: 海洋出版社, 2004: 145-157.Chen Xinjun. Fisheries Resources and Fishing Grounds[M]. Beijing: China Ocean Press, 2004: 145−157. [47] 陈新军, 许柳雄. 北太平洋150°E~165°E海域柔鱼渔场与表温及水温垂直结构的关系[J]. 海洋湖沼通报, 2004(2): 36−44. doi: 10.3969/j.issn.1003-6482.2004.02.006Chen Xinjun, Xu Liuxiong. Analysis of relationship between fishing ground of Ommastrephe bartrami and surface water temperature and its vertical distribution from 150°E to 165°E in the Northwestern Pacific[J]. Transactions of Oceanology and Limnology, 2004(2): 36−44. doi: 10.3969/j.issn.1003-6482.2004.02.006 [48] 赵璐, 赵作权. 基于特征椭圆的中国经济空间分异研究[J]. 地理科学, 2014, 34(8): 979−986.Zhao Lu, Zhao Zuoquan. Projecting the spatial variation of economic based on the specific ellipses in China[J]. Scientia Geographica Sinica, 2014, 34(8): 979−986. [49] Guan L S, Shan X J, Jin X S, et al. Evaluating spatio-temporal dynamics of multiple fisheries-targeted populations simultaneously: A case study of the Bohai Sea ecosystem in China[J]. Ecological Modelling, 2020, 422: 1−10. -


 下载:
下载:


