Effects of sampling design on estimation of spatial pattern indices of fish population
-
摘要: 查明渔业种群空间格局可为渔业资源的合理利用和管理提供参考依据。在渔业资源调查中,采样设计会影响调查分析结果的准确性和适用性。为查明采样设计对分析种群空间格局的影响,本文根据2016年10月、2017年2月、5月、8月在山东南部近海调查获得的数据,以星康吉鳗(Conger myriaster)、方氏云鳚(Enedrias fangi)为目标鱼种,应用计算机模拟重抽样方法,研究了4种样本量下简单随机抽样、系统抽样、分层随机抽样、分层系统抽样对估计目标种群的平均拥挤度和聚块指数的影响。应用相对估计误差和相对偏差衡量不同采样设计的表现。结果表明,系统抽样、分层系统抽样的模拟结果较接近空间格局指数“真值”,简单随机抽样和分层随机抽样表现较差;样本量对空间格局指数估计的影响较大,随着样本量增大,目标鱼种两个空间格局指数的相对估计误差均呈降低趋势。种群原始空间分布对空间格局指数估计具有一定影响,聚块指数估计的精确度随目标种群聚块指数真值的增加而减小,整体出现偏高的估计偏差。不同采样设计影响鱼类种群空间格局分析,种群聚集程度也对分析结果有所影响,因此,在渔业资源调查设计时可以纳入目标种群空间格局指标以完善多目标渔业资源调查方案。Abstract: The study of spatial patterns of fish populations provides reference for reasonable utilization and management of fishery resources, which depends greatly on the quality of data collected from well-designed surveys. So appropriate sampling designs are essential in fishery-independent surveys, which can greatly affect the accuracy and applicability of the survey results. Computer simulation study is conducted to investigate the effects of sampling design on the spatial pattern of fish populations based on the data collected from bottom trawl surveys in the southern waters off Shandong Peninsula in four seasons from 2016 to 2017 in this study. Four sampling methods, including simple random sampling (SRS), systematic sampling (SYS), stratified random sampling (StRS) and stratified systematic sampling (StSS) with four levels of sample sizes are considered as potential sampling designs in this simulation study. The effects of different sampling designs on the estimation of mean crowding index and poly block index (PBI) for Conger myriaster and Enedrias fangi are examined. Relative estimation error (REE) and relative bias (RB) are used to measure the performances of different sampling designs. The results show that the simulated values of spatial pattern indices from SYS and StSS are closer to the “true” values, and the performances of SRS and StRS are relatively poor. The REE of estimation of spatial pattern indices for target fish populations decreased significantly with sample size. The original spatial pattern of fish populations has a certain effect on the estimation of spatial pattern indices. The precision of estimation of PBI decreased with the increase of the “true” values of spatial pattern indices, with PBI being overestimated when it is high. Different sampling designs have a certain effect on the estimation of spatial pattern indices of fish populations, and the degree of population aggregation also affected the analysis results. Therefore, the spatial pattern indices of target fish populations could be incorporated into the survey goals in sampling designs to improve the fishery-independent surveys with multiple objectives.
-
Key words:
- sampling design /
- fish population /
- spatial pattern /
- computer simulation
-
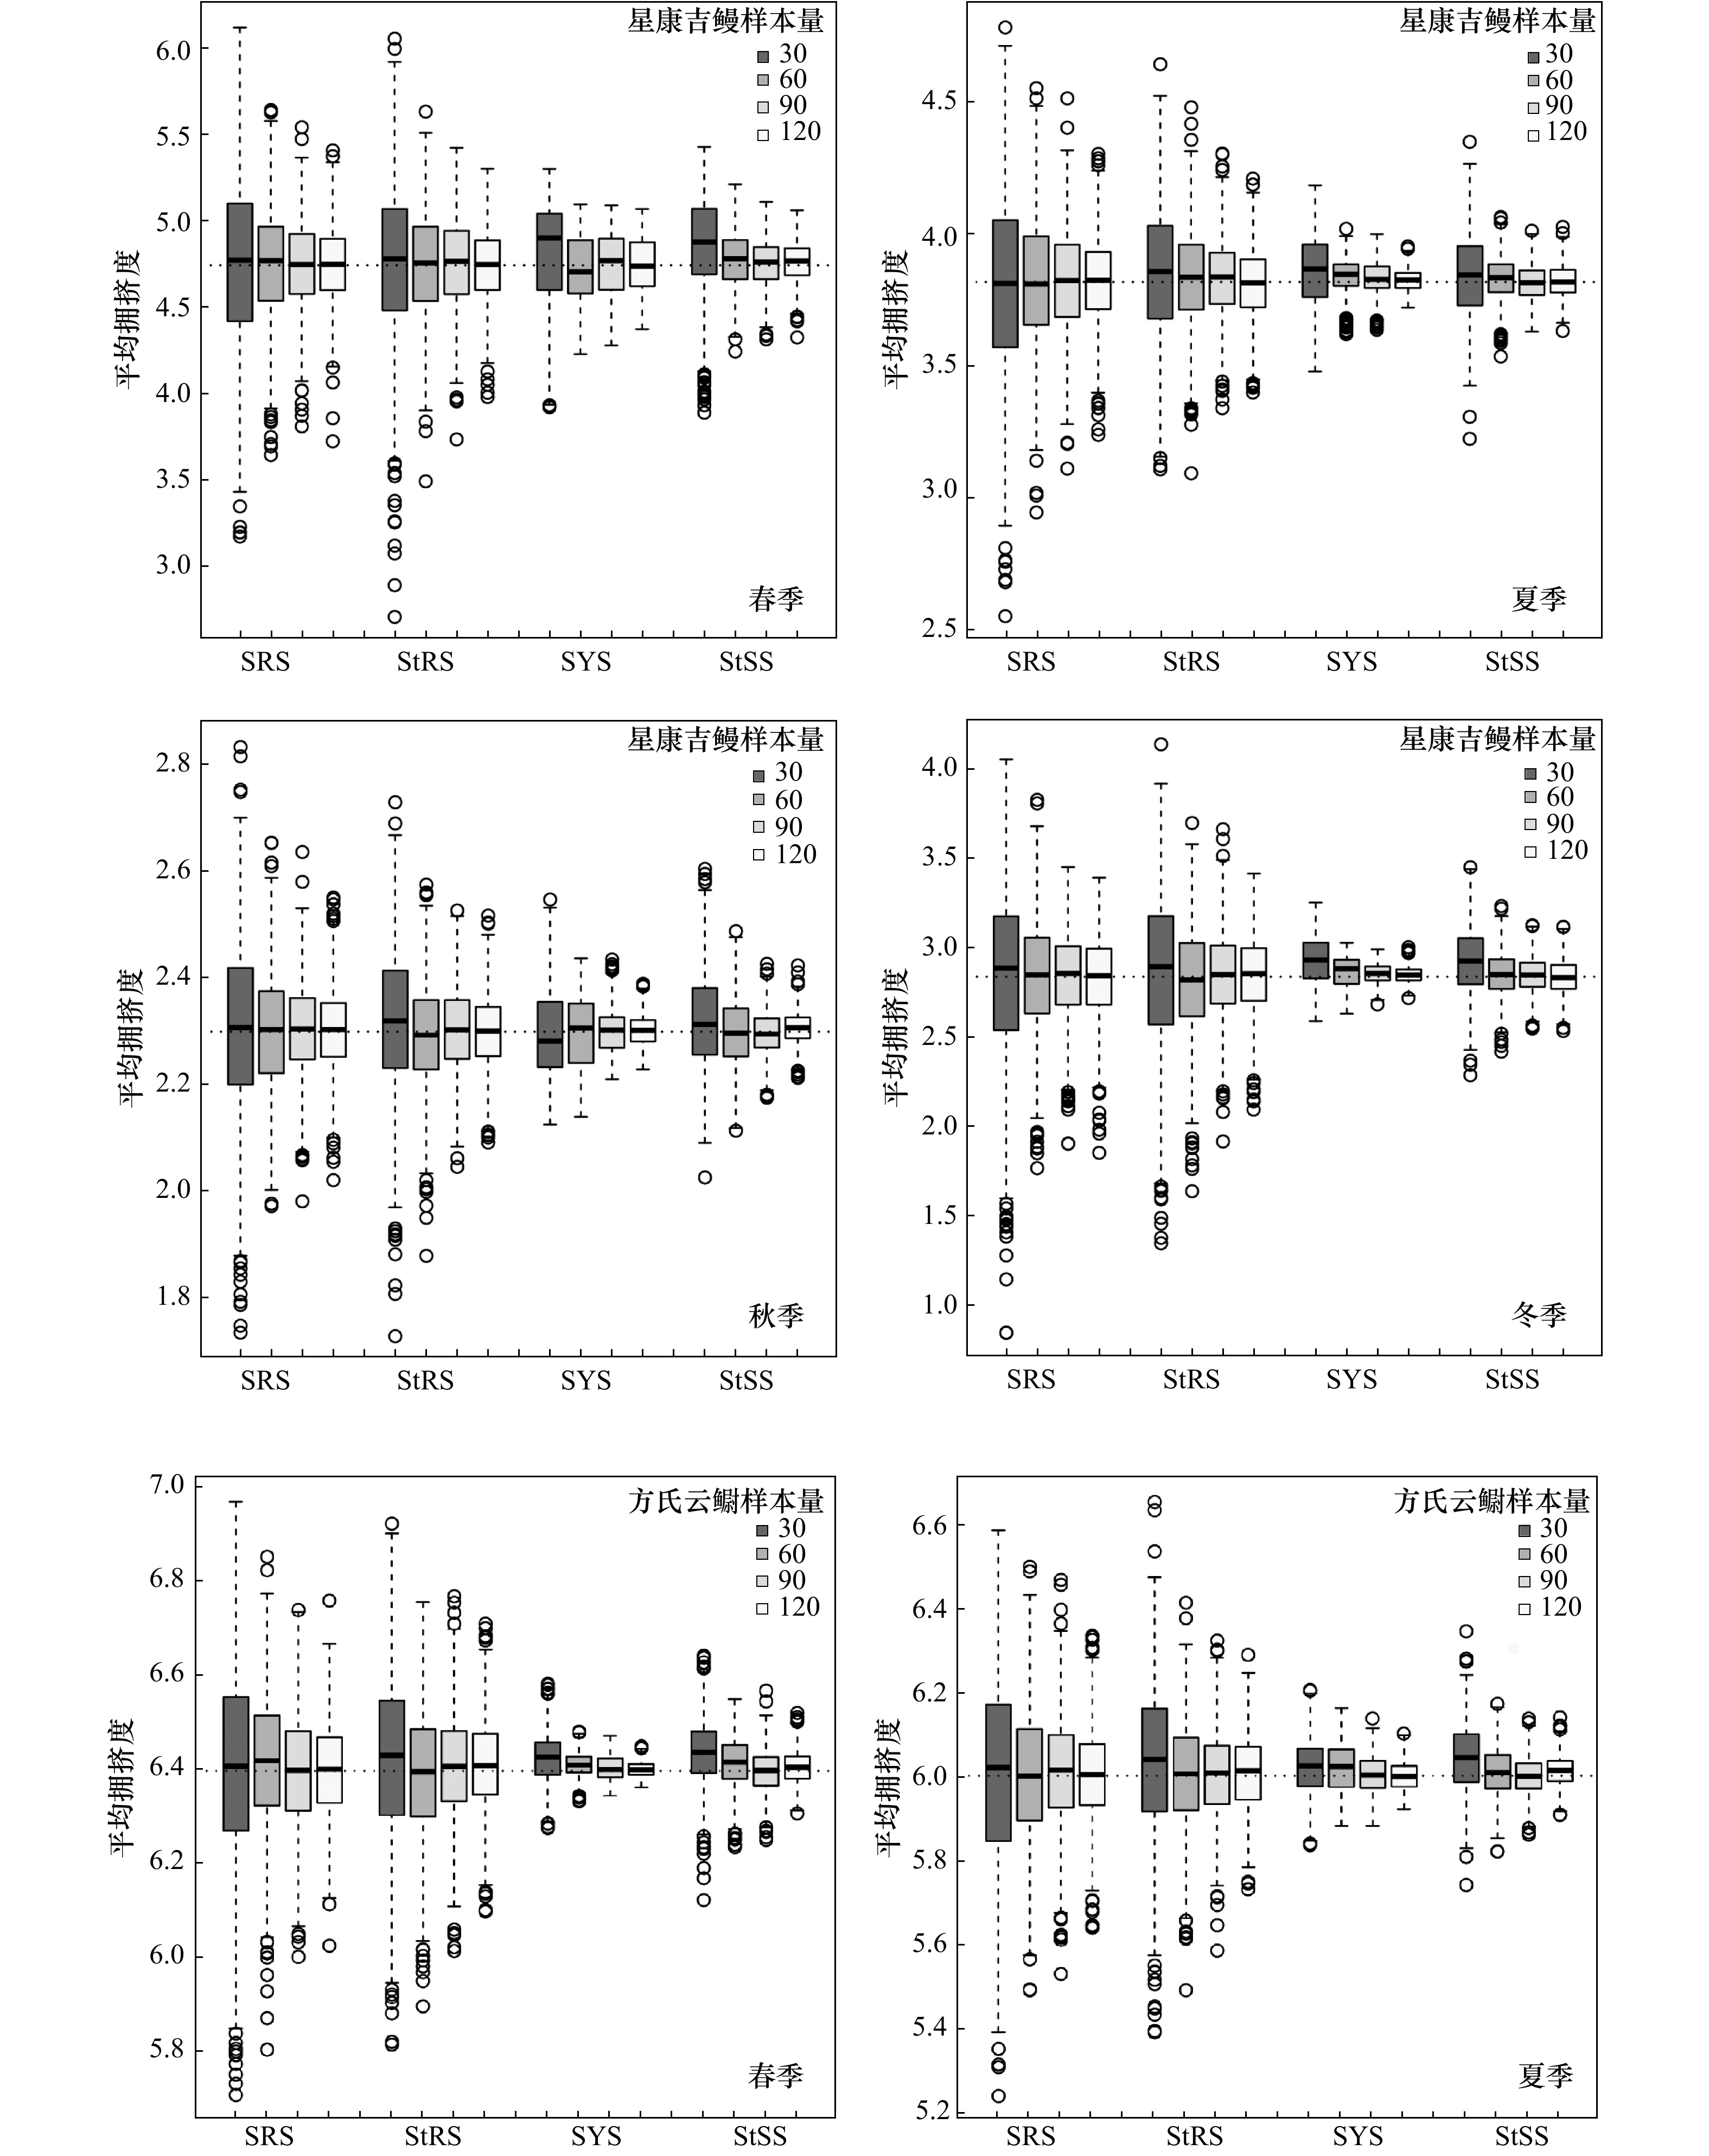
图 2 不同采样设计下的目标鱼种平均拥挤度模拟值分布
SRS表示简单随机抽样;StRS表示分层随机抽样;SYS表示系统抽样;StSS表示分层系统抽样;图中水平虚线表示平均拥挤度“真值”
Fig. 2 Distribution of simulated mean crowding of target fish species for different sampling designs
SRS indicates simple random sampling; StRS indicates stratified random sampling; SYS indicates system atic sampling; StSS indicates stratified system atic sampling; the horizontal dotted line in figures represent the “true” values of initial mean crowding
图 3 不同采样设计下的目标鱼种聚块指数模拟值分布
SRS表示简单随机抽样;SYS表示系统抽样;StRS表示分层随机抽样;StSS表示分层系统抽样;图中水平虚线表示聚块指数“真值”
Fig. 3 Distribution of simulated poly block index of target fish species for different sampling designs
SRS indicates simple random sampling; SYS indicates system atic sampling; StRS indicates stratified random sampling; StSS indicates stratified system atic sampling; the horizontal dotted line in figures represent the “true” value of initial poly block index
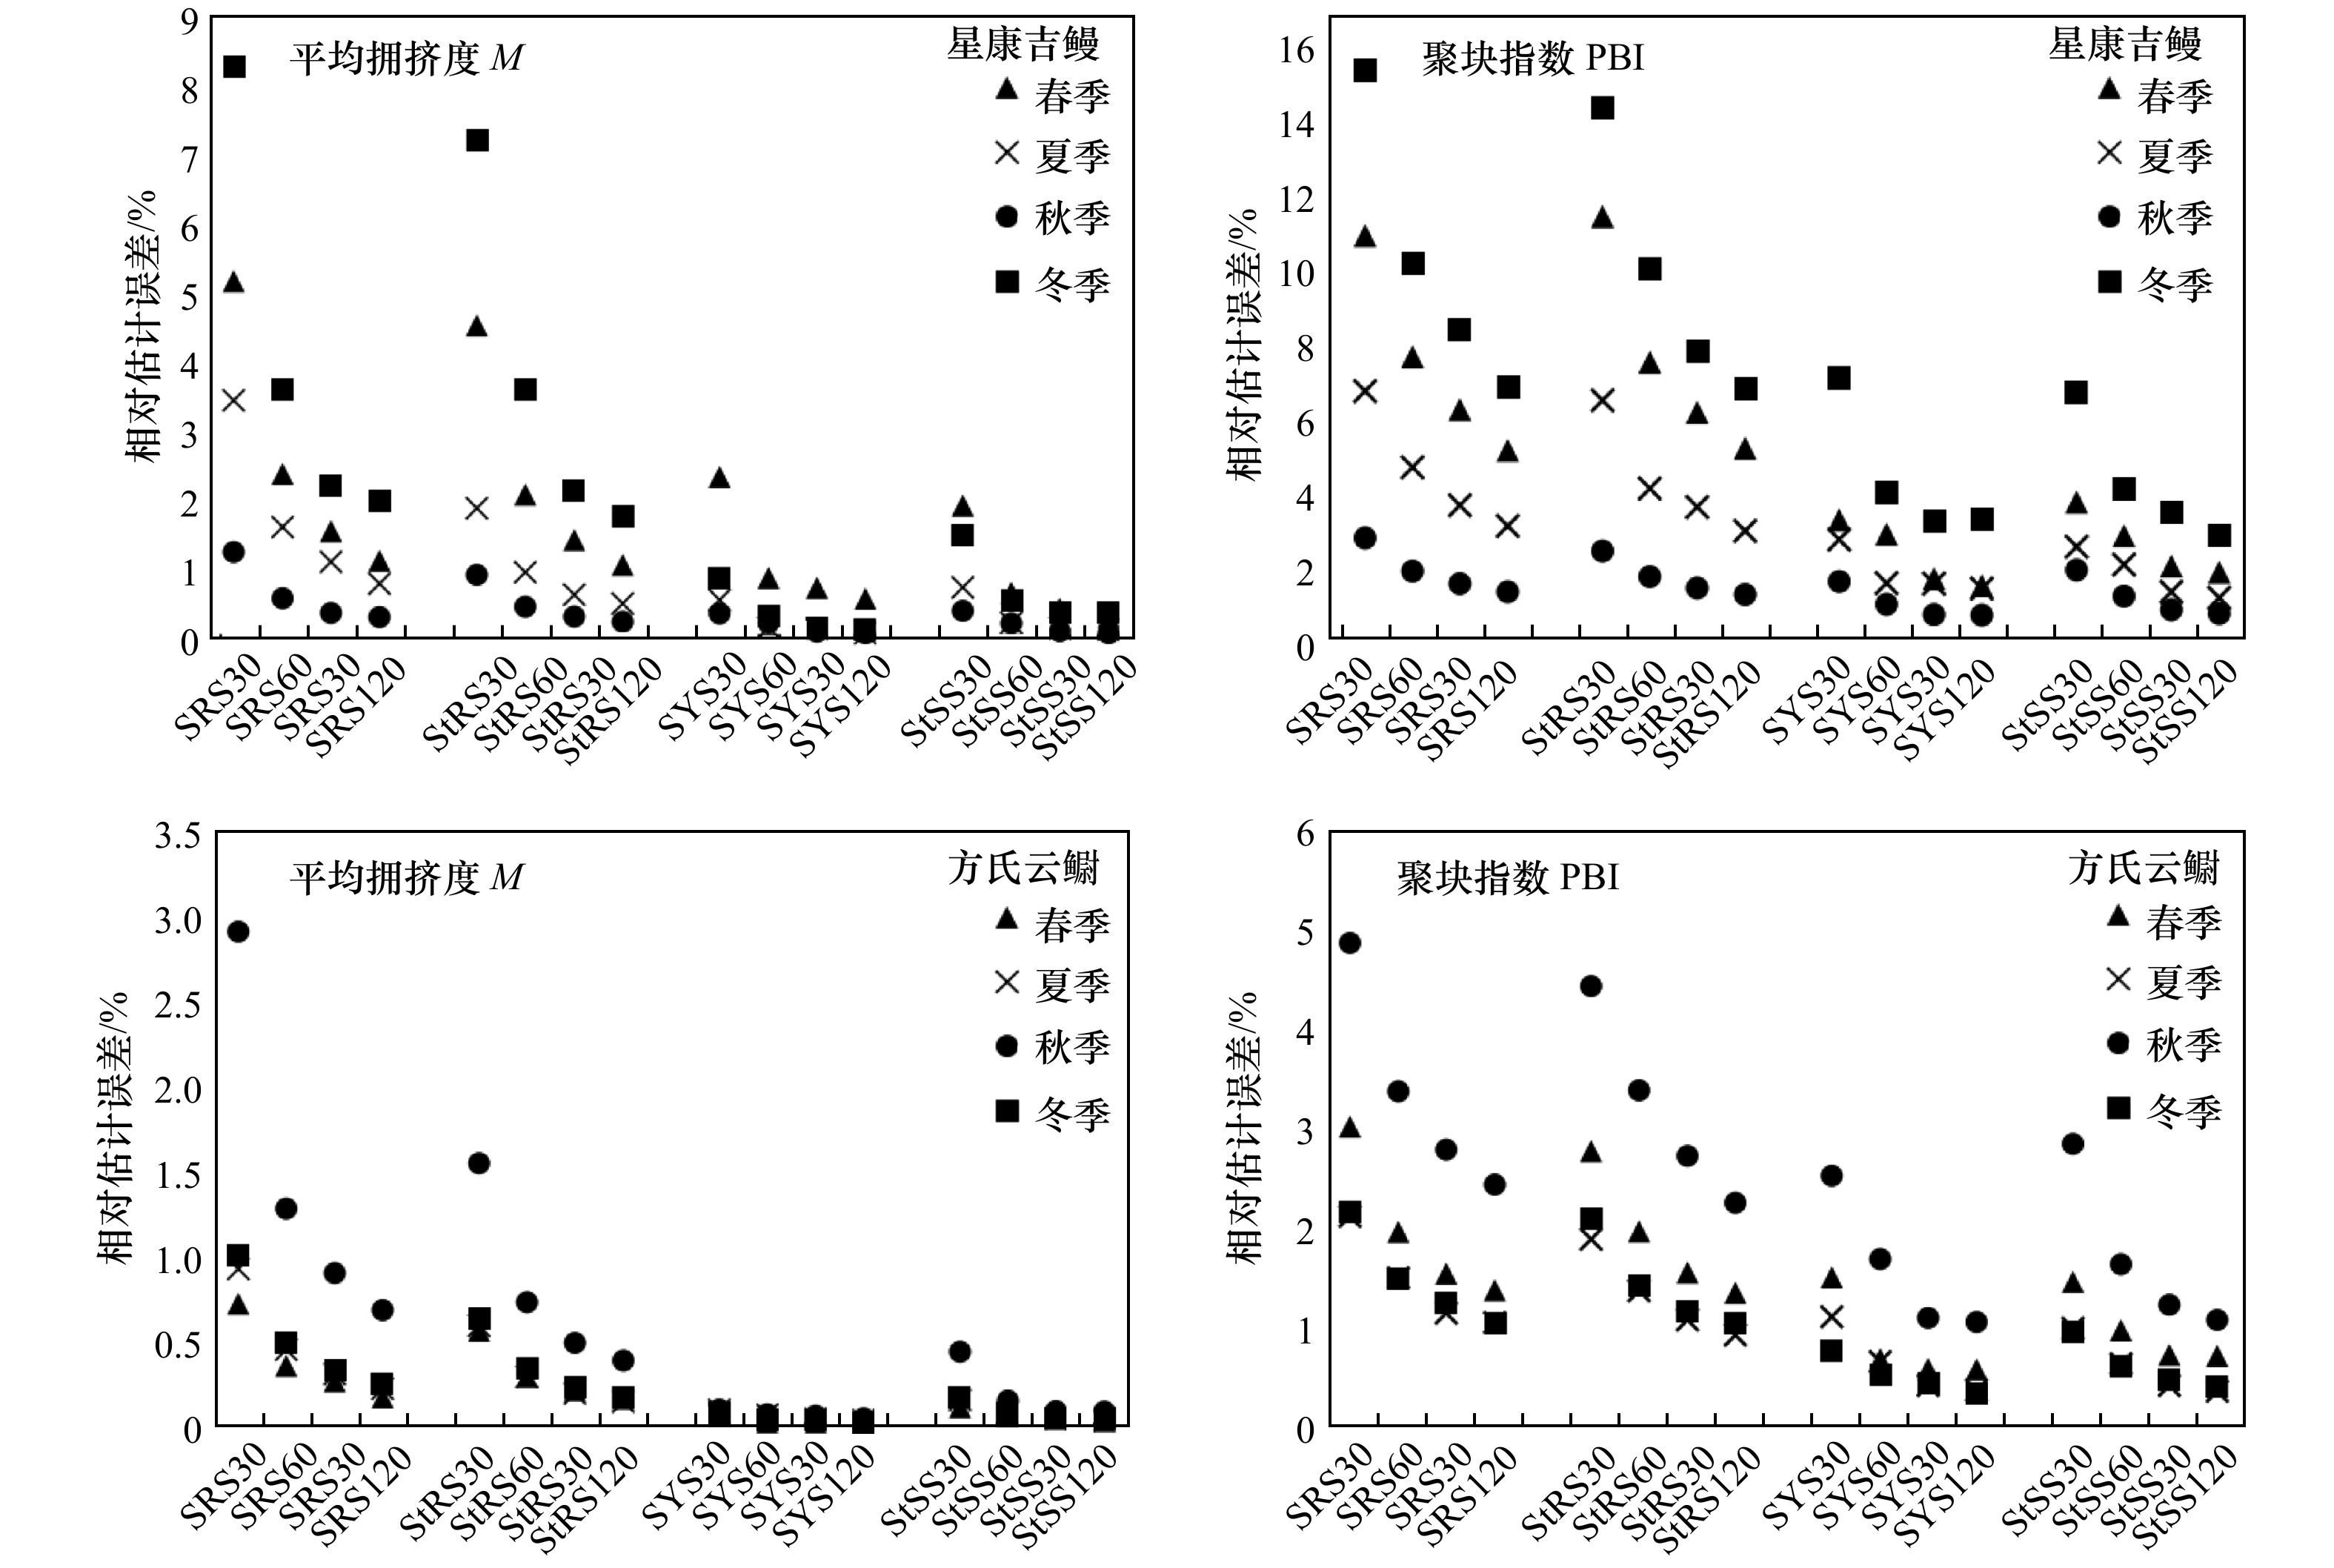
图 4 不同采样设计下目标鱼种空间格局指数的相对估计误差
SRS表示简单随机抽样;SYS表示系统抽样;StRS表示分层随机抽样;StSS表示分层系统抽样;30、60、90、120表示样本量
Fig. 4 The relative estimation error of spatial pattern index for target species for different sampling designs
SRS indicates simple random sampling; SYS indicates system atic sampling; StRS indicates stratified random sampling; StSS indicates stratified system atic sampling; 30, 60, 90, 120 represent sample size
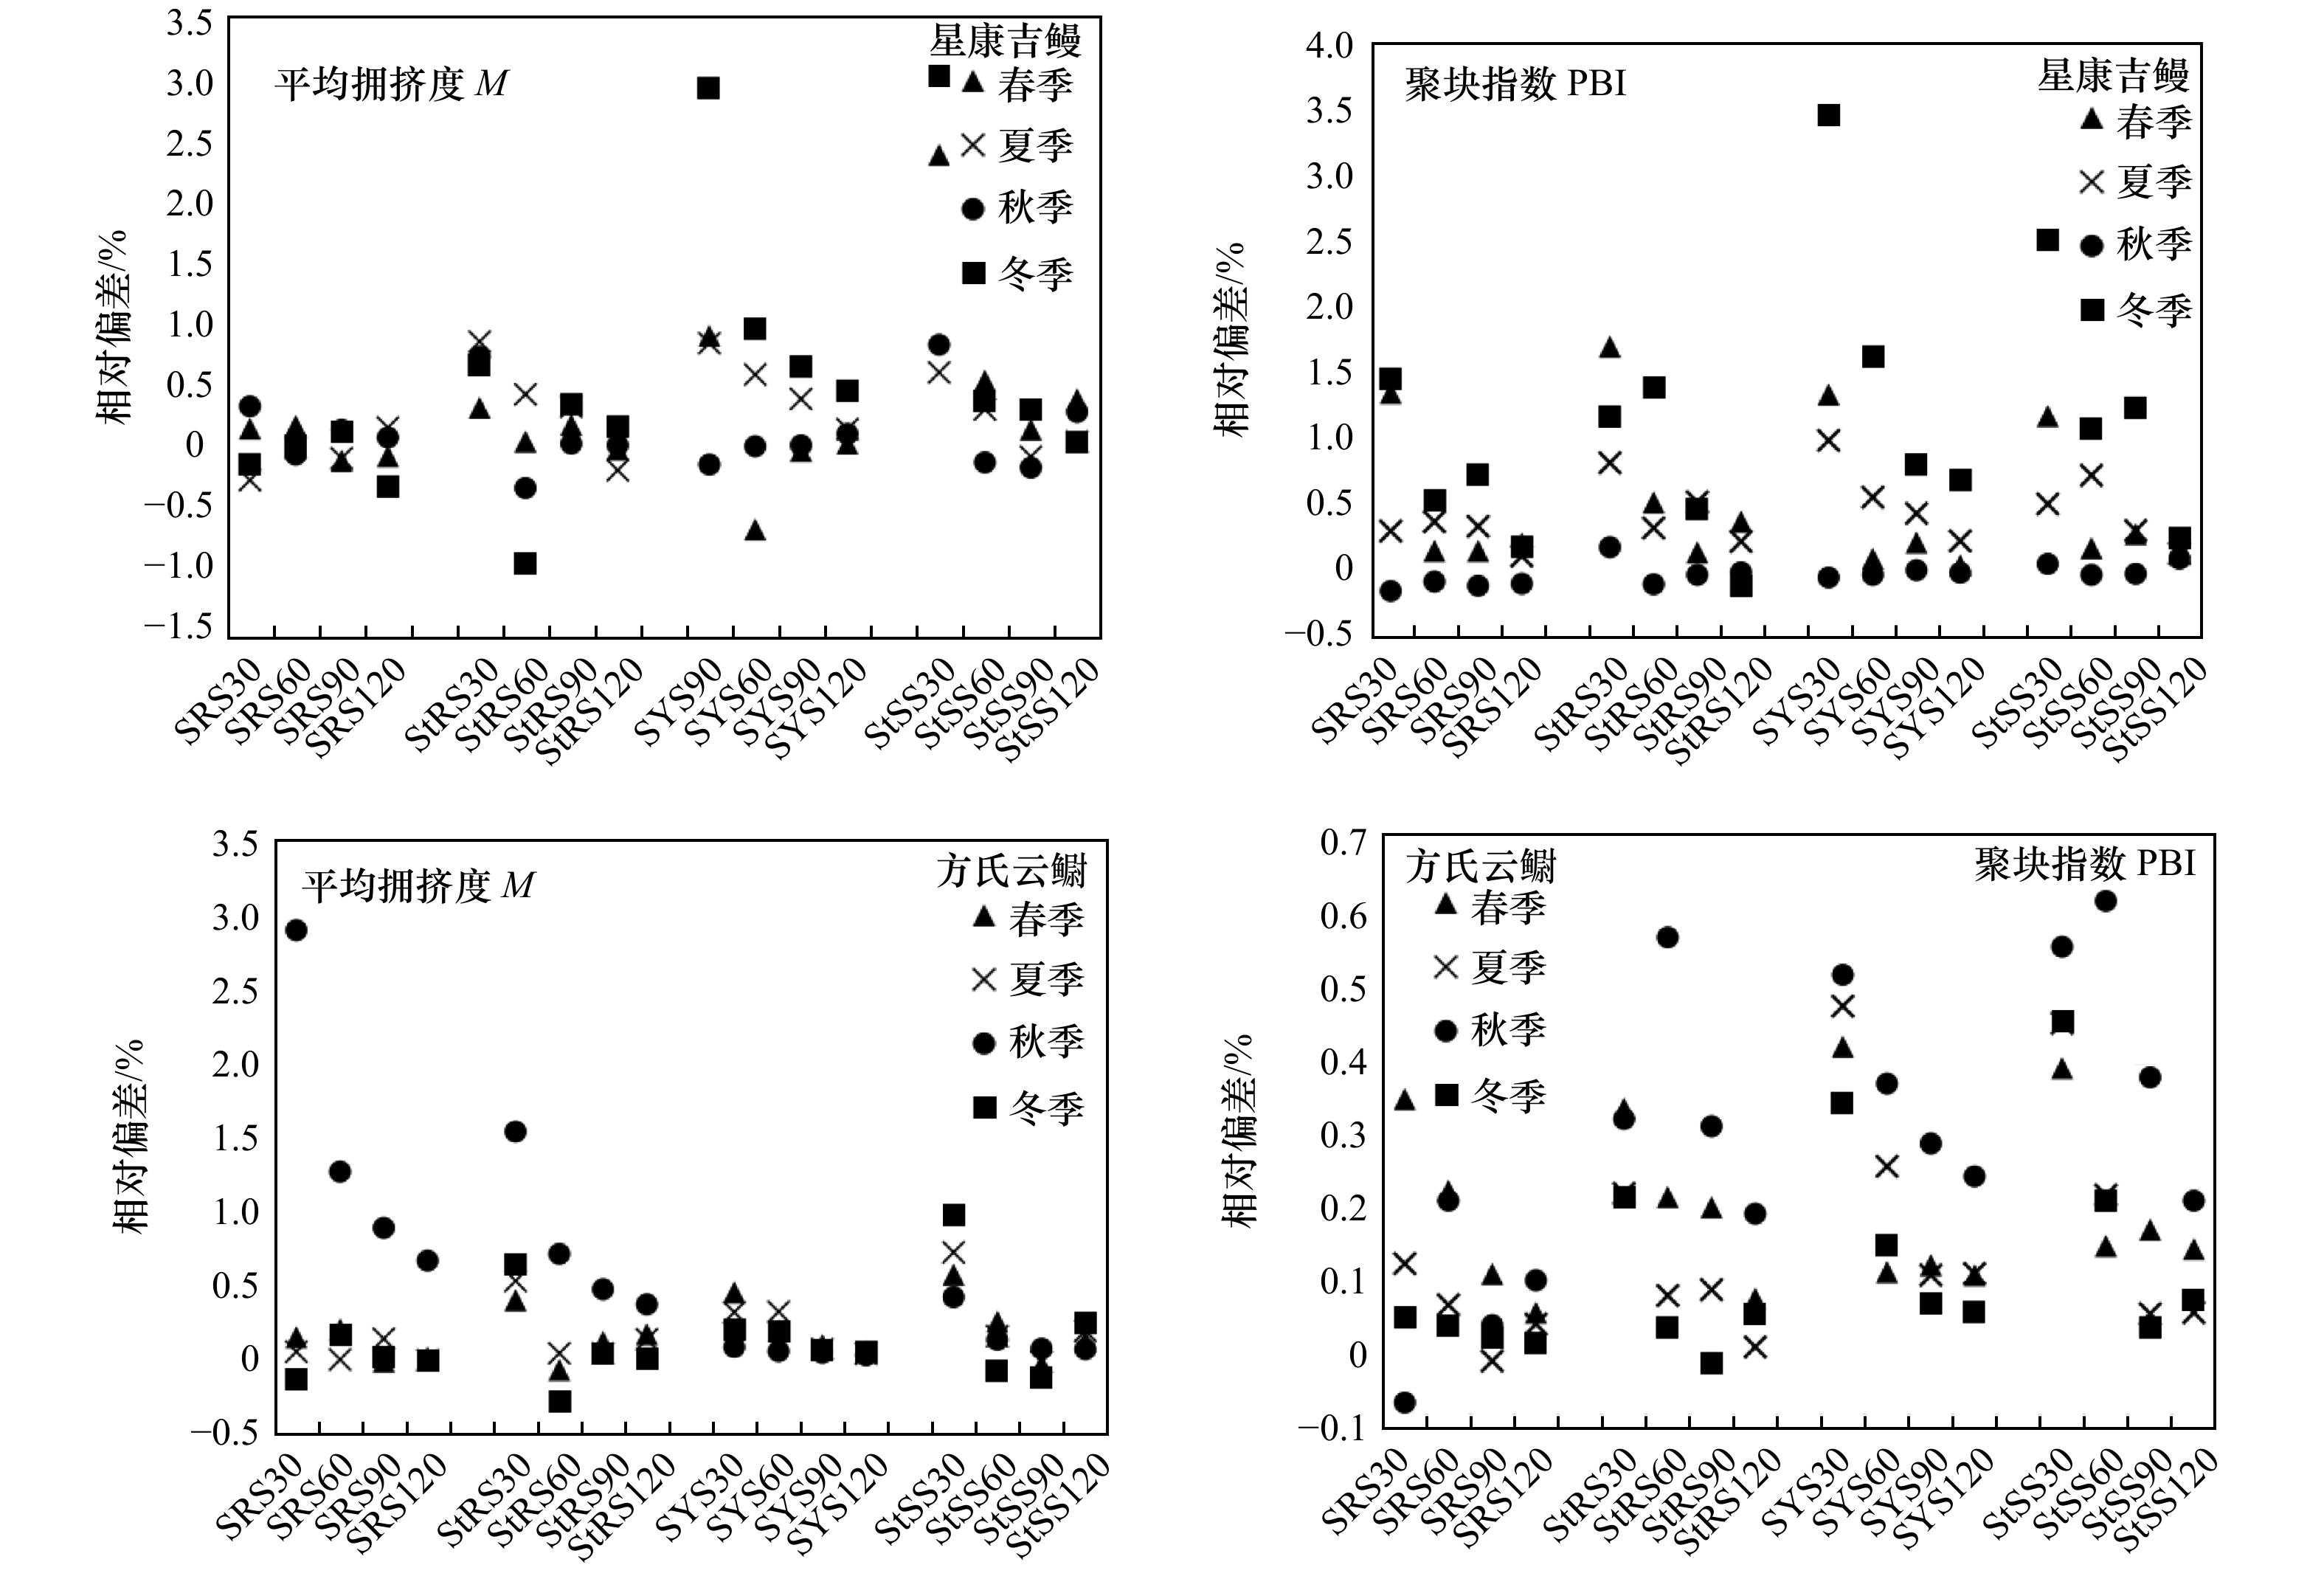
图 5 不同采样设计下目标鱼种空间格局指数的相对偏差
SRS表示简单随机抽样;SYS表示系统抽样;StRS表示分层随机抽样;StSS表示分层系统抽样;30、60、90、120表示样本量
Fig. 5 The relative bias of spatial pattern index for target species for different sampling designs
SRS indicates simple random sampling; SYS indicates system atic sampling; StRS indicates stratified random sampling; StSS indicates stratified system atic sampling; 30, 60, 90, 120 represent sample size
表 1 山东半岛南部海域目标鱼种的相对资源量及空间格局指数
Tab. 1 The relative abundance and spatial pattern indices of two target fish species in the southern waters off Shandong Peninsula
季节 星康吉鳗 方氏云鳚 相对资源量(均值±标准差)/(kg·h−1) 平均拥挤度 聚块指数 相对资源量(均值±标准差)/(kg·h−1) 平均拥挤度 聚块指数 春 3.628±2.775 4.756 1.311 6.945±1.777 6.399 0.921 夏 3.666±2.061 3.825 1.043 6.576±1.680 6.006 0.913 秋 3.023±0.918 2.303 0.762 3.368±1.789 3.324 0.987 冬 1.808±1.914 2.836 1.569 4.000±1.130 3.318 0.830 -
[1] 何大仁, 蔡厚才. 鱼类行为学[M]. 厦门: 厦门大学出版社, 1998: 236−266.He Daren, Cai Houcai. Fish Behavior Ecology[M]. Xiamen: Xiamen University Press, 1998: 236−266. [2] 蔡建堤, 徐春燕, 马超, 等. 闽东北海域中华管鞭虾种群聚集特性[J]. 生态学报, 2017, 37(6): 1844−1850.Cai Jiandi, Xu Chunyan, Ma Chao, et al. Aggregations of the Solenocera crassicornis in the sea area northeast of Fujian[J]. Acta Ecologica Sinica, 2017, 37(6): 1844−1850. [3] 林龙山, 郑元甲, 马春艳. 台湾海峡夏秋季游泳动物资源分布及群落结构[J]. 应用生态学报, 2005, 16(10): 1948−1951. doi: 10.3321/j.issn:1001-9332.2005.10.029Lin Longshan, Zheng Yuanjia, Ma Chunyan. Distribution of nekton stock density and its community structure in Taiwan Strait in summer and autumn[J]. Chinese Journal of Applied Ecology, 2005, 16(10): 1948−1951. doi: 10.3321/j.issn:1001-9332.2005.10.029 [4] 王雨群, 王晶, 薛莹, 等. 黄河口水域主要鱼种的时空生态位宽度和重叠[J]. 中国水产科学, 2019, 26(5): 938−948.Wang Yuqun, Wang Jing, Xue Ying, et al. Width and overlap of spatial and temporal ecological niches for main fish species in the Yellow River estuary[J]. Journal of Fishery Sciences of China, 2019, 26(5): 938−948. [5] 刘勇. 渔业资源评估抽样调查方法的理论探讨与研究[D]. 上海: 华东师范大学, 2012: 13-27.Liu Yong. Theoretical study on the sampling methods of survey for fishery stock estimation[D]. Shanghai: East China Normal University, 2012: 13−27. [6] Cochran W G. Sampling Techniques[M]. 3rd ed. New York: John Wiley & Sons, 1977: 1−16. [7] Yu Hao, Jiao Yan, Su Zhenming, et al. Performance comparison of traditional sampling designs and adaptive sampling designs for fishery-independent surveys: a simulation study[J]. Fisheries Research, 2012, 113(1): 173−181. doi: 10.1016/j.fishres.2011.10.009 [8] Simmonds E J, Fryer R J. Which are better, random or systematic acoustic surveys? A simulation using North Sea herring as an example[J]. ICES Journal of Marine Science, 1996, 53(1): 39−50. doi: 10.1006/jmsc.1996.0004 [9] 韩青鹏, 单秀娟, 金显仕, 等. 多目标资源调查站位优化设计——以渤海为例[J]. 渔业科学进展, 2019, 40(1): 1−11.Han Qingpeng, Shan Xiujuan, Jin Xianshi, et al. Study on optimizing sampling design of multi-objective fishery-independent surveys: a case study in the Bohai Sea[J]. Progress in Fishery Sciences, 2019, 40(1): 1−11. [10] Xu Binduo, Ren Yiping, Chen Yong, et al. Optimization of stratification scheme for a fishery-independent survey with multiple objectives[J]. Acta Oceanologica Sinica, 2015, 34(12): 154−169. doi: 10.1007/s13131-015-0739-z [11] 陈大刚. 黄渤海渔业生态学[M]. 北京: 海洋出版社, 1991: 8-12.Chen Dagang. Fisheries Ecology in the Yellow Sea and Bohai Sea[M]. Beijing: China Ocean Press, 1991: 8−12. [12] 唐启升, 叶懋中. 山东近海渔业资源开发与保护[M]. 北京: 农业出版社, 1990: 137-144.Tang Qisheng, Ye Maozhong. The Exploitation and Conservation of Near-shore Fisheries Resources of Shandong[M]. Beijing: China Agriculture Press, 1990: 137−144. [13] 李敏, 李增光, 徐宾铎, 等. 时空和环境因子对海州湾方氏云鳚资源丰度分布的影响[J]. 中国水产科学, 2015, 22(4): 812−819.Li Min, Li Zengguang, Xu Binduo, et al. Effects of spatiotemporal and environmental factors on the distribution and abundance of Pholis fangi in Haizhou Bay using a generalized additive model[J]. Journal of Fishery Sciences of China, 2015, 22(4): 812−819. [14] 张春光. 中国动物志·硬骨鱼纲: 鳗鲡目、背棘鱼目[M]. 北京: 科学出版社, 2010: 199-203.Zhang Chunguang. Fauna Sinica—Osteichthyes: Anguilliformes, Notacanthiformes[M]. Beijing: Science Press, 2010: 199−203. [15] 中华人民共和国国家质量监督检验检疫总局, 中国国家标准化管理委员会. GB/T 12763.6−2007, 海洋调查规范 第6部分: 海洋生物调查[S]. 北京: 中国标准出版社, 2007.General Administration of Quality Supervision, Inspection and Quarantine of the People’s Republic of China, Standardization Administration of the People’s Republic of China. GB/T 12763.6−2007 Specifications for oceanographic survey—Part 6: Marine biological survey[S]. Beijing: Standards Press of China, 2007. [16] 牟秀霞, 李明坤, 尹洁, 等. 山东半岛东南部海域星康吉鳗资源密度时空分布及其与环境因子之间关系[J]. 水产学报, 2019, 43(8): 1759−1767.Mu Xiuxia, Li Mingkun, Yin Jie, et al. Relationship between spatio-temporal distribution of Conger myriaster and the environment factors in the southeast waters of Shandong Peninsula[J]. Journal of Fisheries of China, 2019, 43(8): 1759−1767. [17] 毕远溥. 方氏云鳚渔业生物学及其在辽宁沿海的渔业[J]. 水产科学, 2005, 24(9): 27−28. doi: 10.3969/j.issn.1003-1111.2005.09.009Bi Yuanpu. Biology and its fishery of Fang’s blenny Enedrias fangi Wang et Wang in offshore in Liaoning Province[J]. Fisheries Science, 2005, 24(9): 27−28. doi: 10.3969/j.issn.1003-1111.2005.09.009 [18] Journel A G, Huijbregts C J. Mining Geostatistics[M]. London: Academic Press, 1978. [19] Lloyd M. Mean crowding[J]. Journal of Animal Ecology, 1967, 36(1): 1−30. doi: 10.2307/3012 [20] 张金屯. 数量生态学[M]. 2版. 北京: 科学出版社, 2011: 259-269.Zhang Jintun. Quantitative Ecology[M]. 2nd ed. Beijing: Science Press, 2011: 259−269. [21] Chen Yong. A monte Carlo study on impacts of the size of subsample catch on estimation of fish stock parameters[J]. Fisheries Research, 1996, 26(3/4): 207−223. [22] Paloheimo J E, Chen Y. Estimating fish mortalities and cohort sizes[J]. Canadian Journal of Fisheries and Aquatic Sciences, 1996, 53(7): 1572−1579. doi: 10.1139/f96-077 [23] Wang Jing, Xu Binduo, Zhang Chongliang, et al. Evaluation of alternative stratifications for a stratified random fishery-independent survey[J]. Fisheries Research, 2018, 207: 150−159. doi: 10.1016/j.fishres.2018.06.019 [24] Cao Jie, Chen Yong, Chang J H, et al. An evaluation of an inshore bottom trawl survey design for American lobster (Homarus americanus) using computer simulations[J]. Journal of Northwest Atlantic Fishery Science, 2014, 46: 27−39. doi: 10.2960/J.v46.m696 [25] 李明坤, 张崇良, 李敏, 等. 山东南部近海秋、冬季星康吉鳗分布与环境因子的关系[J]. 中国水产科学, 2018, 25(5): 1115−1122. doi: 10.3724/SP.J.1118.2018.17426Li Mingkun, Zhang Chongliang, Li Min, et al. Relationship between the spatiotemporal distribution of Conger myriaster and environmental factors in the southern waters off the Shandong Peninsula during autumn and winter[J]. Journal of Fishery Sciences of China, 2018, 25(5): 1115−1122. doi: 10.3724/SP.J.1118.2018.17426 [26] 王晶. 渔业资源调查采样设计的评估与优化[D]. 青岛: 中国海洋大学, 2019.Wang Jing. Evaluation and optimization of sampling designs for fishery-independent surveys[D]. Qingdao: Ocean University of China, 2019. [27] Fernandes R F, Scherrer D, Guisan A. How much should one sample to accurately predict the distribution of species assemblages? A virtual community approach[J]. Ecological Informatics, 2018, 48: 125−134. doi: 10.1016/j.ecoinf.2018.09.002 [28] Kurogi H, Mochioka N, Okazaki M, et al. Discovery of a spawning area of the common Japanese conger Conger myriaster along the Kyushu-Palau Ridge in the western North Pacific[J]. Fisheries Science, 2012, 78(3): 525−532. doi: 10.1007/s12562-012-0468-6 [29] Gorie S, Nagasawa K. Habitat preference and feeding habits of juvenile whitespotted conger Conger myriaster in the eastern Seto Inland Sea, Japan[J]. Aquaculture Science, 2010, 58(2): 167−179. [30] 刘爱利, 王培法, 丁园圆. 地统计学概论[M]. 北京: 科学出版社, 2012.Liu Aili, Wang Peifa, Ding Yuanyuan. Introduction to Geostatistics[M]. Beijing: Science Press, 2012. [31] 于新文, 刘晓云. 昆虫种群空间格局的研究方法评述[J]. 西北林学院学报, 2001, 16(3): 83−87. doi: 10.3969/j.issn.1001-7461.2001.03.022Yu Xinwen, Liu Xiaoyun. Review of research methods on spatial pattern of insect population[J]. Journal of Northwest Forestry University, 2001, 16(3): 83−87. doi: 10.3969/j.issn.1001-7461.2001.03.022 -


 下载:
下载:


