

Determination of tropical cyclone location and intensity using HY-2B scatterometer data
-
摘要: 热带气旋灾害是最严重的自然灾害之一,其影响程度主要取决于气旋的中心位置和强度。提高热带气旋中心位置及强度监测水平对于改进热带气旋分析预报精度、减少热带气旋的灾害影响具有重要意义。本文以HY-2B散射计为例,分析了散射计风场散度和旋度的分布特征,发现气旋中心附近风场的散度或旋度具有显著的分布规律,由此提出了一种新的气旋中心定位方法,并与传统的直接定位法进行比较研究。在此基础上,进一步提出了热带气旋风圈大小估计的方法,用于评估气旋的强度。最后,利用台风“范斯高”和“博罗依”的遥感数据对文中的方法进行验证,结果表明,使用新方法定位的气旋中心位置与最佳路径之间的差异小于20 km,散射计17 m/s风圈大小的变化一定程度上反映了气旋的发展规律。Abstract: Tropical cyclone disaster is one of the most serious natural disasters, and its impact mainly depends on the center location and the intensity. Monitoring the location and the intensity of tropical cyclones is of great significance for improving the accuracy of tropical cyclone forecast and for reducing the impact of tropical cyclone disasters. In this paper, the characteristics of the HY-2B scatterometer wind field, as well as its divergence and curl, are analyzed. It is found that the divergence or curl of the wind field near the cyclone center shows remarkable signatures, such that a new method is proposed to identify the cyclone center, and then the results are compared with the conventional method. Moreover, a method for estimating the size of the tropical cyclone is introduced to evaluate the cyclone intensity. Finally, the remote sensing data of Typhoon Francisco and Typhoon Bualoi are used to verify the proposed methods. The results show that the difference between the cyclone center position determined by the scatterometer and the one of the optimal path is generally less than 20 km. Meanwhile, the determined wind radii correspond well with the development of the tropical cyclone.
-
Key words:
- scatterometer /
- tropical cyclone /
- center locating /
- wind radii /
- HY-2B satellite
-
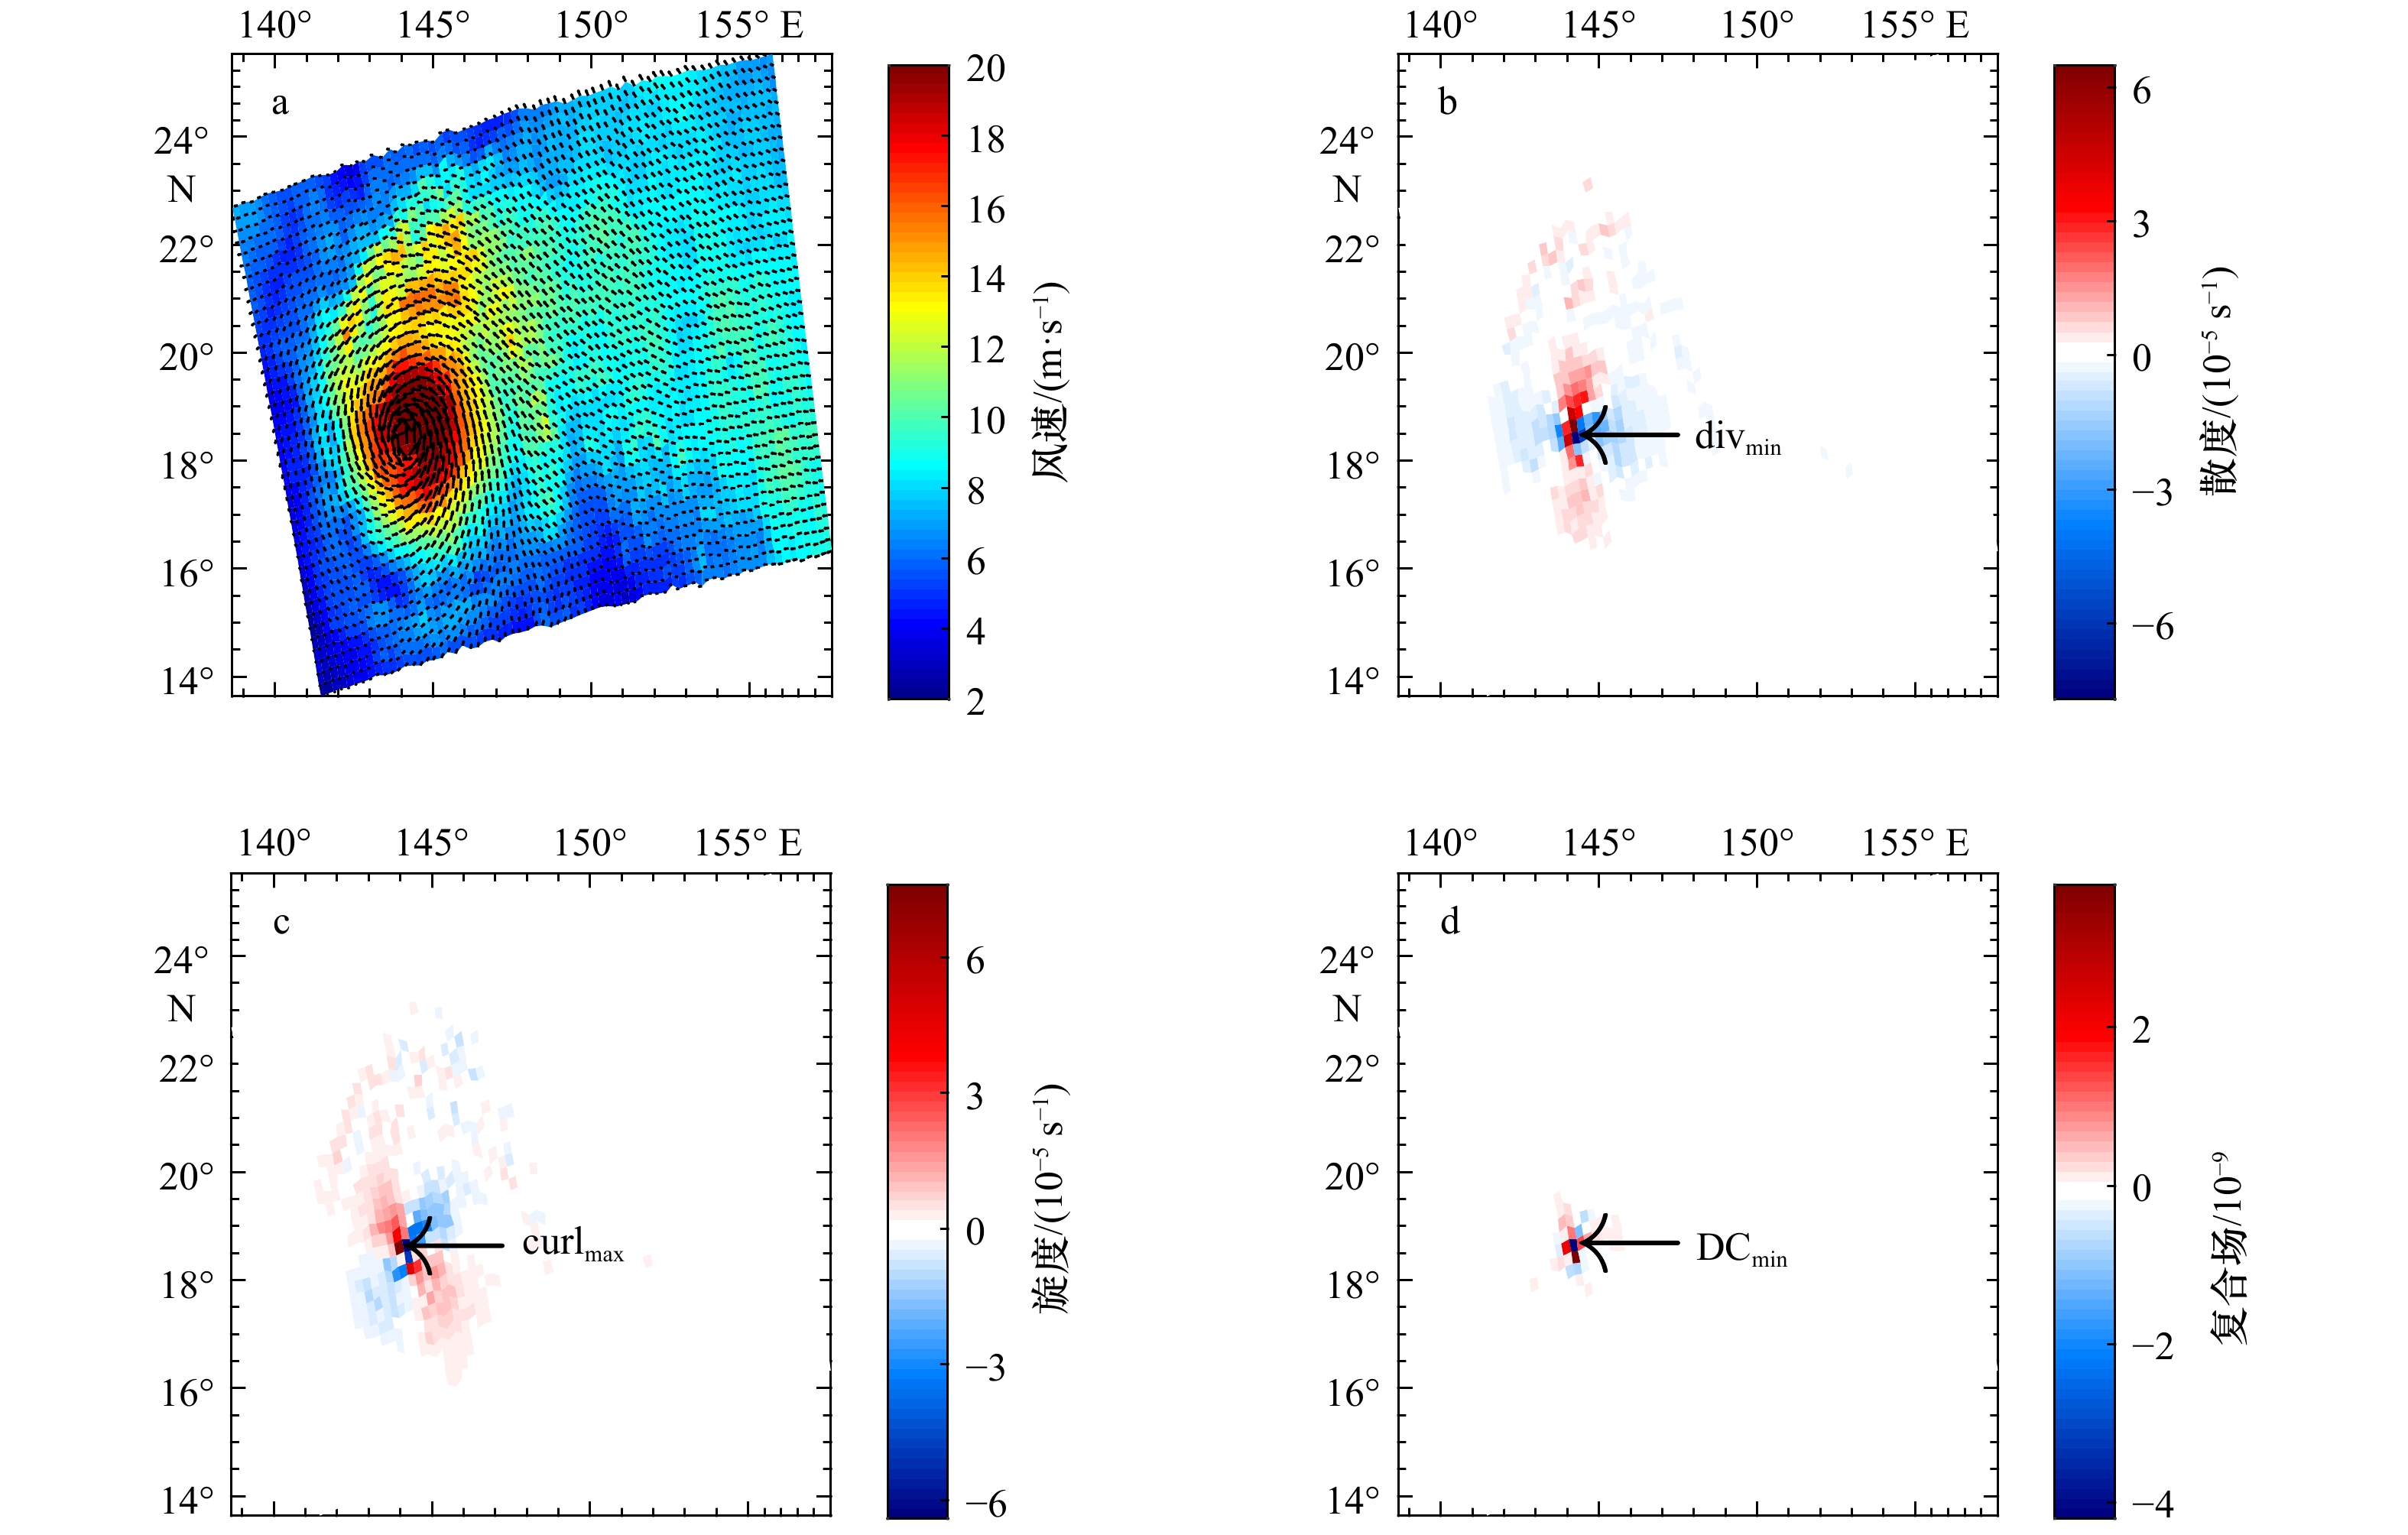
图 5 直接定位法定位台风中心位置
a. 风矢量场;b. 散度场;c. 旋度场;d. 复合场
Fig. 5 Typhoon center’s location by locating directly
a. Wind stress component; b. divergence field; c. curl field; d. DC field

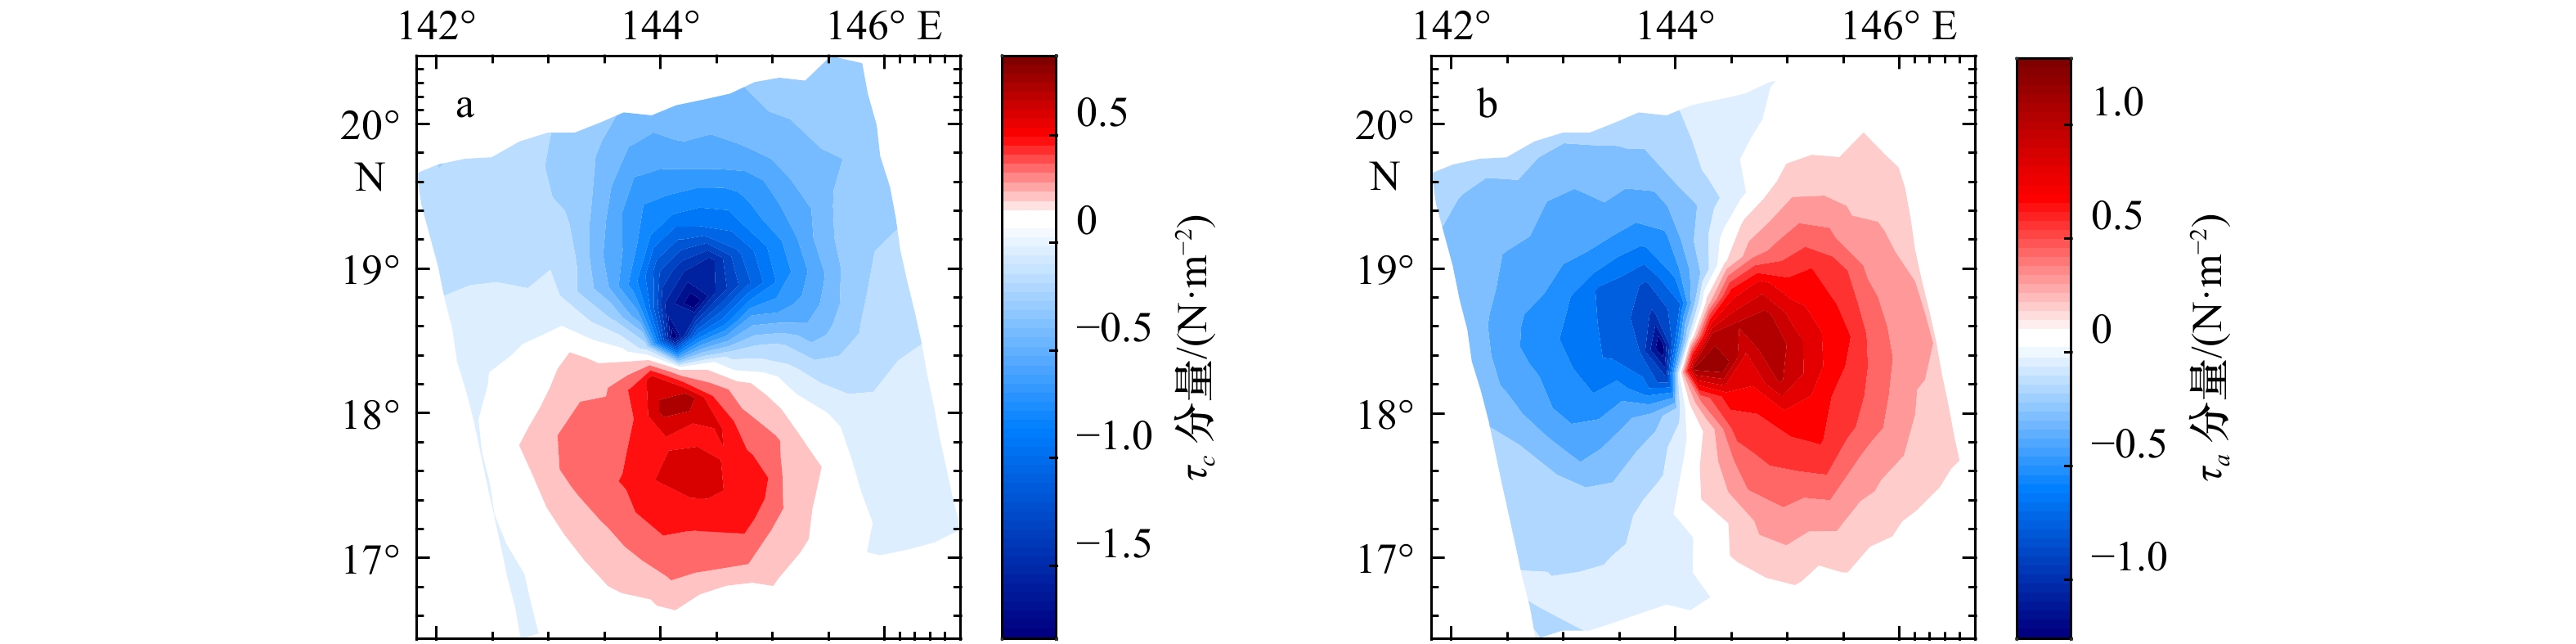
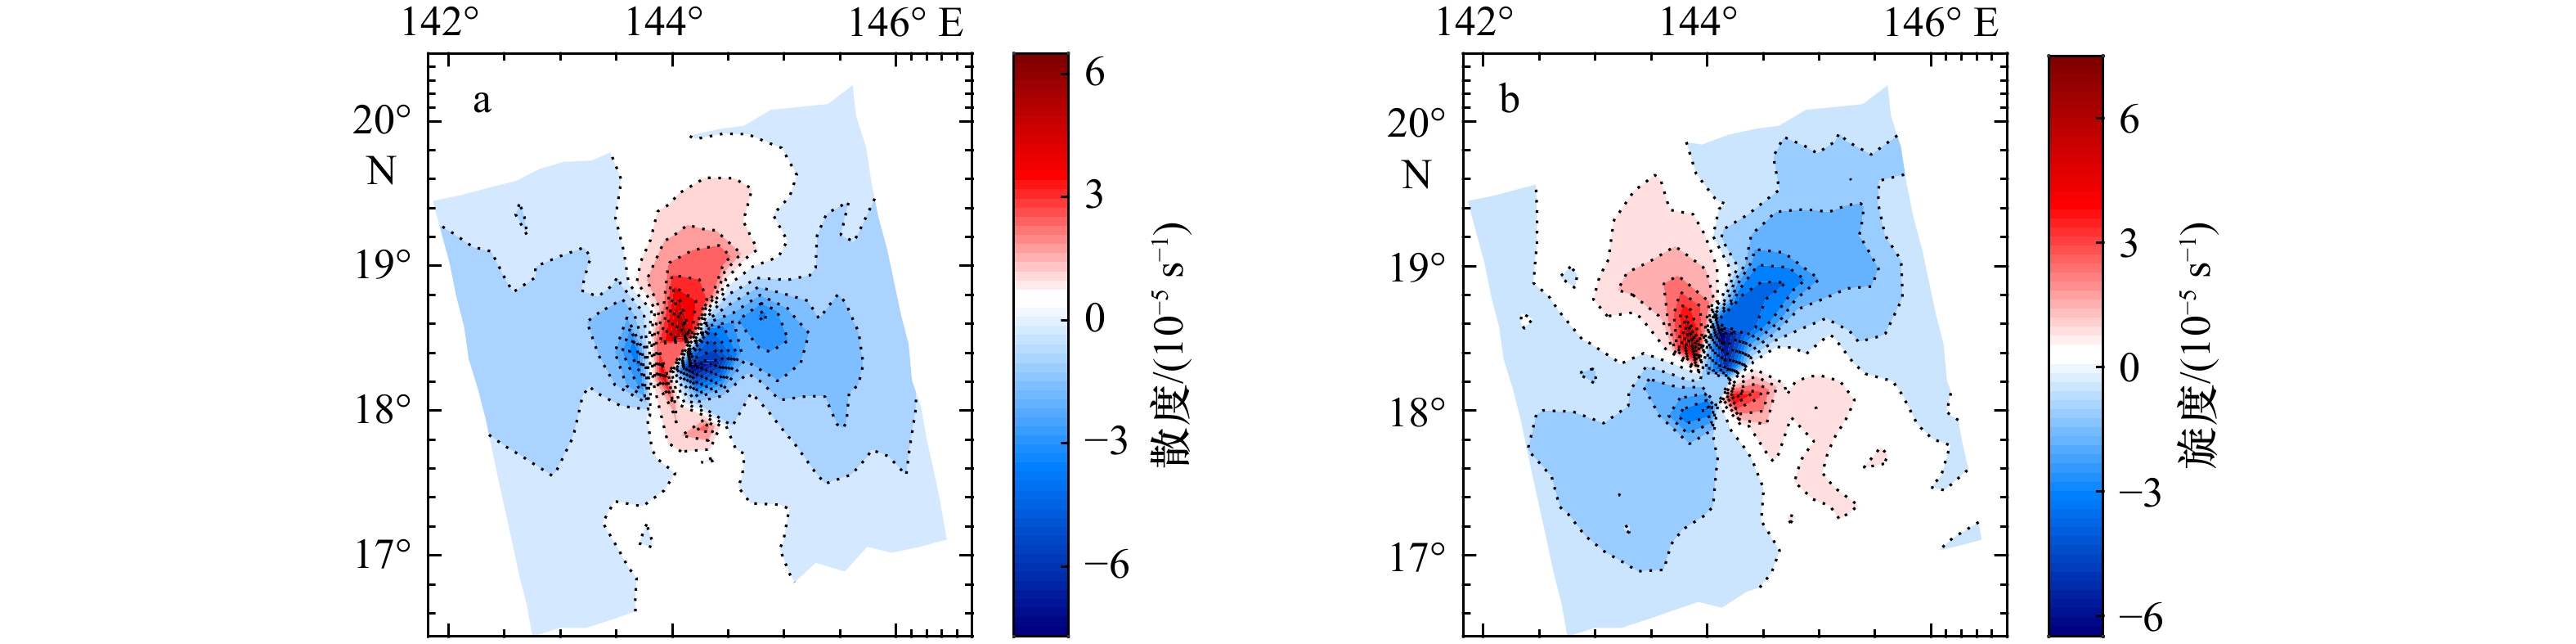
图 8 利用风场特征参数的空间几何特征定位热带气旋中心
a. 风应力分量;b. 散度场;c. 旋度场;d. 定位结果显示,风应力分量(绿色三角)、散度(红色矩形)、旋度(蓝色圆形)、最佳路径插值数据(黄色十字)
Fig. 8 Tropical cyclone center locating by wind field characteristic parameters’ spatial geometric signatures
a. Wind stress component; b. divergence field; c. curl field; d. the location results show, wind stress component (green triangle), divergence (red rectangle), curl (blue circle), data interpolated through the best track dataset (yellow cross)

图 9 计算17 m/s风圈半径方法
a. 24个有效方位;b. 海面风速剖面示例
Fig. 9 The method of calculating the 17 m/s wind radii
a. 24 effective azimuths; b. example diagram of sea surface wind speed profile
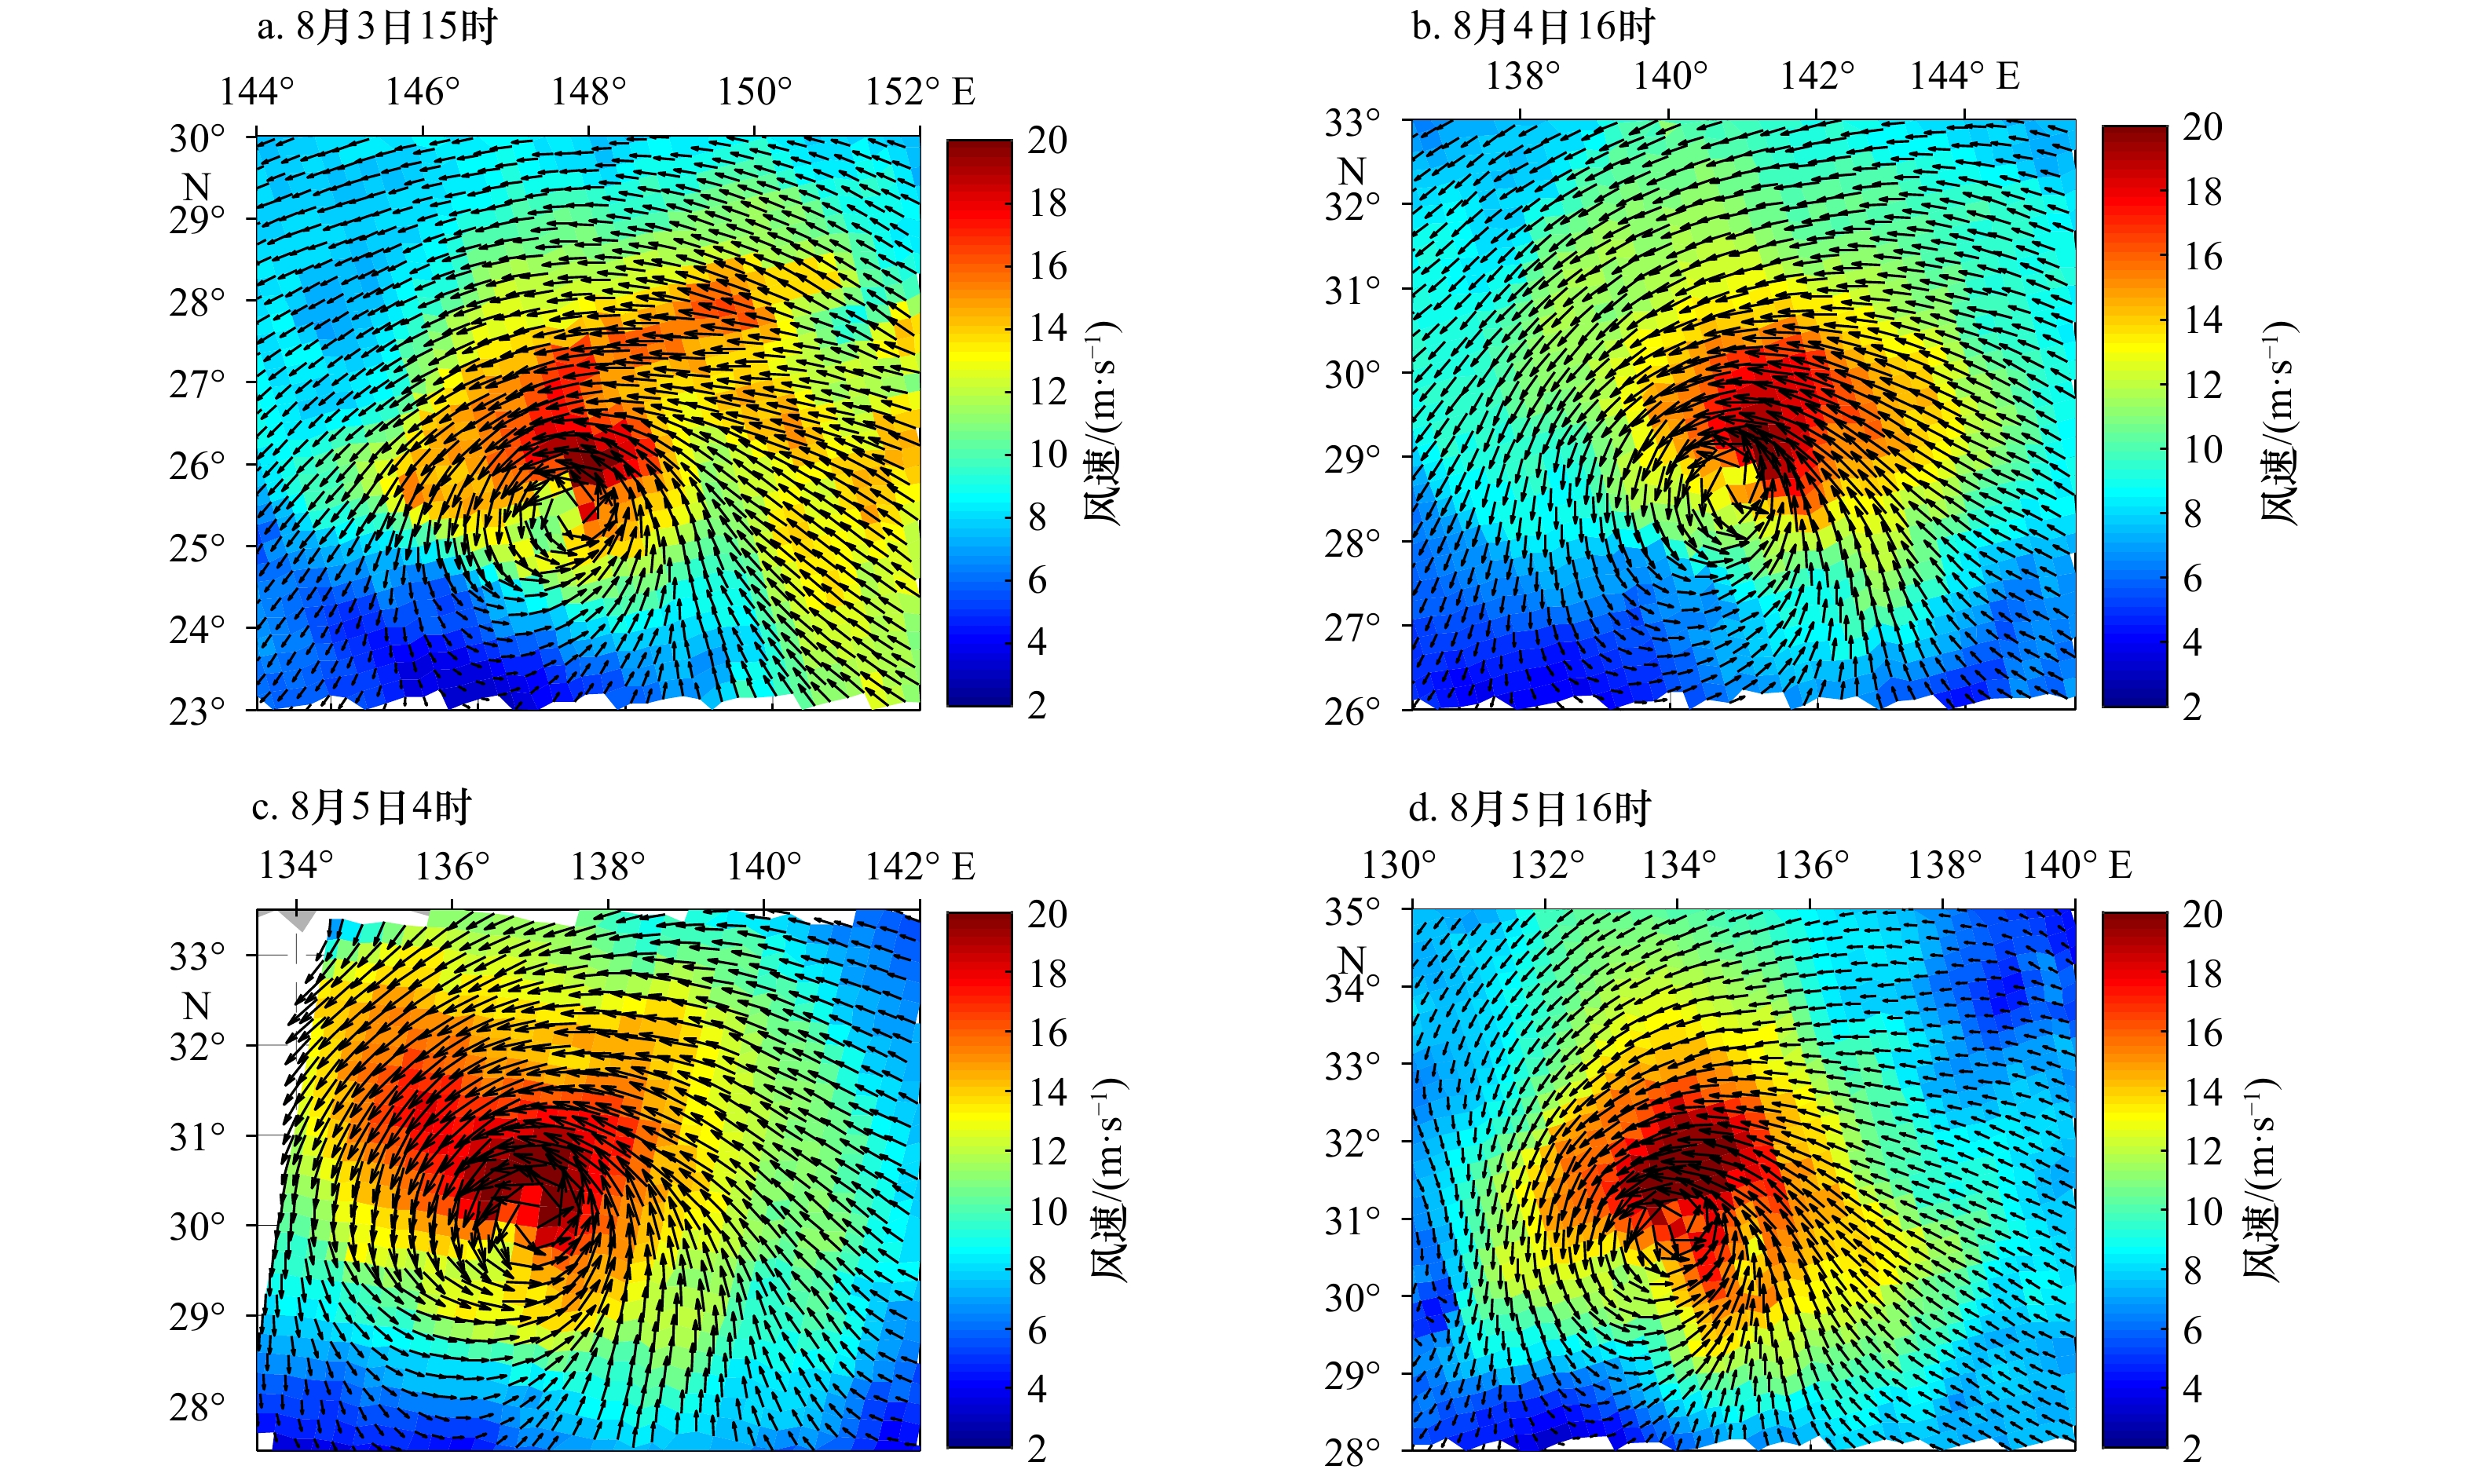
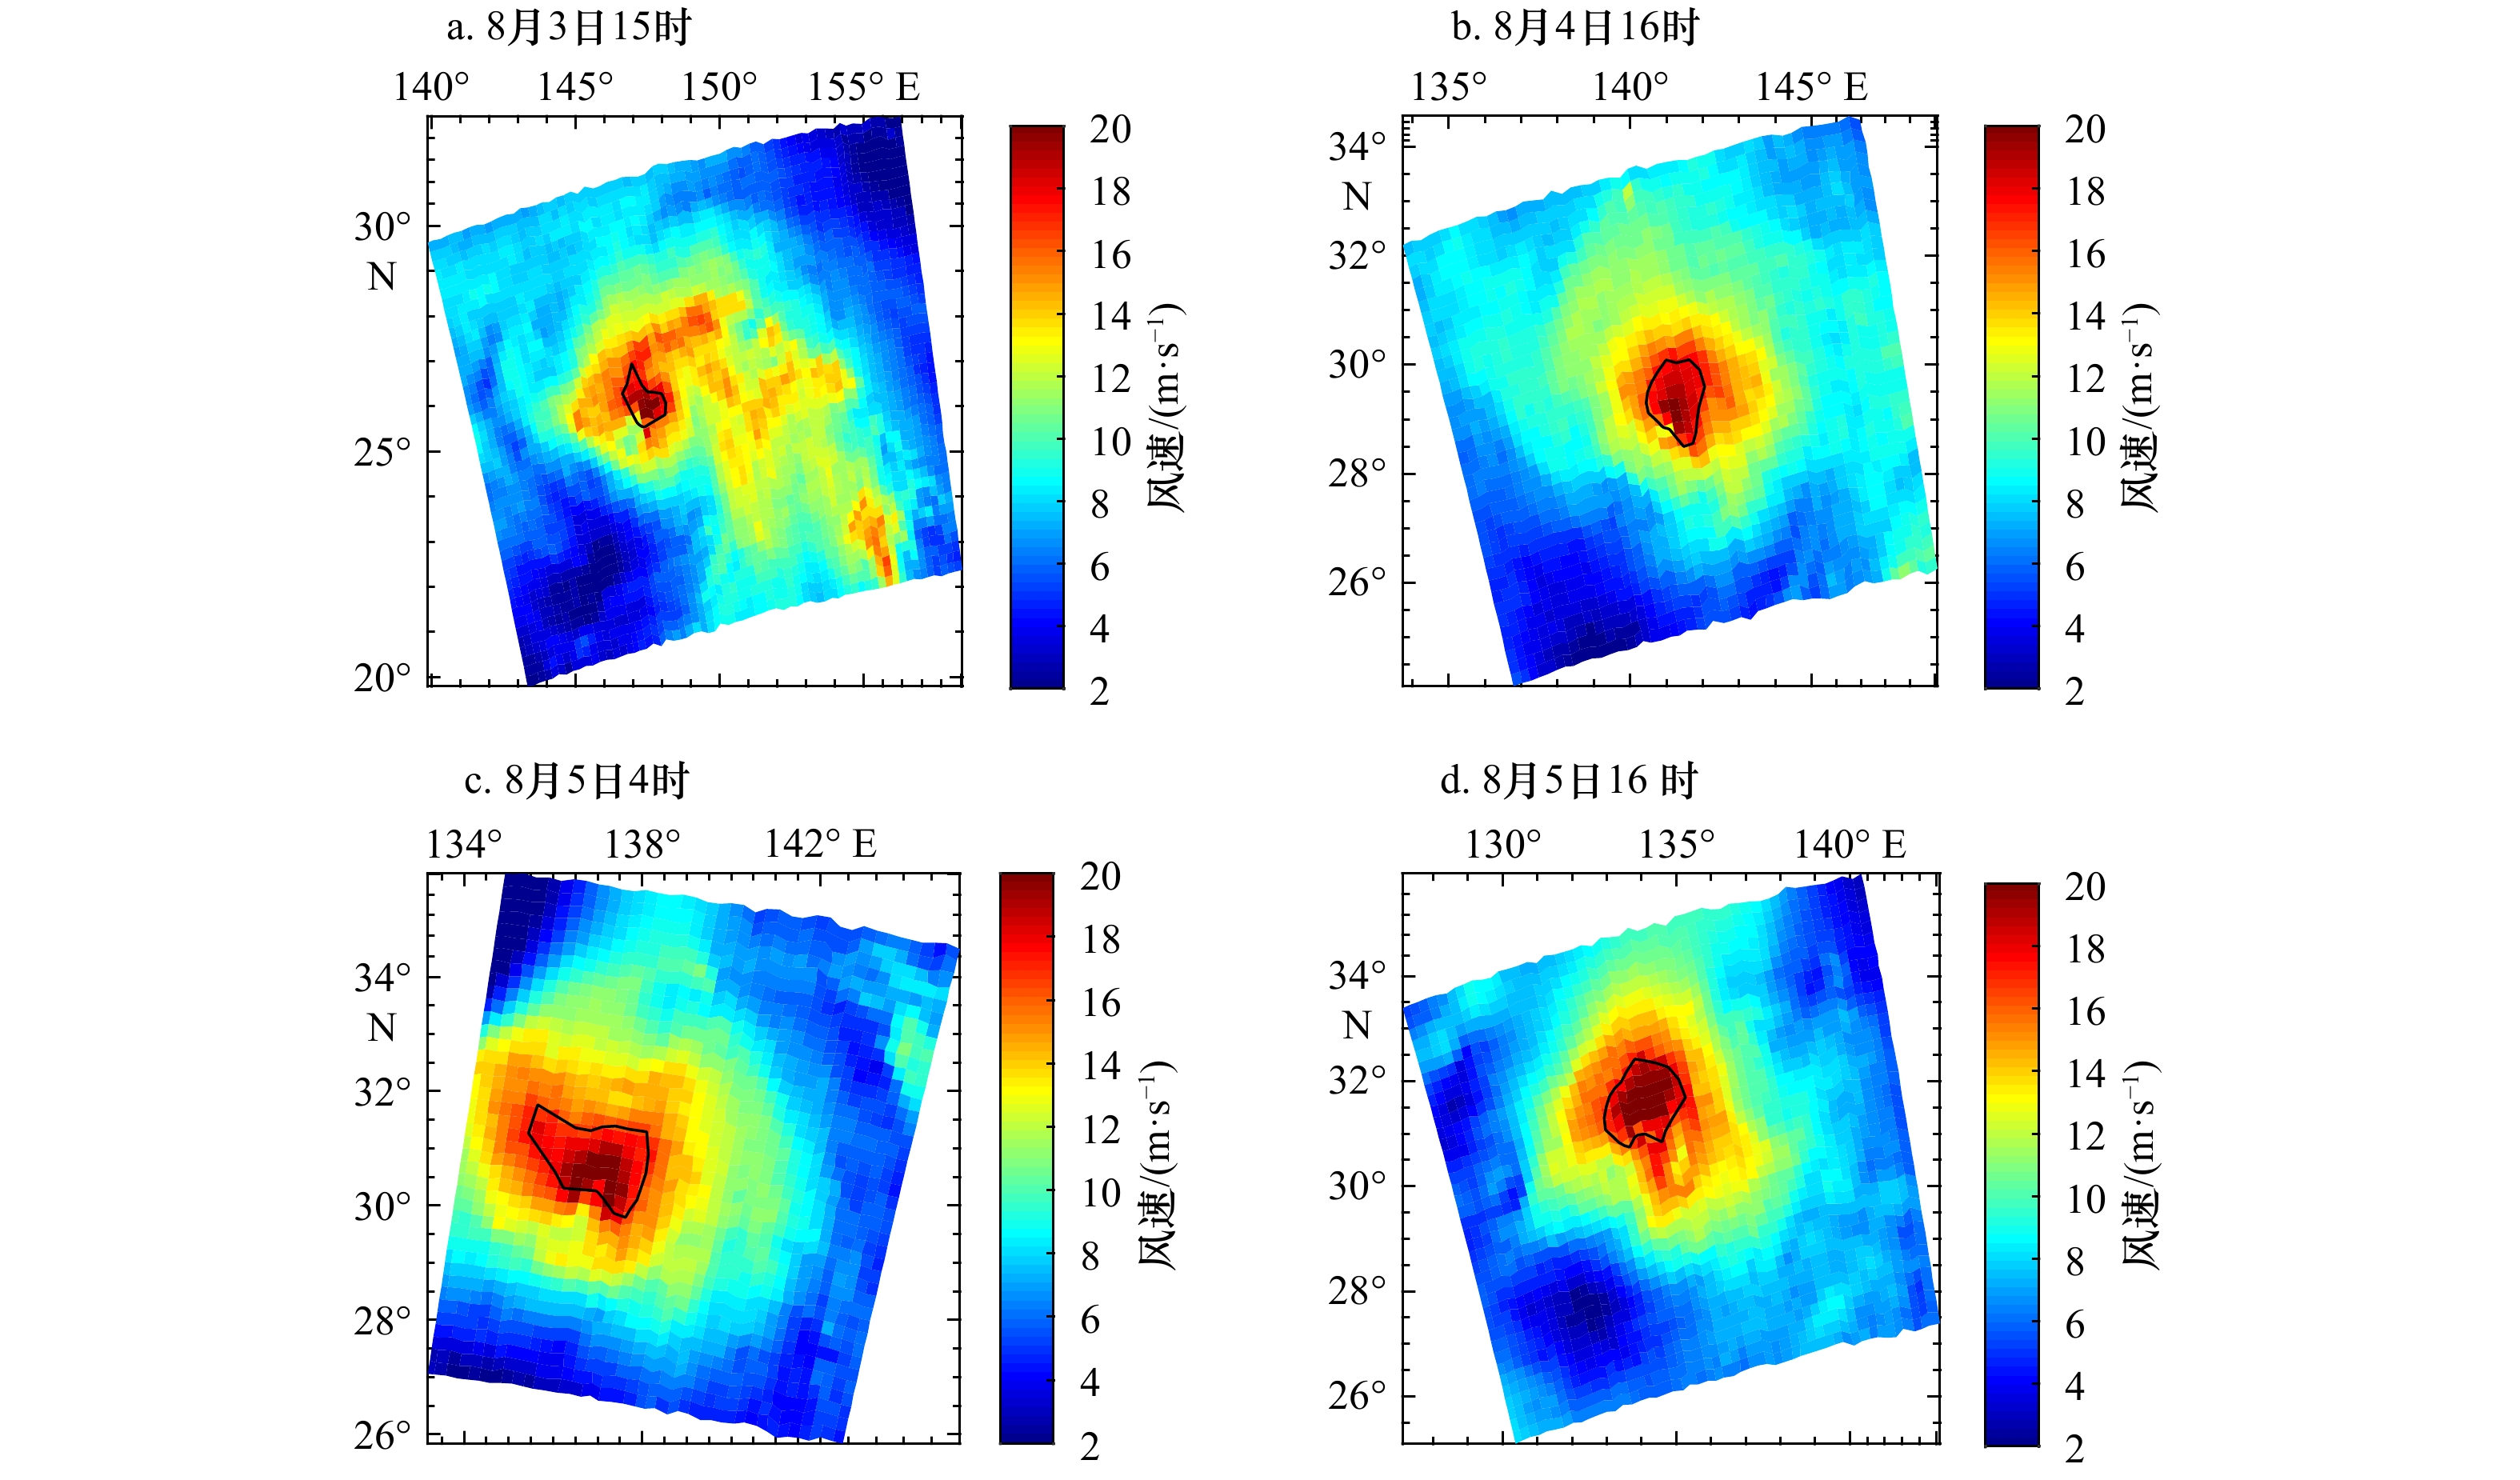
表 1 4个时刻的台风“范斯高”强度对比
Tab. 1 Intensity’s contrast of Typhoon Franciscoat four moments
日期
参数8月3日
15时8月4日
16时8月5日
4时8月5日
16时HSCAT R17/km 45.36 66.87 85.67 88.49 HSCAT最大风速/(m·s−1) 21.65 20.91 21.24 26.18 最佳路径最大风速/(m·s−1) 23.00 28.00 32.38 32.64 最佳路径最低气压/hPa 990.00 980.00 974.19 973.24  下载: 导出CSV
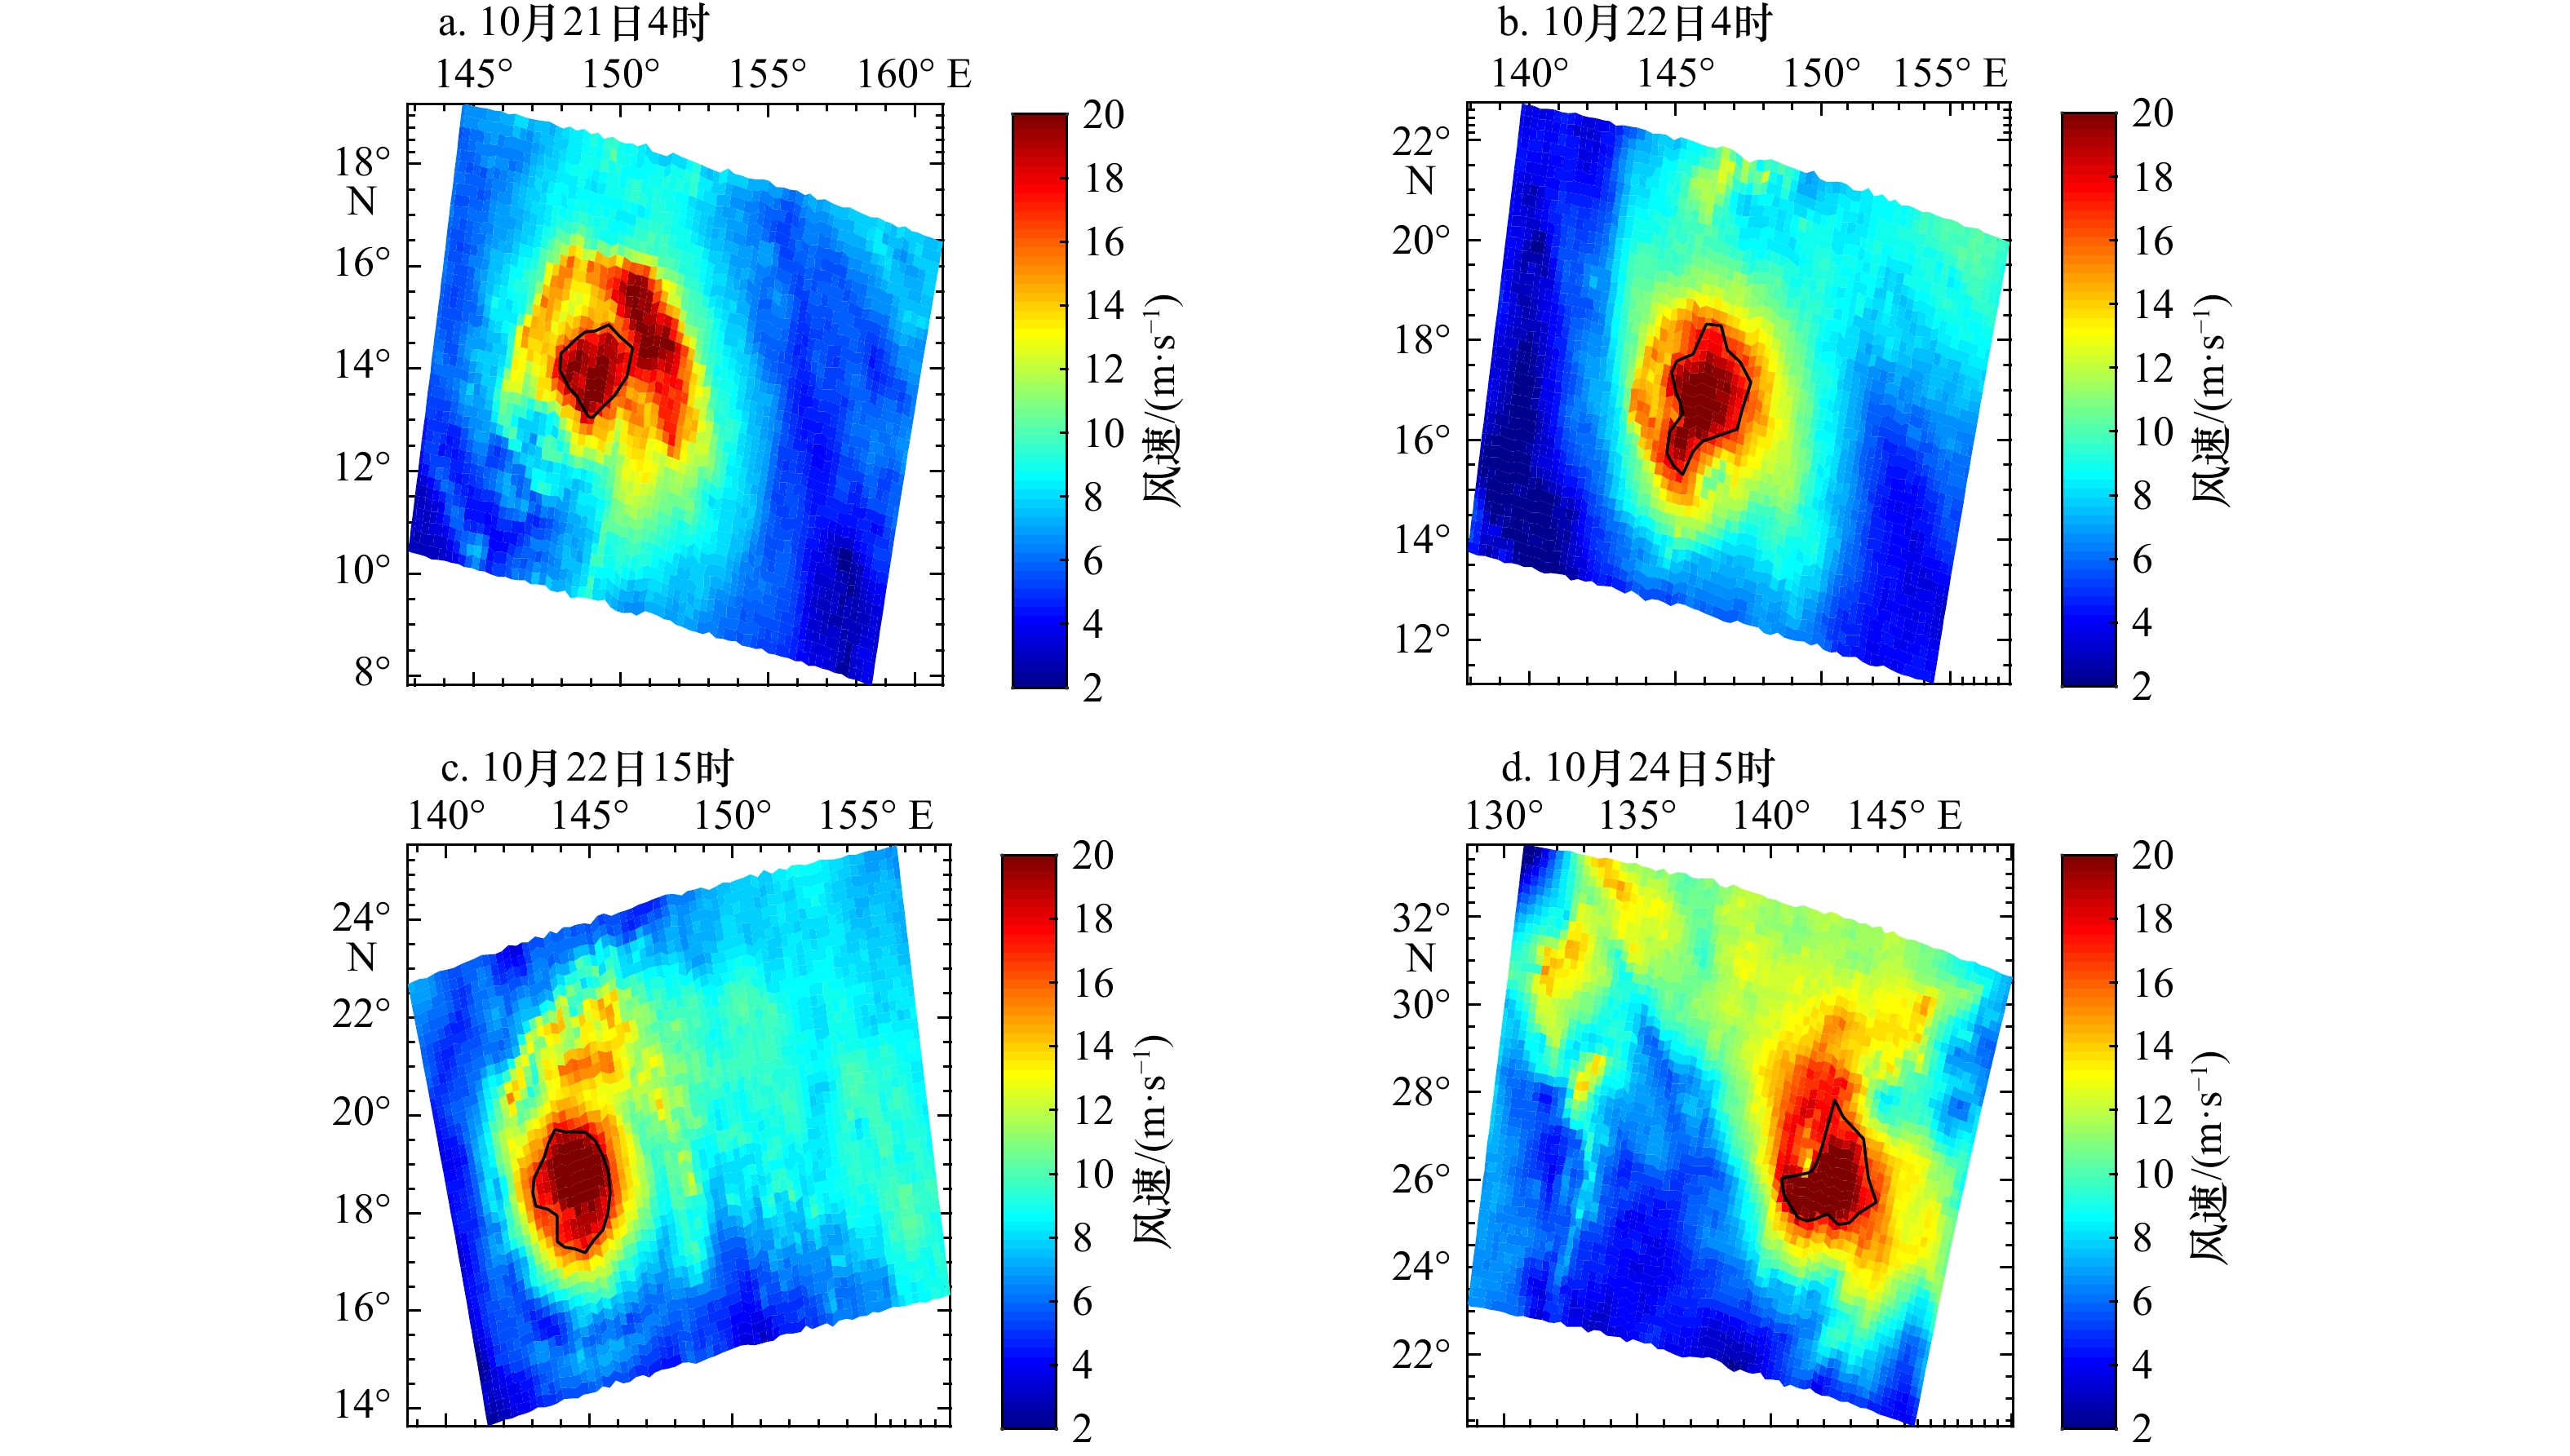
表 2 4个时刻的台风“博罗依”强度对比
Tab. 2 Intensity’s contrast of Typhoon Bualoiat four moments
日期
参数10月21日4时 10月22日4时 10月22日15时 10月24日5时 HSCAT R17/km 75.93 123.50 131.10 126.83 HSCAT最大风速/
(m·s−1)26.64 31.73 26.92 30.42 最佳路径最大风速/
(m·s−1)36.04 50.00 58.00 46.44 最佳路径最低气压/hPa 968.27 940.00 925.00 947.61
下载: 导出CSV
表 3 基于HSCAT数据的台风“范斯高”和台风“博罗依”中心位置对比(单位:km)
Tab. 3 The center locations of Typhoon Francisco and Typhoon Bualoi based on HSCAT (unit: km)
台风“范斯高” 8月3日15时 8月4日16时 8月5日4时 8月5日16时 $ D_1$ $ D_2$ $ D_1$ $ D_2$ $ D_1$ $ D_2$ $ D_1$ $ D_2$ 直接定位法 散度场 41.03 64.89 36.16 36.16 37.98 59.73 18.47 48.68 旋度场 21.70 88.63 39.28 53.30 64.83 32.74 66.27 24.67 复合场 31.36 47.08 43.92 53.30 72.16 50.40 55.24 56.00 几何定位法 风应力分量 46.05 32.64 10.74 13.97 35.75 19.14 6.72 20.03 散度场 12.34 28.76 7.36 20.55 26.98 4.39 6.16 14.96 旋度场 0.60 30.04 12.58 8.40 16.51 16.84 5.23 17.74 台风“博罗依” 10月21日4时 10月22日4时 10月22日15时 10月24日5时 $ D_1$ $ D_2$ $ D_1$ $ D_2$ $ D_1$ $ D_2$ $ D_1$ $ D_2$ 直接定位法 散度场 44.64 54.95 51.38 47.99 12.57 29.86 29.15 29.15 旋度场 39.36 69.51 60.40 25.84 29.26 46.40 84.82 46.45 复合场 26.10 26.10 22.38 27.13 12.48 47.26 25.85 52.99 几何定位法 风应力分量 45.50 22.96 23.14 20.07 13.06 3.44 33.36 22.53 散度场 37.85 45.60 17.13 15.13 17.97 11.70 15.19 16.27 旋度场 52.81 44.58 20.36 6.66 19.32 19.32 6.67 30.13
下载: 导出CSV
表 4 基于ASCAT数据的台风“范斯高”和台风“博罗依”中心位置对比(单位:km)
Tab. 4 The center locations of Typhoon Francisco and Typhoon Bualoi based on ASCAT (unit: km)
台风“范斯高” 8月3日8时 8月4日7时 8月4日20时 8月5日9时 $ D_1$ $ D_2$ $ D_1$ $ D_2$ $ D_1$ $ D_2$ $ D_1$ $ D_2$ 直接定位法 散度场 22.40 18.06 30.04 64.46 32.68 29.62 22.24 63.14 旋度场 22.40 92.94 18.58 32.20 36.62 31.43 39.73 57.40 复合场 22.40 61.21 7.38 82.00 40.12 14.75 46.73 54.62 几何定位法 风应力分量 27.69 72.72 22.53 44.03 16.26 18.08 16.57 26.35 散度场 32.27 72.80 22.83 30.23 8.21 10.26 7.27 29.53 旋度场 28.12 63.52 20.59 32.28 2.65 12.06 10.50 17.12 台风“博罗依” 10月21日19时 10月22日7时 10月23日8时 10月23日19时 $ D_1$ $ D_2$ $ D_1$ $ D_2$ $ D_1$ $ D_2$ $ D_1$ $ D_2$ 直接定位法 散度场 16.78 13.65 6.86 69.66 7.34 58.62 21.18 22.38 旋度场 36.17 36.17 23.84 26.48 19.34 17.73 29.77 70.83 复合场 14.41 20.65 23.84 70.42 20.38 17.73 21.18 29.53 几何定位法 风应力分量 19.74 13.62 14.93 33.31 5.49 38.13 9.71 21.24 散度场 14.97 18.23 16.27 21.29 12.91 37.68 41.69 54.86 旋度场 20.26 27.68 19.86 28.60 21.40 42.79 29.77 30.67
下载: 导出CSV
-
[1] 乔文峰. 基于卫星云图的台风定位技术研究[D]. 上海: 上海交通大学, 2012.Qiao Wenfeng. The study of typhoon center locating based on satellite cloud image[D]. Shanghai: Shanghai Jiao Tong University, 2012. [2] 蒋众民. 基于遥感数据的台风识别与中心定位方法研究[D]. 哈尔滨: 哈尔滨工业大学, 2018.Jiang Zhongmin. Research on typhoon recognition and centering based on remote sensing data[D]. Harbin: Harbin Institute of Technology, 2018. [3] 庞君如, 王让会, 李博. 基于密度矩阵和卫星修正的台风中心定位仿真[J]. 计算机仿真, 2019, 36(6): 398−402. doi: 10.3969/j.issn.1006-9348.2019.06.082Pang Junru, Wang Ranghui, Li Bo. Typhoon center positioning simulation based on density matrix and satellite correction[J]. Computer Simulation, 2019, 36(6): 398−402. doi: 10.3969/j.issn.1006-9348.2019.06.082 [4] 刘佳, 王旭东. 一种利用FY-2卫星数据的台风中心定位方法[J]. 遥感信息, 2020, 35(2): 25−29. doi: 10.3969/j.issn.1000-3177.2020.02.005Liu Jia, Wang Xudong. A method of typhoon center positioning using FY-2 satellite data[J]. Remote Sensing Information, 2020, 35(2): 25−29. doi: 10.3969/j.issn.1000-3177.2020.02.005 [5] Jaiswal N, Ha D T T, Kishtawal C M. Estimation of size of tropical cyclones in the North Indian Ocean using Oceansat-2 scatterometer high-resolution wind products[J]. Theoretical and Applied Climatology, 2019, 136(1): 45−53. [6] Hu Tangao, Wu Yiyue, Zheng Gang, et al. Tropical cyclone center automatic determination model based on HY-2 and QuikSCAT wind vector products[J]. IEEE Transactions on Geoscience and Remote Sensing, 2019, 57(2): 709−721. doi: 10.1109/TGRS.2018.2859819 [7] 赵勇, 赵朝方, 孙如瑶. HY-2A散射计数据在台风“苏力”海表面风场结构研究中的应用[J]. 海洋湖沼通报, 2017(2): 39−47.Zhao Yong, Zhao Chaofang, Sun Ruyao. Application of HY-2A/SCAT records to understanding the surface wind field structure of typhoon Soulik[J]. Transactions of Oceanology and Limnology, 2017(2): 39−47. [8] Dickey T D, Nencioli F, Kuwahara V S, et al. Physical and bio-optical observations of oceanic cyclones west of the island of Hawai’i[J]. Deep-Sea Research Part II: Topical Studies in Oceanography, 2008, 55(10/13): 1195−1217. [9] 王晓霞, 刘建强, 张毅, 等. 基于卫星微波散射计风场的台风中心定位方法比较研究[J]. 海洋预报, 2020, 37(5): 24−33. doi: 10.11737/j.issn.1003-0239.2020.05.003Wang Xiaoxia, Liu Jianqiang, Zhang Yi, et al. Comparative study on typhoon center locating based on satellite microwave scatterometer wind field[J]. Marine Forecasts, 2020, 37(5): 24−33. doi: 10.11737/j.issn.1003-0239.2020.05.003 [10] Lee C S, Cheung K K W, Fang W T, et al. Initial maintenance of tropical cyclone size in the Western North Pacific[J]. Monthly Weather Review, 2010, 138(8): 3207−3223. doi: 10.1175/2010MWR3023.1 [11] 杨典, 宋清涛, 蒋兴伟, 等. 基于散射计风场数据的台风强度诊断方法——以海洋二号卫星数据为例[J]. 海洋学报, 2019, 41(1): 151−159.Yang Dian, Song Qingtao Jiang Xingwei, et al. A typhoon intensity estimation technique based on scatterometer winds observed from the HY-2 satellite[J]. Haiyang Xuebao, 2019, 41(1): 151−159. [12] Vogelzang J, Verhoef A. The orientation of seawinds wind vector cells[R]. EUMETSAT, Tech. rep: NWPSAF-KN-TR-003, 2014. https://nwpsaf.eu/publications/tech_reports/nwpsaf-kn-tr-003.pdf. [13] 肖峻, 肖培, 吴双. 亥姆霍兹定理与时变电磁场惟一性定理[J]. 云南大学学报(自然科学版), 2010, 32(S1): 249−251.Xiao Jun, Xiao Pei, Wu Shuang. Helmholtz's theorem and the uniqueness theorem of time-varying electromagnetic field[J]. Journal of Yunnan University, 2010, 32(S1): 249−251. [14] King G P, Portabella M, Lin Wenming, et al. Correlating extremes in wind and stress divergence with extremes in rain over the Tropical Atlantic[R]. Ocean and Sea Ice SAF Scientific Report 312, 2017: 1−35. [15] De Kloe J, Stoffelen A, Verhoef A. Improved use of scatterometer measurements by using stress-equivalent reference winds[J]. IEEE Journal of Selected Topics in Applied Earth Observations and Remote Sensing, 2017, 10(5): 2340−2347. doi: 10.1109/JSTARS.2017.2685242 [16] 曹雪峰, 李庆杰, 邢传玺, 等. 不同风应力拖曳系数对南海北部风暴潮数值模拟的适应性研究[J]. 海洋湖沼通报, 2020(1): 1−8.Cao Xuefeng, Li Qingjie, Xing Chuanxi, et al. Adaptability of drag coefficient to numerical simulation of storm surge in the Northern South China Sea[J]. Transactions of Oceanology and Limnology, 2020(1): 1−8. [17] 寿绍文. 位涡理论及其应用[J]. 气象, 2010, 36(3): 9−18. doi: 10.7519/j.issn.1000-0526.2010.03.002Shou Shaowen. Theory and application of potential vorticity[J]. Meteorological Monthly, 2010, 36(3): 9−18. doi: 10.7519/j.issn.1000-0526.2010.03.002 [18] Merrill R T. A comparison of large and small tropical cyclones[J]. Monthly Weather Review, 1984, 112(7): 1408−1418. doi: 10.1175/1520-0493(1984)112<1408:ACOLAS>2.0.CO;2 -


计量
- 文章访问数: 714
- HTML全文浏览量: 232
- PDF下载量: 70
- 被引次数: 0
