

Impacts of ocean waves on the momentum and energy fluxes across the air-sea interface under tropical cyclones
-
摘要: 海浪不仅决定着海洋表面的粗糙度,由热带气旋引起的海浪,还通过其发展演化控制着大部分的海气之间的动量和能量传递。本文采用热带气旋观测数据IBTrACS和海浪模式WW III的模拟结果探究了热带气旋下海浪对大气向海洋输入的动量和能量的影响。结果发现,近30 a热带气旋的强度约每10 a增加 1 m/s,但移速没有明显变化。热带气旋的强度越大,从大气输入到海浪和从海浪输入到海流中的动量之差和能量之差也越大。由于热带气旋的风场和海浪场都有较强的不对称性,海气动量差和能量差也表现出非均匀分布:动量差较大的区域在热带气旋移动方向的后方,能量差的最大值则分布在右后象限,且二者均为左前方比较小。逆波龄与动量差和能量差呈高度正相关,相关系数约为0.95,说明波越年轻吸收的动量和能量越多。气旋移速越快逆波龄越大,且热带气旋移动速度与动量差和能量差呈正相关,相关系数在0.8以上。因此,海浪影响着大气向海洋输入的动量和能量的分布和大小,在以后关于海洋边界动力学和热力学的研究中,考虑海浪的演化可能会使结果更加准确。Abstract: Ocean waves can affect the roughness of the ocean surface, and the waves generated by tropical cyclones impact the momentum and energy fluxes across the air-sea interface. In this study, the impacts of ocean waves on the momentum and energy fluxes under tropical cyclones is examined by using the tropical cyclone observation dataset IBTrACS (International Best Track Archive for Climate Stewardship) and the simulations from wave model WW III (WAVEWATCH III). It is found that the intensity of tropical cyclones increased by about 1 m/s every decade in the past 30 years, but the change of translation speed is not obvious. For the stronger tropical cyclones, the difference for momentum flux and the energy flux between the air-sea interface can be significantly increased by the waves. Owing to the asymmetry of wind and surface wave fields under tropical cyclones, momentum difference and energy difference also demonstrate asymmetric distribution: the area with larger momentum difference is behind the moving direction of tropical cyclone, while energy difference is the largest in the right-rear quadrant, and both are relatively smaller in the left front quadrant. The inverse wave age is highly correlated with momentum difference and energy difference, and the correlation coefficient is about 0.95, indicating that the younger the surface wave, the more momentum and energy absorbed and stored by surface wave field. The inverse wave age increases with the increase of tropical cyclone translation speed, and the speed is positively correlated with momentum difference and energy difference according to the correlation coefficient above 0.8. Therefore, the surface waves affect the distribution and magnitude of momentum and energy input from the atmosphere to the ocean under tropical cyclones. In the future study of ocean boundary dynamics and thermodynamics, especially the study of tropical cyclones, considering the influence of ocean wave evolution is necessary.
-
Key words:
- tropical cyclones /
- ocean waves /
- momentum /
- energy
-

图 1 1990−2018年全球热带气旋分布
Fig. 1 Horizontal distribution of the tropical cyclones during 1990 to 2018
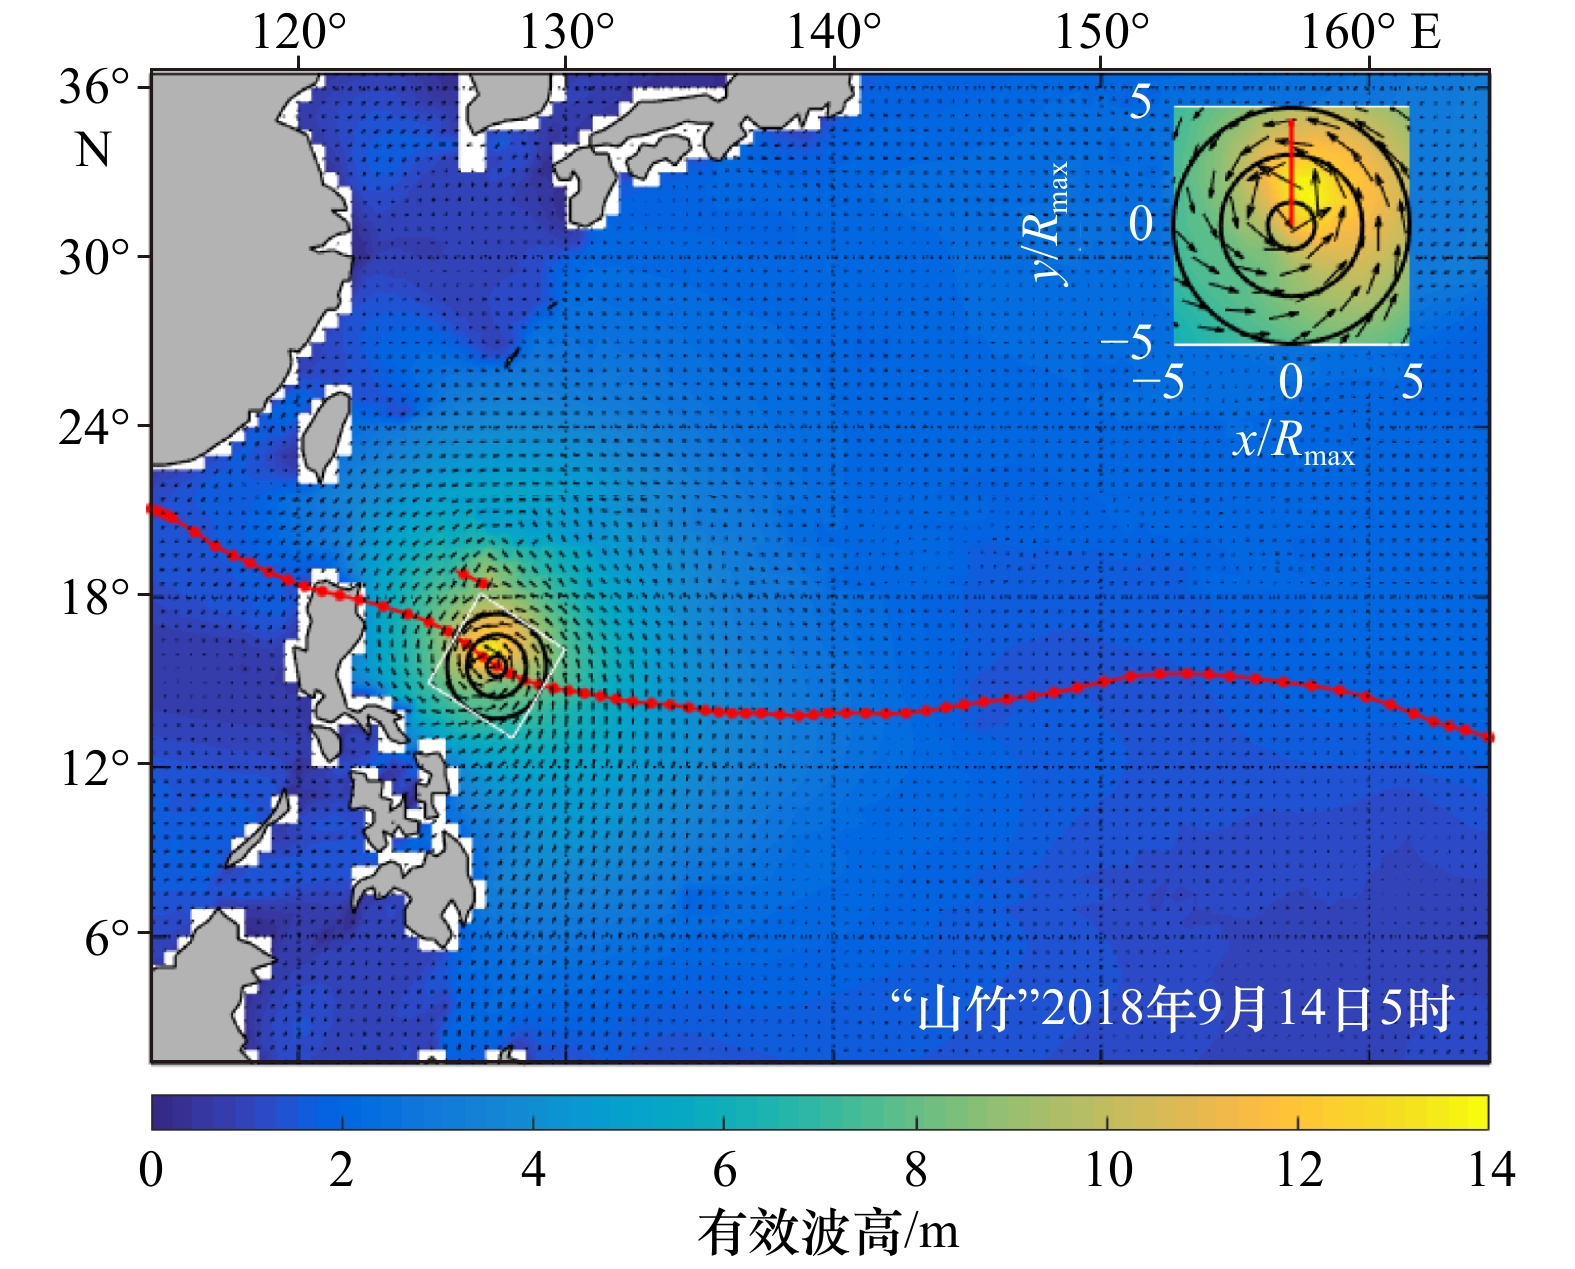
图 2 WW III模式模拟2018年9月14日5时台风“山竹”附近海域的有效波高
右上角图为热带气旋5Rmax范围内的有效波高;黑色箭头为风矢量;红色点线为台风“山竹”在不同时刻的移动轨迹;台风中心附近黑色圆实线分别为Rmax、3Rmax和5Rmax的位置
Fig. 2 WW III model simulates the effective wave height of the sea area near Typhoon Shanzhu at 5:00 on September 14, 2018
The upper right picture shows the significant wave height within 5Rmax; the black arrows indicate wind vector; the red dotted line is the track of Typhoon Shanzhu at different moments; the black lines near typhoon are the positions of Rmax, 3Rmax and 5Rmax

图 3 1990−2018年全球台风出现的数量(a)、强度(b)和移动速度(c)的时间序列
Fig. 3 Time series of number (a), intensity (b) and translation speed (c) of global typhoons during 1990−2018
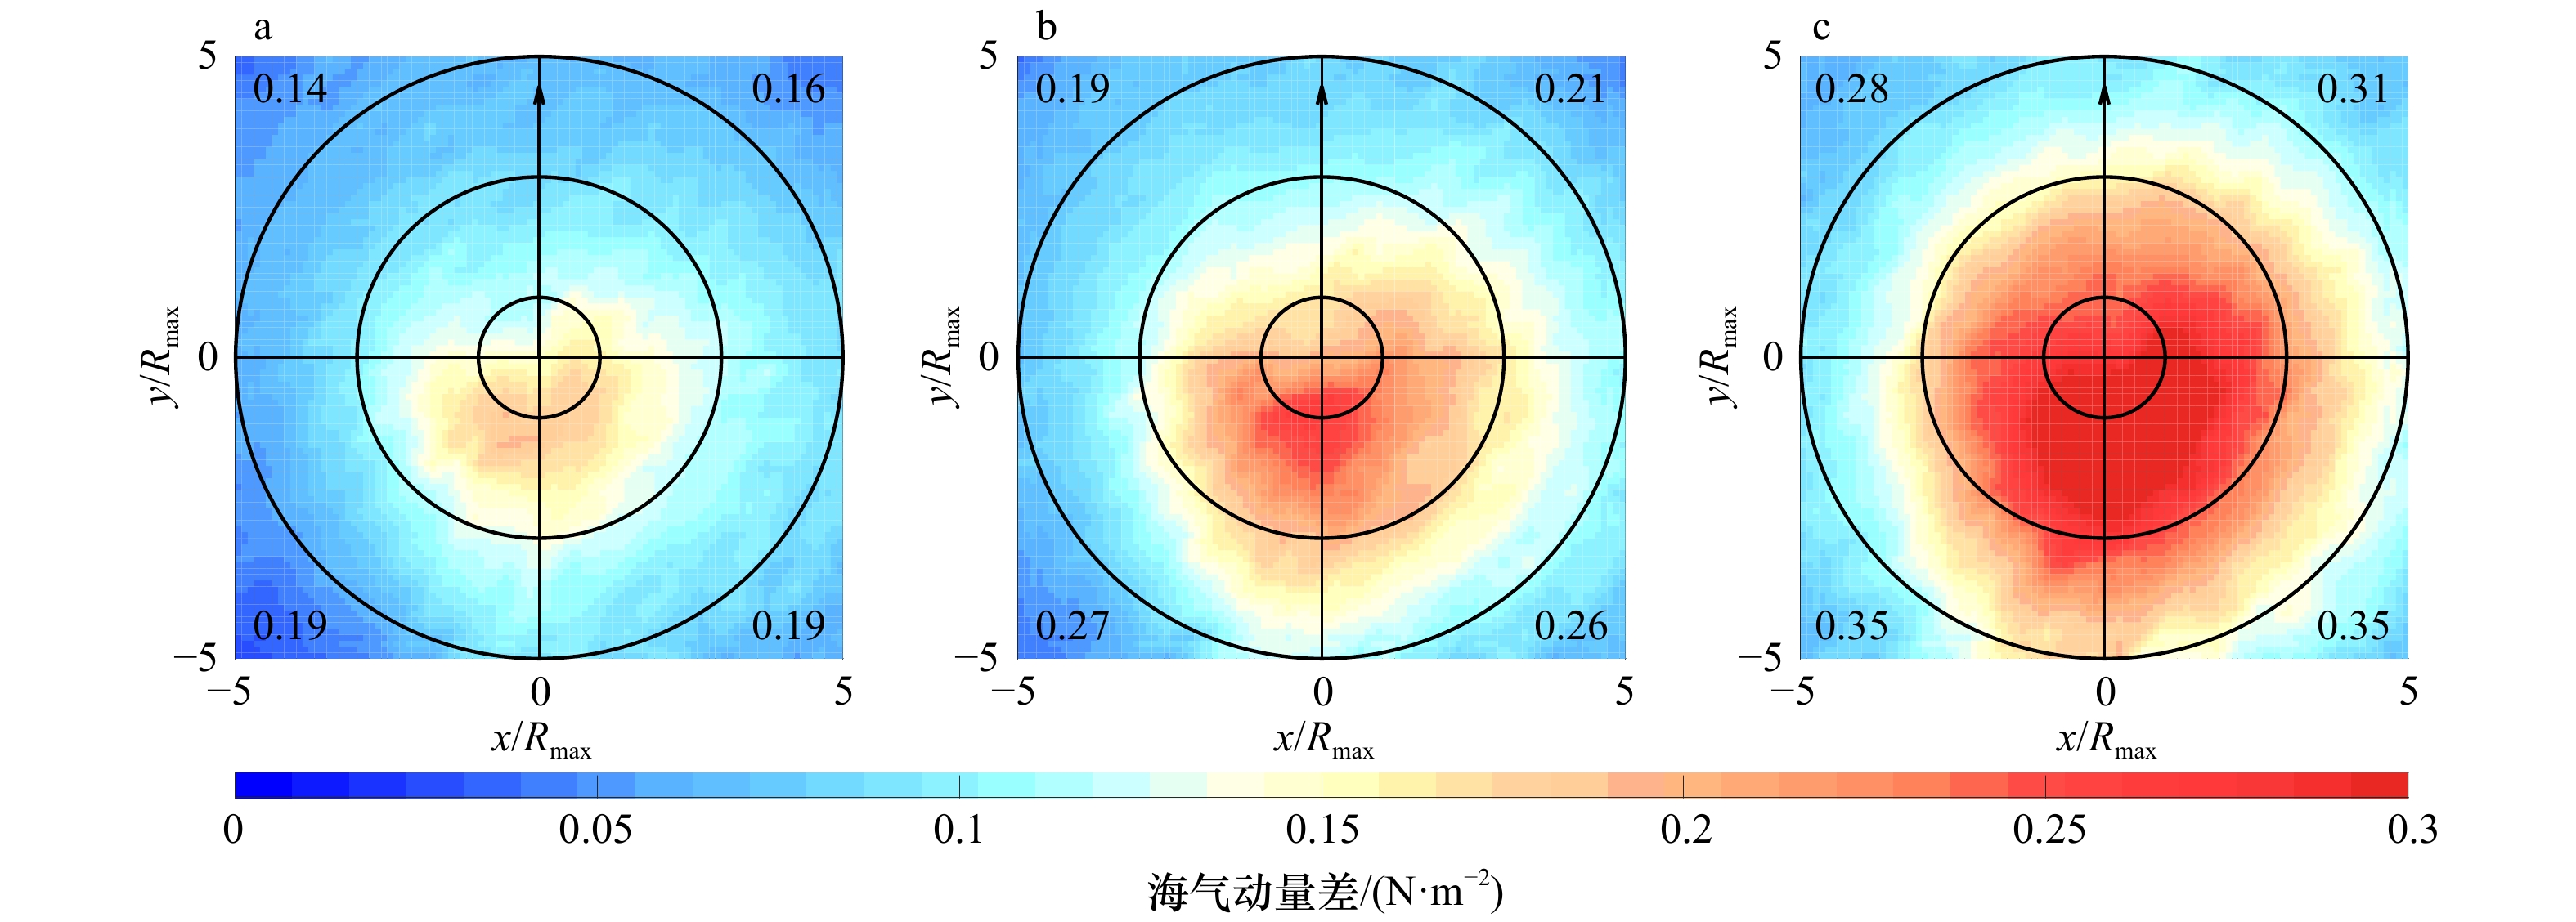
图 4 不同强度热带气旋海气动量差
${\tau _{{\rm{diff}}}}$ 的空间分布a. 强度为20 m/s≤Vmax<30 m/s;b. 强度为30 m/s≤Vmax<40 m/s;c. 强度为Vmax≥40 m/s;黑色箭头为气旋移动方向,数值表示每个象限内τdiff的最大值;黑色圆实线分别为Rmax、3Rmax和5Rmax的位置
Fig. 4 Spatial distribution of momentum difference
${\tau _{{\rm{diff}}}}$ under tropical cyclones of differenct intensitiesa. Intensity for 20 m/s≤Vmax<30 m/s; b. intensity for 30 m/s≤Vmax<40 m/s; c. intensity for Vmax≥40 m/s; the black arrows indicate the translation direction of the cyclones; the values represent the maximum τdiff in each quadrant; the black lines are the positions of Rmax, 3Rmax and 5Rmax
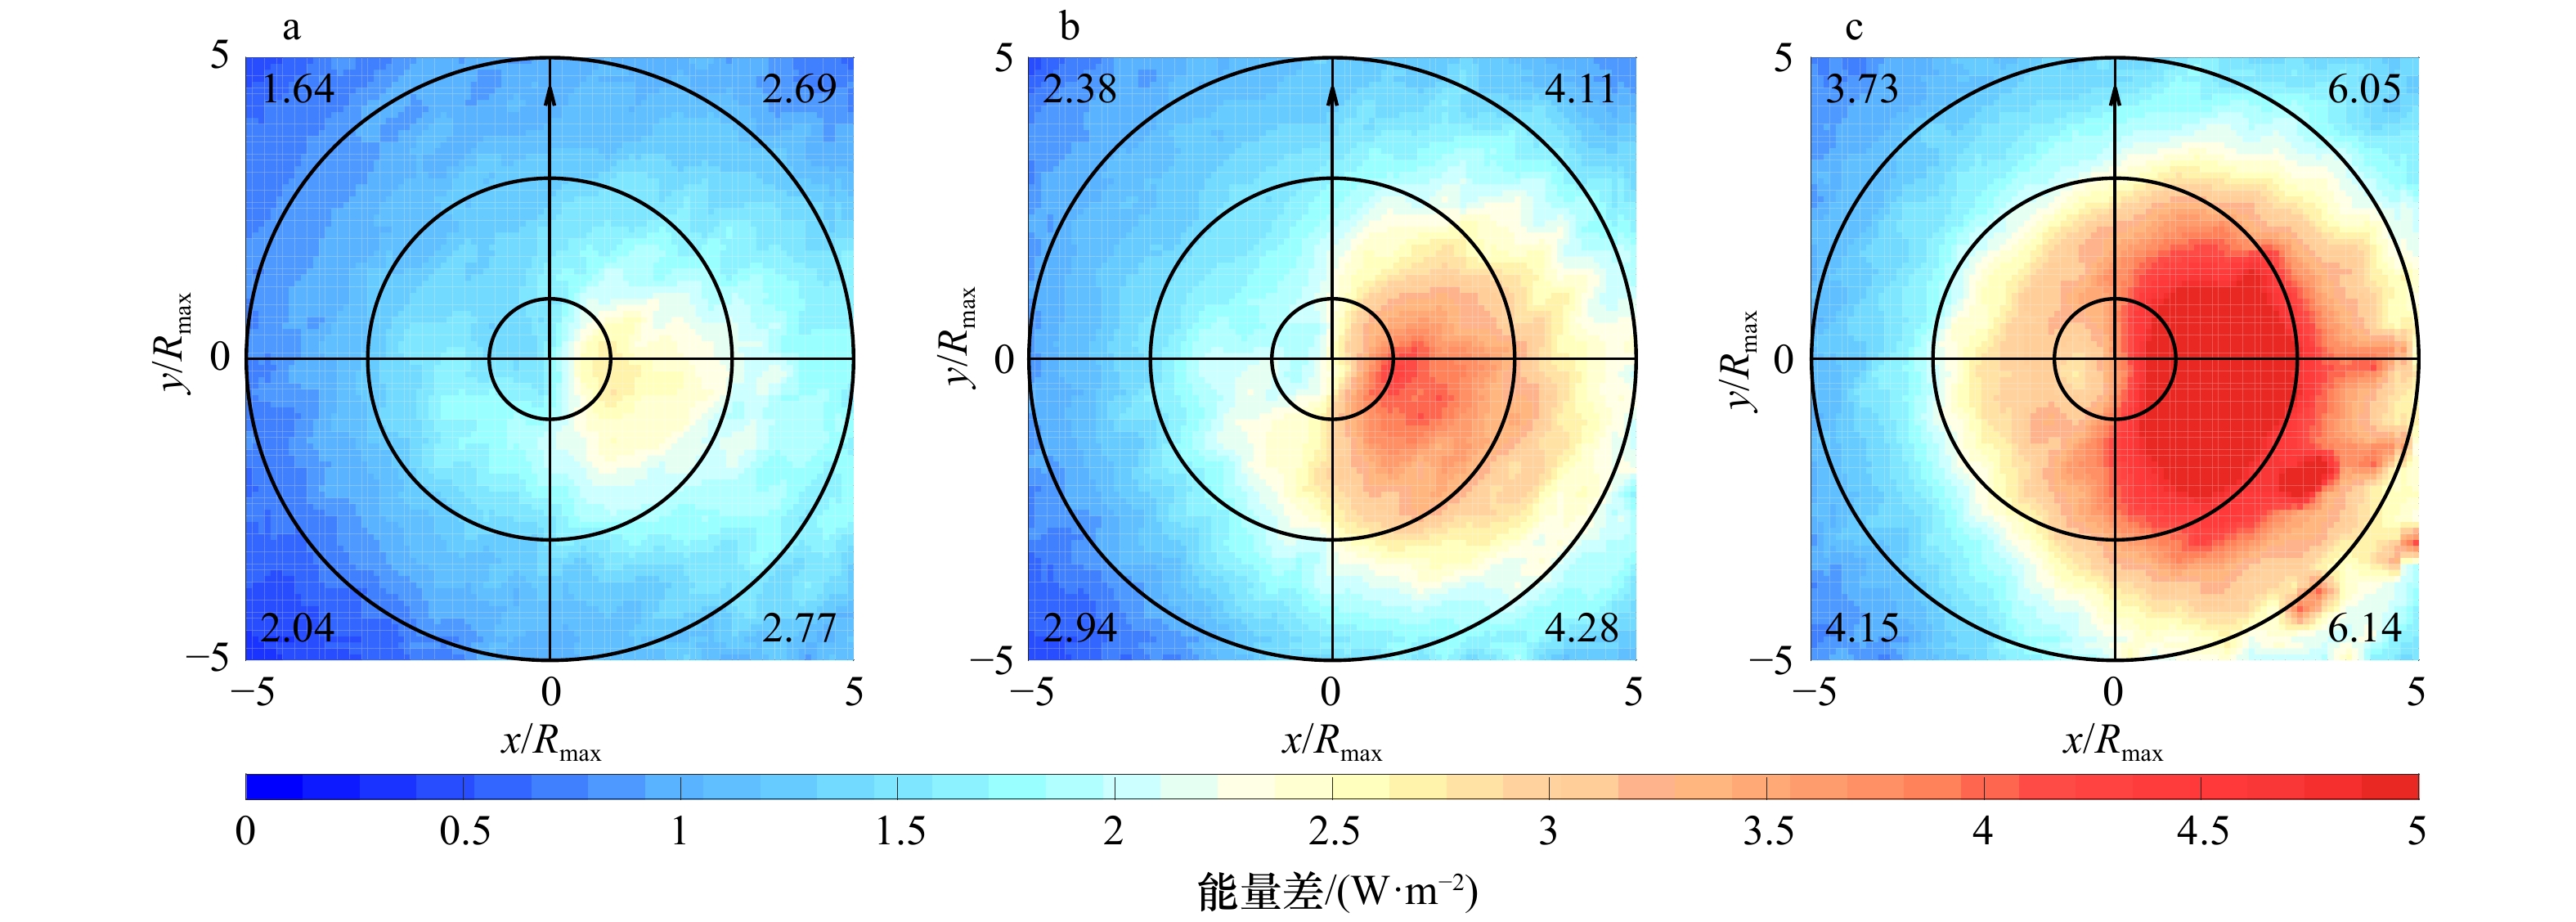
图 5 不同强度热带气旋能量差EFdiff的分布
a. 强度为20 m/s≤Vmax<30 m/s;b. 强度为30 m/s≤Vmax<40 m/s;c. 强度为Vmax≥40 m/s;黑色箭头为气旋移动方向,数值表示每个象限内EFdiff的最大值;黑色圆实线分别为Rmax、3Rmax和5Rmax的位置
Fig. 5 Spatial distribution of momentum difference EFdiff under tropical cyclones of different intensities
a. Intensity for 20 m/s≤Vmax<30 m/s; b. intensity for 30 m/s≤Vmax<40 m/s; c. intensity for Vmax≥40 m/s; the black arrows indicate the translation direction of the cyclones; the values represent the maximum EFdiff in each quadrant; the black lines are the positions of Rmax, 3Rmax and 5Rmax
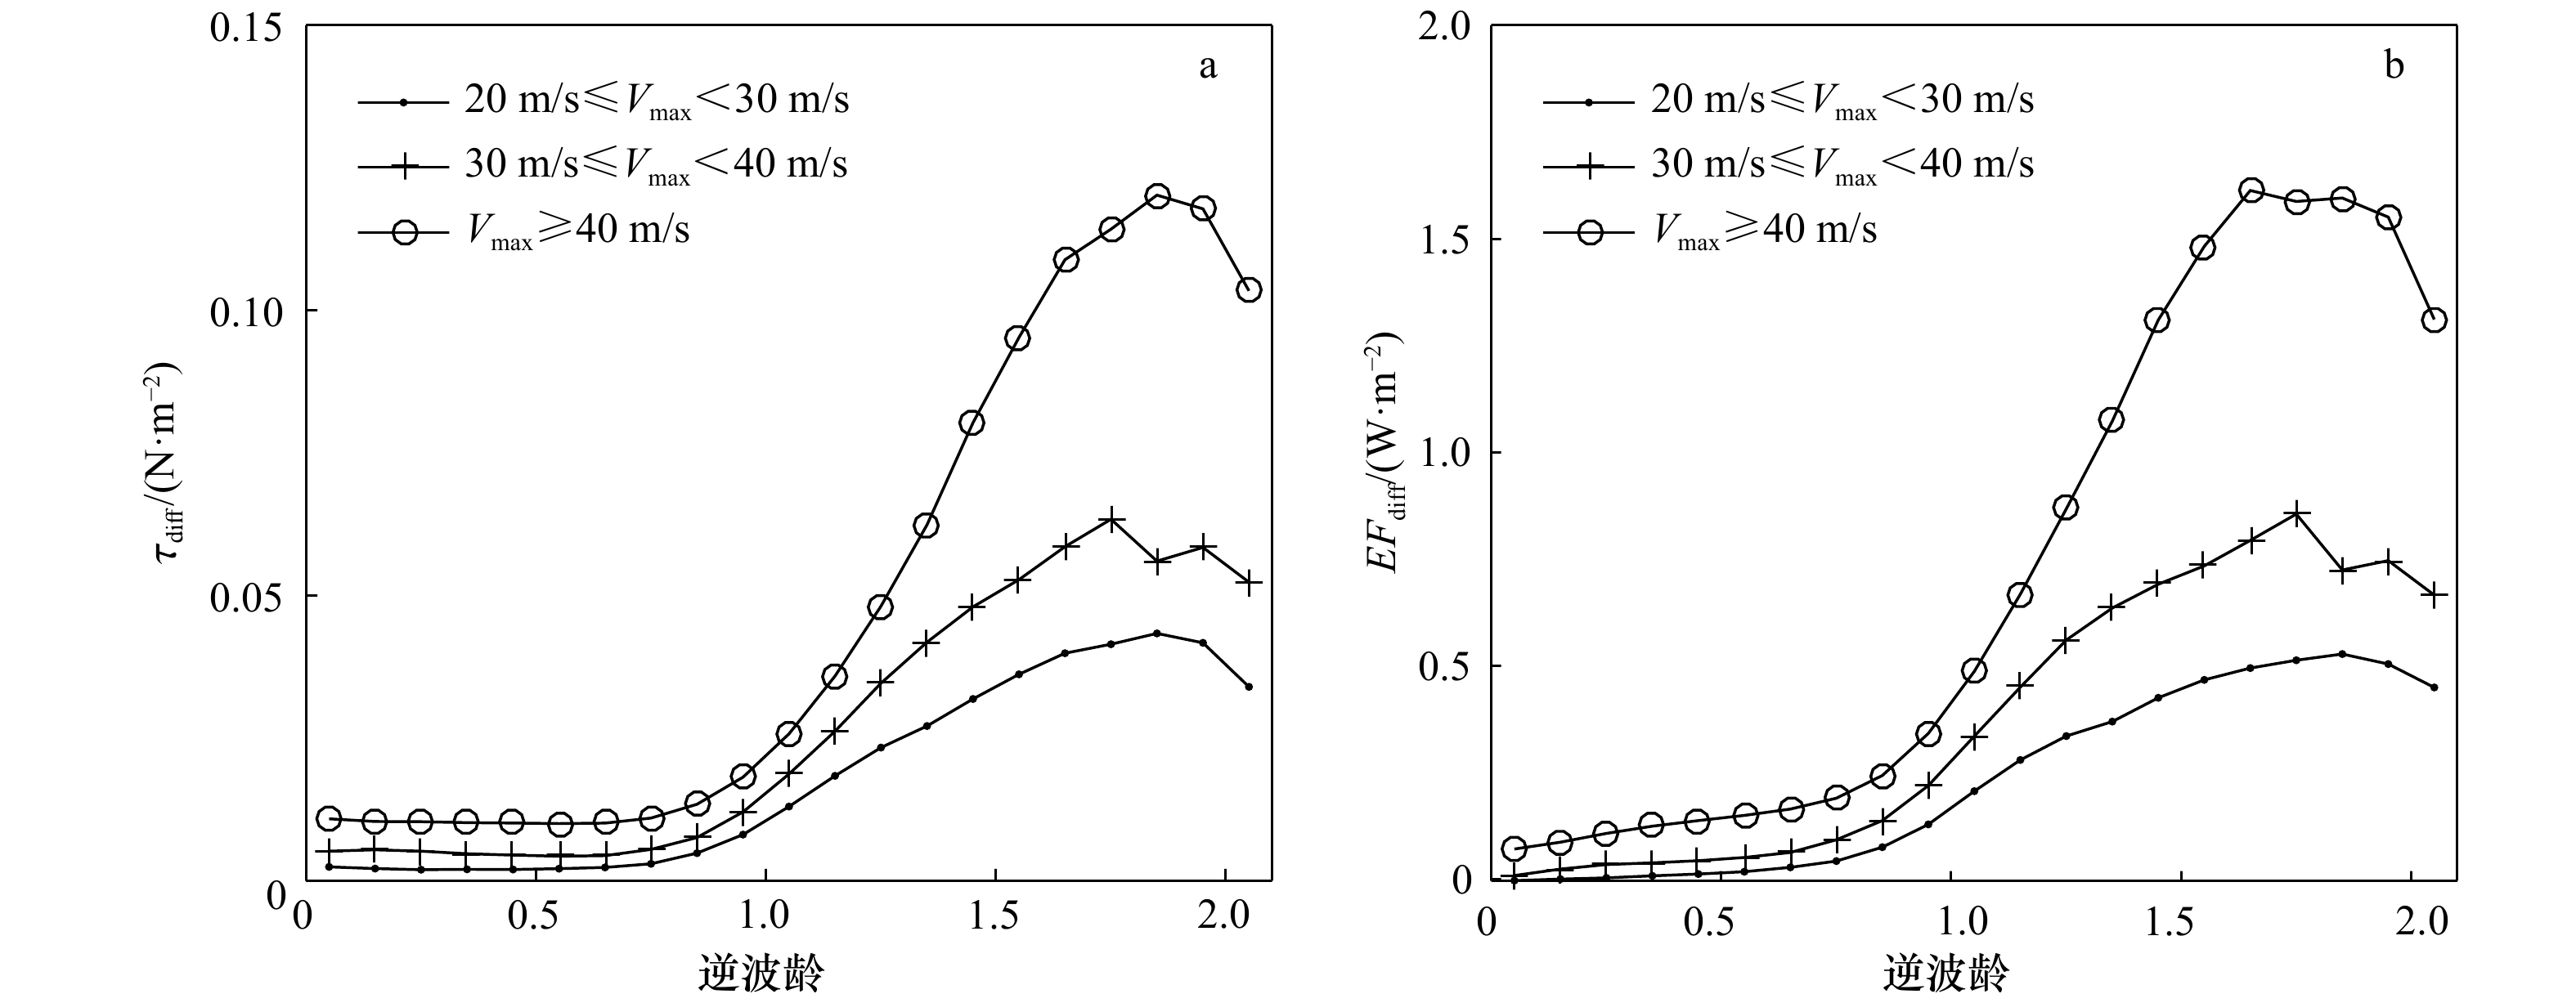
图 6 不同强度的热带气旋下逆波龄与海气动量差
${\tau _{{\rm{diff}}}}$ (a)和海气能量差$E{F_{{\rm{diff}}}}$ (b)的关系Fig. 6 The relationship between inverse wave age and momentum difference
${\tau _{{\rm{diff}}}}$ (a), energy difference$E{F_{{\rm{diff}}}}$ (b) under tropical cyclones of different intensity
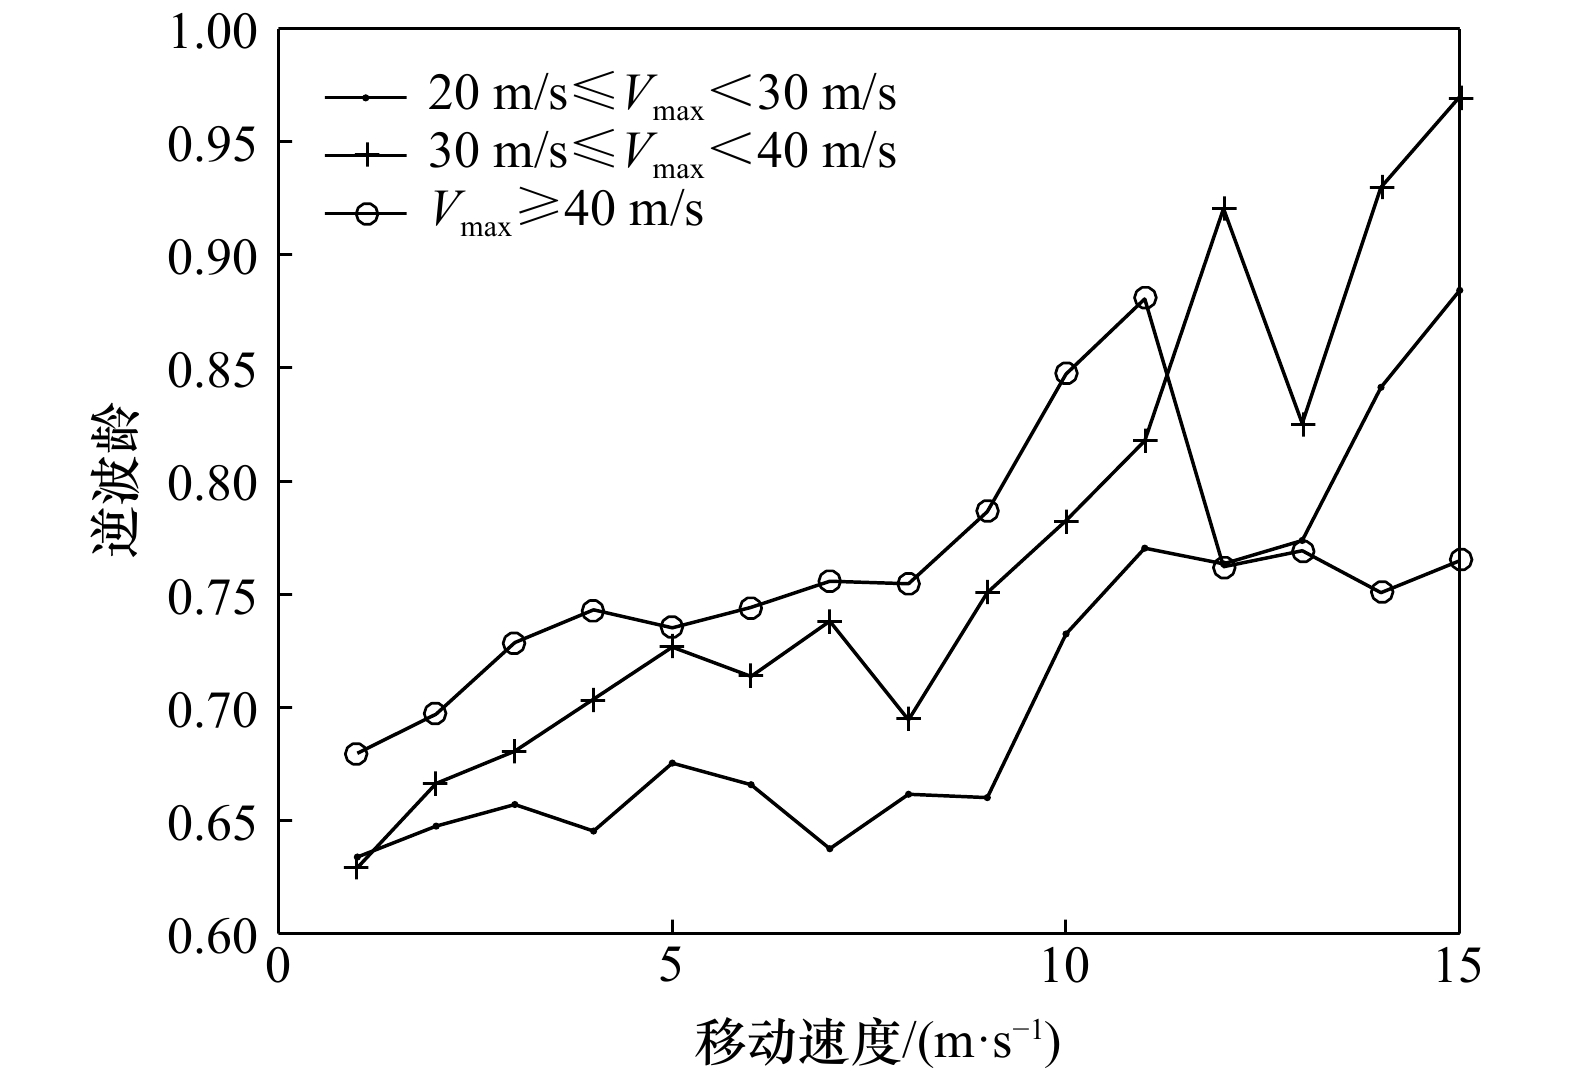
图 7 热带气旋移动速度与海气动量差
${\tau _{{\rm{diff}}}}$ (a)和海气能量差$E{F_{{\rm{diff}}}}$ (b)的关系Fig. 7 The relationship between tropical cyclone translation speed and momentum difference
${\tau _{{\rm{diff}}}}$ (a), energy difference$E{F_{{\rm{diff}}}}$ (b) -
[1] 丁亚梅, 毛科峰, 萧中乐, 等. 台风条件下朗缪尔环流对上层海洋混合的影响研究进展[J]. 海洋学报, 2018, 40(1): 1−9.Ding Yamei, Mao Kefeng, Xiao Zhongle, et al. Progress in the impacts of Langmuir Circulation in upper ocean mixing under typhoon condition[J]. Haiyang Xuebao, 2018, 40(1): 1−9. [2] 管长龙, 张文清, 朱冬琳, 等. 上层海洋中浪致混合研究评述——研究进展及存在问题[J]. 中国海洋大学学报(自然科学版), 2014, 44(10): 20−24.Guan Changlong, Zhang Wenqing, Zhu Donglin, et al. Review of research on surface wave induced mixing in upper ocean layer: progress and existing problems[J]. Periodical of Ocean University of China, 2014, 44(10): 20−24. [3] Komen G J, Cavaleri L, Donelan M, et al. Dynamics and modelling of ocean waves[J]. Dynamics of Atmospheres & Oceans, 1994, 25(4): 276−278. [4] Mellor G L, Donelan M A, Oey L Y. A surface wave model for coupling with numerical ocean circulation models[J]. Journal of Atmospheric and Oceanic Technology, 2008, 25(10): 1785−1807. doi: 10.1175/2008JTECHO573.1 [5] 王平, 陈葆德, 曾智华. 海洋飞沫对热带气旋边界层结构的影响[J]. 海洋学报, 2014, 36(9): 84−93.Wang Ping, Chen Baode, Zeng Zhihua. Effect of sea spray on tropical cyclone boundary layer structure[J]. Haiyang Xuebao, 2014, 36(9): 84−93. [6] Donelan M A, Curcic M, Chen S S, et al. Modeling waves and wind stress[J]. Journal of Geophysical Research Oceans, 2012, 117(C11): C00J23. [7] Dobson F W. Measurements of atmospheric pressure on wind-generated sea waves[J]. Journal of Fluid Mechanics, 1971, 48(1): 91−127. doi: 10.1017/S0022112071001496 [8] Donelan M A. Air-water exchange processes[M]//Imberger J. Physical Processes in Lakes and Oceans. Washington: American Geophysical Union (AGU), 1998. [9] Snyder R L, Dobson F W, Elliott J A, et al. Array measurements of atmospheric pressure fluctuations above surface gravity waves[J]. Journal of Fluid Mechanics, 1981, 102: 1−59. doi: 10.1017/S0022112081002528 [10] Schlichting H. Boundary-Layer Theory[M]. 7th ed. Kestin J, trans. New York: McGraw-Hill, 1979. [11] Ardhuin F, Chapron B, Elfouhaily T. Waves and the air-sea momentum budget: implications for ocean circulation modeling[J]. Journal of Physical Oceanography, 2004, 34(7): 1741−1755. doi: 10.1175/1520-0485(2004)034<1741:WATAMB>2.0.CO;2 [12] Janssen P A E M. Ocean wave effects on the daily cycle in SST[J]. Journal of Geophysical Research: Oceans, 2012, 117(C11): C00J32. [13] Liu Guoqiang, Perrie W, Hughes C. Surface wave effects on the wind-power input to mixed layer near-inertial motions[J]. Journal of Physical Oceanography, 2017, 47(5): 1077−1093. doi: 10.1175/JPO-D-16-0198.1 [14] Fan Yalin, Ginis I, Hara T. The effect of wind-wave-current interaction on air-sea momentum fluxes and ocean response in tropical cyclones[J]. Journal of Physical Oceanography, 2009, 39(4): 1019−1034. doi: 10.1175/2008JPO4066.1 [15] Wright C W, Walsh E J, Vandemark D, et al. Hurricane directional wave spectrum spatial variation in the open ocean[J]. Journal of Physical Oceanography, 2001, 31(8): 2472−2488. doi: 10.1175/1520-0485(2001)031<2472:HDWSSV>2.0.CO;2 [16] Walsh E J, Wright C W, Vandemark D, et al. Hurricane directional wave spectrum spatial variation at landfall[J]. Journal of Physical Oceanography, 2002, 32(6): 1667−1684. doi: 10.1175/1520-0485(2002)032<1667:HDWSSV>2.0.CO;2 [17] Fan Yalin, Ginis I, Hara T. Momentum flux budget across the air-sea interface under uniform and tropical cyclone winds[J]. Journal of Physical Oceanography, 2010, 40(10): 2221−2242. doi: 10.1175/2010JPO4299.1 [18] Curcic M. Explicit air-sea momentum exchange in coupled atmosphere-wave-ocean modeling of tropical cyclones[D]. Coral Gables: University of Miami, 2015. [19] Drennan W M, Kahma K K, Donelan M A. On momentum flux and velocity spectra over waves[J]. Boundary-Layer Meteorology, 1999, 92(3): 489−515. doi: 10.1023/A:1002054820455 [20] Grachev A A, Fairall C W. Upward momentum transfer in the marine boundary layer[J]. Journal of Physical Oceanography, 2001, 31(7): 1698−1711. doi: 10.1175/1520-0485(2001)031<1698:UMTITM>2.0.CO;2 [21] Smedman A, Högström U, Bergström H, et al. A case study of air-sea interaction during swell conditions[J]. Journal of Geophysical Research Oceans, 1999, 104(C11): 25833−25851. doi: 10.1029/1999JC900213 [22] Knapp K R, Kruk M C, Levinson D H, et al. The international best track archive for climate stewardship (IBTrACS)[J]. Bulletin of the American Meteorological Society, 2010, 91(3): 363−376. doi: 10.1175/2009BAMS2755.1 [23] Rascle N, Ardhuin F. A global wave parameter database for geophysical applications. part 2: model validation with improved source term parameterization[J]. Ocean Modelling, 2013, 70: 174−188. doi: 10.1016/j.ocemod.2012.12.001 [24] Kossin J P, Olander T L, Knapp K R. Trend analysis with a new global record of tropical cyclone intensity[J]. Journal of Climate, 2013, 26(24): 9960−9976. doi: 10.1175/JCLI-D-13-00262.1 [25] Mei Wei, Xie Shangping. Intensification of landfalling typhoons over the northwest Pacific since the late 1970s[J]. Nature Geoscience, 2016, 9(10): 753−757. doi: 10.1038/ngeo2792 [26] 蔡晓杰, 姜华, 王辉, 等. 西北太平洋热带气旋与上层海洋热含量的关系[J]. 海洋学报, 2013, 35(3): 28−35.Cai Xiaojie, Jiang Hua, Wang Hui, et al. The relationship between tropical cyclone in the northwest Pacific and upper ocean heat content[J]. Haiyang Xuebao, 2013, 35(3): 28−35. [27] Kossin J P. A global slowdown of tropical-cyclone translation speed[J]. Nature, 2018, 558(7708): 104−107. doi: 10.1038/s41586-018-0158-3 [28] Zhang Lin, Oey L. Young ocean waves favor the rapid intensification of tropical cyclones—a global observational analysis[J]. Monthly Weather Review, 2019, 147(1): 311−328. doi: 10.1175/MWR-D-18-0214.1 [29] Zhang Lin, Oey L. An observational analysis of ocean surface waves in tropical cyclones in the western north Pacific Ocean[J]. Journal of Geophysical Research Oceans, 2019, 124(1): 184−195. doi: 10.1029/2018JC014517 [30] Bowyer P J, MacAfee A W. The theory of trapped-fetch waves with tropical cyclones—an operational perspective[J]. Weather and Forecasting, 2005, 20(3): 229−244. doi: 10.1175/WAF849.1 [31] 方钟圣, 金承仪. 日本浮标站台风浪波高与风速等参数的统计分析[J]. 船舶力学, 2003, 7(5): 1−10. doi: 10.3969/j.issn.1007-7294.2003.05.001Fang Zhongsheng, Jin Chengyi. Statistical analysis on wave height, wind speed and other parameters due to tropical cyclones in the Northwest Pacific area[J]. Journal of Ship Mechanics, 2003, 7(5): 1−10. doi: 10.3969/j.issn.1007-7294.2003.05.001 [32] Chang Yuchia, Tseng R S, Chu P C, et al. Observed strong currents under global tropical cyclones[J]. Journal of Marine Systems, 2016, 159: 33−40. doi: 10.1016/j.jmarsys.2016.03.001 [33] Tamizi A, Young I R. The spatial distribution of ocean waves in tropical cyclones[J]. Journal of Physical Oceanography, 2020, 50(8): 2123−2139. doi: 10.1175/JPO-D-20-0020.1 [34] Ardhuin F, Jenkins A D. On the interaction of surface waves and upper ocean turbulence[J]. Journal of Physical Oceanography, 2006, 36(3): 551−557. doi: 10.1175/JPO2862.1 [35] Hanley K E, Belcher S E, Sullivan P P. A global climatology of wind-wave interaction[J]. Journal of Physical Oceanography, 2010, 40(6): 1263−1282. doi: 10.1175/2010JPO4377.1 [36] Xie Lian, Bao Shaowu, Pietrafesa L J, et al. A real-time hurricane surface wind forecasting model: formulation and verification[J]. Monthly Weather Review, 2006, 134(5): 1355−1370. doi: 10.1175/MWR3126.1 -

 下载:
下载:


计量
- 文章访问数: 830
- HTML全文浏览量: 180
- PDF下载量: 53
- 被引次数: 0
