

Characteristics of turbulence in the Changjiang River Estuary and its adjacent waters in summer
-
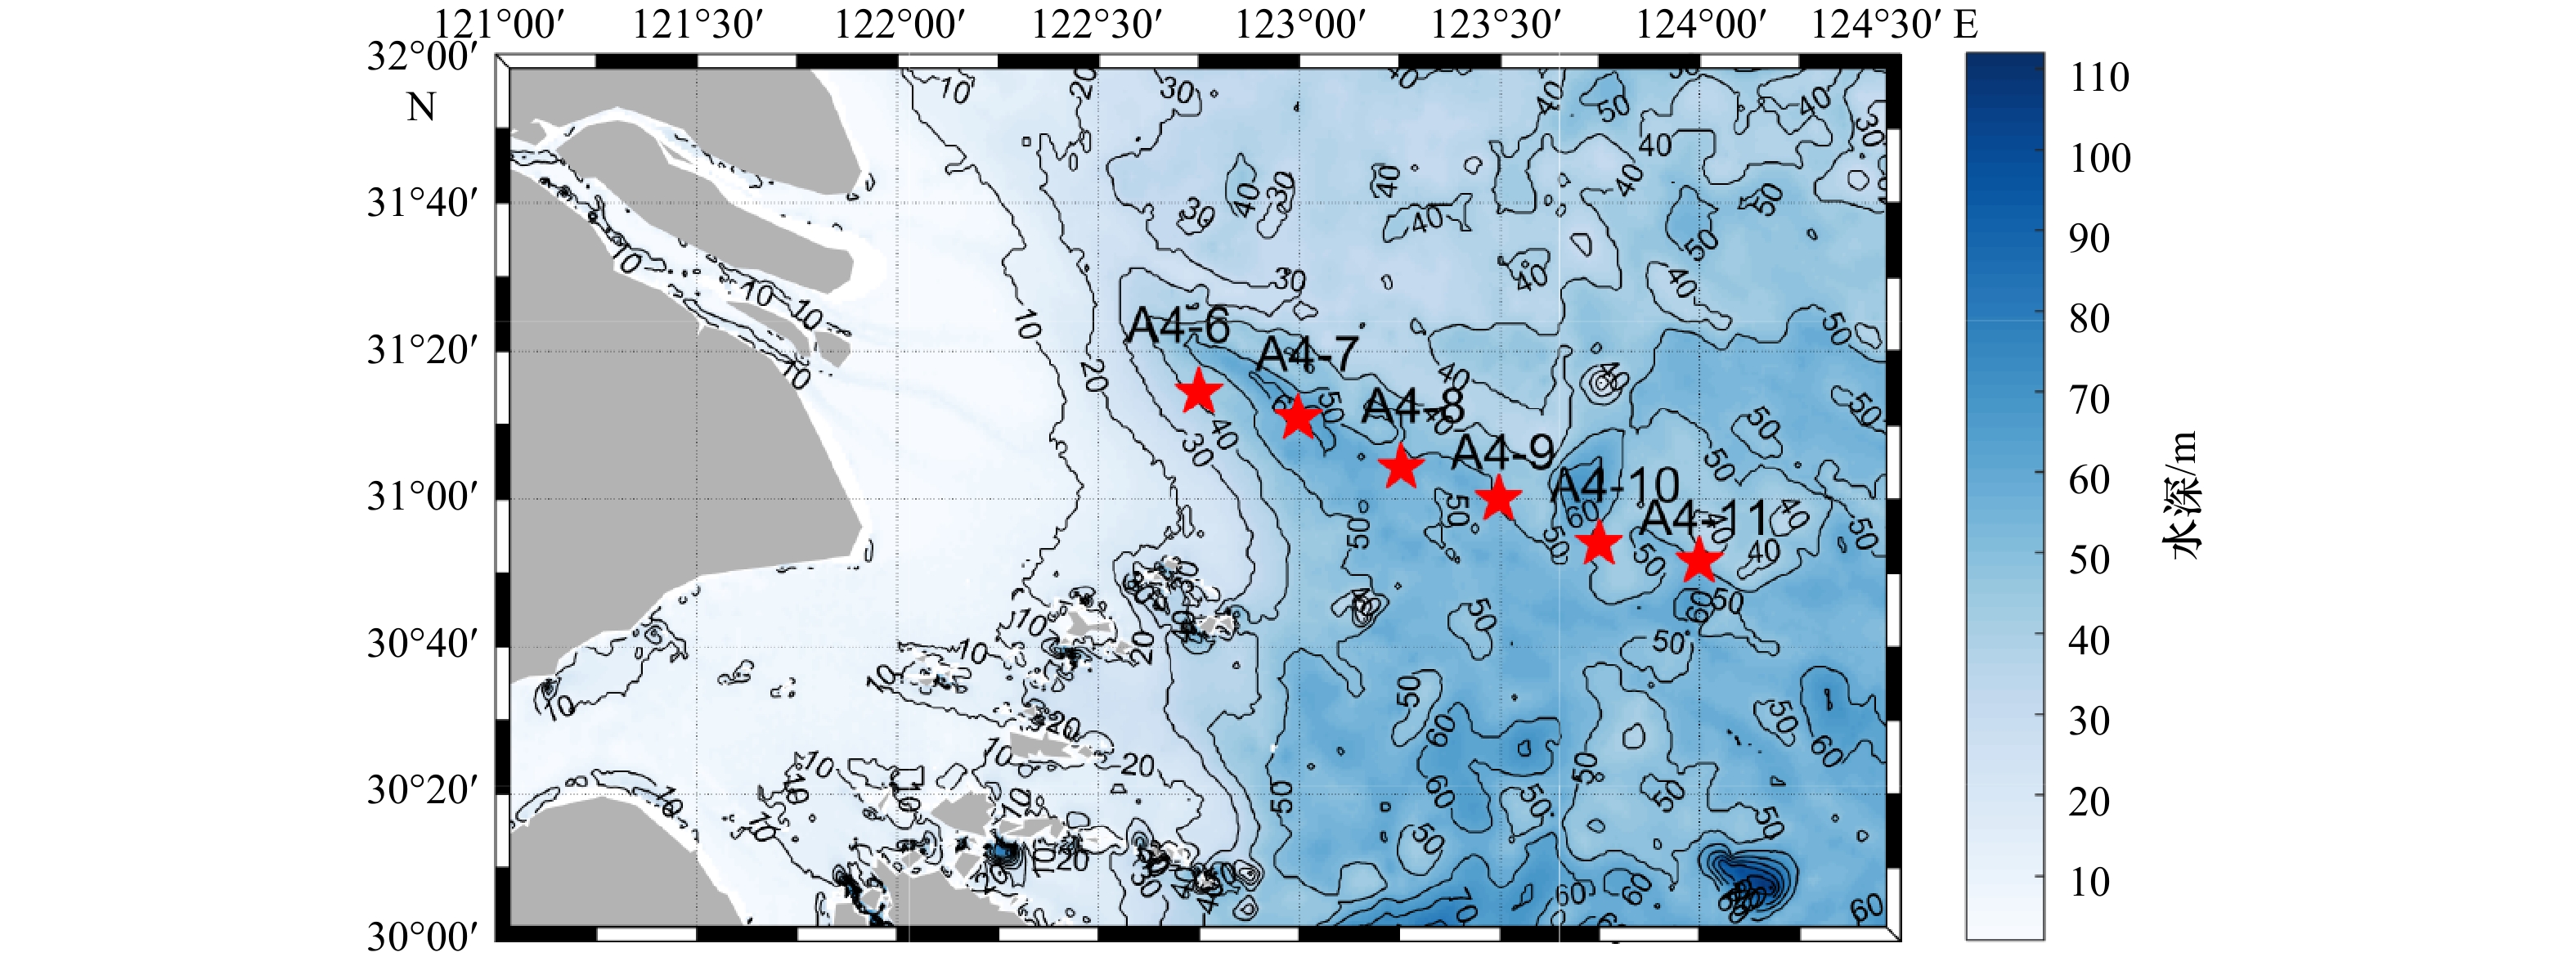
摘要: 利用2019年7月在长江口科学考察实验研究夏季航段(NORC2019-03-02)中获得的MSS90L湍流剖面仪的直接观测数据,本文计算并分析了该断面的湍动能耗散率ε和垂向湍扩散系数KZ的分布情况。湍动能耗散率的大小为1.72×10⁻¹⁰~2.95×10⁻⁵ W/kg;垂向湍扩散系数的大小为3.24×10−7~4.55×10−2 m2/s。湍动能耗散率和垂向湍扩散系数的分布相似,均为上层最强,底层次之,中层最弱。上层由于风应力的作用,使得湍动能耗散率和垂向湍扩散系数较大;温跃层处层化较强,抑制了湍动能的耗散和垂向上的湍混合。盐度锋面的次级环流会促使低盐水团脱离,锋面引起的垂向环流会加强海洋的湍混合。低盐水团与外界的能量交换较少,湍动能耗散率较弱。长江口海区存在明显的上升流和下降流,它们是由锋面的次级环流产生的;上升流和下降流的存在促进湍动能的耗散与湍混合。Abstract: Using the direct observation data of the MSS90L turbulence profiler obtained in the summer cruise of the Changjiang River Estuary scientific investigation and experimental study (NORC2019-03-02) in July 2019, in this paper, the distribution of the turbulent kinetic energy dissipation rate ε and the vertical turbulent diffusion coefficient Kz are calculated and analyzed. The turbulent kinetic energy dissipation rate is 1.72×10⁻¹⁰ W/kg to 2.95×10⁻⁵ W/kg, and the vertical turbulent diffusion coefficient is 3.24×10⁻⁷ m2/s to 4.55×10⁻² m2/s. The distribution of the turbulent kinetic energy dissipation rate and the vertical turbulent diffusion coefficient are similar, both of which are the strongest in the upper layer, the next in the bottom layer and the weakest in the middle layer. In the upper layer, due to wind stress, the turbulent kinetic energy dissipation rate and vertical turbulent diffusion coefficient are larger; the stratification is stronger at the thermocline, which suppresses the dissipation of turbulent kinetic energy and vertical turbulent mixing. The secondary circulation of the salinity front will promote the separation of the low salt water mass, and the vertical circulation caused by the front will enhance the turbulent mixing of the ocean. The energy exchange between the low salt water mass and the outside world is less, and the turbulent kinetic energy dissipation rate is weaker. There are obvious upwelling and downwelling in the Changjiang River Estuary, which are produced by the secondary circulation of the front; the existence of upwelling and downwelling promotes the dissipation of turbulent kinetic energy and turbulent mixing.
-
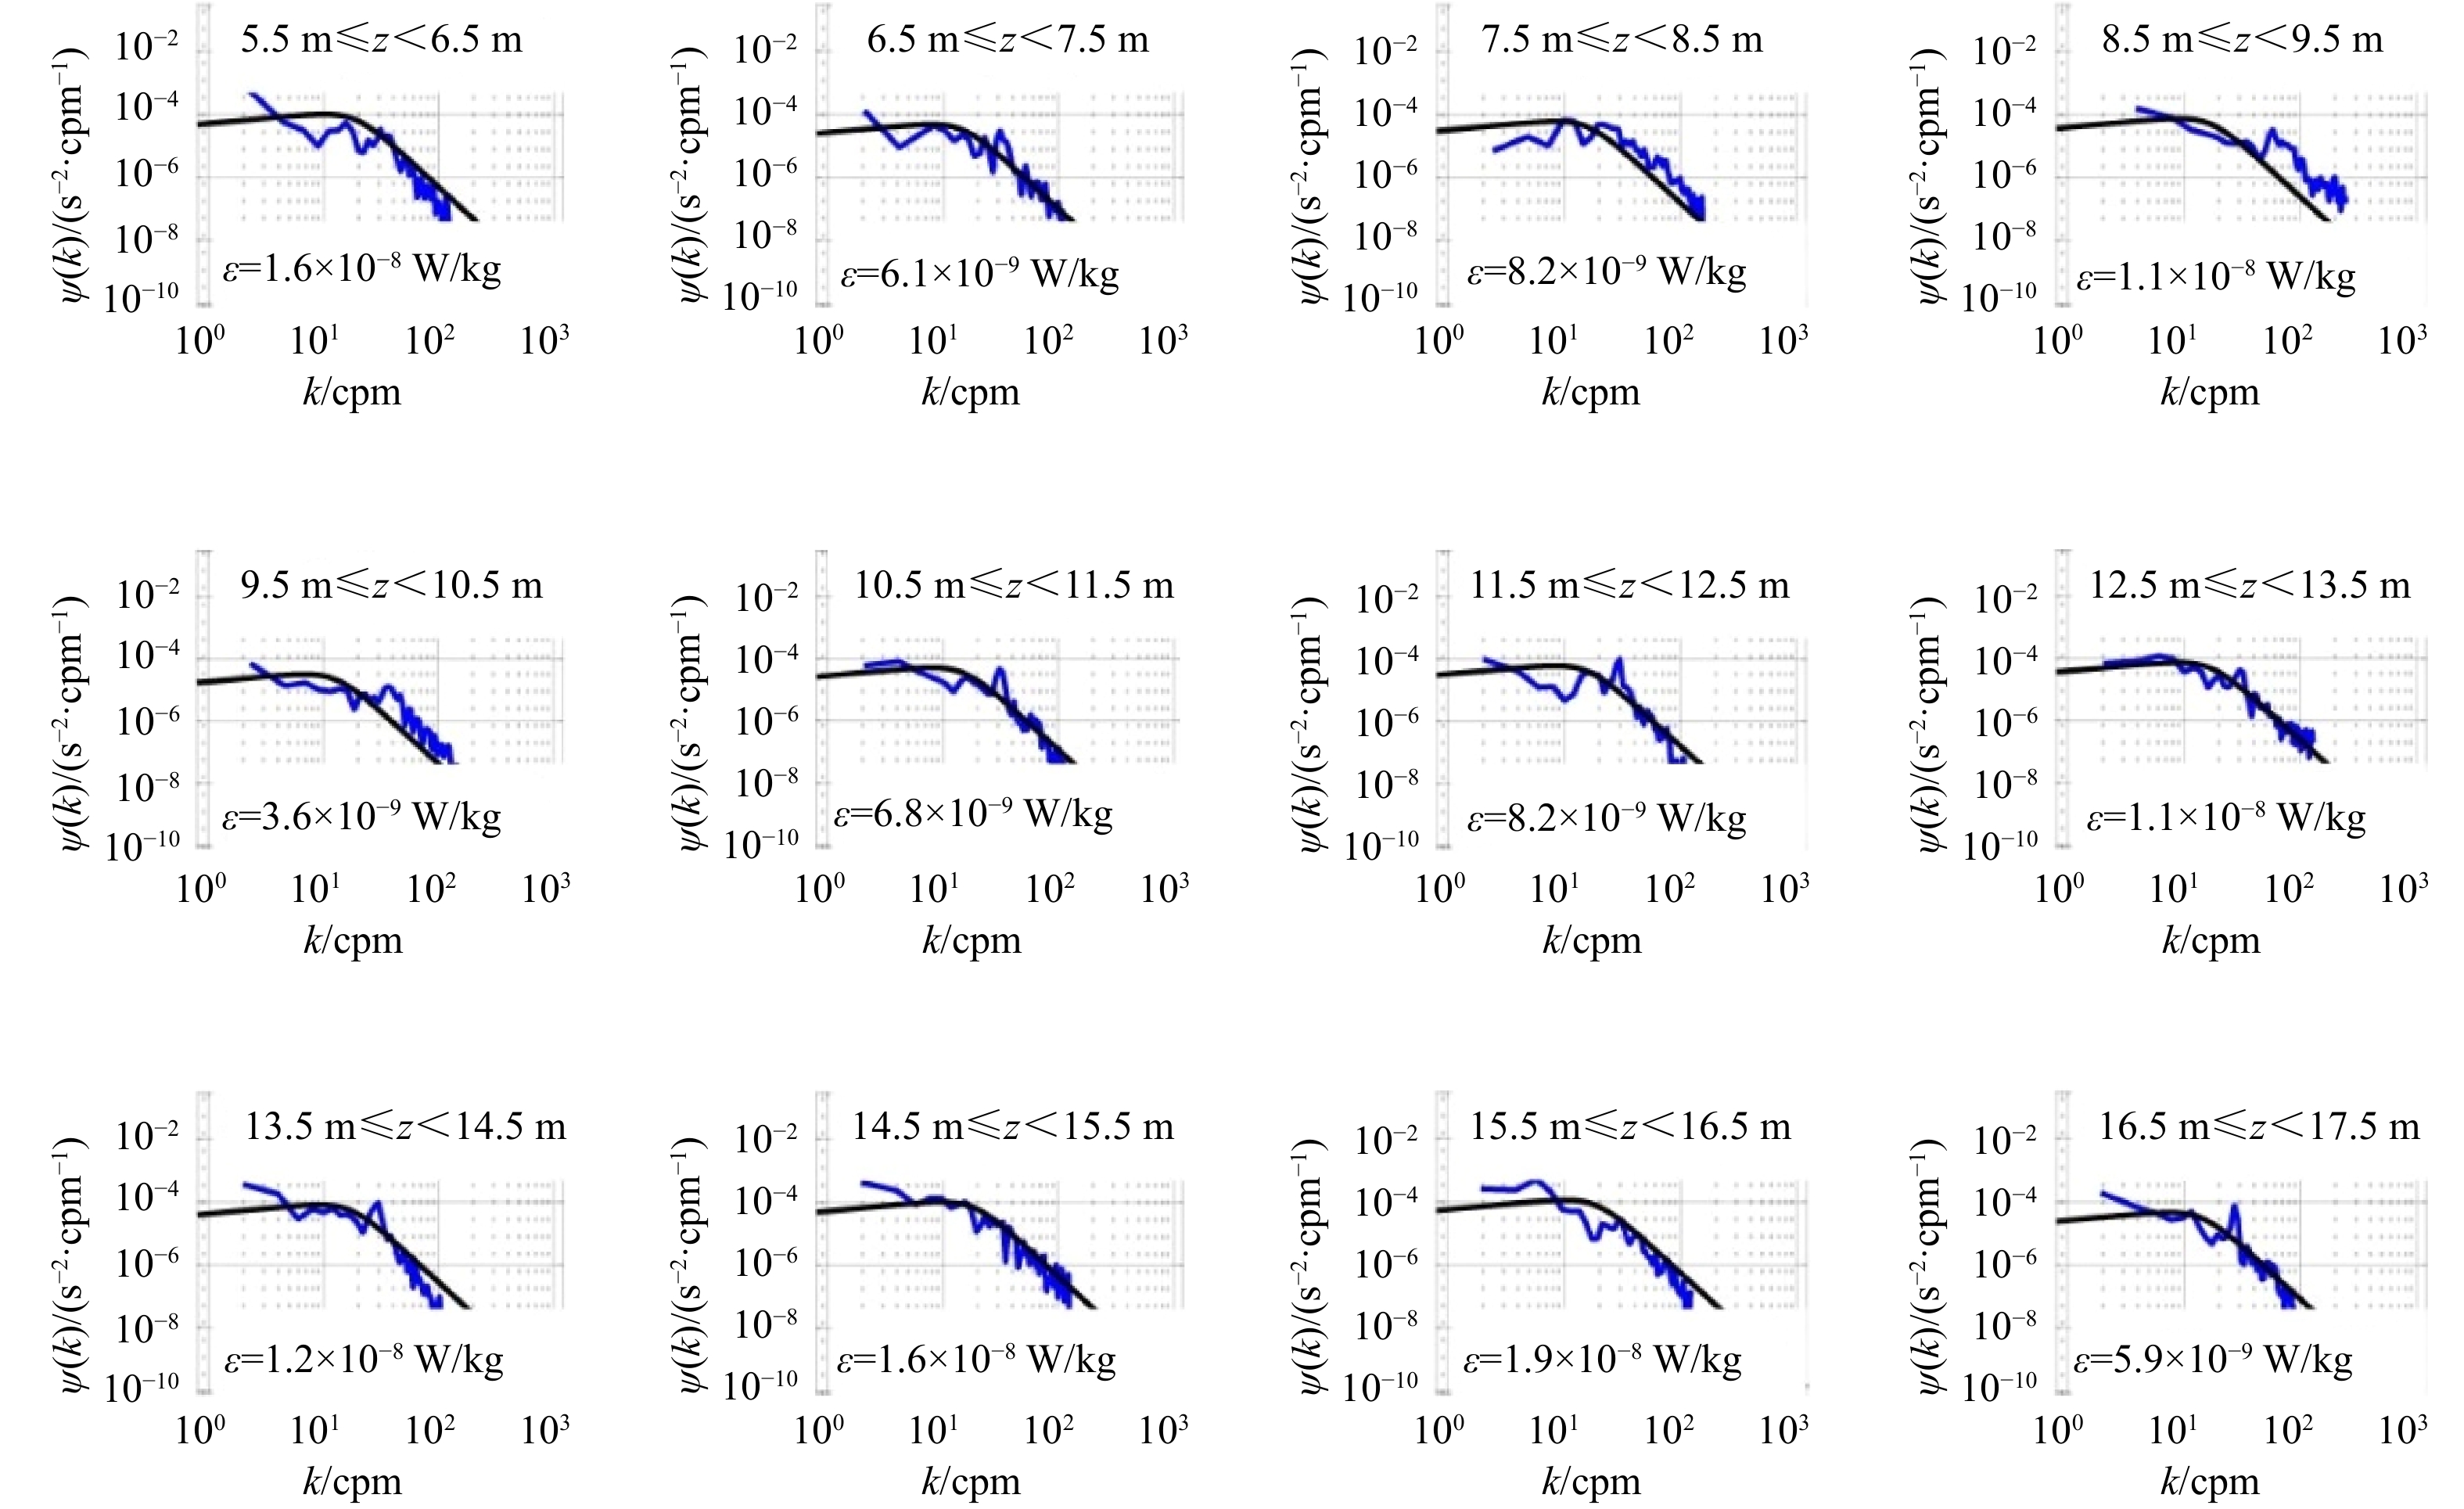
图 2 剪切功率谱与相应的Nasmyth谱的比较
蓝线代表剪切功率谱;黑线代表Nasmyth谱
Fig. 2 Comparison of the shear power spectrum with the corresponding Nasmyth spectrum
The blue line represents the shear power spectrum; the black line represents the Nasmyth spectrum
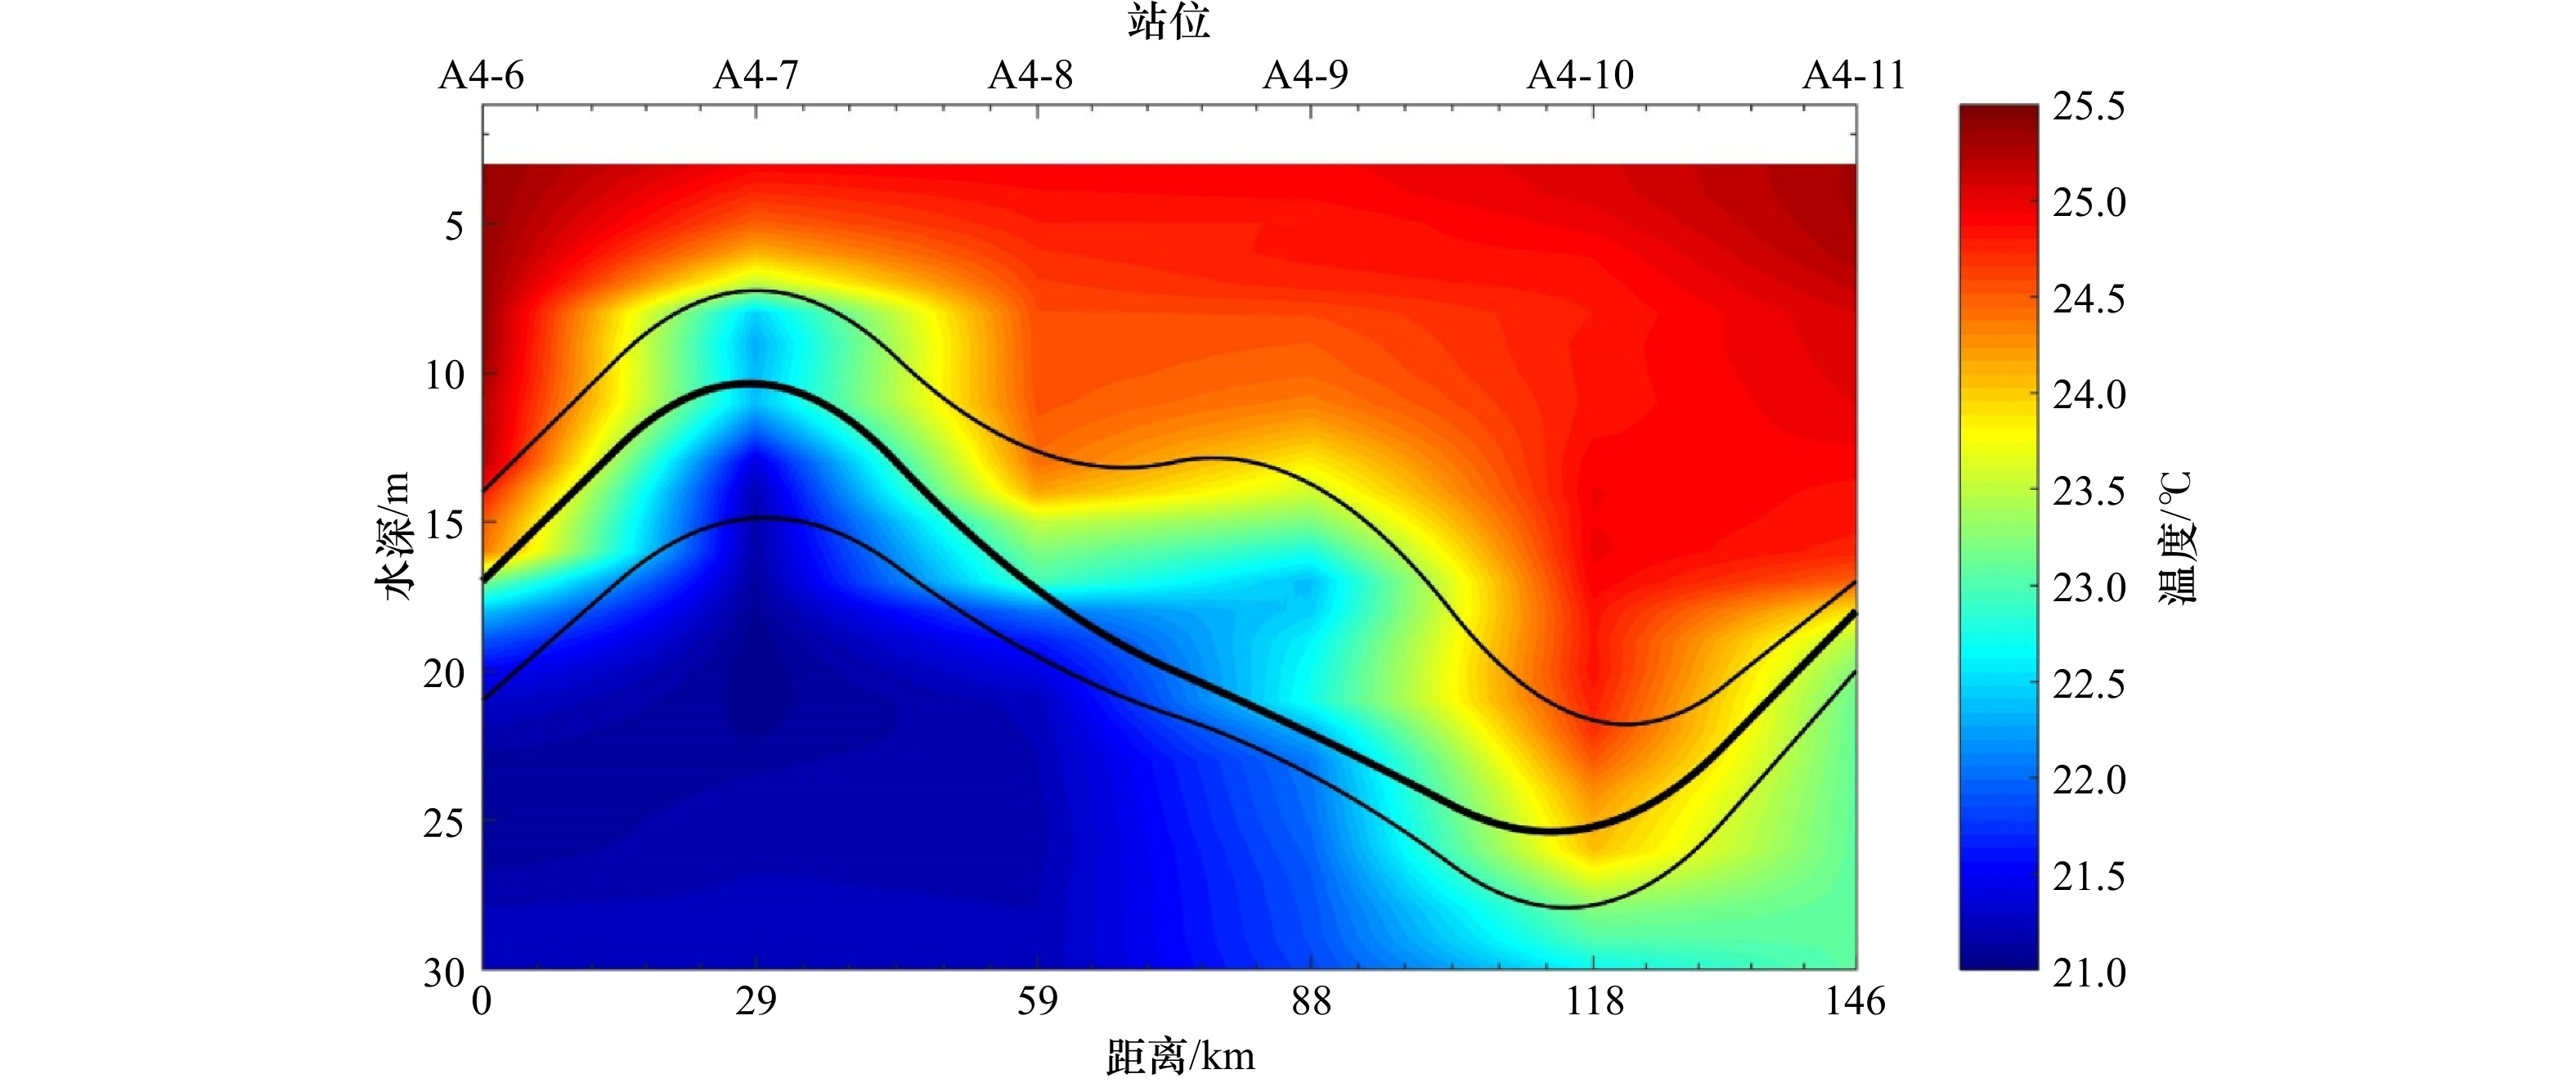
图 3 夏季A4断面的温度分布
黑细线代表以0.2℃/m为标准计算得到的温跃层范围;黑粗线代表温跃层强度最强的位置
Fig. 3 The temperature distribution of Section A4 in summer
The thin black line represents the range of the thermocline calculated with 0.2℃/m as the standard; the thick black line represents the strongest location of the thermocline
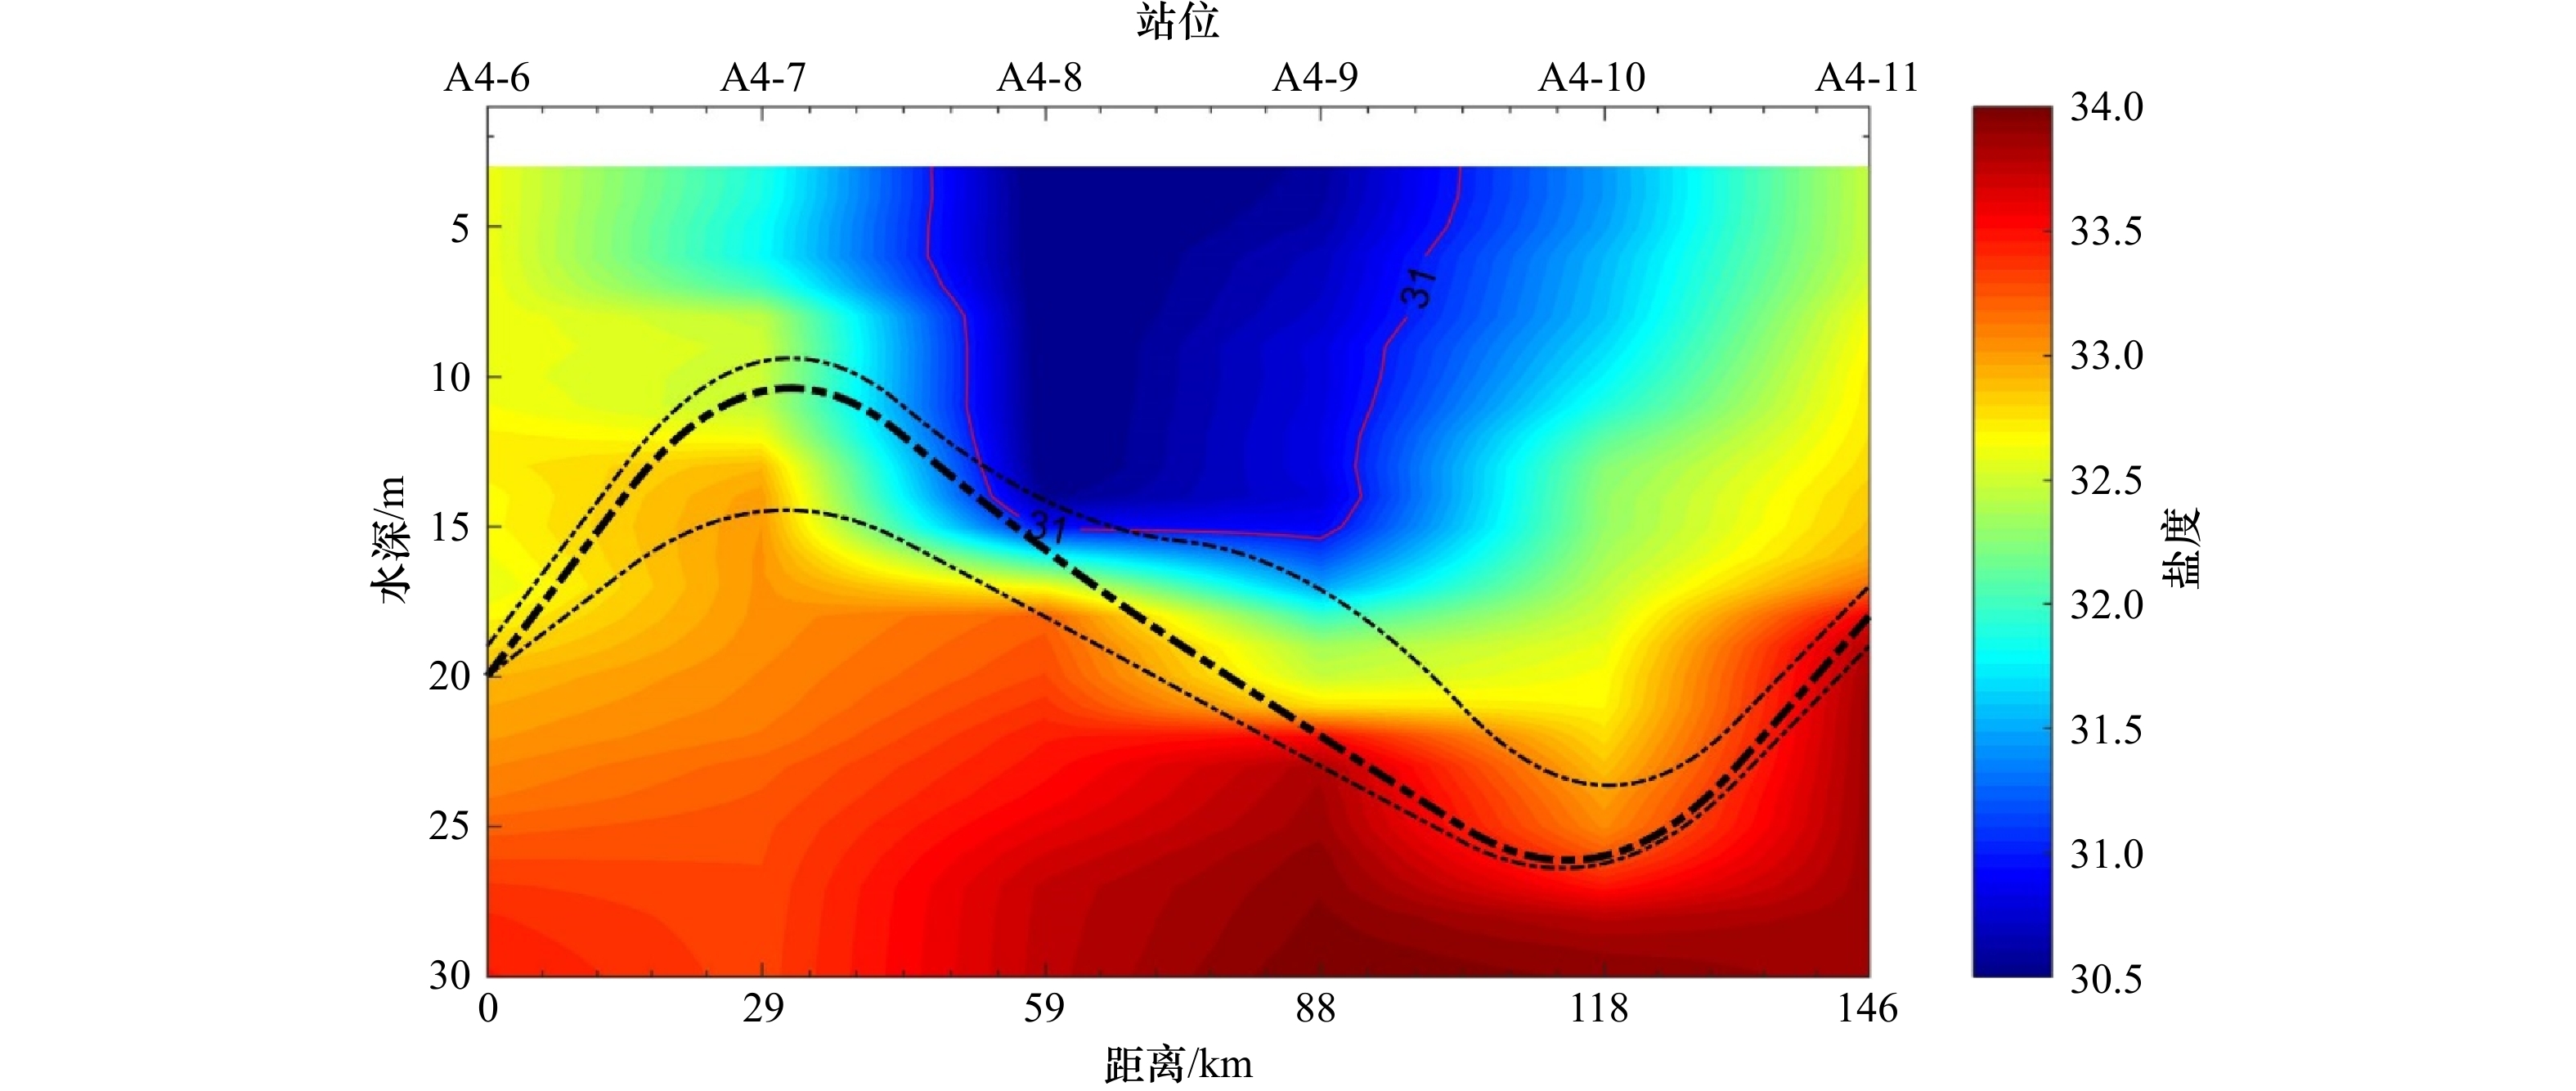
图 4 夏季A4断面的盐度分布
红线为盐度为31的等值线;黑细虚线代表以0.1 m−1为标准计算得到的盐跃层范围;黑粗虚线代表盐跃层强度最强的位置
Fig. 4 The salinity distribution of Section A4 in summer
The red line is the contour line with a salinity of 31; the black thin dashed line represents the range of the halocline calculated based on the standard of 0.1 m−1; the thick black dashed line represents the location of the strongest halocline
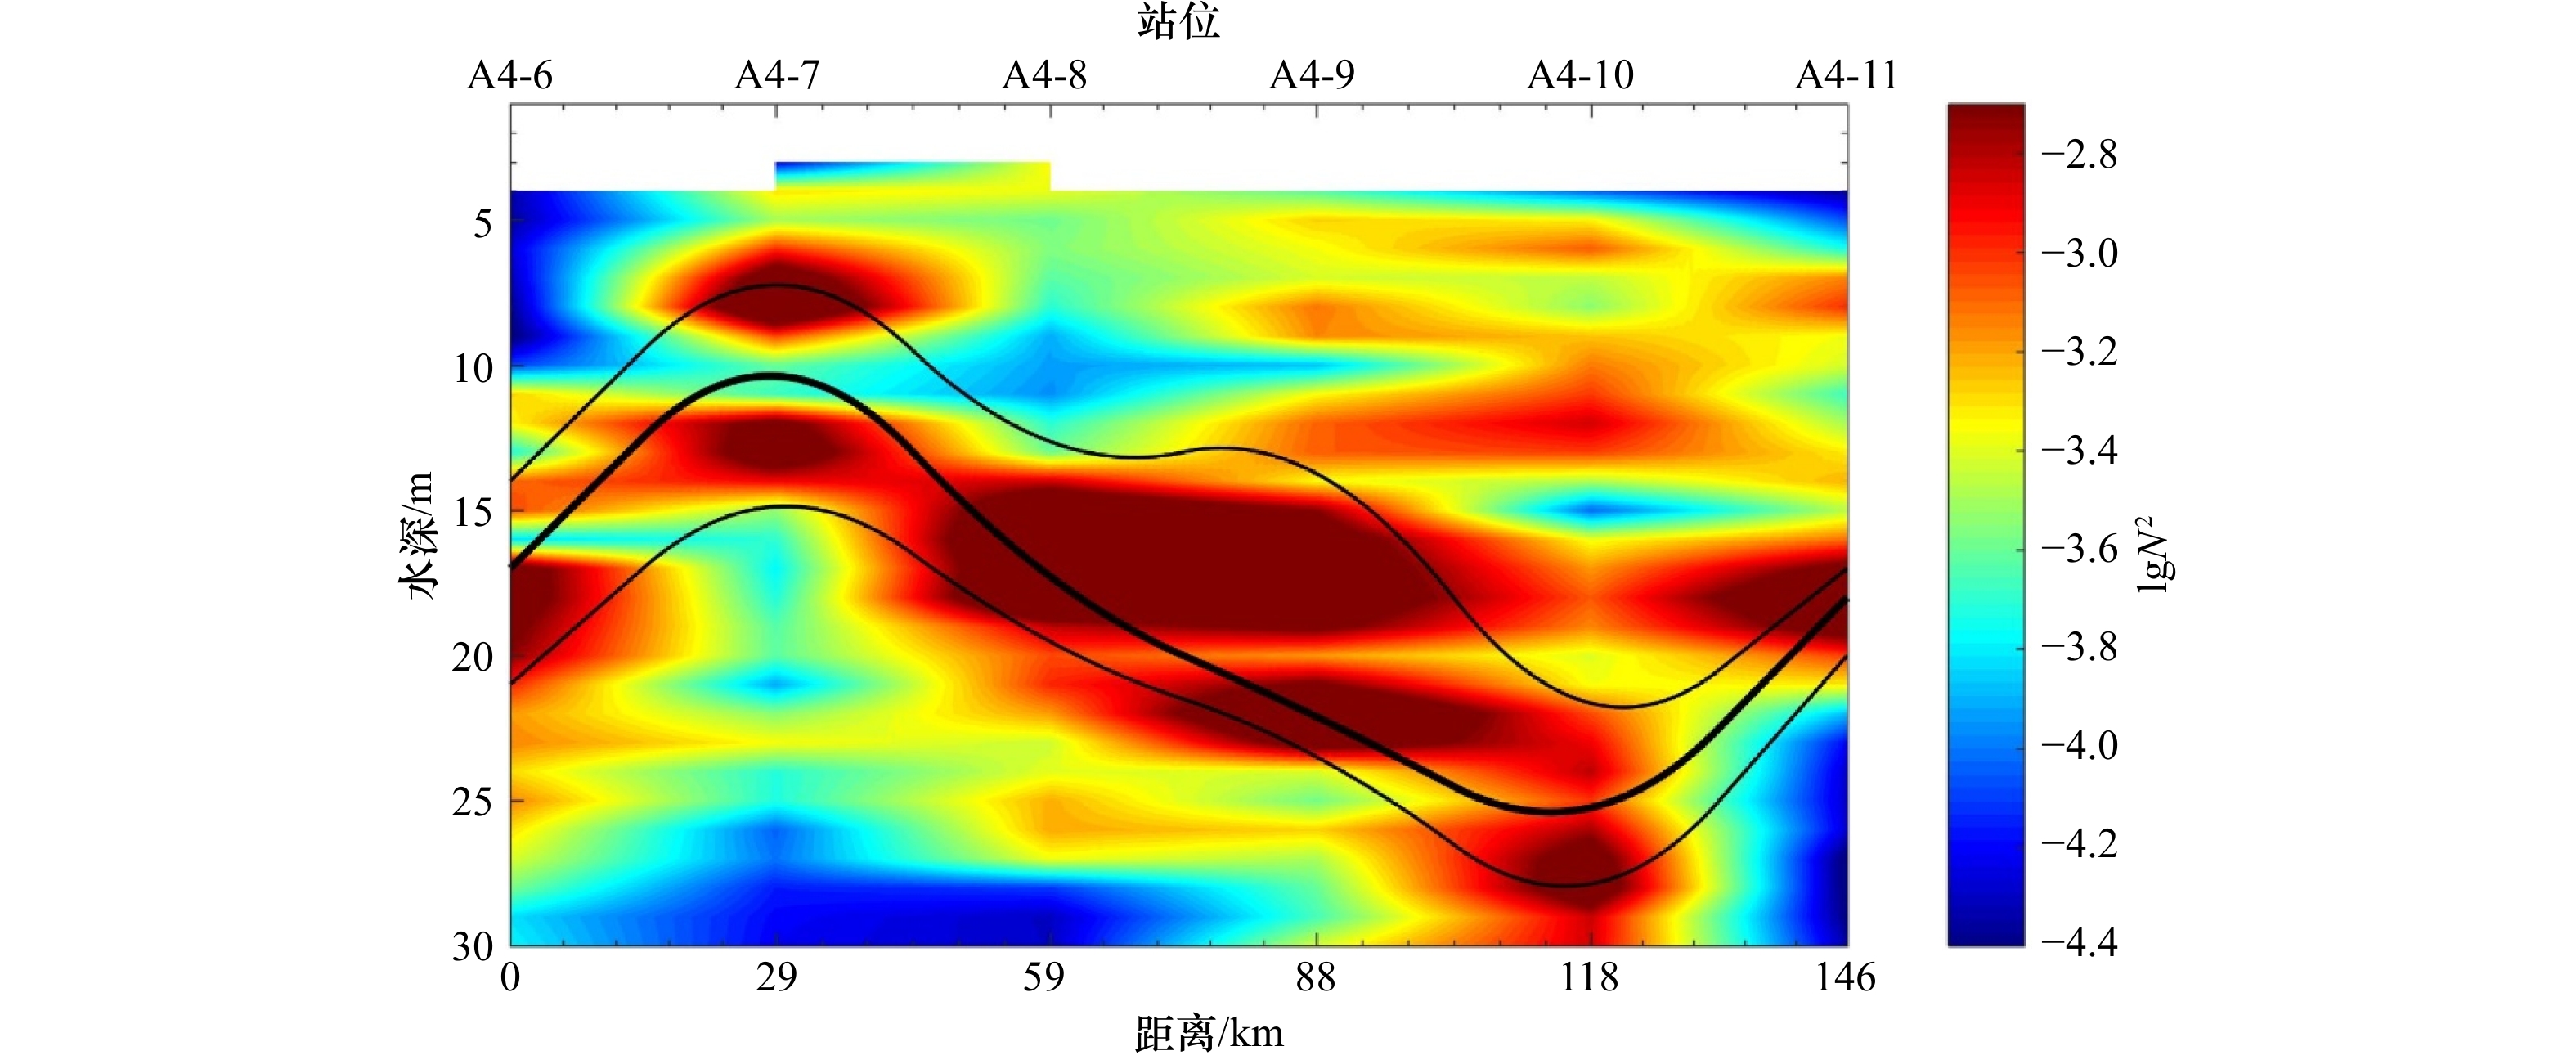
图 5 夏季A4断面的浮性频率(lgN2)分布
黑细线代表以0.2℃/m为标准计算得到的温跃层范围;黑粗线代表温跃层强度最强的位置;N2单位:s−2
Fig. 5 The distribution of the buoyancy frequency (lgN2) of Section A4 in summer
The thin black line represents the range of the thermocline calculated with 0.2℃/m as the standard; the thick black line represents the strongest location of the thermocline; the unit of N2 is s−2

图 6 夏季A4断面的湍动能耗散率(lgε)示意图
红线代表盐度为31的等值线;黑虚线为盐跃层的范围;黑实线为温跃层的范围;ε单位:W/kg
Fig. 6 Schematic diagram of the turbulent energy dissipation rate (lgε) of Section A4 in summer
The red line represents the contour line with a salinity of 31; the black dotted line is the range of the halocline; the black solid line is the range of the thermocline; the unit of ε is W/kg
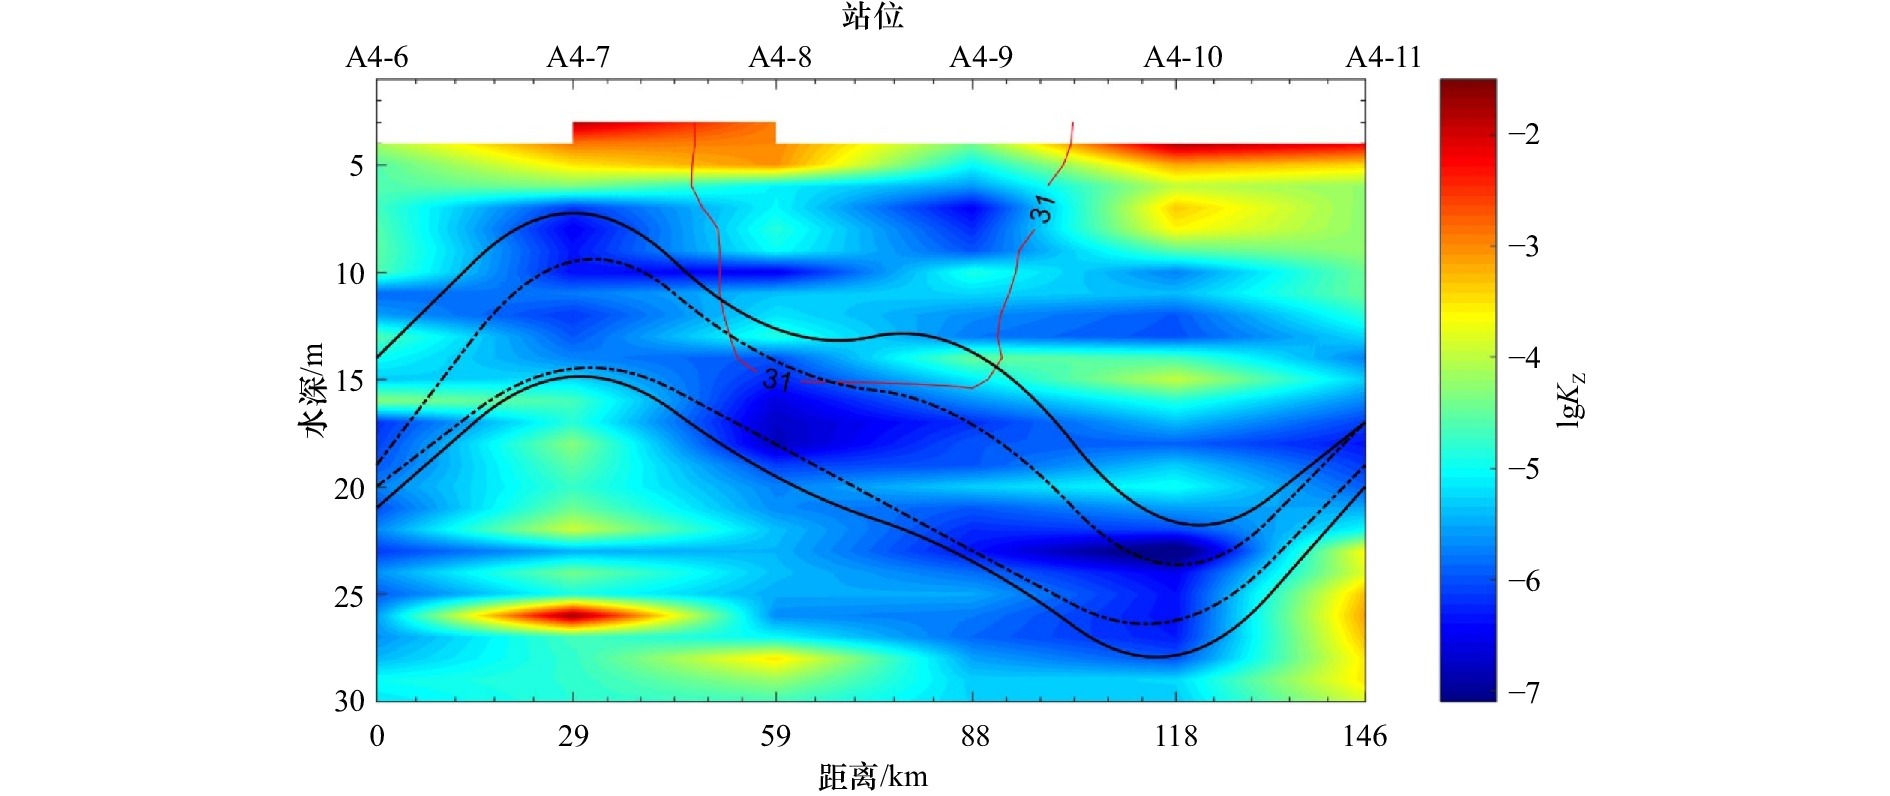
图 7 夏季A4断面的垂向湍扩散系数(lgKZ)的分布
红线代表盐度为31的等值线;黑虚线为盐跃层的范围;黑实线为温跃层的范围;KZ单位:m2/s
Fig. 7 The distribution of vertical turbulent diffusion coefficient (lgKZ) of Section A4 in summer
The red line represents the contour line with a salinity of 31; black dotted line is the halocline range; the black solid line is the thermocline range; the unit of KZ is m2/s
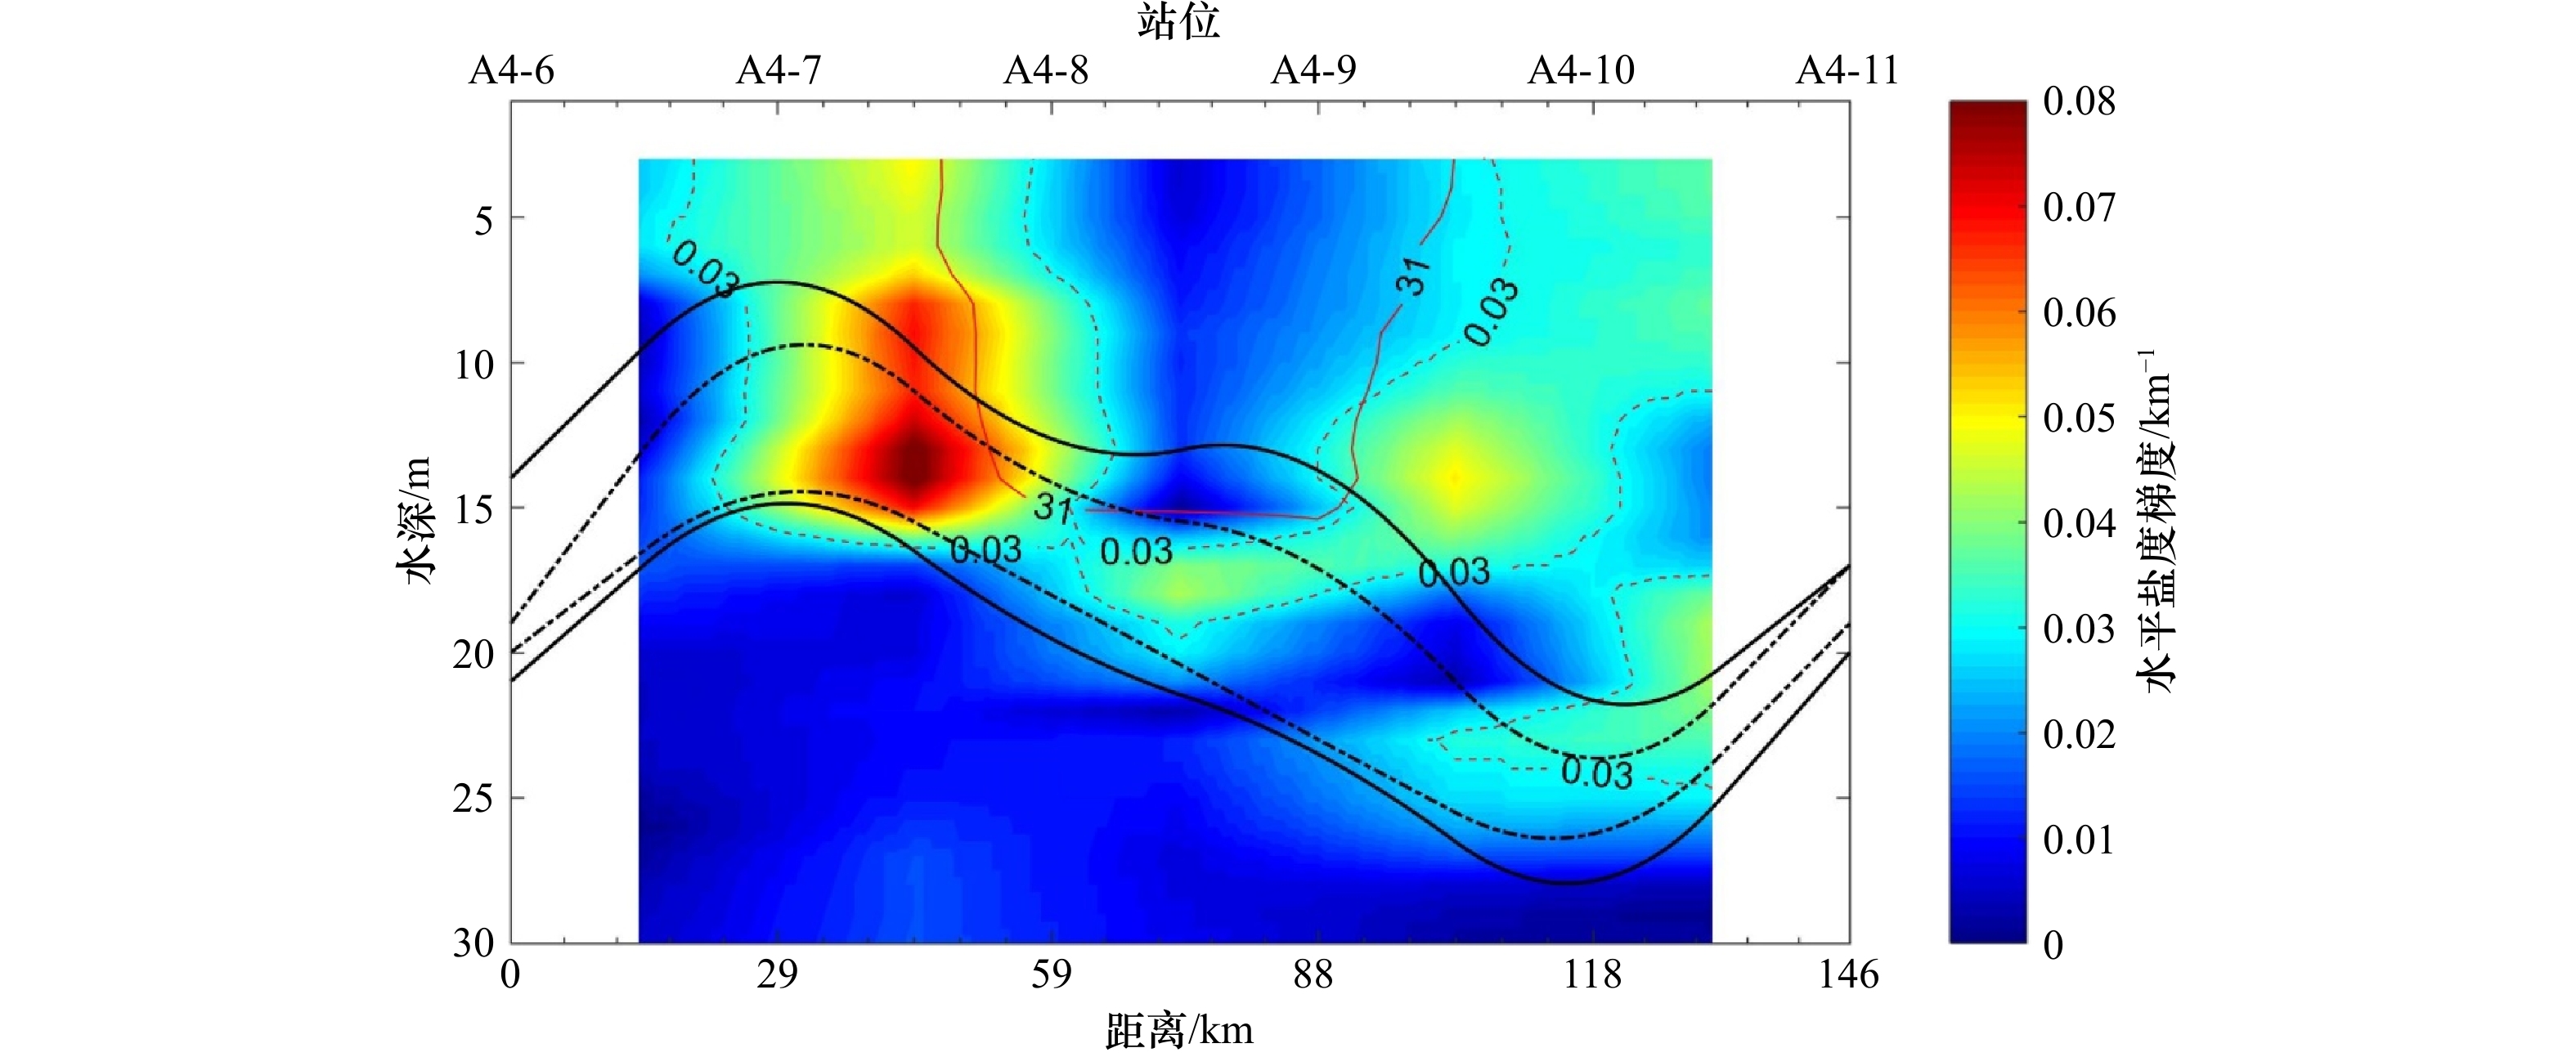
图 8 水平盐度梯度
红色虚线包含的范围代表盐度锋面(0.03 km−1);红线代表盐度为31的等盐线;黑实线代表温跃层的位置;黑虚线代表盐跃层的位置
Fig. 8 Horizontal salinity gradient
The range covered by the white line represents the salinity front (0.03 km−1); the red line represents the isosalt with a salinity of 31; the black solid line represents the location of the thermocline; the black dotted line represents the location of the halocline

图 9 上升流(a)和下降流(b)的形成示意图
Fig. 9 Schematic diagram of the formation of upwelling (a) and downwelling (b)
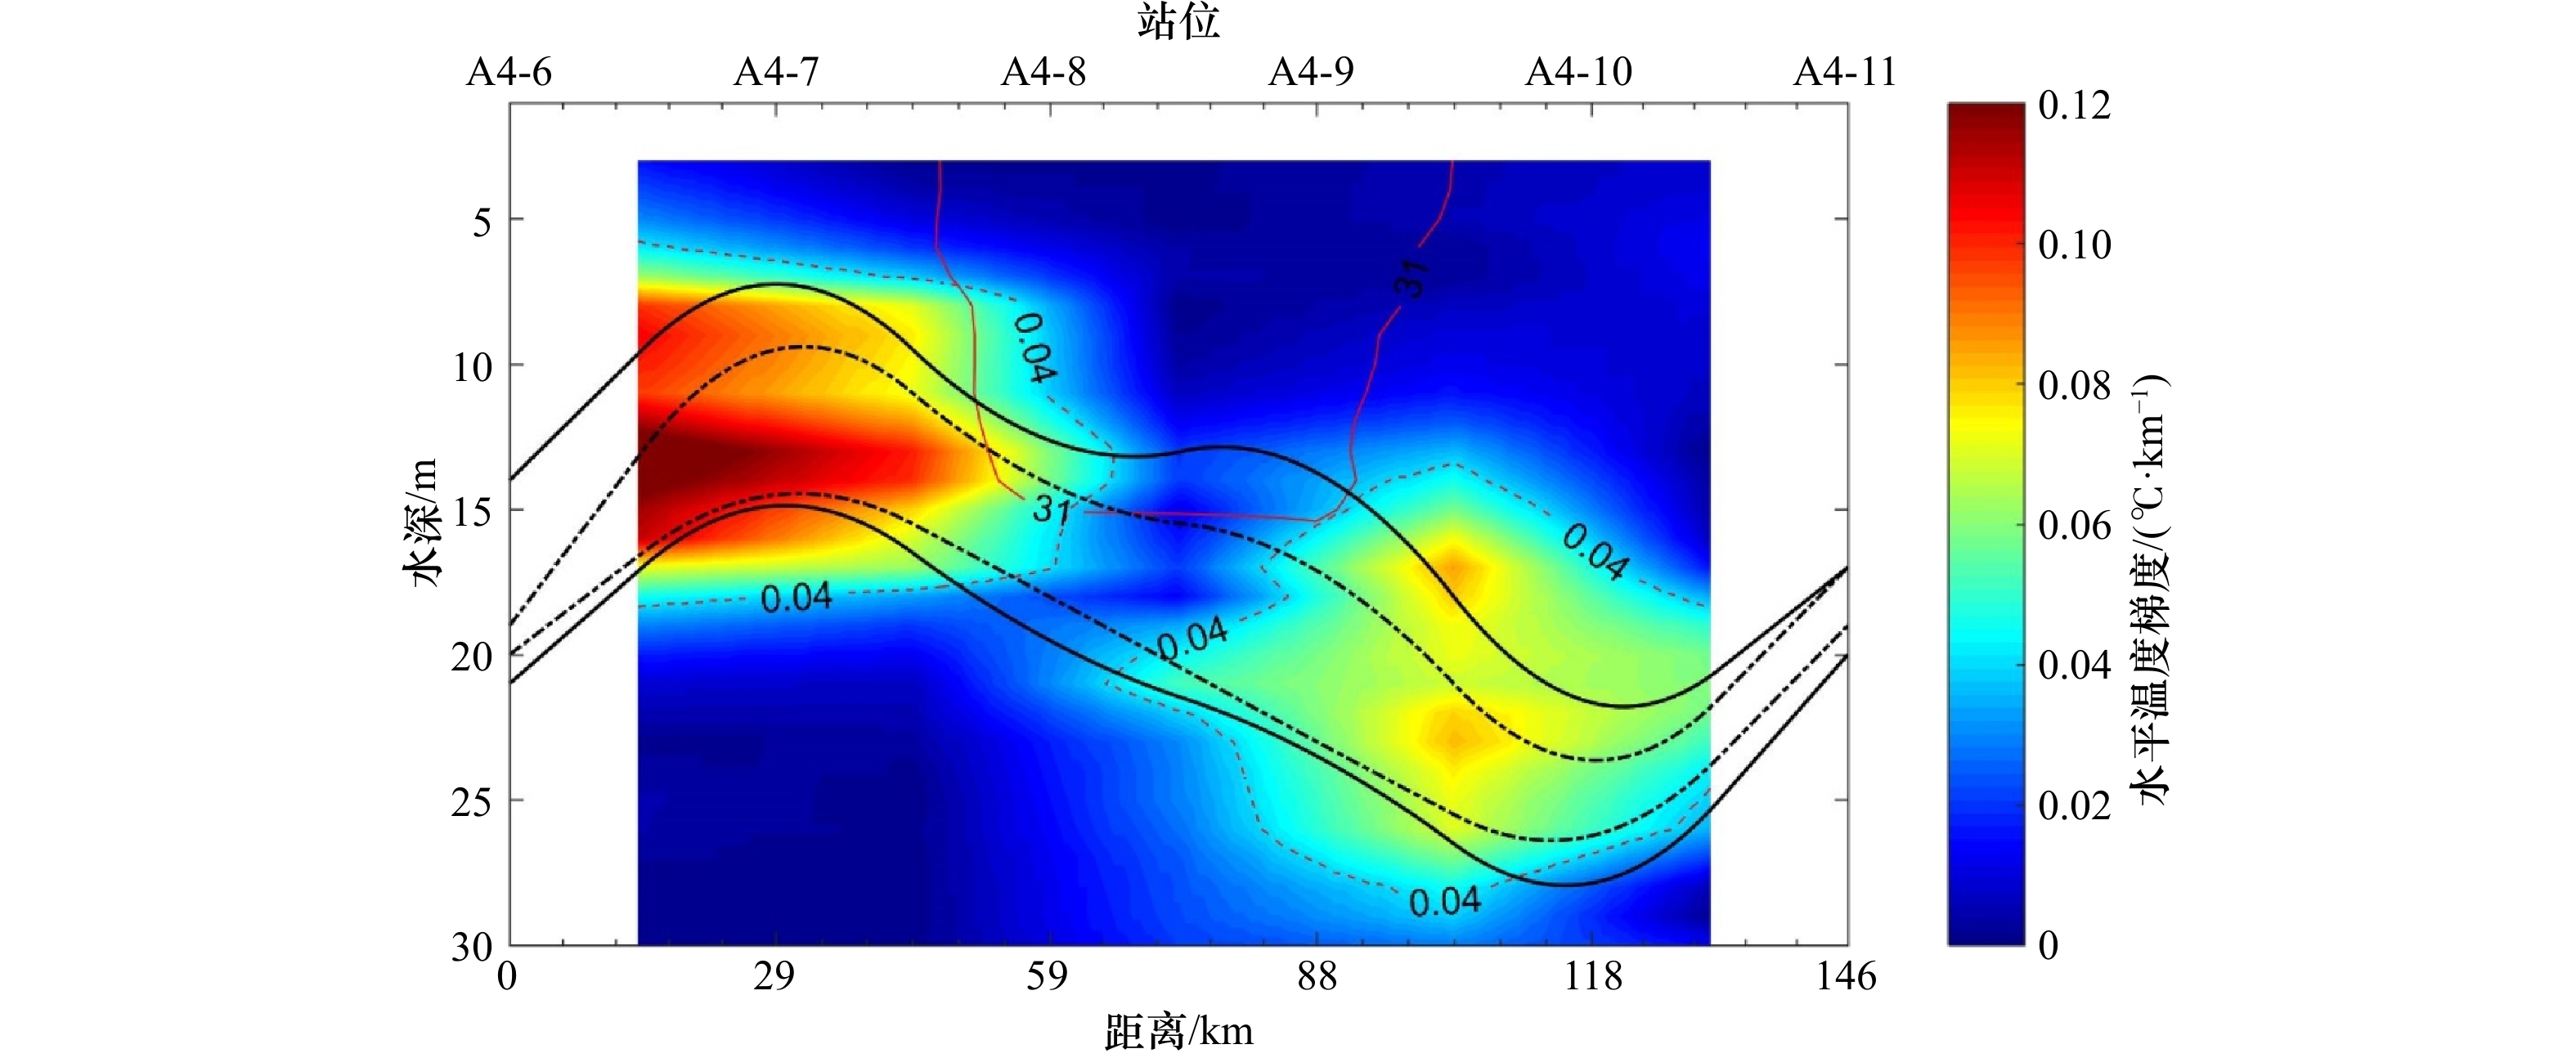
图 10 水平温度梯度
红线包含的范围代表温度锋面(0.04℃/km);红线代表盐度为31的等盐线;黑实线代表温跃层的位置;黑虚线代表盐跃层的位置
Fig. 10 Horizontal temperature gradient
The range covered by the white line represents the temperature front (0.04°C/km); red line represents the isosalt with a salinity of 31; the black solid line represents the location of the thermocline; and the black dotted line represents the location of the halocline
-
[1] 张文静, 朱首贤, 李训强, 等. 潮致余流和潮混合对长江口外东北海域低盐水团的作用[J]. 海洋学报, 2014, 36(3): 9−18.Zhang Wenjing, Zhu Shouxian, Li Xunqiang, et al. Impact of tide induced residual current and tidal mixing on the low salinity water lens in the northeast out of the Changjiang River Estuary[J]. Haiyang Xuebao, 2014, 36(3): 9−18. [2] Thorpe S A. An Introduction to Ocean Turbulence[M]. Cambridge: Cambridge University Press, 2007. [3] 赵骞. 东中国海环流与混合的研究[D]. 青岛: 中国海洋大学, 2006.Zhao Qian. Study on the circulation and mixing in the East China Sea[D]. Qingdao: Ocean University of China, 2006. [4] 刘志宇. 强潮驱陆架海中的湍流与混合[D]. 青岛: 中国海洋大学, 2009.Liu Zhiyu. Turbulence and mixing in tidally energetic shelf seas[D]. Qingdao: Ocean University of China, 2009. [5] Simpson J H, Brown J, Matthews J, et al. Tidal straining, density currents and stirring in the control of estuarine stratification[J]. Estuaries, 1990, 13(2): 125−132. doi: 10.2307/1351581 [6] MacKinnon J A, Gregg M C. Mixing on the late-summer New England shelf—solibores, shear, and stratification[J]. Journal of Physical Oceanography, 2003, 33(7): 1476−1492. doi: 10.1175/1520-0485(2003)033<1476:MOTLNE>2.0.CO;2 [7] MacDonald D G, Geyer W R. Turbulent energy production and entrainment at a highly stratified estuarine front[J]. Journal of Geophysical Research Atmospheres, 2004, 109(C5): C05004. [8] Nash J D, Kilcher L F, Moum J N. Structure and composition of a strongly stratified, tidally pulsed river plume[J]. Journal of Geophysical Research: Oceans, 2010, 114(C2): C00B12. [9] 周磊, 田纪伟, 张效谦. 东海陆架坡折小尺度过程观测[J]. 科学通报, 2005, 50(24): 2885−2890.Zhou Lei, Tian Jiwei, Zhang Xiaoqian. Observation of small-scale processes over shelf break in the East China Sea[J]. Chinese Science Bulletin, 2005, 50(24): 2885−2890. [10] 梁鑫峰, 田纪伟, 张效谦. 东海陆架坡折处温度微结构观测[J]. 自然科学进展, 2006, 16(10): 1268−1274. doi: 10.3321/j.issn:1002-008X.2006.10.010Liang Xinfeng, Tian Jiwei, Zhang Xiaoqian. Observation of the temperature microstructure at the break of the East China Sea shelf[J]. Progress in Natural Science, 2006, 16(10): 1268−1274. doi: 10.3321/j.issn:1002-008X.2006.10.010 [11] 刘志宇, 魏皓. 黄海潮流底边界层内湍动能耗散率与底应力的估计[J]. 自然科学进展, 2007, 17(3): 362−369. doi: 10.3321/j.issn:1002-008X.2007.03.011Liu Zhiyu, Wei Hao. Estimation to the turbulent kinetic energy dissipation rate and bottom shear stress in the tidal bottom boundary layer of the Yellow Sea[J]. Progress in Natural Science, 2007, 17(3): 362−369. doi: 10.3321/j.issn:1002-008X.2007.03.011 [12] 杨丽芬, 田纪伟, 谢玲玲. 南海北部陆坡区混合过程观测[J]. 海洋科学, 2008, 32(12): 10−16.Yang Lifen, Tian Jiwei, Xie Lingling. Observation of mixing processes over the continental slope of the northern South China Sea[J]. Marine Sciences, 2008, 32(12): 10−16. [13] 卢著敏, 陈桂英, 谢晓辉, 等. 夏季南海北部海洋混合的微结构特征研究[J]. 自然科学进展, 2009, 19(6): 657−663. doi: 10.3321/j.issn:1002-008X.2009.06.011Lu Zhumin, Chen Guiying, Xie Xiaohui, et al. Study on the microstructure characteristics of ocean mixing in the northern South China Sea in summer[J]. Progress in Natural Science, 2009, 19(6): 657−663. doi: 10.3321/j.issn:1002-008X.2009.06.011 [14] 魏传杰, 于非, 郭景松, 等. 黄海西部海洋湍流的季节变化特征分析[J]. 海洋与湖沼, 2014, 45(1): 166−171.Wei Chuanjie, Yu Fei, Guo Jingsong, et al. Seasonal variation of ocean turbulence in the western Yellow Sea[J]. Oceanologia et Limnologia Sinica, 2014, 45(1): 166−171. [15] Zhang Qianjiang, Wu Jiaxue. On the phase lag of turbulent dissipation in rotating tidal flows[J]. Continental Shelf Research, 2018, 156: 23−32. doi: 10.1016/j.csr.2018.02.001 [16] Prandle D. The vertical structure of tidal currents and other oscillatory flows[J]. Continental Shelf Research, 1982, 1(2): 191−207. doi: 10.1016/0278-4343(82)90004-8 [17] Adolf S. Dissipation Measurement: Theory[M]. Cambridge: Cambridge University Press, 2005. [18] Roget E, Lozovatsky I, Sanchez X, et al. Microstructure measurements in natural waters: Methodology and applications[J]. Progress in Oceanography, 2006, 70(2/4): 126−148. [19] Wolk F, Yamazaki H, Seuront L, et al. A new free-fall profiler for measuring biophysical microstructure[J]. Journal of Atmospheric and Oceanic Technology, 2002, 19(5): 780−793. doi: 10.1175/1520-0426(2002)019<0780:ANFFPF>2.0.CO;2 [20] Batchelor G K. The Theory of Homogeneous Turbulence[M]. Cambridge: Cambridge University Press, 1953. [21] Dewey R K, Crawford W R. Bottom stress estimates from vertical dissipation rate profiles on the continental shelf[J]. Journal of Physical Oceanography, 1988, 18(8): 1167−1177. doi: 10.1175/1520-0485(1988)018<1167:BSEFVD>2.0.CO;2 [22] Osborn T R. Estimates of the local rate of vertical diffusion from dissipation measurements[J]. Journal of Physical Oceanography, 1980, 10(1): 83−89. doi: 10.1175/1520-0485(1980)010<0083:EOTLRO>2.0.CO;2 [23] 史军强, 陈学恩. 基于舟山外海连续测站的湍混合研究[J]. 中国海洋大学学报, 2015, 45(3): 25−32.Shi Junqiang, Chen Xueen. Study on turbulent mixing based on the in-situ continuous observations station in the Zhoushan sea[J]. Periodical of Ocean University of China, 2015, 45(3): 25−32. [24] 国家技术监督局. GB/T 12763.7−1991, 海洋调查规范-海洋调查资料处理[S]. 北京: 中国标准出版社, 1992: 67-70.National Bureau of Technical Supervision. GB/T 12763.7−1991, The specification for oceanographic survey-Oceanographic survey data processing[S]. Beijing: China Standards Press, 1992: 67−70. [25] 李博, 卢军炯, 王鹏皓, 等. 长江冲淡水扩展区域孤立水团分析[J]. 海洋与湖沼, 2019, 50(6): 1181−1190. doi: 10.11693/hyhz20190500096Li Bo, Lu Junjiong, Wang Penghao, et al. Isolated low-salinity water mass in expansion area of Changjiang Diluted Water[J]. Oceanologia et Limnologia Sinica, 2019, 50(6): 1181−1190. doi: 10.11693/hyhz20190500096 [26] Wu Hui, Zhu Jianrong, Shen Jian, et al. Tidal modulation on the Changjiang River plume in summer[J]. Journal of Geophysical Research: Oceans, 2011, 116(C8): C08017. doi: 10.1029/2011JC007209 [27] Li Ming, Rong Zengrui. Effects of tides on freshwater and volume transports in the Changjiang River plume[J]. Journal of Geophysical Research: Oceans, 2012, 117(C6): C06027. [28] 赵保仁. 长江口外的上升流现象[J]. 海洋学报, 1993, 15(2): 108−114.Zhao Baoren. Upwelling phenomenon outside the Yangtze River Estuary[J]. Haiyang Xuebao, 1993, 15(2): 108−114. [29] 李凯, 高璐, 董旭, 等. 2014年与2015年夏季琼东上升流的年际变化及其成因分析[J]. 海洋学报, 2019, 41(1): 1−10.Li Kai, Gao Lu, Dong Xu, et al. The interannual variation and preliminary analysis of upwelling in eastern Hainan Island in summer of 2014 and 2015[J]. Haiyang Xuebao, 2019, 41(1): 1−10. [30] Lü Xingang, Qiao Fangli, Xia Changshui, et al. Upwelling off Yangtze River estuary in summer[J]. Journal of Geophysical Research: Oceans, 2006, 111(C11): C11S08. [31] Meng Qicheng, Xuan Jiliang, Zhang Wenyan, et al. Impact of submesoscale vertical advection on primary productivity in the southern East China Sea[J]. Journal of Geophysical Research: Biogeosciences, 2020, 125(8): e2019JG005540. [32] Chu P C. C-vector for identification of oceanic secondary circulations across Arctic Fronts in Fram Strait[J]. Geophysical Research Letters, 2002, 29(24): 10-1−10-4. doi: 10.1029/2002GL015978 [33] Chant R J, Wilson R E. Secondary circulation in a highly stratified estuary[J]. Journal of Geophysical Research: Oceans, 1997, 102(C10): 23207−23215. doi: 10.1029/97JC00685 -

 下载:
下载:
计量
- 文章访问数: 855
- HTML全文浏览量: 323
- PDF下载量: 69
- 被引次数: 0
