

Projectied longterm trend of the Southeast Indian subantarctic mode water under climate change scenarios
-
摘要: 基于参与第六次耦合模式比较计划(CMIP6)的8个地球系统耦合模式所输出的历史模拟结果,本文通过与观测对比,评估了CMIP6模式对东南印度洋亚南极模态水的模拟能力,并预估了在中等强迫情景和高强迫情景下,该模态水潜沉率、体积及性质的变化趋势。结果表明:与Argo观测相比,CMIP6模式中南印度洋混合层偏深且上层海洋的位势密度偏小,因此其模拟的东南印度洋亚南极模态水潜沉率偏大而位势密度偏小。不同CMIP6模式之间模拟的东南印度洋亚南极模态水潜沉区存在差异,混合层侧向输入是导致这一差异的主要原因。此外,在历史模拟和两种情景试验中,东南印度洋亚南极模态水均呈现出潜沉率和体积减小、温度升高、盐度和密度降低的趋势。其中,在高强迫情景下,变化趋势最大,中等强迫情景次之,历史模拟中的变化趋势最小。这表明,辐射强迫越强,东南印度洋海表温度升高和淡水输入增加的趋势越大,导致混合层变浅及其南北梯度减小的趋势越快,东南印度洋亚南极模态水潜沉率、体积和性质变化的趋势也随之增大。Abstract: Based on the outputs of eight earth system models involved in the Coupled Model Intercomparison Project Phase 6 (CMIP6), this study assessed the simulation skill of the Southeast Indian subantarctic mode water (SEISAMW) of these models by comparing with observations. Moreover, this study investigated the projected long-term trends in subduction rate, volume and properties of the SEISAMW under medium and high greenhouse gas emission scenarios (i.e., SSP245, SSP585). The results show that the CMIP6 models generally have produced artificially greater mixed layer depth and smaller upper layer potential density in comparison with those of the Argo observation. Consequently, the simulated SEISAMW in the CMIP6 models are generally with larger subduction rate and smaller potential density. Meanwhile, the subduction regions of the SEISAMWs show significant differences among the analyzed CMIP6 models, which are attribute to lateral induction in the mixed layer. Furthermore, in the historical, SSP245 and SSP585 outputs, the SEISAMWs show consistent decreasing trends in subduction rate and volume, increasing trend in temperature, and decreasing trends in salinity and potential density. The long-term trends of the SEISAMWs are largest under SSP585 scenario, followed by the SSP245 scenario and historical simulation. The projected trends of SEISAMW can be explained by the following mechanism: the temperature and freshwater flux in the southeastern Indian Ocean upper layer tend to increase under enhanced radioactive forcing, resulting in shoaling in mixed layer and flattening of the mixed layer gradient. As a result, the trends of SEISAMWs in subduction rate, volume and water properties show larger values in accordance with stronger radioactive forcing.
-
Key words:
- CMIP6 /
- Southeast Indian Ocean /
- subantarctic mode water /
- subduction rate /
- climate change /
- scenario experiments
-
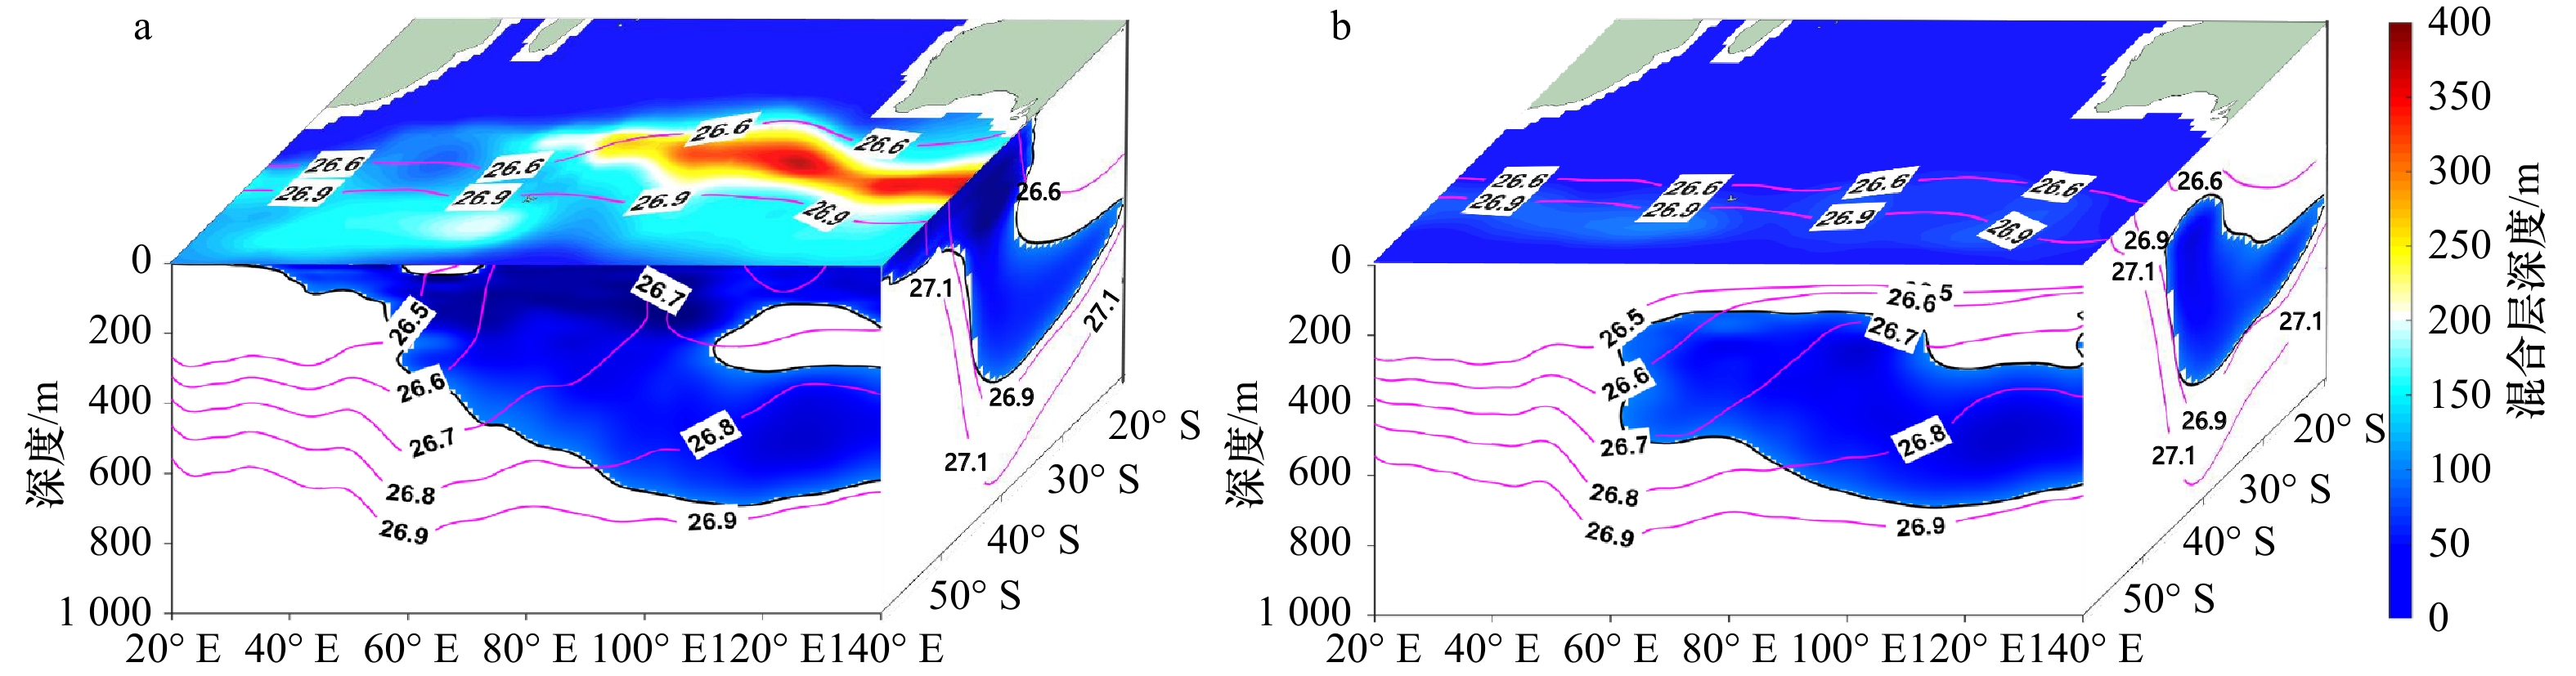
图 1 东南印度洋亚南极模态水形成示意图
a. 混合层加深及东南印度洋亚南极模态水潜沉(9月);b. 混合层变浅及东南印度洋亚南极模态水完全潜沉(12月);水平表面为混合层深度(填色)和26.6 kg/m3与26.9 kg/m3的等位势密度线(实线);垂向断面为位势涡度极小值区域(填色)和位势密度等值线(实线);基于2005–2018年Argo数据的气候态结果绘制
Fig. 1 Schematic diagram of Southeast Indian subantarctic mode water (SEISAMW) formation
a. The deep mixed layer and SEISAMW subduction in September; b. the shallow mixed layer and subducted SEISAMW in December; horizontal surface presents the mixed layer depth (shaded) and isopycnals of 26.6 kg/m3 and 26.9 kg/m3 (solid lines); vertical section indicates the potential vorticity minima region (shaded) and isopycnals (solid lines); drawn by the climatological results based on Argo observations over the period of 2005 to 2018

图 2 CMIP6历史模拟结果和Argo观测东南印度洋(30°~52°S,60°~120°E)混合层深度的季节变化
Fig. 2 Seasonal variability of mixed layer depth in the Southeast Indian Ocean (30°–52°S,60°–120°E) derived from Argo and CMIP6 historical simulations

图 3 Argo和CMIP6历史模拟时期南印度洋9月混合层深度分布
Argo(a)和CMIP6(b)模式平均9月混合层深度;c. CMIP6与Argo 9月混合层深度之差;d. CMIP6模式间9月混合层深度标准差
Fig. 3 Monthly mean mixed layer depth in the Southern Indian Ocean in September derived from Argo and CMIP6 historical simulations
Mixed layer depth in September derived from Argo (a) and CMIP6 (b) multi-model mean; c. the difference of mixed layer depth in September between CMIP6 multi-model mean and Argo; d. the standard deviation of mixed layer depth in September among CMIP6 models
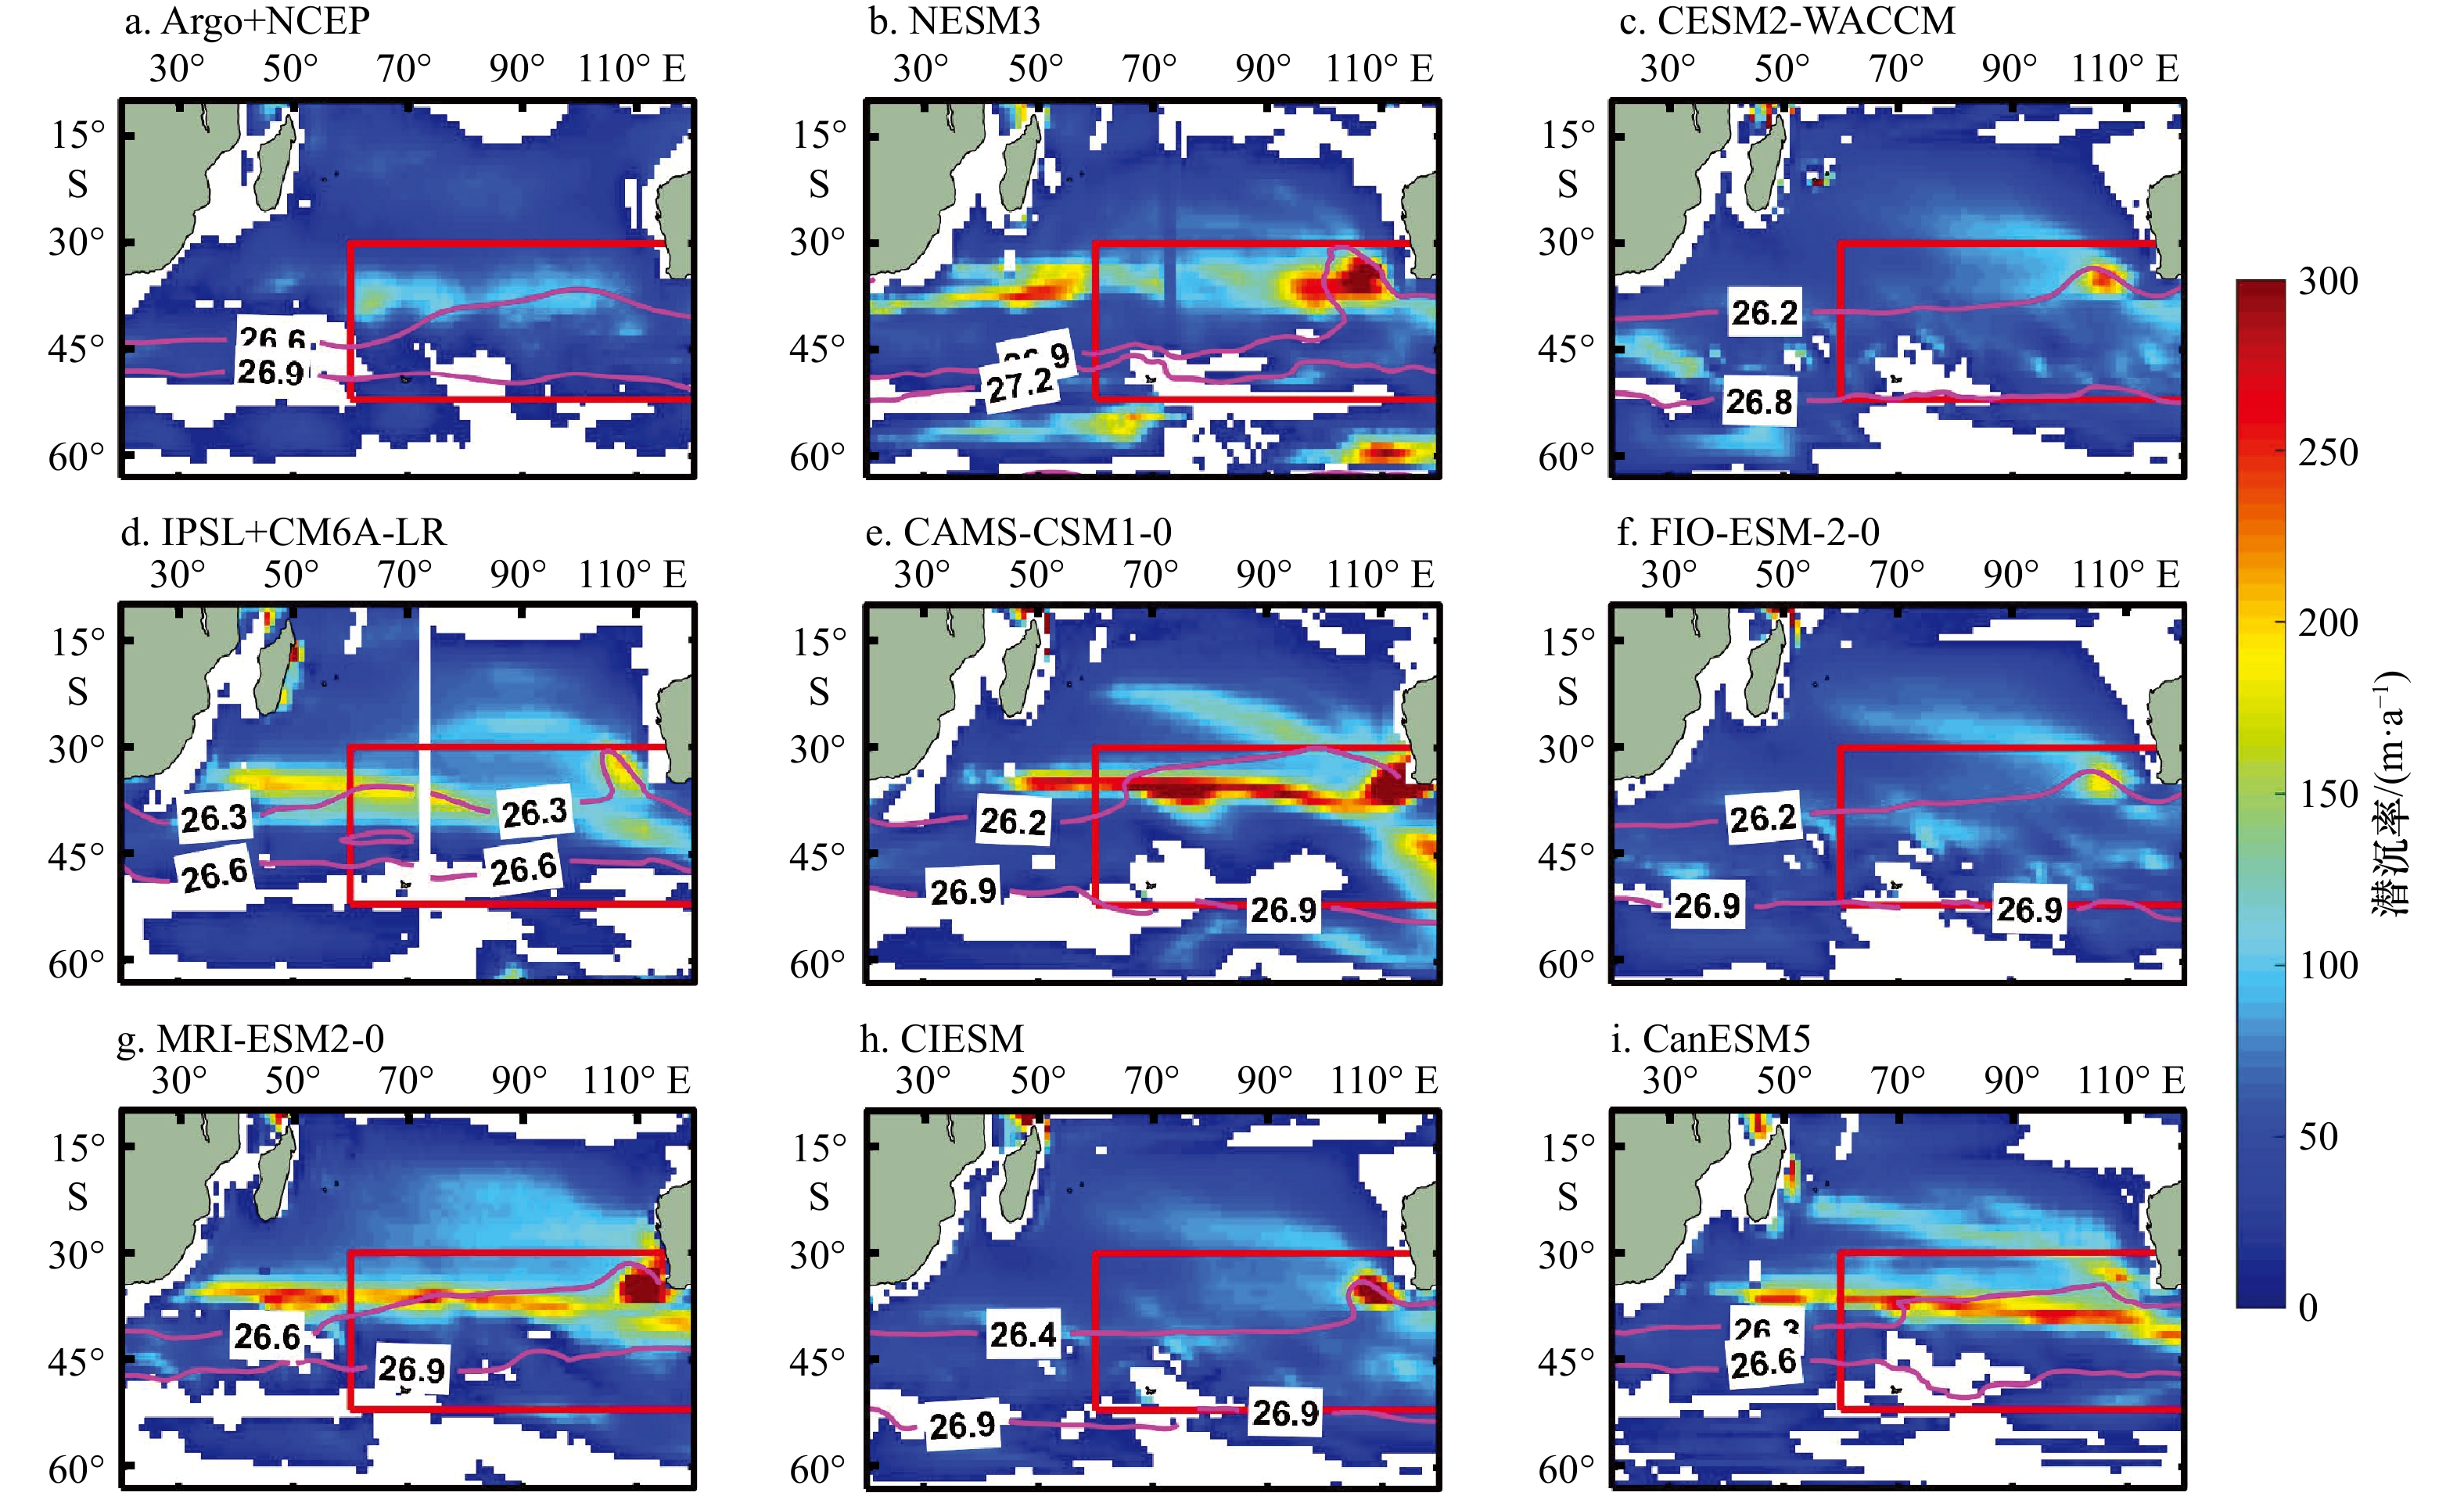
图 4 Argo和CMIP6历史模拟时期南印度洋的长期平均潜沉率分布
红框内位于等位势密度线之间的区域为东南印度洋亚南极模态水的生成海域
Fig. 4 The long-term average annual subduction rate in the Southern Indian Ocean derived from Argo and CMIP6 historical simulations
The region between isopycnals in the red solid boxes represent the formation region of Southeast Indian subantarctic mode water
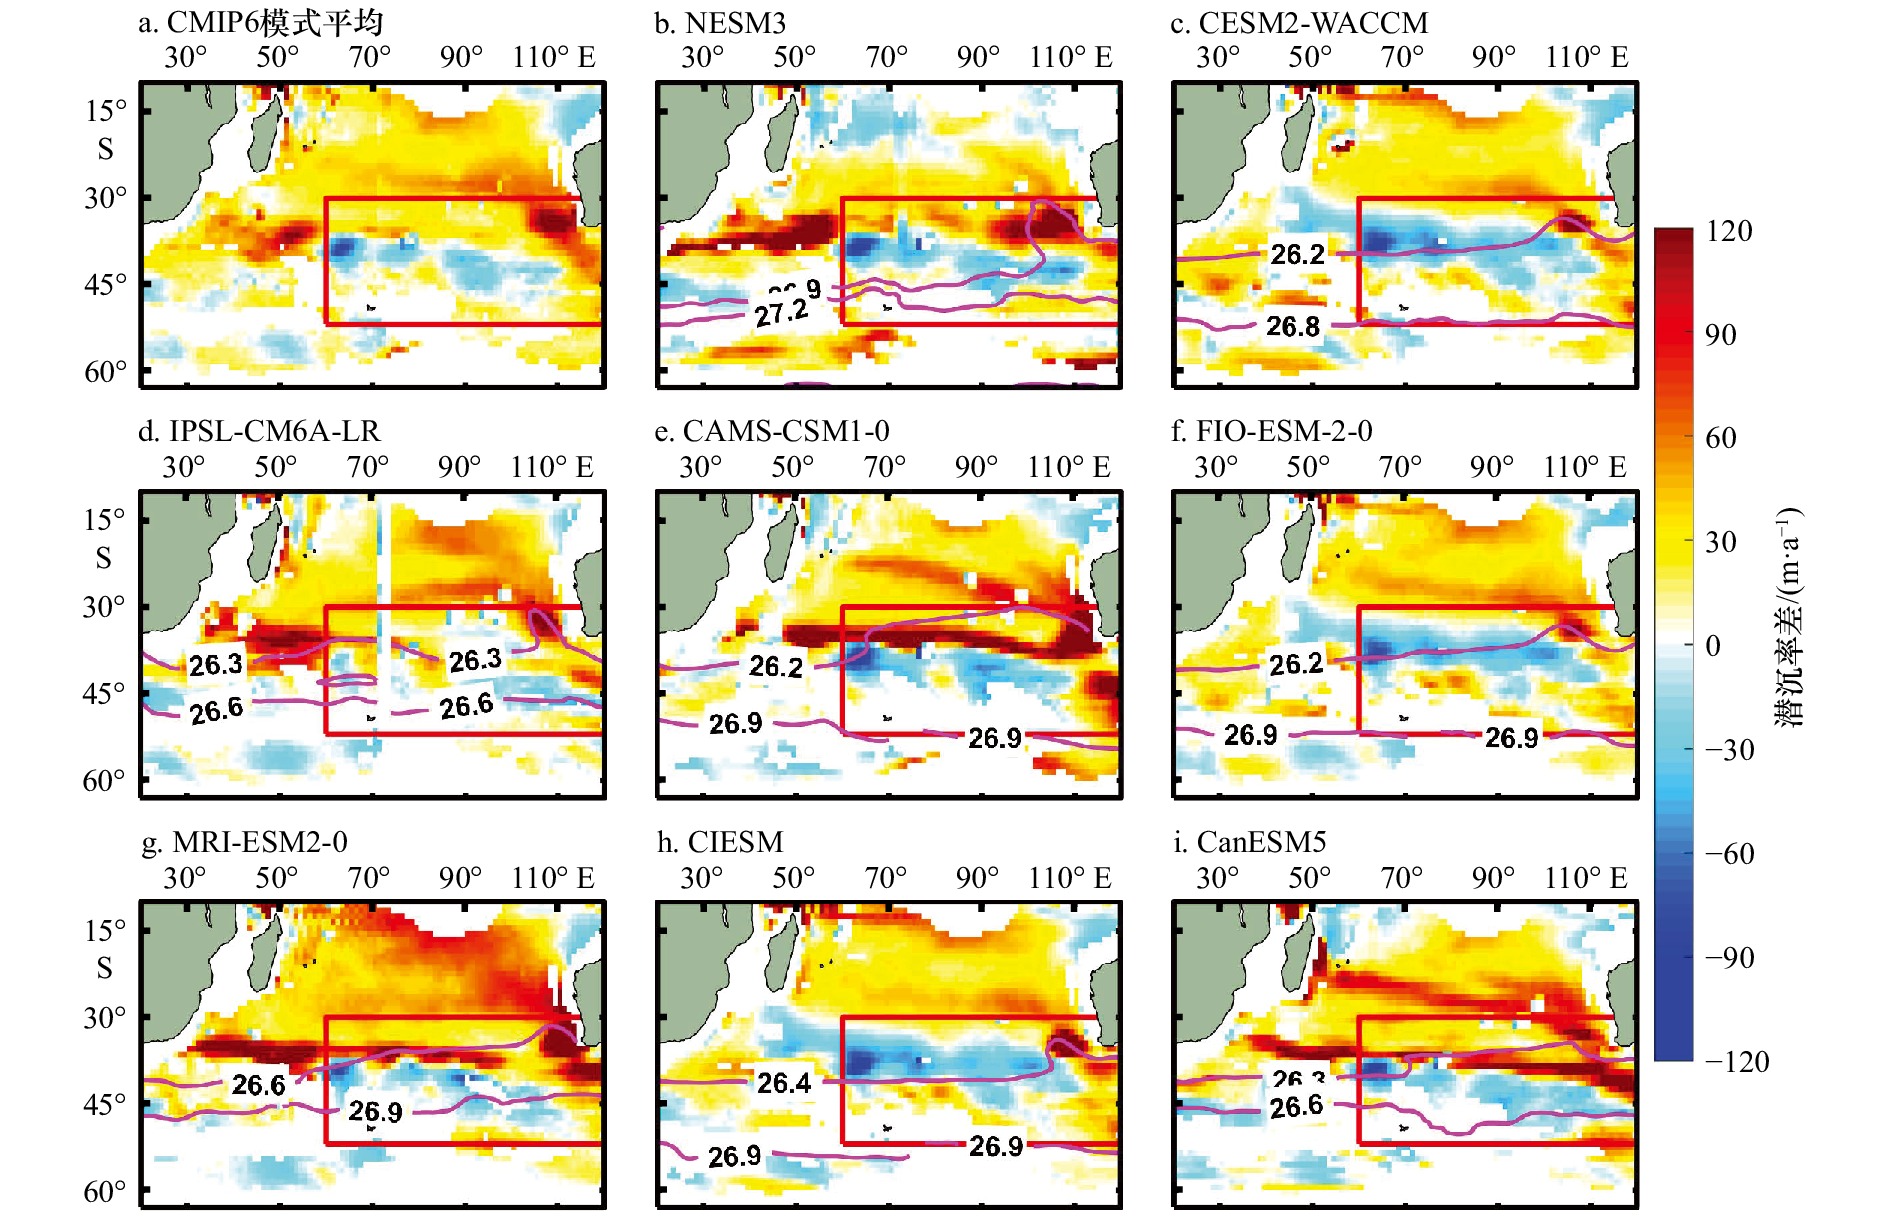
图 5 CMIP6模式和Argo地转流计算的南印度洋潜沉率之差
a. CMIP6模式平均与Argo潜沉率之差;b–i. 各CMIP6模式与Argo的潜沉率之差;红框内位于等位势密度线之间的区域为东南印度洋亚南极模态水的生成海域
Fig. 5 The difference of subduction rate calculated by geostrophic current in the Southern Indian Ocean derived from Argo and CMIP6 models
a. The difference of subduction rate between CMIP6 multi-model mean and Argo; b–i. the difference of subduction rate between CMIP6 models and Argo; the region between isopycnals in the red boxes represent the formation region of Southeast Indian subantarctic mode water

图 6 CMIP6模式中南印度洋潜沉率趋势分布
左列为历史模拟结果(1850–2014年);中列(SSP245)和右列(SSP585)为情景试验结果(2015–2100年);填色区域通过95%显著性检验
Fig. 6 The distribution of annual subduction rate trend in the Southern Indian Ocean derived from CMIP6 models
The left column are the results in the historical simulations from 1850 to 2014; the middle and right columns are the results of SSP245 and SSP585 from 2015 to 2100 respectively; the shaded region indicate significant trends at 95% confidence interval
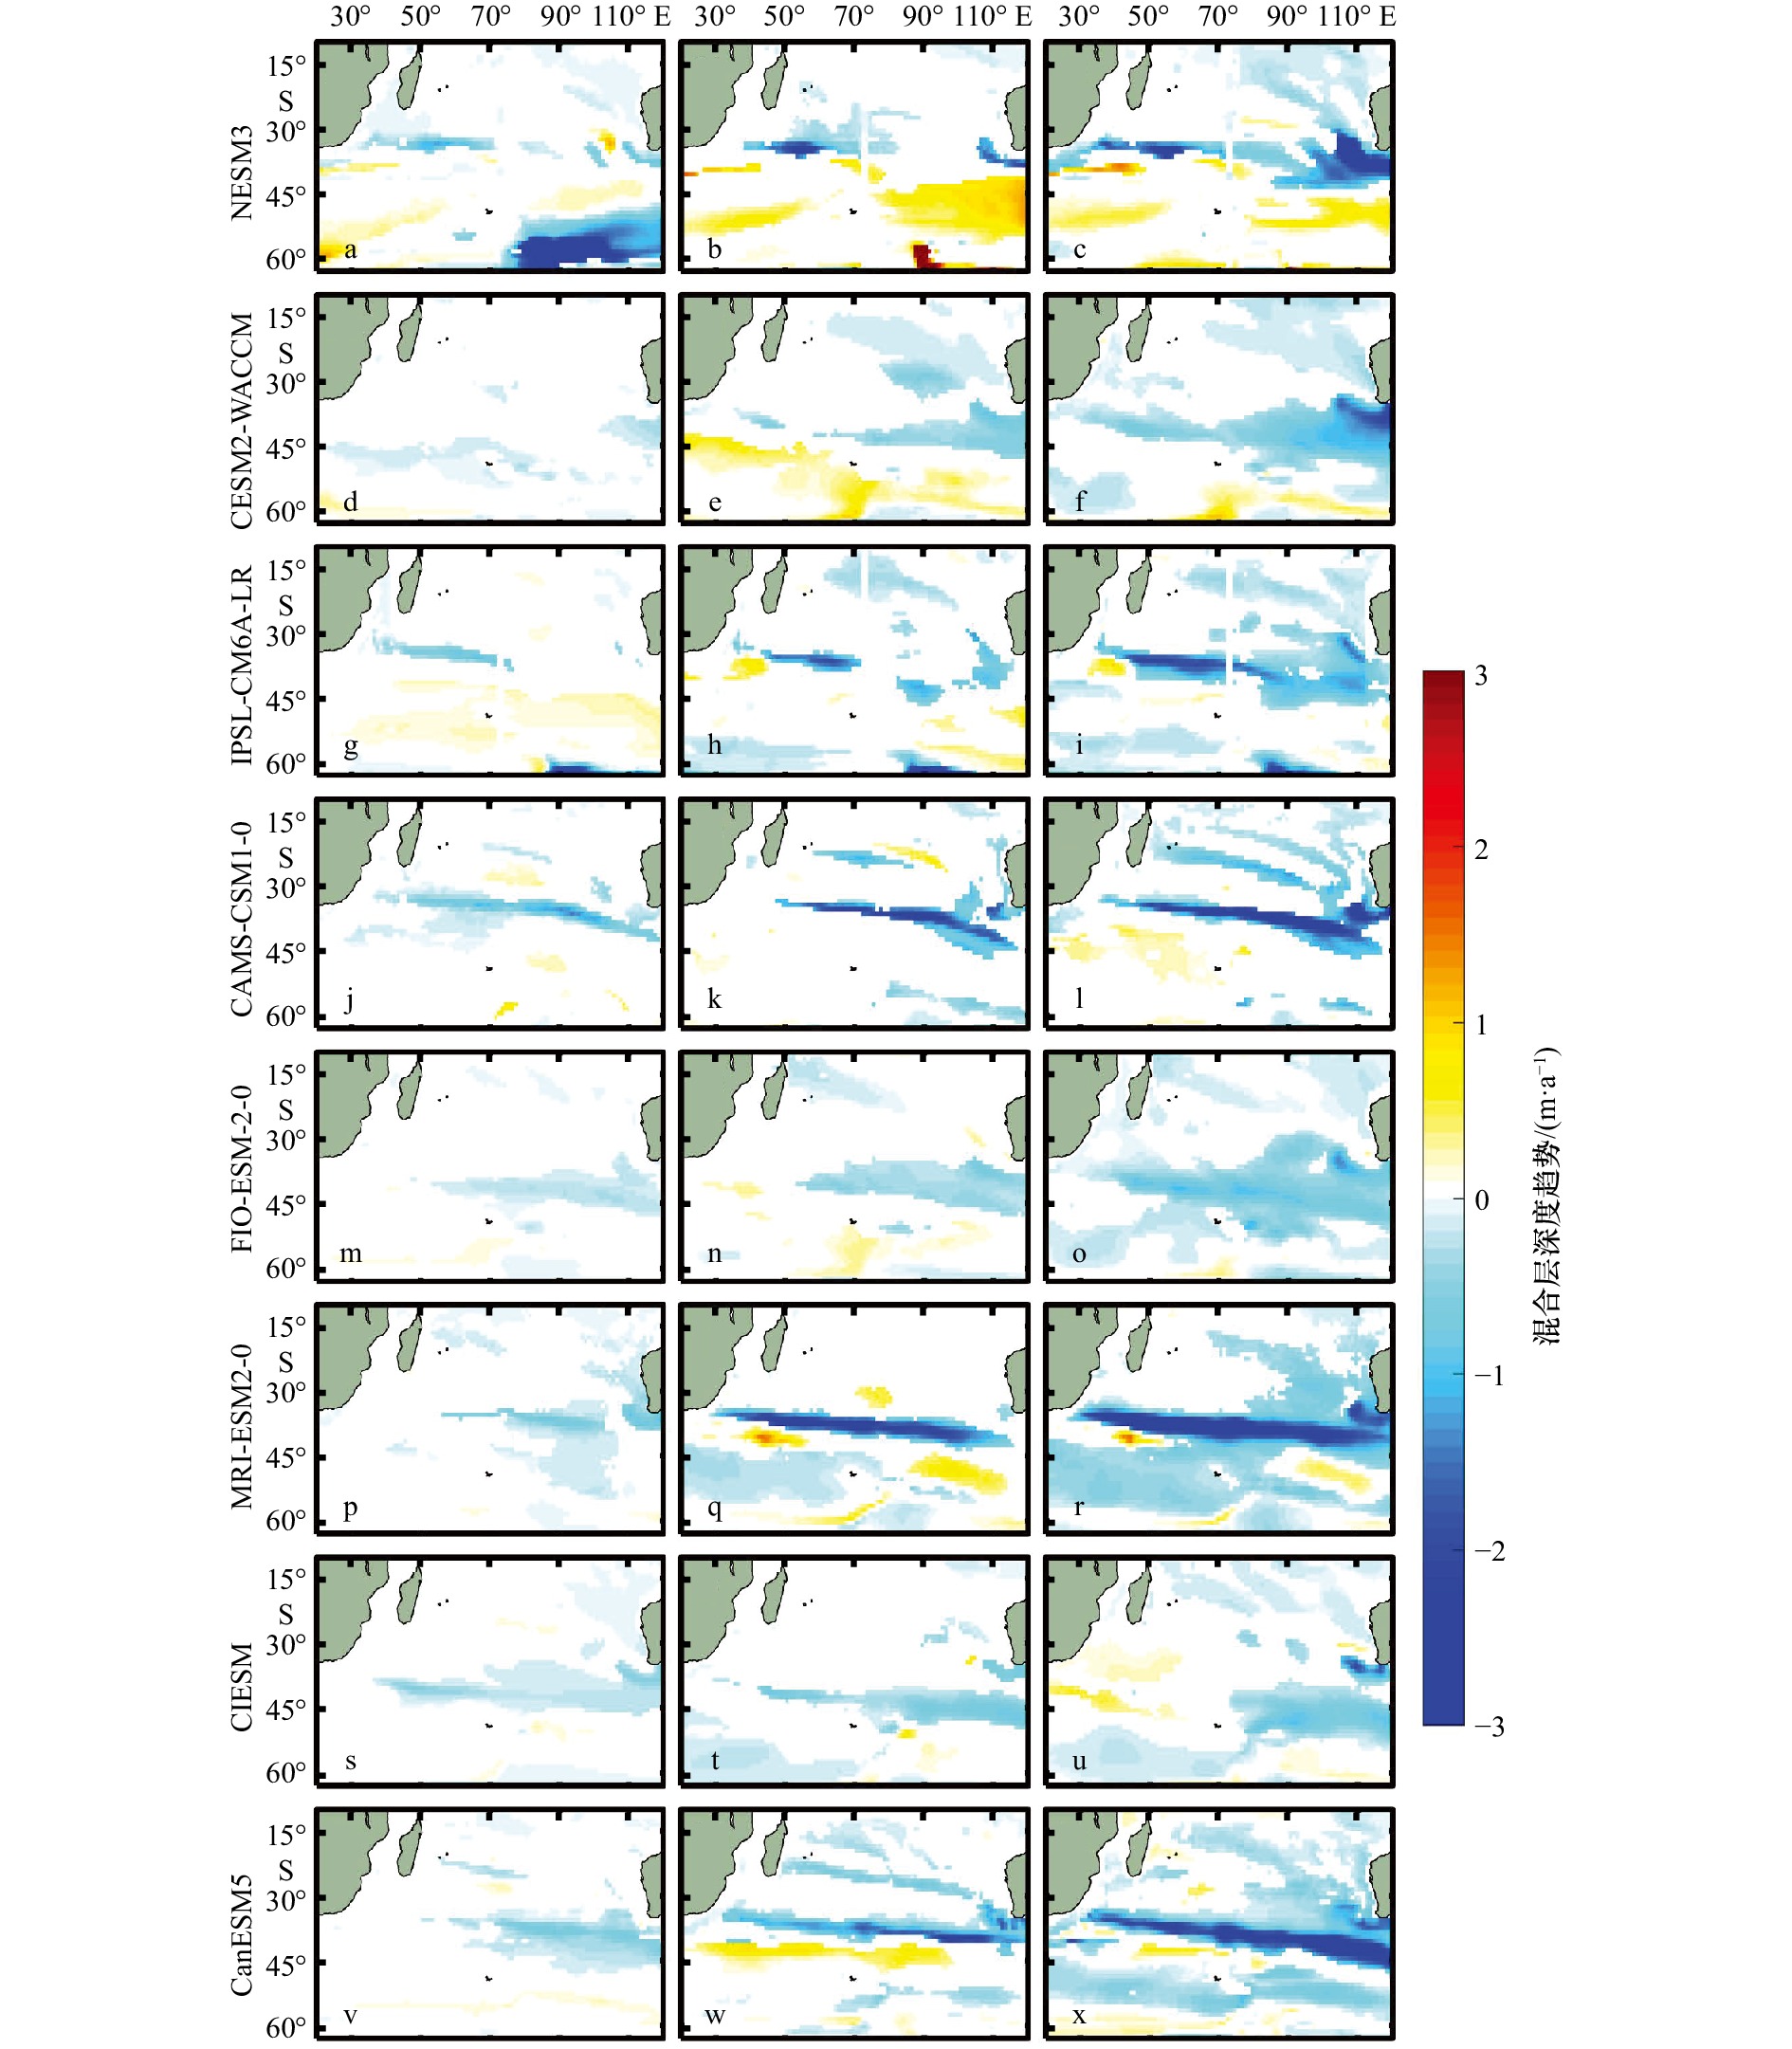
图 7 CMIP6模式中南印度洋9月混合层深度趋势分布
左列为历史模拟结果(1850–2014年);中列(SSP245)和右列(SSP585)为情景试验结果(2015–2100年);填色区域通过95%显著性检验
Fig. 7 The distribution of mixed layer depth trend in the Southern Indian Ocean in September derived from CMIP6 models
The left column are the results in the historical simulations from 1850 to 2014; the middle and right columns are the results of SSP245 and SSP585 from 2015 to 2100 respectively; the shaded region indicate significant trends at 95% confidence interval
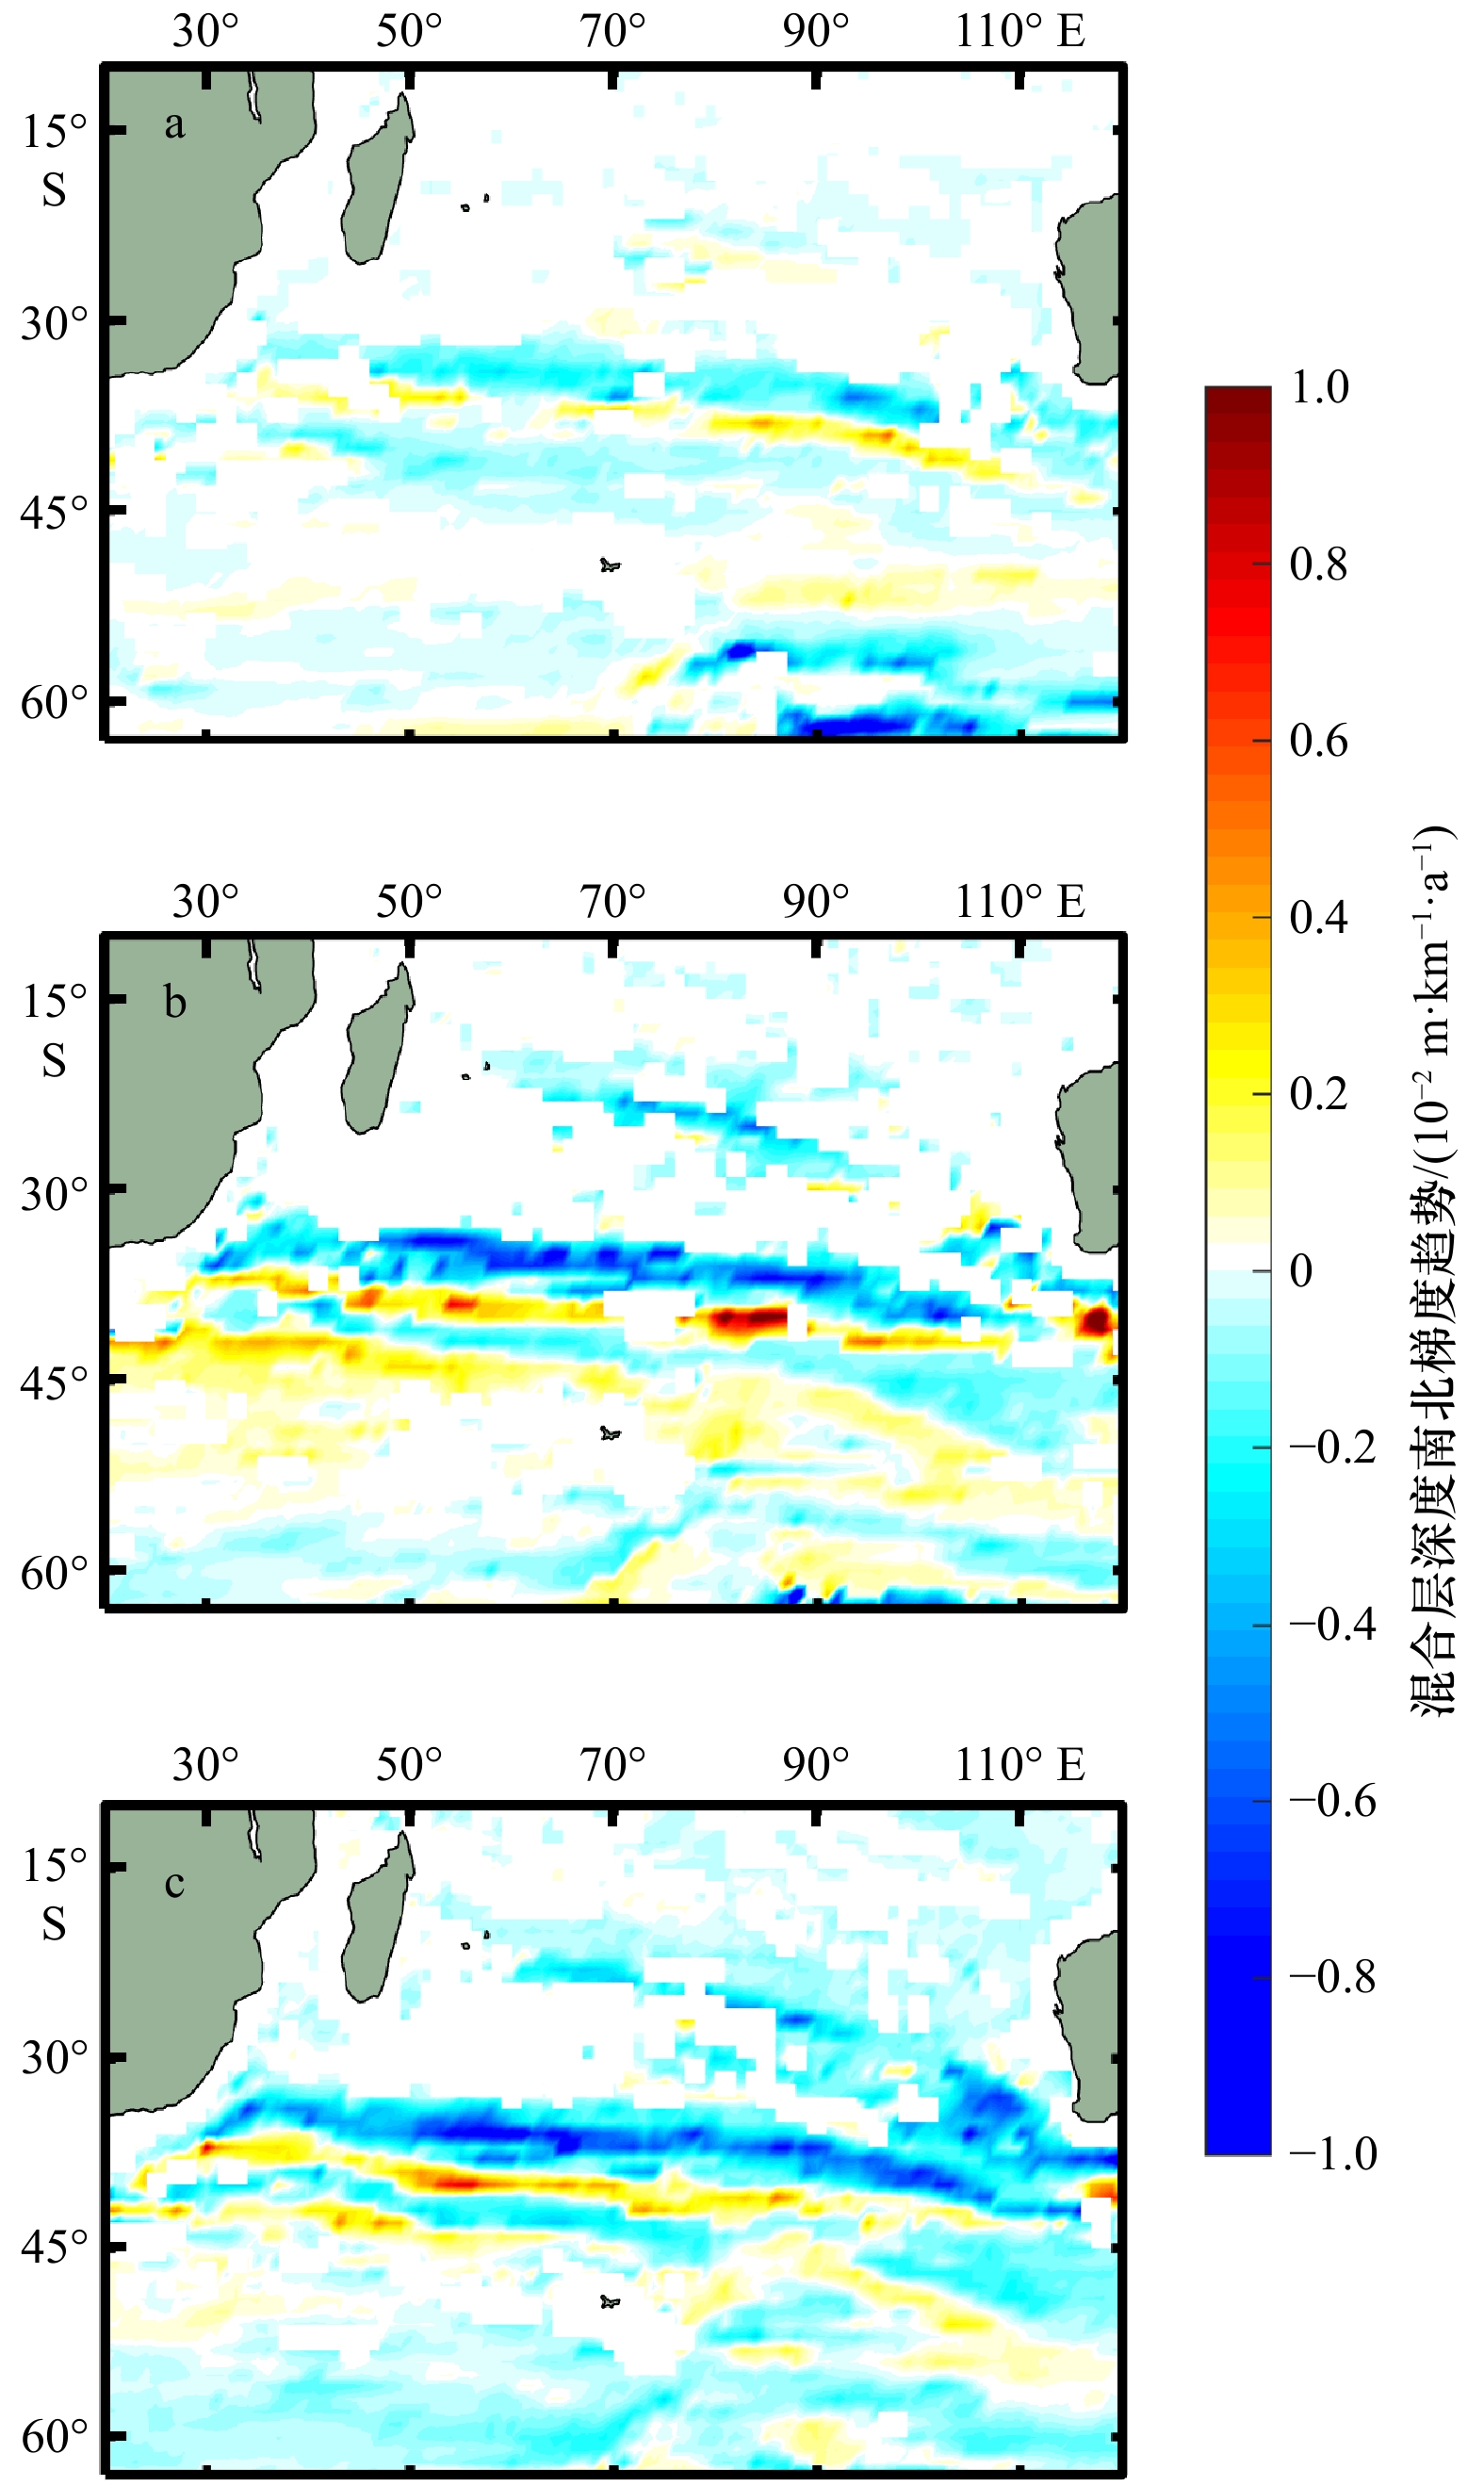
图 8 CMIP6模式平均南印度洋9月混合层深度南北梯度趋势分布
a. 历史模拟结果(1850–2014年);b、c. SSP245和SSP585情景试验结果(2015–2100年);填色区域通过95%显著性检验
Fig. 8 CMIP6 multi-model mean trend of meridional gradient of mixed layer depth in the Southern Indian Ocean in September derived from CMIP6
a. The results in the historical simulations from 1850 to 2014; b,c. the results under two scenarios of SSP245 and SSP585 from 2015 to 2100; the shaded region indicate significant trends at 95% confidence interval
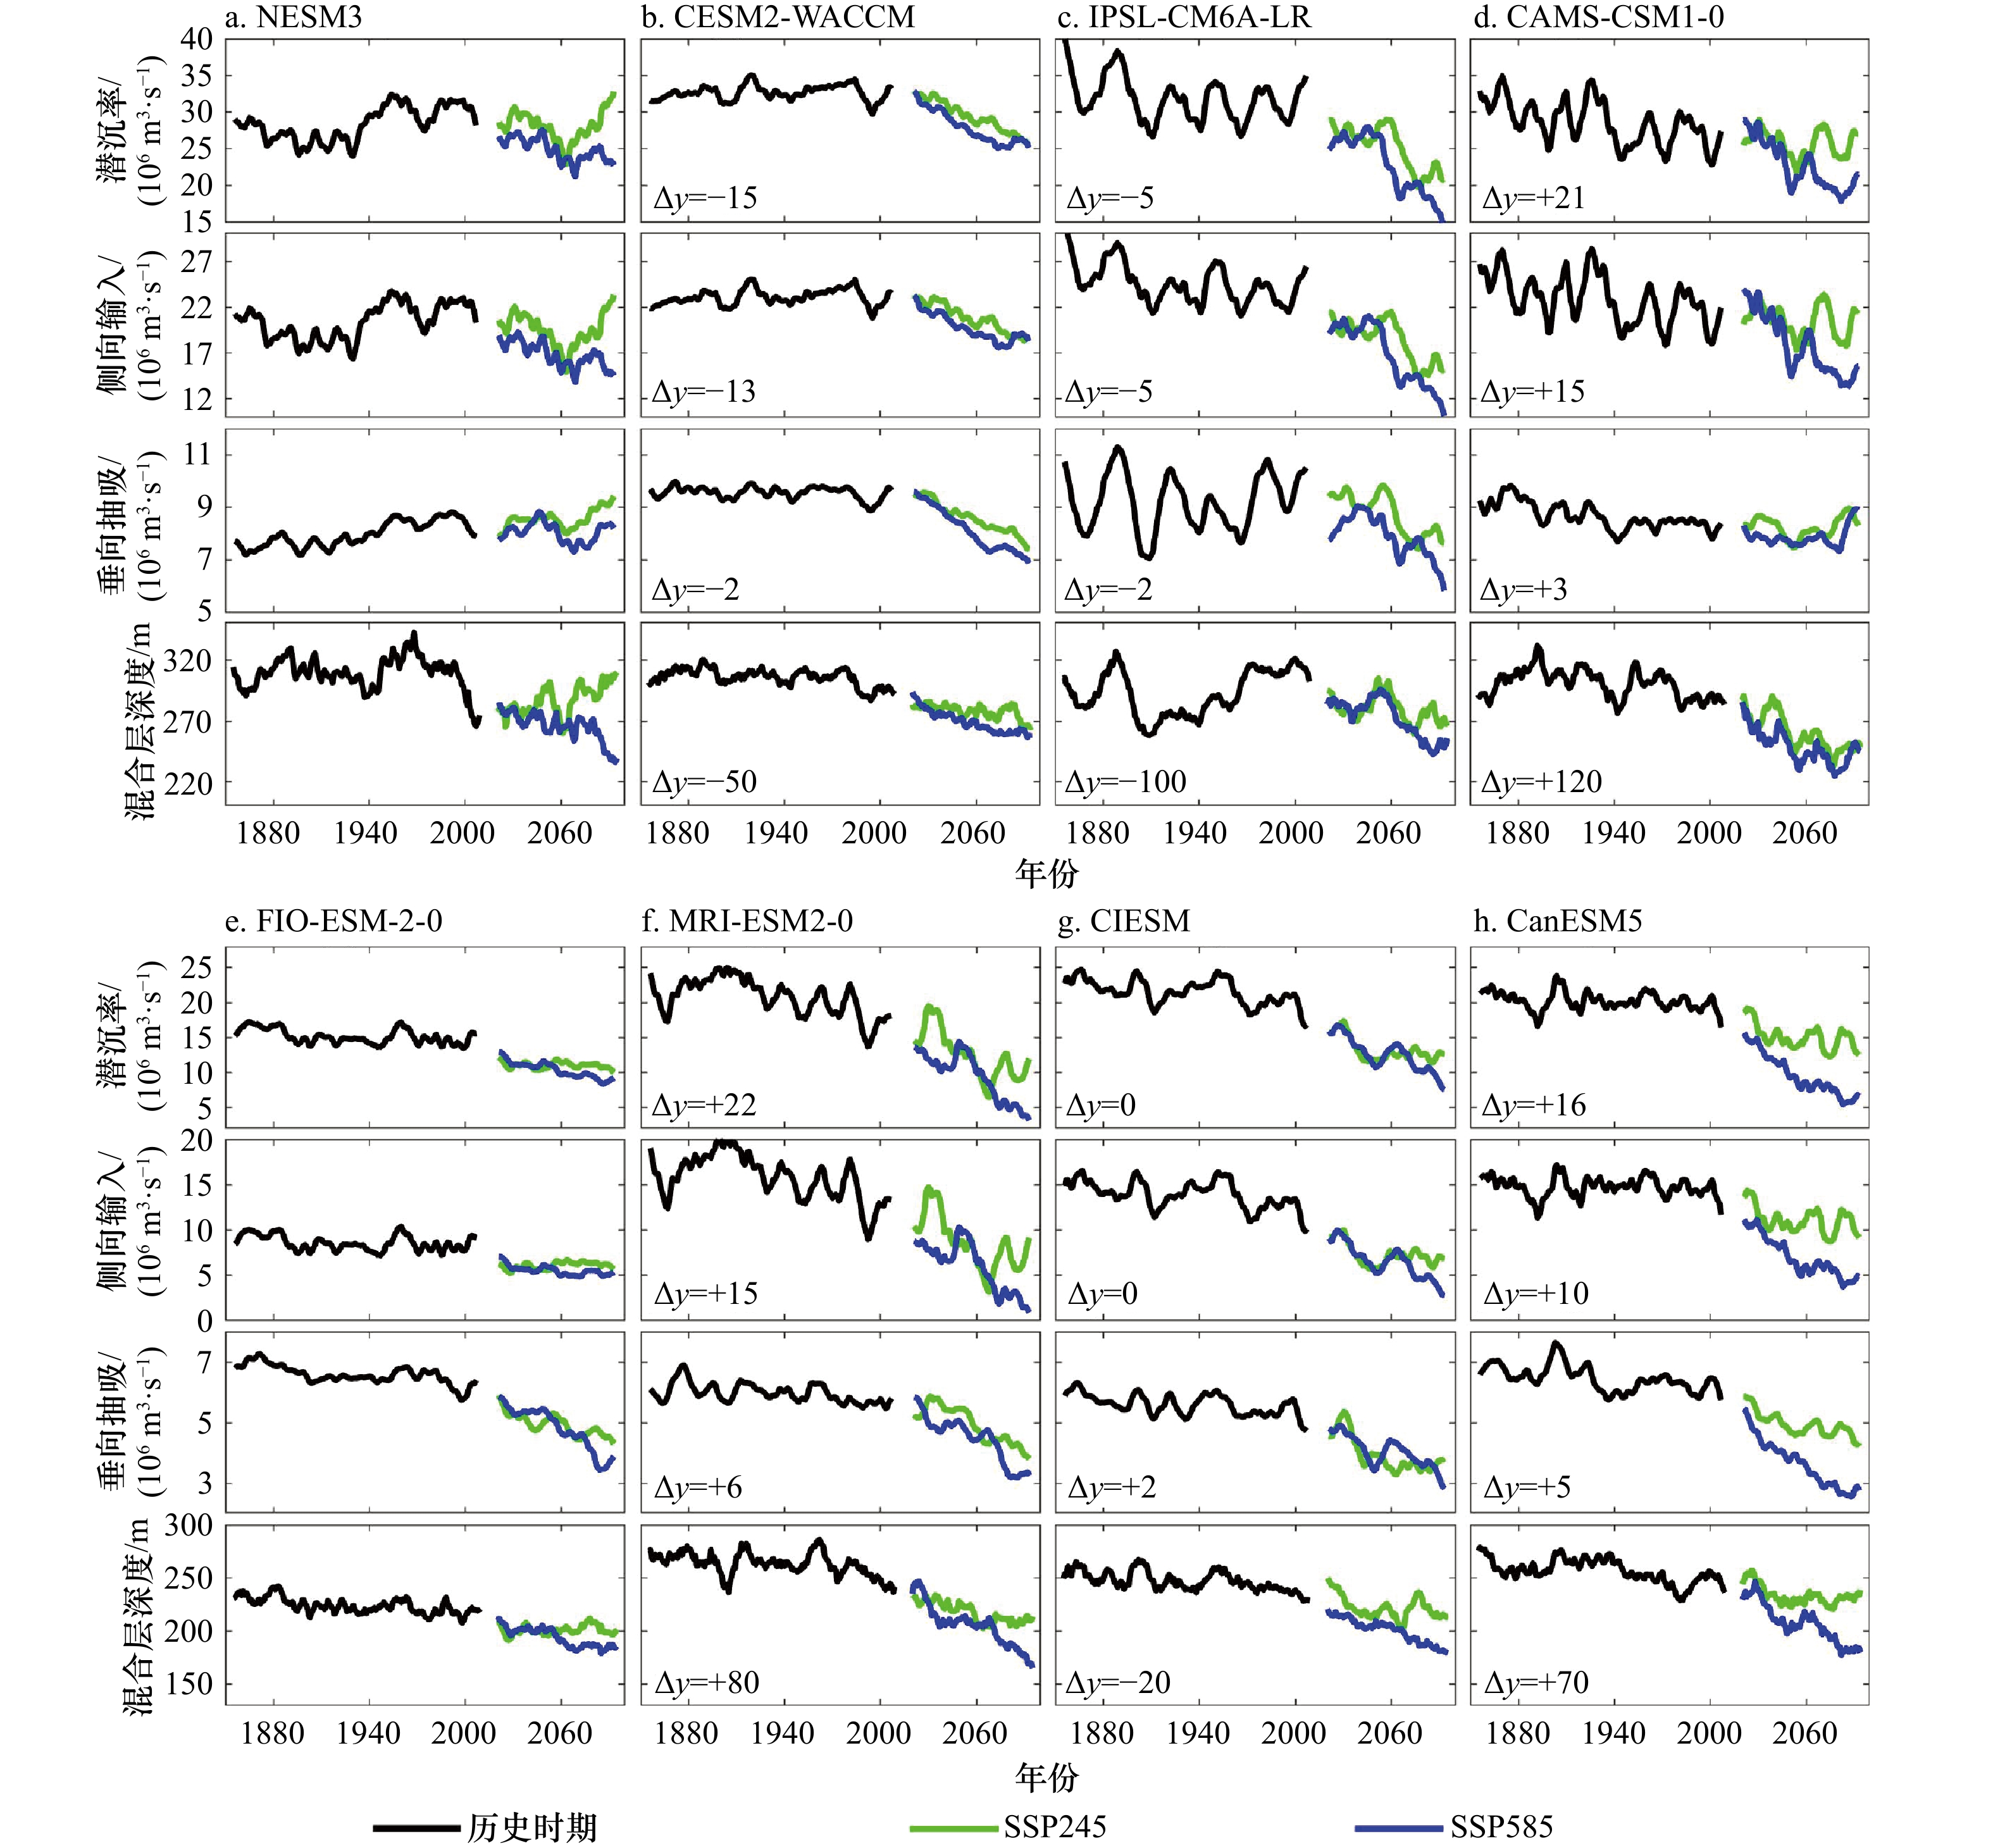
图 9 CMIP6模式中东南印度洋亚南极模态水潜沉率和其生成区混合层深度的长期变化
左下角Δy为纵坐标相对于第一列模式的平移量,如b中潜沉率变化的左下角Δy=−15表示比图中显示的纵坐标数值小15×106 m3/s
Fig. 9 Longterm variation of annual subduction rate of SEISAMW and mixed layer depth in SEISAMW formation region derived from CMIP6 models
The Δy that mark in the lower left corner of each subpanels represent this Y-axis should shift by the value of Δy refer to the Y-axis in the leftmost subpanels, i. e., in the lower corner of b showing the variation of subduction rate, Δy=−15 indicates the subduction rate is 15×106 m3/s smaller than the value shown in Y-axis

图 10 CMIP6模式中东南印度洋亚南极模态水(PV小于某一阈值)的温盐(T-S)图
左列为历史模拟结果(1850−2014年),PV阈值标于图中右下角(单位:10−11 m−1/s);中列(SSP245)和右列(SSP585)为情景试验结果(2015−2100年);图中填色代表具有不同温盐密特征的东南印度洋亚南极模态水的体积
Fig. 10 Temperature and salinity (T-S) diagram of the Southeast Indian subantarctic mode water (identified as water column with potential vorticity smaller than a threshold value) derived from CMIP6 models
The left column are the results in the historical simulations from 1850 to 2014, the threshold values (unit: 10−11 m−1/s) are marked in the lower right corner of the subpanel; the middle and right columns are the results under of SSP245 and SSP585 from 2015 to 2100 respectively; the color bar indicates the related volume of the Southeast Indian subantarctic mode water

图 11 CMIP6模式中东南印度洋亚南极模态水潜沉率及其性质的长期变化
左下角Δy为纵坐标相对于第一列模式的平移量,如b中潜沉率变化的左下角Δy=−15表示比纵坐标数值小15×106 m3/s
Fig. 11 Longterm variation of annual subduction rate and properties of Southeast Indian subantarctic mode water derived from CMIP6 models
The Δy that mark in the lower left corner of each subpanels represent this Y-axis should shift by the value of Δy refer to the Y-axis in the leftmost subpanels, i. e., in the lower corner of b showing the variation of subduction rate, Δy=−15 indicates the subduction rate is 15×106 m3/s smaller than the value shown in Y-axis

图 12 CMIP6模式东南印度洋亚南极模态水的潜沉率及其性质的变化趋势
绿色、橙色和紫色分别对应东南印度洋亚南极模态水在历史模拟、SSP245和SSP585情景试验中的变化趋势(每100 a);a. 深色和浅色部分分别对应侧向输入和潜沉率的变化趋势
Fig. 12 Trend of subduction rate and properties of Southeast Indian subantarctic mode water simulated by CMIP6 models
Green, orange and purple bars indicate the variation of Southeast Indian subantarctic mode water properties in historical simulations, under SSP245 and SSP585 scenarios, respectively (every 100 a); a. the darker and lighter bars indicate lateral induction and subduction rate, respectively

图 13 CMIP6模式平均东南印度洋亚南极模态水的潜沉率及其性质的长期变化
橘红线、绿线和蓝线分别为东南印度洋亚南极模态水在历史模拟、SSP245和SSP585情景试验中的变化;右侧k值代表变化趋势(每100 a),不同颜色代表不同试验,与实线相对应;浅色阴影部分为CMIP6模式平均值±0.5倍标准差
Fig. 13 Longterm variation of the CMIP6 multi-model mean subduction rate and properties of Southeast Indian subantarctic mode water simulated by CMIP6 models
Orange, green and blue lines indicate the variation of Southeast Indian subantarctic mode water properties in the historical simulations, under SSP245 and SSP585 scenarios, respectively (every 100 a); the values of k that marked on the right of each subpanels represent the linear trends with the color corresponding to each experiment; light color shade indicate the 0.5 times of standard deviation of the CMIP6 models
表 1 CMIP6模式信息
Tab. 1 Information of CMIP6 models
模式名称 垂向层数 水平分辨率(50°S) 位势涡度/(10−11 m−1 ·s−1) NESM3 46 1°×0.65° 3.5 CESM2-WACCM 60 1.125°×0.53° 8 IPSL-CM6A-LR 75 1°×0.65° 8 CAMS-CSM1-0 50 1°×1° 4.5 FIO-ESM-2-0 60 1.125°×0.53° 8 MRI-ESM2-0 61 1°×0.5° 4.5 CIESM 60 1.125°×0.53° 6 CanESM5 45 1°×0.65° 3  下载: 导出CSV
表 2 Argo观测和CMIP6模式中东南印度洋亚南极模态水性质
Tab. 2 Water properties of the Southeast Indian subantarctic mode water in Argo observations and CMIP6 models
模式名称 最大混合
层深度/m潜沉率/
(106 m3·s−1)潜沉率(地转)/
(106 m3·s−1)侧向输入/
(106 m3·s−1)侧向输入(地转)/
(106 m3·s−1)垂向抽吸/
(106 m3·s−1)位势密度/
(kg·m−3)温度/℃ 盐度 Argo 388 − 9.89 − 6.69 3.20 26.6~26.9 8.7~12.7 34.6~35.2 NESM3 567 28.43 16.04 20.46 8.07 7.97 26.9~27.2 10.5~12.5 35.2~35.7 CESM2-WACCM 341 17.61 12.35 10.04 4.78 7.57 26.2~26.8 5.0~12.0 33.8~34.7 IPSL-CM6A-LR 466 27.21 18.70 19.88 11.37 7.33 26.3~26.6 9.8~13.5 34.4~35.1 CAMS-CSM1-0 655 49.84 27.21 38.14 15.51 11.70 26.2~26.9 9.0~14.5 34.5~35.3 FIO-ESM-2-0 310 15.15 11.80 8.57 5.22 6.58 26.2~26.9 5.0~11.8 33.9~34.6 MRI-ESM2-0 603 42.69 26.35 30.72 14.35 11.97 26.6~26.9 9.2~13.3 34.7~35.3 CIESM 407 21.37 14.61 13.81 7.05 7.56 26.4~26.9 5.5~14.0 34.1~35.3 CanESM5 528 35.95 23.26 24.54 11.85 11.41 26.3~26.6 8.9~12.0 34.2~34.7 注:−代表Argo没有基于流速计算的潜沉率,只有基于地转流计算的潜沉率。
下载: 导出CSV
-
[1] Hanawa K, Talley L D. Modes Waters BT-Ocean Circulation and Climate[M]//Gerold S, John C, Gould J. Ocean Circulation and Climate. New York: Academic Press, 2001, 77: 373−386. [2] Stommel H. Determination of water mass properties of water pumped down from the Ekman layer to the geostrophic flow below[J]. Proceedings of the National Academy of Sciences of the United States of America, 1979, 76(7): 3051−3055. doi: 10.1073/pnas.76.7.3051 [3] Woods J D. The physics of thermocline ventilation[J]. Elsevier Oceanography Series, 1985, 40: 543−590. [4] Sloyan B M, Rintoul S R. Circulation, renewal, and modification of Antarctic mode and intermediate water[J]. Journal of Physical Oceanography, 1999, 31(4): 1005−1030. [5] 胡海波, 刘秦玉, 刘伟. 北太平洋副热带模态水形成区潜沉率的年际变化及其机制[J]. 海洋学报, 2006, 28(2): 22−28.Hu Haibo, Liu Qinyu, Liu Wei. Interannual and decadal variation of the subduction rate in the subtropical mode water formation regions in the North Pacific[J]. Haiyang Xuebao, 2006, 28(2): 22−28. [6] 潘爱军, 万小芳, 刘秦玉. 北太平洋副热带模态水形成区混合层热动力过程诊断分析[J]. 热带海洋学报, 2011, 30(5): 8−18. doi: 10.3969/j.issn.1009-5470.2011.05.002Pan Aijun, Wan Xiaofang, Liu Qinyu. Diagnostics of mixed-layer thermodynamics in the formation regime of the North Pacific subtropical mode water[J]. Journal of Tropical Oceanography, 2011, 30(5): 8−18. doi: 10.3969/j.issn.1009-5470.2011.05.002 [7] Holte J W, Talley L D, Chereskin T K, et al. The role of air-sea fluxes in Subantarctic mode water formation[J]. Journal of Geophysical Research: Oceans, 2012, 117(C3): C03040. [8] 李祥, 罗义勇. 太平洋副热带东部模态水的年际变化及机制研究[J]. 中国海洋大学学报(自然科学版), 2019, 49(2): 1−13.Li Xiang, Luo Yiyong. Inter-annual variations of the eastern subtropical mode waters in the Pacific Ocean and their formation mechanisms[J]. Periodical of Ocean University of China, 2019, 49(2): 1−13. [9] Tamsitt V, Cerovečki I, Josey S A, et al. Mooring observations of air-sea heat fluxes in two subantarctic mode water formation regions[J]. Journal of Climate, 2020, 33(7): 2757−2777. doi: 10.1175/JCLI-D-19-0653.1 [10] Rintoul S R, England M H. Ekman transport dominates local air-sea fluxes in driving variability of subantarctic mode water[J]. Journal of Physical Oceanography, 2002, 32(5): 1308−1321. doi: 10.1175/1520-0485(2002)032<1308:ETDLAS>2.0.CO;2 [11] 刘秦玉, 胡海波, 刘海龙, 等. 北太平洋副热带潜沉率及其变化中海面风的作用[J]. 海洋与湖沼, 2006, 37(2): 184−192. doi: 10.3321/j.issn:0029-814X.2006.02.013Liu Qinyu, Hu Haibo, Liu Hailong, et al. The role of sea surface wind in “subduction” rate variation in north Pacific[J]. Oceanologia et Limnologia Sinica, 2006, 37(2): 184−192. doi: 10.3321/j.issn:0029-814X.2006.02.013 [12] Sallée J B, Speer K, Rintoul S, et al. Southern ocean thermocline ventilation[J]. Journal of Physical Oceanography, 2010, 40(3): 509−529. doi: 10.1175/2009JPO4291.1 [13] Qu Tangdong, Xie Shangping, Mitsudera H, et al. Subduction of the North Pacific mode waters in a global high-resolution GCM[J]. Journal of Physical Oceanography, 2002, 32(3): 746−763. doi: 10.1175/1520-0485(2002)032<0746:SOTNPM>2.0.CO;2 [14] 潘爱军, 刘秦玉. 北太平洋副热带西部模态水形成区海洋涡旋对冬季垂直混合过程的影响[J]. 科学通报, 2005, 50(17): 1949−1956. doi: 10.1360/982004-757Pan Aijun, Liu Qinyu. Mesoscale eddy effects on the wintertime vertical mixing in the formation region of the North Pacific Subtropical Mode Water[J]. Chinese Science Bulletin, 2005, 50(17): 1949−1956. doi: 10.1360/982004-757 [15] Sallée J B, Morrow R, Speer K. Eddy heat diffusion and Subantarctic mode water formation[J]. Geophysical Research Letters, 2008, 35(5): L05607. [16] Herraiz-Borreguero L, Rintoul S R. Subantarctic mode water variability influenced by mesoscale eddies south of Tasmania[J]. Journal of Geophysical Research: Oceans, 2010, 115(C4): C04004. [17] Gao Shan, Qu Tangdong, Fukumori I. Effects of mixing on the subduction of South Pacific waters identified by a simulated passive tracer and its adjoint[J]. Dynamics of Atmospheres and Oceans, 2011, 51(1/2): 45−54. [18] Cerovečki I, Talley L D, Mazloff M R, et al. Subantarctic mode water formation, destruction, and export in the eddy-permitting Southern Ocean state estimate[J]. Journal of Physical Oceanography, 2013, 43(7): 1485−1511. doi: 10.1175/JPO-D-12-0121.1 [19] Cerovečki I, Mazloff M R. The spatiotemporal structure of diabatic processes governing the evolution of Subantarctic Mode Water in the Southern Ocean[J]. Journal of Physical Oceanography, 2016, 46(2): 683−710. doi: 10.1175/JPO-D-14-0243.1 [20] Gu Daifang, Philander S G H. Interdecadal climate fluctuations that depend on exchanges between the tropics and extratropics[J]. Science, 1997, 275(5301): 805−807. doi: 10.1126/science.275.5301.805 [21] Wang Qi, Huang Ruixin. Decadal variability of pycnocline flows from the subtropical to the equatorial pacific[J]. Journal of Physical Oceanography, 2005, 35(10): 1861−1875. doi: 10.1175/JPO2791.1 [22] Jones D C, Meijers A J S, Shuckburgh E, et al. How does Subantarctic mode water ventilate the Southern Hemisphere subtropics?[J]. Journal of Geophysical Research: Oceans, 2016, 121(9): 6558−6582. doi: 10.1002/2016JC011680 [23] McCartney M S. Subantarctic Mode Water[M]//Angel M V. A Voyage of Discovery. New York: Pergamon Press, 1977: 103−119. [24] Sabine C L, Feely R A, Gruber N, et al. The oceanic sink for anthropogenic CO2[J]. Science, 2004, 305(5682): 367−371. doi: 10.1126/science.1097403 [25] Ito T, Woloszyn M, Mazloff M. Anthropogenic carbon dioxide transport in the Southern Ocean driven by Ekman flow[J]. Nature, 2010, 463(7277): 80−83. doi: 10.1038/nature08687 [26] Séférian R, Iudicone D, Bopp L, et al. Water mass analysis of effect of climate change on air-sea CO2 fluxes: the Southern Ocean[J]. Journal of Climate, 2012, 25(11): 3894−3908. doi: 10.1175/JCLI-D-11-00291.1 [27] Frölicher T L, Sarmiento J L, Paynter D J, et al. Dominance of the Southern Ocean in anthropogenic carbon and heat uptake in CMIP5 models[J]. Journal of Climate, 2015, 28(2): 862−886. doi: 10.1175/JCLI-D-14-00117.1 [28] Iudicone D, Rodgers K B, Plancherel Y, et al. The formation of the ocean’s anthropogenic carbon reservoir[J]. Scientific Reports, 2016, 6(1): 35473. doi: 10.1038/srep35473 [29] Langlais C E, Lenton A, Matear R, et al. Stationary Rossby waves dominate subduction of anthropogenic carbon in the Southern Ocean[J]. Scientific Reports, 2017, 7(1): 17076. doi: 10.1038/s41598-017-17292-3 [30] McCartney M S. The subtropical recirculation of mode waters[J]. Journal of Marine Research, 1982, 40(S1): 427−464. [31] Wong A P S. Subantarctic mode water and Antarctic intermediate water in the South Indian Ocean based on profiling float data 2000−2004[J]. Journal of Marine Research, 2005, 63(4): 789−812. doi: 10.1357/0022240054663196 [32] Sallée J B, Wienders N, Speer K, et al. Formation of subantarctic mode water in the southeastern Indian Ocean[J]. Ocean Dynamics, 2006, 56(5/6): 525−542. [33] Koch-Larrouy A, Morrow R, Penduff T, et al. Origin and mechanism of subantarctic mode water formation and transformation in the Southern Indian Ocean[J]. Ocean Dynamics, 2010, 60(3): 563−583. doi: 10.1007/s10236-010-0276-4 [34] Herraiz-Borreguero L, Rintoul S R. Subantarctic mode water: distribution and circulation[J]. Ocean Dynamics, 2011, 61(1): 103−126. doi: 10.1007/s10236-010-0352-9 [35] Banks H T, Wood R A, Gregory J M, et al. Are observed decadal changes in intermediate water masses a signature of anthropogenic climate change?[J]. Geophysical Research Letters, 2000, 27(18): 2961−2964. doi: 10.1029/2000GL011601 [36] Banks H, Wood R, Gregory J. Changes to Indian Ocean subantarctic mode water in a coupled climate model as CO2 forcing increases[J]. Journal of Physical Oceanography, 2002, 32(10): 2816−2827. doi: 10.1175/1520-0485(2002)032<2816:CTIOSM>2.0.CO;2 [37] Hall A, Visbeck M. Synchronous variability in the southern hemisphere atmosphere, sea ice, and ocean resulting from the annular mode[J]. Journal of Climate, 2002, 15(21): 3043−3057. doi: 10.1175/1520-0442(2002)015<3043:SVITSH>2.0.CO;2 [38] Thompson D W J, Solomon S. Interpretation of recent southern hemisphere climate change[J]. Science, 2002, 296(5569): 895−899. doi: 10.1126/science.1069270 [39] Li Jianping, Wang J X L. A modified zonal index and its physical sense[J]. Geophysical Research Letters, 2003, 30(12): 1632. [40] Marshall G J. Trends in the southern annular mode from observations and reanalyses[J]. Journal of Climate, 2003, 16(24): 4134−4143. doi: 10.1175/1520-0442(2003)016<4134:TITSAM>2.0.CO;2 [41] 郑菲, 李建平, 刘婷. 南半球环状模气候影响的若干研究进展[J]. 气象学报, 2014, 72(5): 926−939.Zheng Fei, Li Jianping, Liu Ting. Some advances in studies of the climatic impacts of the Southern Hemisphere annular mode[J]. Acta Meteorologica Sinica, 2014, 72(5): 926−939. [42] Downes S M, Langlais C, Brook J P, et al. Regional impacts of the westerly winds on southern ocean mode and intermediate water subduction[J]. Journal of Physical Oceanography, 2017, 47(10): 2521−2530. doi: 10.1175/JPO-D-17-0106.1 [43] Chen Xingrong, Liu Shan, Cai Yi, et al. Potential effects of subduction rate in the key ocean on global warming hiatus[J]. Acta Oceanologica Sinica, 2018, 37(3): 63−68. doi: 10.1007/s13131-017-1130-z [44] Meijers A J S, Cerovečki I, King B A, et al. A see-saw in pacific subantarctic mode water formation driven by atmospheric modes[J]. Geophysical Research Letters, 2019, 46(22): 13152−13160. doi: 10.1029/2019GL085280 [45] 刘成彦. 二十世纪全球海洋潜沉率和浮露率的变化趋势及其机制[D]. 青岛: 中国海洋大学, 2012.Liu Chengyan. Long-term changes of subduction and obduction over the global ocean and their mechanisms in the 20th century[D]. Qingdao: Ocean University of China, 2012. [46] Gao Libao, Rintoul S R, Yu Weidong. Recent wind-driven change in subantarctic mode water and its impact on ocean heat storage[J]. Nature Climate Change, 2018, 8(1): 58−63. doi: 10.1038/s41558-017-0022-8 [47] Kolodziejczyk N, Llovel W, Portela E. Interannual variability of upper ocean water masses as inferred from Argo array[J]. Journal of Geophysical Research: Oceans, 2019, 124(8): 6067−6085. doi: 10.1029/2018JC014866 [48] Portela E, Kolodziejczyk N, Maes C, et al. Interior water-mass variability in the southern hemisphere oceans during the last decade[J]. Journal of Physical Oceanography, 2020, 50(2): 361−381. doi: 10.1175/JPO-D-19-0128.1 [49] Qu Tangdong, Gao Shan, Fine R A. Variability of the sub-Antarctic mode water subduction rate during the Argo period[J]. Geophysical Research Letters, 2020, 47(13): e2020GL088248. [50] Hong Yu, Du Yan, Qu Tangdong, et al. Variability of the subantarctic mode water volume in the South Indian Ocean during 2004−2018[J]. Geophysical Research Letters, 2020, 47(10): e2020GL087830. [51] Sloyan B M, Kamenkovich I V. Simulation of subantarctic mode and Antarctic intermediate waters in climate models[J]. Journal of Climate, 2007, 20(20): 5061−5080. doi: 10.1175/JCLI4295.1 [52] Downes S M, Bindoff N L, Rintoul S R. Impacts of climate change on the subduction of mode and intermediate water masses in the southern ocean[J]. Journal of Climate, 2009, 22(12): 3289−3302. doi: 10.1175/2008JCLI2653.1 [53] Downes S M, Bindoff N L, Rintoul S R. Changes in the subduction of Southern Ocean water masses at the end of the twenty-first century in eight IPCC models[J]. Journal of Climate, 2010, 23(24): 6526−6541. doi: 10.1175/2010JCLI3620.1 [54] Sallée J B, Shuckburgh E, Bruneau N, et al. Assessment of Southern Ocean mixed-layer depths in CMIP5 models: historical bias and forcing response[J]. Journal of Geophysical Research: Oceans, 2013, 118(4): 1845−1862. doi: 10.1002/jgrc.20157 [55] Sallée J B, Shuckburgh E, Bruneau N, et al. Assessment of Southern Ocean water mass circulation and characteristics in CMIP5 models: historical bias and forcing response[J]. Journal of Geophysical Research: Oceans, 2013, 118(4): 1830−1844. doi: 10.1002/jgrc.20135 [56] Belcher S E, Grant A L M, Hanley K E, et al. A global perspective on Langmuir turbulence in the ocean surface boundary layer[J]. Geophysical Research Letters, 2012, 39(18): L18605. [57] Huang Chuanjiang, Qiao Fangli, Shu Qi, et al. Evaluating austral summer mixed-layer response to surface wave-induced mixing in the Southern Ocean[J]. Journal of Geophysical Research: Oceans, 2012, 117(C11): C00J18. [58] Huang Chuanjiang, Qiao Fangli, Dai Dejun. Evaluating CMIP5 simulations of mixed layer depth during summer[J]. Journal of Geophysical Research: Oceans, 2014, 119(4): 2568−2582. doi: 10.1002/2013JC009535 [59] 陈思宇, 乔方利, 黄传江, 等. 浪致混合对亚热带冬季海洋混合强度的影响[J]. 海洋学报, 2020, 42(5): 22−30.Chen Siyu, Qiao Fangli, Huang Chuanjiang, et al. The reduced winter vertical mixing in the subtropical oceans by the surface wave-induced mixing[J]. Haiyang Xuebao, 2020, 42(5): 22−30. [60] Argo. Argo float data and metadata from Global Data Assembly Centre (Argo GDAC)[DB/OL]. [2021-09-10]. Issy-les-Moulineaux France, SEANOE. 2021. https://doi.org/10.17882/42182. [61] Kalnay E, Kanamitsu M, Kistler R, et al. The NCEP/NCAR 40-year reanalysis project[J]. Bulletin of the American Meteorological Society, 1996, 77(3): 437−472. doi: 10.1175/1520-0477(1996)077<0437:TNYRP>2.0.CO;2 [62] Meehl G A, Boer G J, Covey C, et al. The coupled model intercomparison project (CMIP)[J]. Bulletin of the American Meteorological Society, 2000, 81(2): 313−318. doi: 10.1175/1520-0477(2000)081<0313:TCMIPC>2.3.CO;2 [63] Meehl G A, Covey C, Delworth T, et al. THE WCRP CMIP3 multimodel dataset: a new era in climate change research[J]. Bulletin of the American Meteorological Society, 2007, 88(9): 1383−1394. doi: 10.1175/BAMS-88-9-1383 [64] Taylor K E, Stouffer R J, Meehl G A. An overview of CMIP5 and the experiment design[J]. Bulletin of the American Meteorological Society, 2012, 93(4): 485−498. doi: 10.1175/BAMS-D-11-00094.1 [65] Liu Chengyan, Wang Zhaomin. On the response of the global subduction rate to globalwarming in coupled climate models[J]. Advances in Atmospheric Sciences, 2014, 31(1): 211−218. doi: 10.1007/s00376-013-2323-9 [66] 周天军, 邹立维, 陈晓龙. 第六次国际耦合模式比较计划(CMIP6)评述[J]. 气候变化研究进展, 2019, 15(5): 445−456. doi: 10.12006/j.issn.1673-1719.2019.193Zhou Tianjun, Zou Liwei, Chen Xiaolong. Commentary on the coupled model intercomparison project phase 6 (CMIP6)[J]. Climate Change Research, 2019, 15(5): 445−456. doi: 10.12006/j.issn.1673-1719.2019.193 [67] 赵宗慈, 罗勇, 黄建斌. CMIP6的设计[J]. 气候变化研究进展, 2016, 12(3): 258−260. doi: 10.12006/j.issn.1673-1719.2016.066Zhao Zongci, Luo Yong, Huang Jianbin. Design of CMIP6[J]. Climate Change Research, 2016, 12(3): 258−260. doi: 10.12006/j.issn.1673-1719.2016.066 [68] Eyring V, Bony S, Meehl G A, et al. Overview of the coupled model intercomparison project phase 6 (CMIP6) experimental design and organization[J]. Geoscientific Model Development, 2016, 9(5): 1937−1958. doi: 10.5194/gmd-9-1937-2016 [69] IPCC. Climate Change 2013: the Physical Science Basis: Contribution of Working Group I to the Fifth Assessment Report of IPCC the Intergovernmental Panel on Climate Change[M]. Cambridge: Cambridge University Press, 2014: 1−1535. [70] O’Neill B C, Tebaldi C, Van Vuuren D P, et al. The scenario model intercomparison project (ScenarioMIP) for CMIP6[J]. Geoscientific Model Development, 2016, 9(9): 3461−3482. doi: 10.5194/gmd-9-3461-2016 [71] 张丽霞, 陈晓龙, 辛晓歌. CMIP6情景模式比较计划(ScenarioMIP)概况与评述[J]. 气候变化研究进展, 2019, 15(5): 519−525. doi: 10.12006/j.issn.1673-1719.2019.082Zhang Lixia, Chen Xiaolong, Xin Xiaoge. Short commentary on CMIP6 scenario model intercomparison project (ScenarioMIP)[J]. Climate Change Research, 2019, 15(5): 519−525. doi: 10.12006/j.issn.1673-1719.2019.082 [72] 斯思, 毕训强, 孔祥慧, 等. CMIP6情景中主要温室气体和气溶胶排放强度的时空分布特征分析[J]. 气候与环境研究, 2020, 25(4): 366−384.Si Si, Bi Xunqiang, Kong Xianghui, et al. Spatial-temporal characteristics of the emission intensities of several major greenhouse gases and aerosols under CMIP6 scenarios[J]. Climatic and Environmental Research, 2020, 25(4): 366−384. [73] Qiu B, Huang Ruixin. Ventilation of the North Atlantic and North Pacific: subduction versus obduction[J]. Journal of Physical Oceanography, 1995, 25(10): 2374−2390. doi: 10.1175/1520-0485(1995)025<2374:VOTNAA>2.0.CO;2 [74] De Boyer Montégut C, Madec G, Fischer A S, et al. Mixed layer depth over the global ocean: an examination of profile data and a profile-based climatology[J]. Journal of Geophysical Research, 2004, 109(C12): C12003. doi: 10.1029/2004JC002378 [75] 周天军, 陈梓明, 邹立维, 等. 中国地球气候系统模式的发展及其模拟和预估[J]. 气象学报, 2020, 78(3): 332−350.Zhou Tianjun, Chen Ziming, Zou Liwei, et al. Development of climate and earth system models in China: Past achievements and new CMIP6 fesults[J]. Acta Meteorologica Sinica, 2020, 78(3): 332−350. -

计量
- 文章访问数: 658
- HTML全文浏览量: 336
- PDF下载量: 40
- 被引次数: 0
