

Evaluation of Sea Surface High Wind Speed Inversion Method Using Joint Satellite Radar Altimeter and Radiometer Data
-
摘要: 基于2002年-2020年的Jason系列卫星数据,利用一种高风速计算方法得到431次飓风的风速信息。在此基础上,利用基于再分析的美国飓风中心(The National Hurricane Center, NHC)大西洋和东北太平洋飓风最佳路径数据集进行比对分析,对高风速计算方法进行了综合评估。文中计算和评估结果显示,8.03-66.93 m/s飓风风速RMSE优于4 m/s;卫星观测风速和NHC飓风最佳路径数据相关系数在0.9以上。这表明文中方法是可靠的,具备热带气旋高风速观测能力。同时,文中结果显示,飓风观测期间几乎都伴随着不同程度的降雨,当风速大于50 m/s时,卫星观测点均处于中到暴雨的环境下。文中研究证明了利用卫星雷达高度计和校正辐射计这对主被动微波遥感器联合获取极端海洋环境下风速信息的可行性,这为提升台风或飓风风速观测能力提供了一种有潜力的技术手段。另外,统计结果显示飓风期间风速和气压也具备很好的线性相关性,利用这种关系可以基于卫星获取的高风速信息来快速计算得到热带气旋中心气压,这将形成卫星对热带气旋风速和中心气压的同步获取能力。Abstract: Based on the Jason series satellite data from 2002 to 2020, the wind speed information of 431 hurricanes was obtained by using a high wind speed calculation method. On this basis, the best track data sets of hurricanes in the Atlantic and Northeast Pacific of the United States hurricane center based on reanalysis are compared and analyzed, and the high wind speed calculation method is comprehensively evaluated. The calculation and evaluation results show that the wind speed RMSE of 8.03-66.93 m/s hurricane is better than 4 m/s; the correlation coefficient between satellite wind speed and NHC hurricane best path data is above 0.9. This shows that the method in this paper is reliable and has the ability to observe the high wind speed of tropical cyclone. At the same time, the analysis results in the paper show that the hurricane observation period is almost accompanied by different degrees of rainfall. When the wind speed is greater than 50 m/s, the satellite observation points are in the moderate to heavy rain environment. The research in this paper proves the feasibility of using satellite radar altimeter and calibration radiometer to jointly obtain wind speed information in extreme marine environment, which provides a potential technical means for improving the wind speed observation ability of typhoon or hurricane. In addition, the statistical results show that there is also a good correlation between wind speed and pressure during the hurricane. This relationship can be used to quickly calculate the central pressure of tropical cyclone based on the high wind speed information obtained by satellite, which will form the satellite's ability to synchronously acquire the wind speed and central pressure of tropical cyclone.
-

图 1 HY-2B/C/D卫星雷达高度计联合观测海面风速
Fig. 1 Joint observation of sea surface wind speed with HY-2B/C/D satellite

图 2 Jason-1/2/3卫星雷达高度计联合观测海面风速
Fig. 2 Joint observation of sea surface wind speed with Jason-1/2/3 satellite

图 3 HY-2B观测台风“布拉万”风速修正前后比较
Fig. 3 Comparison of THPHOON BOLAVEN wind speed before and after correction
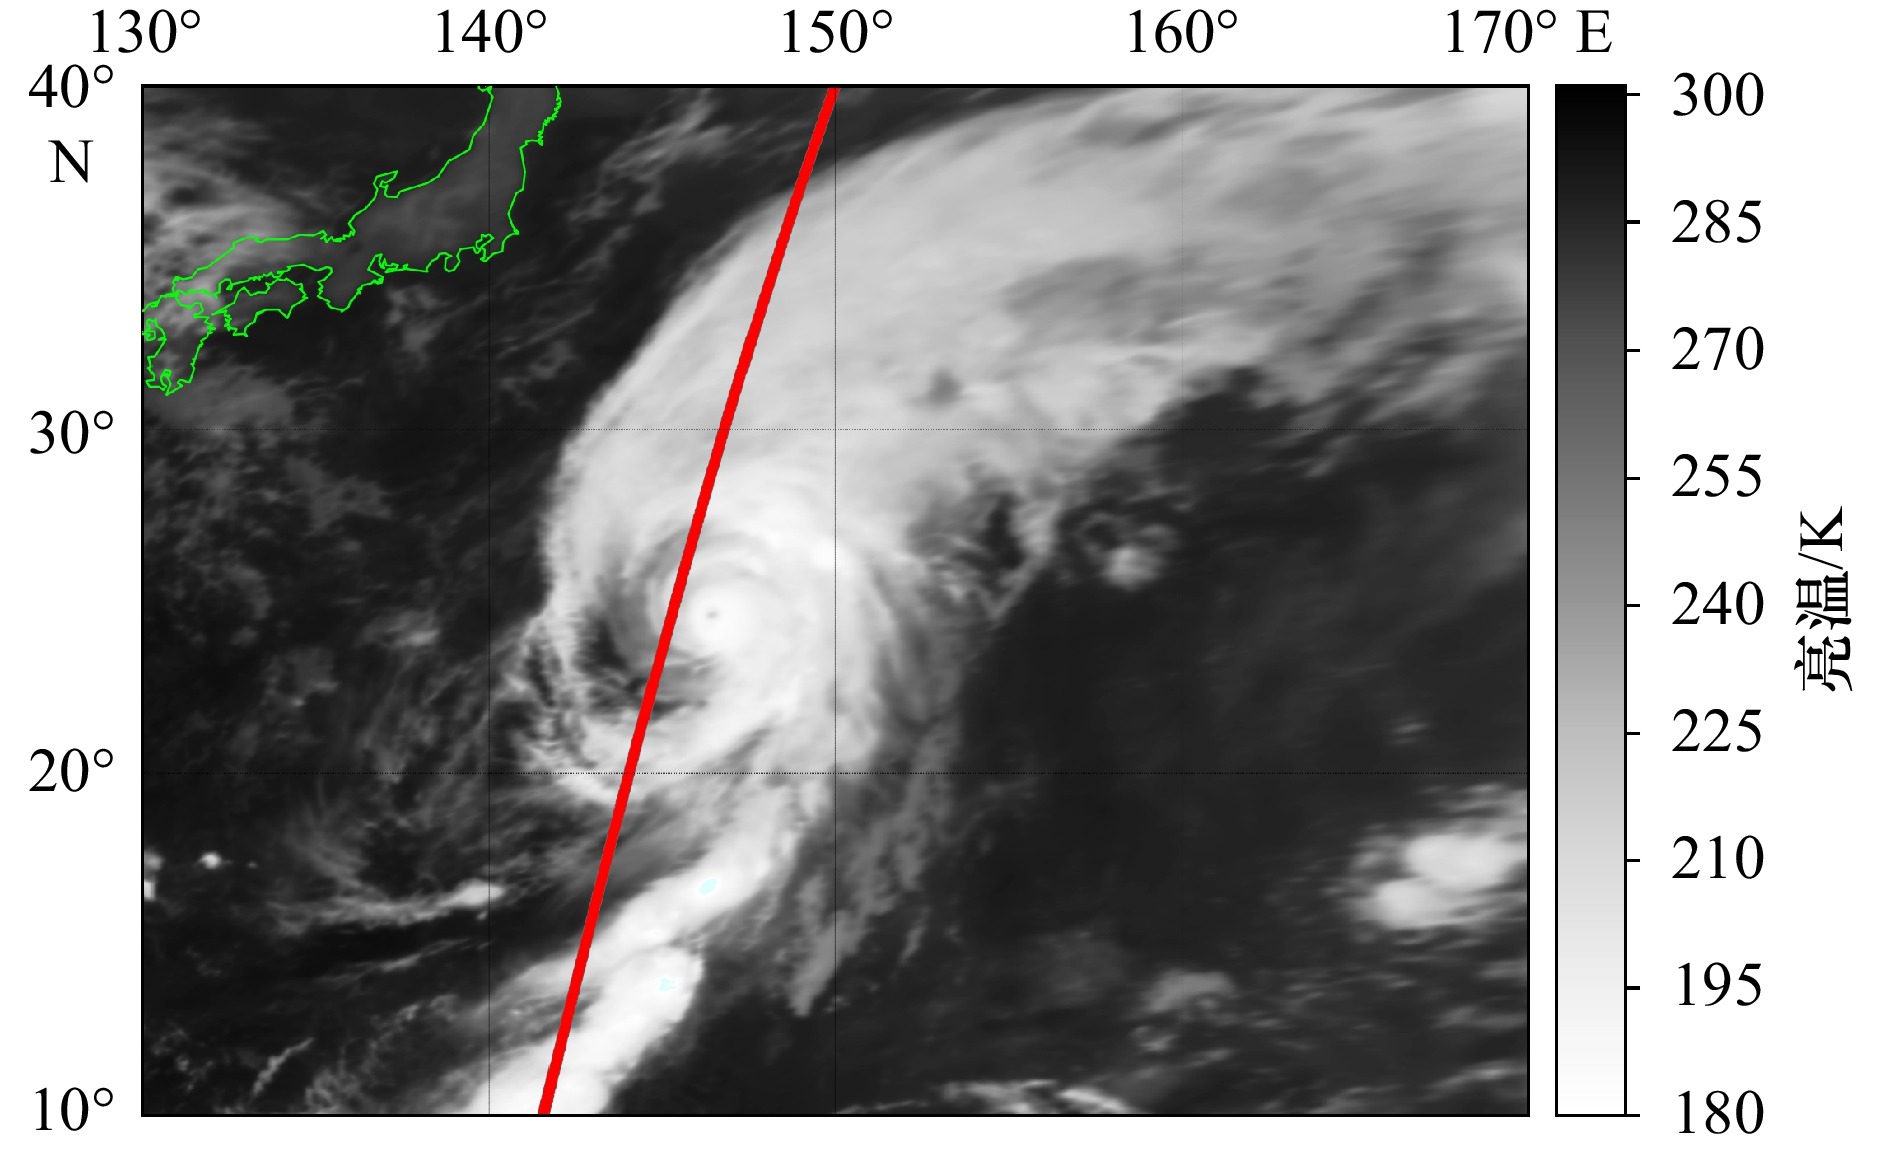
图 4 FY-2G卫星观测TBB(Black Body Temperature)亮温与HY-2B观测轨迹
Fig. 4 Observations of TBB (Black Body Temperature) brightness temperature by FY-2G satellite and the observation trajectory of HY-2B

图 5 HY-2C观测台风 “苏拉”风速修正前后比较
Fig. 5 Comparison of THPHOON SAOLA wind speed before and after correction

图 6 FY-2G卫星观测TBB亮温与HY-2C观测轨迹
Fig. 6 Observations of TBB brightness temperature by FY-2G satellite and the observation trajectory of HY-2C

图 8 2017年9月20日飓风“MARIA”中观测点位置、降雨率分布和Jason-3观测轨迹 (风速66.93 m/s)
Fig. 8 Observation Point Location, Rainfall Rate Distribution and Jason-3 Observation trajectory in Hurricane "MARIA" on September 20, 2017 (Wind Speed 66.93 m/s)

图 9 2018年10月3日飓风“SERGIO”中观测点位置、降雨率分布和Jason-2观测轨迹(风速56.16 m/s)
Fig. 9 Observation Point Location, Rainfall Rate Distribution and Jason-2 Observation trajectory in Hurricane "SERGIO" on October 3, 2018 (Wind Speed 56.16 m/s)

图 10 2002年5月30日飓风“ALMA”中观测点位置、降雨率分布和Jason-1观测轨迹(风速50.33 m/s)
Fig. 10 Observation Point Location, Rainfall Rate Distribution and Jason-1 Observation trajectory in Hurricane ALMA on May 30, 2002 (Wind Speed 50.33 m/s)
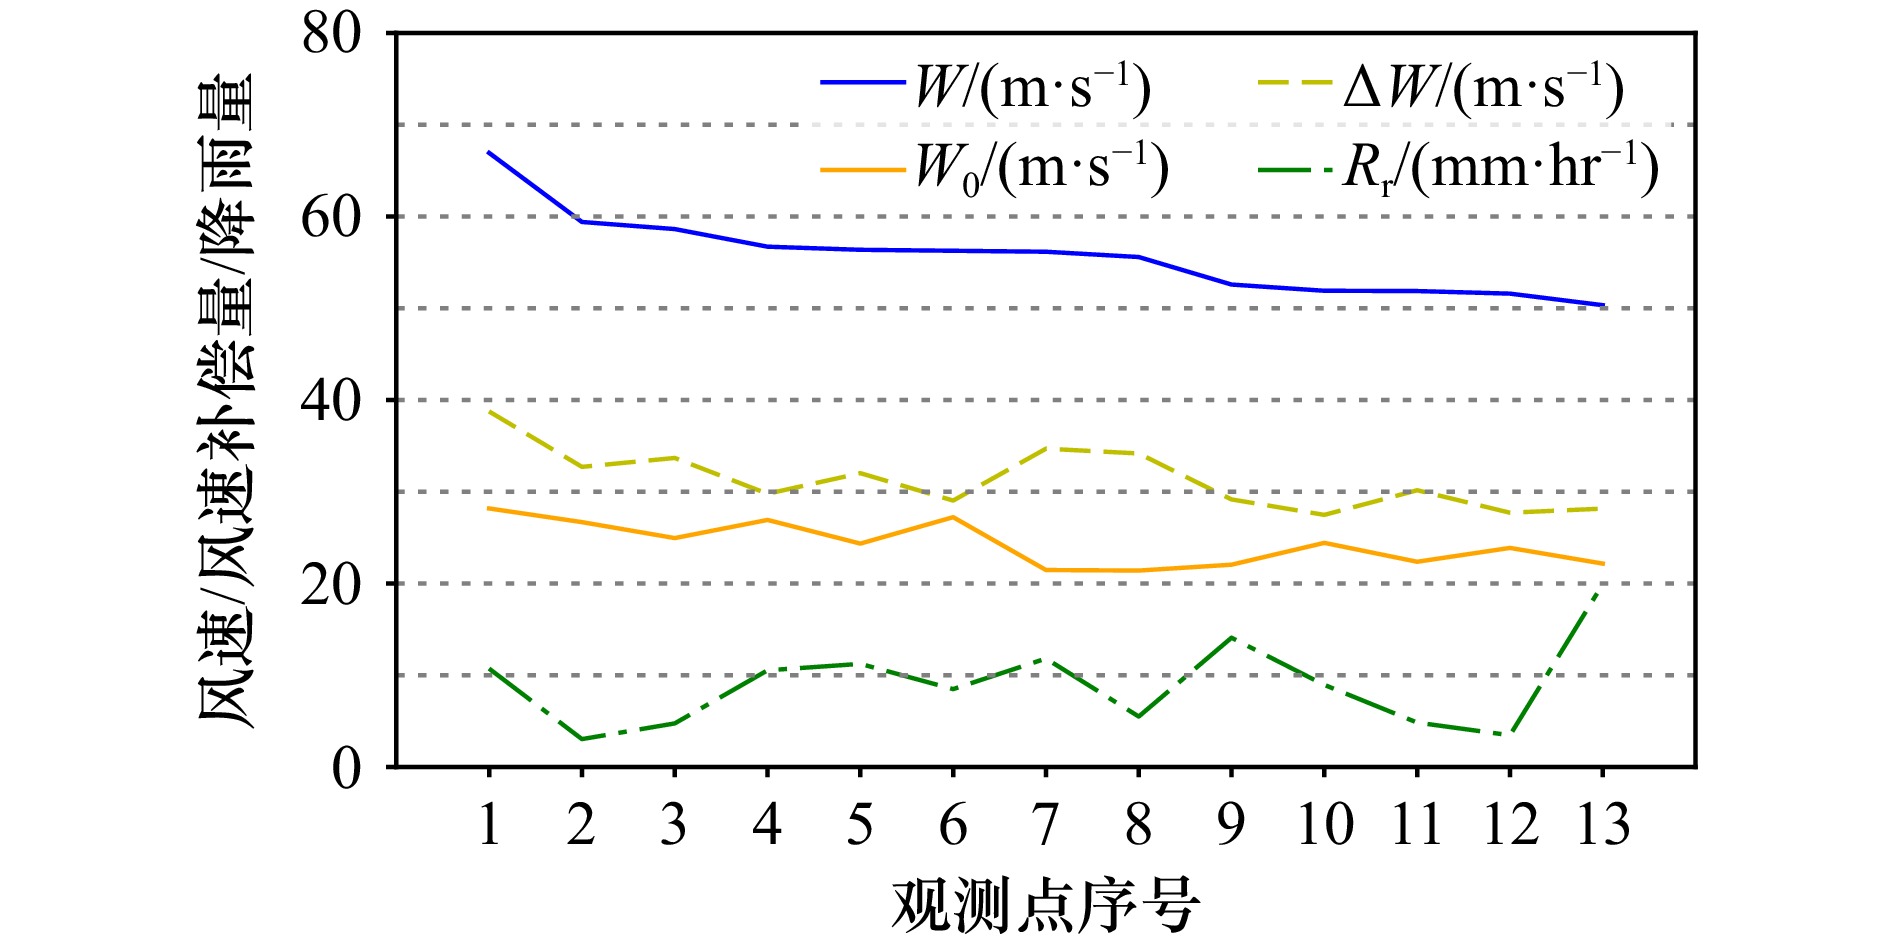
图 11 50 m/s以上风速对应的W、W0、ΔW和Rr
Fig. 11 W, W0, ΔW and Rr corresponding to wind speeds above 50 m/s

图 12 Jason-1/2/3卫星观测点对应W、W0和NHC风速、气压、降雨率对比分析
Fig. 12 Comparative analysis of between W、W0 corresponding to Jason-1/2/3 satellite observation points and wind speed, air pressure, rainfall rate of NHC
表 1 Jason系列和HY-2系列卫星雷达高度计基本信息
Tab. 1 Basic information of Jason and HY-2 series satellite radar altimeters
卫星 在轨时间 主要技术指标 功能 Jason-1 2001年-2013年 1. 卫星观测重复周期10天;2. 雷达高度计观测频段:
Ku (13.575 GHz), C (5.3 GHz);3. 微波辐射计观测频
段:18.7 GHz,23.8 GHz和34 GHz。获取全球海面高度、有效波高和海面风速、后向散射系数、亮度温度、大气水汽含量、液水含量等信息。 Jason-2 2008年-2019年 Jason-3 2016年-至今 HY-2B 2018年-至今 1.卫星观测重复周期14天(B星)和10天(C/D星);2.雷达高度计观测频段:Ku (13.58 GHz), C (5.25 GHz);3.校正辐射计观测频段:18.7 GHz,23.8 GHz和37 GHz。 HY-2C 2020年-至今 HY-2D 2021年-至今  下载: 导出CSV
参数 a b σ° − 0.34336 0.06909 SWH 0.08725 0.06374 U10 0.1 0.02844
下载: 导出CSV
参数 矩阵元素 $ \overline{{W}_{x}} $ − 33.95062 − 11.03394 − 3.93428 − 0.05834 $ \overline{{W}_{y}} $ 0.54012 10.40481 $ \overline{{B}_{x}} $ 18.06378 − 0.37228 $ \overline{{B}_{y}} $ − 2.28387 … $ \stackrel{\rightharpoonup}{P} $ $ {a}_{{\sigma }^{0}}+{b}_{{\sigma }^{0}}{\sigma }^{0} $ $ {a}_{SWH}+{b}_{SWH}SWH $
下载: 导出CSV
表 4 HY-2B/C卫星台风观测(1.5 h,50 km)与CMA比较
Tab. 4 Comparison between HY-2B/C satellite typhoon observation (1.5 h, 50 km) and CMA
序号 台风名称 数据源 日期
(yy-mm-dd)纬度(N°) 经度(E°) $ {\sigma }_{Ku}^{0} $
(dB)$ {\sigma }_{C}^{0} $
(dB)W0
(m·s−1)T18
(K)W
(m·s−1)CMA风速
(m/s)观测距离
(km)降雨率
(mm·hr−1)1 WIPHA B 2019-08-01 20.88 110.72 12.22 13.9 12.05 183.46 24.30 23 24.61 1.4 2 KAMMURI B 2019-12-02 13.02 125.48 9.75 12.46 21.06 199.13 41.39 48 13.51 7.9 3 PHANFONE B 2019-12-27 14.97 116.63 10.37 12.37 19.18 180.0 34.44 30 24.91 8.8 4 Molave B 2020-10-27 14.14 110.56 9.37 12.13 22.50 197.70 43.30 45 26.55 3.2 5 SURIGAE C 2021-04-15 8.56 135.41 11.51 12.77 14.36 190.43 29.43 28 35.02 6.1 6 MINDULLE C 2021-09-26 19.28 136.43 9.05 10.06 23.60 209.07 47.31 52 45.74 3.0
下载: 导出CSV
表 5 HY-2B卫星台风观测(1.5 h,50 km以内)与JTWC 比较
Tab. 5 Comparison between HY-2B satellite typhoon observation (1.5 h, 50 km) and JTWC
序号 台风名称 数据源 日期
(yy-mm-dd)纬度(N°) 经度(E°) $ {\sigma }_{Ku}^{0} $
(dB)$ {\sigma }_{C}^{0} $
(dB)W0
(m·s−1)T18
(K)W
(m·s−1)JTWC风速
(m·s−1)观测距离
(km)降雨率
(mm·hr−1)1 WIPHA JTWC 2019-08-01 20.88 110.72 12.22 13.9 12.05 183.46 24.30 20 42.94 1.4 2 BUALOI JTWC 2019-10-23 21.08 142.44 7.00 10.04 29.04 222.12 59.46 60 30.03 9.1
下载: 导出CSV
表 6 Jason-1/2/3卫星主要观测信息统计
Tab. 6 Statistical analysis of main observation information of Jason-1/2/3 satellite
数据源 观测最大风速/(m·s−1) 观测最小风速/(m·s−1) 相关系数 平均偏差
(m·s−1)RMSE
(m·s−1)观测数据
点数W NHC W NHC Jason-1 59.40(原26.69) 50 8.03(原5.12) 12.5 0.94 0.04 3.53 195 Jason-2 58.63(原24.95) 57.5 8.39(原5.09) 10 0.95 -0.40 3.49 158 Jason-3 66.93(原28.18) 67.5 8.89(原4.37) 12.5 0.95 -0.23 3.82 78 Jason-1/2/3 66.93(原28.18) 67.5 8.03(原5.12) 12.5 0.95 -0.17 3.57 431
下载: 导出CSV
表 7 短时气象服务降雨量等级划分表
Tab. 7 Classification of Rainfall Levels for Short term Meteorological Services
单位:mm 等级 时段 10 min 30 min 1 h 短时小雨 <0.5 <1.0 <2.0 短时中雨 0.5~0.9 1.0~1.9 2.0~3.9 短时大雨 1.0~1.9 2.0~3.9 4.0~7.9 短时暴雨 2.0~4.9 4.0~9.9 8.0~19.9 短时大暴雨 5.0~15.0 10.0~30.0 20.0~50.0 短时特大暴雨 >15.0 >30.0 >50.0
下载: 导出CSV
表 8 50 m/s以上风速和降雨统计
Tab. 8 Statistics of wind speed and rainfall above 50 m/s
Jason
卫星编号飓风名称 观测日期
(日-月-年)纬度(N°) 经度
(E°)W
(m·s−1)W0
(m·s−1)ΔW
(m·s−1)Rr
(mm·hr−1)备注 3 MARIA 20-Sep-17 17.65 −66.80 66.93 28.18 38.75 10.7 暴雨 1 JEANNE 25-Sep-04 26.53 −76.70 59.40 26.69 32.71 3.0 中雨 2 OLAF 21-Oct-15 10.99 −142.71 58.63 24.95 33.68 4.8 大雨 2 JOAQUIN 1-Oct-15 22.75 −74.62 56.71 26.93 29.78 10.5 暴雨 2 DOLORES 15-Jul-15 18.06 −109.49 56.38 24.35 32.03 11.2 暴雨 2 HECTOR 5-Aug-18 14.07 −135.72 56.27 27.23 29.04 8.5 暴雨 2 SERGIO 3-Oct-18 12.15 −115.78 56.16 21.47 34.69 11.8 暴雨 2 JIMENA 1-Sep-15 16.90 −140.42 55.58 21.41 34.17 5.5 大雨 3 LEE 28-Sep-17 32.10 −57.30 52.59 22.05 29.16 14.09 暴雨 2 MICHAEL 9-Oct-18 25.34 −85.77 51.91 24.43 27.48 9.0 暴雨 2 IGOR 16-Sep-10 21.40 −57.80 51.88 22.37 30.16 4.84 大雨 3 ROSA 28-Sep-18 16.98 −117.56 51.60 23.88 27.72 3.5 中雨 1 ALMA 30-May-02 16.78 −114.96 50.33 22.17 28.16 19.9 暴雨 3 MARIA 20-Sep-17 17.65 −66.80 66.93 28.18 38.75 10.7 暴雨
下载: 导出CSV
表 9 Jason-1/2/3卫星观测飓风风速信息统计(0.6 h 30 km内)
Tab. 9 Jason-1/2/3 satellite observation of hurricane wind speed information statistics (within 0.6 h 30 km)
Jason卫星编号 飓风名称 日期
(dd-mm-yy)$ {\sigma }_{Ku}^{0} $
(dB)$ {\sigma }_{C}^{0} $
(dB)W0
(m·s−1)T18
(K)W
(m·s−1)NHC
(m·s−1)Rr
(mm·hr−1)距离
(km)绝对误差
(m·s−1)时间间隔
(mmss)1 KARL 22-Sep-04 10.41 11.98 15.59 238.28 42.43 45.00 7.71 19.71 2.57 1503 1 MARIA 7-Sep-05 9.82 12.32 21.94 190.04 40.31 37.50 1.02 12.95 2.81 3244 2 JOSE 13-Sep-17 11.04 12.62 15.41 203.84 34.10 35.00 3.83 28.55 0.90 1217 3 GENEVIEVE 17-Aug-20 11.32 12.94 15.63 202.16 33.42 32.50 11.62 12.92 0.92 3124 2 GEORGETTE 26-Jul-16 11.52 13.47 14.02 192.05 29.39 27.50 0.24 11.77 1.89 0044 2 FIONA 20-Aug-16 11.41 13.73 14.40 172.78 26.14 22.50 2.73 13.23 3.64 1927 2 ESTELLE 16-Jul-16 12.50 14.59 10.56 188.79 23.32 20.00 0.30 28.70 3.32 1355 3 DEBBY 3-Aug-18 11.86 13.93 13.59 156.68 21.21 17.50 0.00 16.43 3.71 1600 3 GABRIELLE 7-Sep-19 12.26 13.75 11.50 169.97 20.97 22.50 0.00 8.17 1.53 2307 3 EMILIA 28-Jun-18 12.88 14.45 10.12 174.43 19.25 20.00 0.71 15.26 0.75 2824 1 EMILIA 23-Jul-06 13.10 14.75 9.47 178.99 19.07 22.50 6.53 4.83 3.43 0107 3 JULIETTE 8-Sep-19 13.12 14.33 9.04 172.37 17.27 15.00 0.08 12.81 2.27 2407 2 KEVIN 1-Sep-15 13.20 15.00 8.12 166.11 14.94 15.00 0.57 25.52 0.06 0241 2 LOWELL 17-Aug-14 14.28 14.99 4.75 177.28 11.65 15.00 2.86 22.68 3.35 1228 RMSE=2.47 m/s, R=0.96
下载: 导出CSV
-
[1] Brown G, Stanley H, Roy N. The wind-speed measurement capability of spaceborne radar altimeters[J]. IEEE Journal of Oceanic Engineering, 1981, 6(2): 59−63. doi: 10.1109/JOE.1981.1145484 [2] Chelton D B, Mccabe P J. A review of satellite altimeter measurement of sea surface wind speed: with a proposed new algorithm[J]. Journal of Geophysical Research: Oceans, 1985, 90(C3): 4707−4720. doi: 10.1029/JC090iC03p04707 [3] Chelton D B, Wentz F J. Further development of an improved altimeter wind speed algorithm[J]. Journal of Geophysical Research: Oceans, 1986, 91(C12): 14250−14260. doi: 10.1029/JC091iC12p14250 [4] Witter D L, Chelton D B. A geosat altimeter wind speed algorithm and a method for altimeter wind speed algorithm development[J]. Journal of Geophysical Research: Oceans, 1991, 96(C5): 8853−8860. doi: 10.1029/91JC00414 [5] Glazman R E, Greysukh A. Satellite altimeter measurements of surface wind[C]//Proceedings of IGARSS '93 - IEEE International Geoscience and Remote Sensing Symposium. Tokyo: IEEE, 1993: 1567−1569. [6] Monaldo F, Dobson E. On using significant wave height and radar cross section to improve radar altimeter measurements of wind speed[J]. Journal of Geophysical Research: Oceans, 1989, 94(C9): 12699−12701. doi: 10.1029/JC094iC09p12699 [7] Zhao Dongliang, Toba Y. A spectral approach for determining altimeter wind speed model functions[J]. Journal of Oceanography, 2003, 59(2): 235−244. doi: 10.1023/A:1025599423405 [8] Gourrion J, Vandemark D C, Bailey S A, et al. A two-parameter wind speed algorithm for Ku-band altimeters[J]. Journal of Atmospheric and Oceanic Technology, 2002, 19(12): 2030−2048. doi: 10.1175/1520-0426(2002)019<2030:ATPWSA>2.0.CO;2 [9] 陈戈, 方朝阳, 徐萍. 利用双波段补偿法提高卫星高度计海面风速反演精度[J]. 中国图象图形学报, 1999, 4(11): 970−975. doi: 10.11834/jig.1999011230Chen Ge, Fang Chaoyang, Xu Ping. Using a dual-frequency adjustment approach to improve the accuracy of altimeter retrieved sea surface wind speed[J]. Journal of Image and Graphics, 1999, 4(11): 970−975 doi: 10.11834/jig.1999011230 [10] Quartly G D, Guymer T H, Srokosz M A. The effects of rain on topex radar altimeter data[J]. Journal of Atmospheric and Oceanic Technology, 1996, 13(6): 1209−1229. doi: 10.1175/1520-0426(1996)013<1209:TEOROT>2.0.CO;2 [11] Tian Jiasheng, Liu Qiaoyun, Pan Wan, et al. Improved algorithm of retrieving oceanic surface wind speed based on a stratified media model at high sea states[J]. IET Microwaves, Antennas & Propagation, 2014, 8(15): 1333−1339. [12] Young I R. An estimate of the Geosat altimeter wind speed algorithm at high wind speeds[J]. Journal of Geophysical Research: Oceans, 1993, 98(C11): 20275−20285. doi: 10.1029/93JC02117 [13] Sharoni S M H, Md Reba M N, Hossain M S. Tropical cyclone wind speed estimation from satellite altimeter-derived ocean parameters[J]. Journal of Geophysical Research: Oceans, 2021, 126(4): e2020JC016988. doi: 10.1029/2020JC016988 [14] Quilfen Y, Prigent C, Chapron B, et al. The potential of QuikSCAT and WindSat observations for the estimation of sea surface wind vector under severe weather conditions[J]. Journal of Geophysical Research: Oceans, 2007, 112(C9): C09023. [15] Powell M D. Near-surface based, airborne, and satellite observations of tropical cyclones[M]//Chan J C J, Kepert J D. Global Perspectives on Tropical Cyclones: From Science to Mitigation. Singapore: World Scientific Publishing Company, 2010: 177−199. [16] 张有广, 贾永君, 林明森, 等. 基于HY-2卫星数据的热带气旋风速和气压反演[J]. 遥感学报, 2024, 28(6): 1588−1601.Zhang Youguang, Jia Yongjun, Lin Mingsen, et al. A retrieval method of tropical cyclone wind speed and sea level pressure based on HY-2 satellite data[J]. National Remote Sensing Bulletin, 2024, 28(6): 1588−1601. [17] Lin Mingsen, Zhang Youguang. 中国海洋卫星发展现状和主要应用进展(英文)[J]. Aerospace China, 2022, 23(1): 41−54. (查阅网上资料, 本条文献为英文文献, 请确认) Lin Mingsen, Zhang Youguang. The development status and main application progress of China's ocean satellites(English)[J]. Aerospace China, 2022, 23(1): 41−54. [18] Lu Xiaoqin, Yu Hui, Ying Ming, et al. Western north Pacific tropical cyclone database created by the China meteorological administration[J]. Advances in Atmospheric Sciences, 2021, 38(4): 690−699. doi: 10.1007/s00376-020-0211-7 [19] Ying Ming, Zhang Wei, Yu Hui, et al. An overview of the China meteorological administration tropical cyclone database[J]. Journal of Atmospheric and Oceanic Technology, 2014, 31(2): 287−301. doi: 10.1175/JTECH-D-12-00119.1 [20] Delgado S, Landsea C W, Willoughby H. Reanalysis of the 1954–63 Atlantic hurricane seasons[J]. Journal of Climate, 2018, 31(11): 4177−4192. doi: 10.1175/JCLI-D-15-0537.1 [21] Kieper M E, Landsea C W, Beven J L. A reanalysis of hurricane Camille[J]. Bulletin of the American Meteorological Society, 2016, 97(3): 367−384. doi: 10.1175/BAMS-D-14-00137.1 [22] Landsea C W, Glenn D A, Bredemeyer W, et al. A reanalysis of the 1911–20 Atlantic hurricane database[J]. Journal of Climate, 2008, 21(10): 2138−2168. doi: 10.1175/2007JCLI1119.1 [23] Landsea C W, Franklin J L. Atlantic hurricane database uncertainty and presentation of a new database format[J]. Monthly Weather Review, 2013, 141(10): 3576−3592. doi: 10.1175/MWR-D-12-00254.1 [24] Landsea C W, Feuer S, Hagen A, et al. A reanalysis of the 1921–30 Atlantic hurricane database[J]. Journal of Climate, 2012, 25(3): 865−885. doi: 10.1175/JCLI-D-11-00026.1 [25] Landsea C W, Anderson C, Clark G, et al. The Atlantic hurricane database re-analysis project: results for 1851-1899[C]//Proceedings of the 12th Symposium on Global Change Studies and Climate Variations. Boston: American Meteorological Society, 2001. [26] Hagen A B, Strahan-Sakoskie D, Luckett C. A reanalysis of the 1944–53 Atlantic hurricane seasons—the first decade of aircraft reconnaissance[J]. Journal of Climate, 2012, 25(13): 4441−4460. doi: 10.1175/JCLI-D-11-00419.1 [27] 中国气象服务协会. 短时气象服务降雨量等级: T/CMSA0013-2019[S]. 2019.China Meteorological Service Association. The grade of rainfall in short time weather service: T/CMSA0013-2019[S]. 2019. [28] 窦贤豪. 基于星载雷达高度计的中高海况海面参数校正方法研究[D]. 武汉: 华中科技大学, 2021.Dou Xianhao Research on sea surface parameter correction method for medium and high sea condition based on spaceborne radar altimeter[D]. Wuhan: Huazhong University of Science & Technology, 2021. -


计量
- 文章访问数: 19
- HTML全文浏览量: 6
- PDF下载量: 3
- 被引次数: 0
