

Rapid warming of the Pacific during 2013–2020: identification and spatial-temporal characteristics
-
摘要: 利用基于Argo的多套次表层温盐观测数据,本文分析了2004–2020年太平洋0~1 500 m海洋热含量的变化趋势。研究发现,太平洋海洋热含量在2013年出现长期趋势的转变。2013–2020年太平洋海洋热含量相对于2004–2012年快速增加,前者线性趋势达到约0.50 × 10²² J/a,显著高于后者。近期太平洋出现了快速增暖现象。2013–2020年间,太平洋海洋热含量线性增加趋势最大出现在北太平洋西部,其次是热带太平洋和北太平洋东部,而整个南太平洋海洋热含量呈略微减少趋势。在北太平洋西部,海洋热含量快速增加集中在黑潮延伸体海域,该增暖趋势很可能是由黑潮延伸体主轴北移引起的。值得一提的是,日本以南出现了局地海洋热含量减少趋势,该变冷趋势与黑潮大弯曲不断加深有关。在增暖趋势次之的热带太平洋,海洋热含量的快速增加很可能是由温跃层快速加深导致的。此外,太平洋快速增暖反映在海表高度快速升高之中。每1 cm/a的海表高度线性趋势对应于0.11 × 109 J/(m2·a)的海洋热含量线性趋势。本研究揭示了全球变暖停滞结束以来太平洋快速增暖现象,加深了对近期太平洋热力状况的认识。Abstract: Using multiple observational subsurface temperature and salinity datasets based on Argo, we analyze the trend of 0–1 500 m ocean heat content in the Pacific between 2004 and 2020. It was found that the long-term trend of the Pacific ocean heat content showed a shift in 2013. The ocean heat content in 2013–2020 increased rapidly compared with that in 2004–2012. The linear trend of the former reaches about 0.50 × 10²² J/a, which is significantly higher than that of the latter. The Pacific has recently experienced rapid warming. During 2013–2020, the largest linear trend of the ocean heat content in the Pacific appeared in the western North Pacific, followed by the Tropical Pacific and eastern North Pacific. While the ocean heat content in the entire South Pacific showed a slightly decreasing trend. In the western North Pacific, the rapid increase of ocean heat content was concentrated in the Kuroshio Extension areas, and this warming trend is likely to be caused by the northward shift of the Kuroshio Extension main axis. It is worth mentioning that there was a local decreasing trend of ocean heat content in the south of Japan, and this cooling trend is associated with the strengthening of the Kuroshio large meander. In the Tropical Pacific where the warming trend is the second largest, the rapid increase of ocean heat content is likely to be induced by the thermocline deepening. In addition, we point out that the rapid warming in the Pacific is reflected by the rapid rise of sea level. The linear trend of sea level per 1 cm/a corresponds to the linear trend of ocean heat content of 0.11 × 10⁹ J/(m2·a). This study elucidates the rapid warming of the Pacific since the end of the global warming hiatus, deepening our understanding of recent thermal conditions in the Pacific.
-

图 1 太平洋150°E(a)、180°(b)和140°W(c)3个断面0~1 800 m温度异常的均方根分布。粉色虚线标注了1 500 m深度。结果基于RG_Argo数据
Fig. 1 Distributions of root mean square of 0–1 800 m temperature anomalies along three latitude-depth sections in the Pacific: the 150°E section (a), the 180° section (b), and the 140°W section (c). The pink dashed lines denote the depth of 1 500 m. The results are based on the RG_Argo data
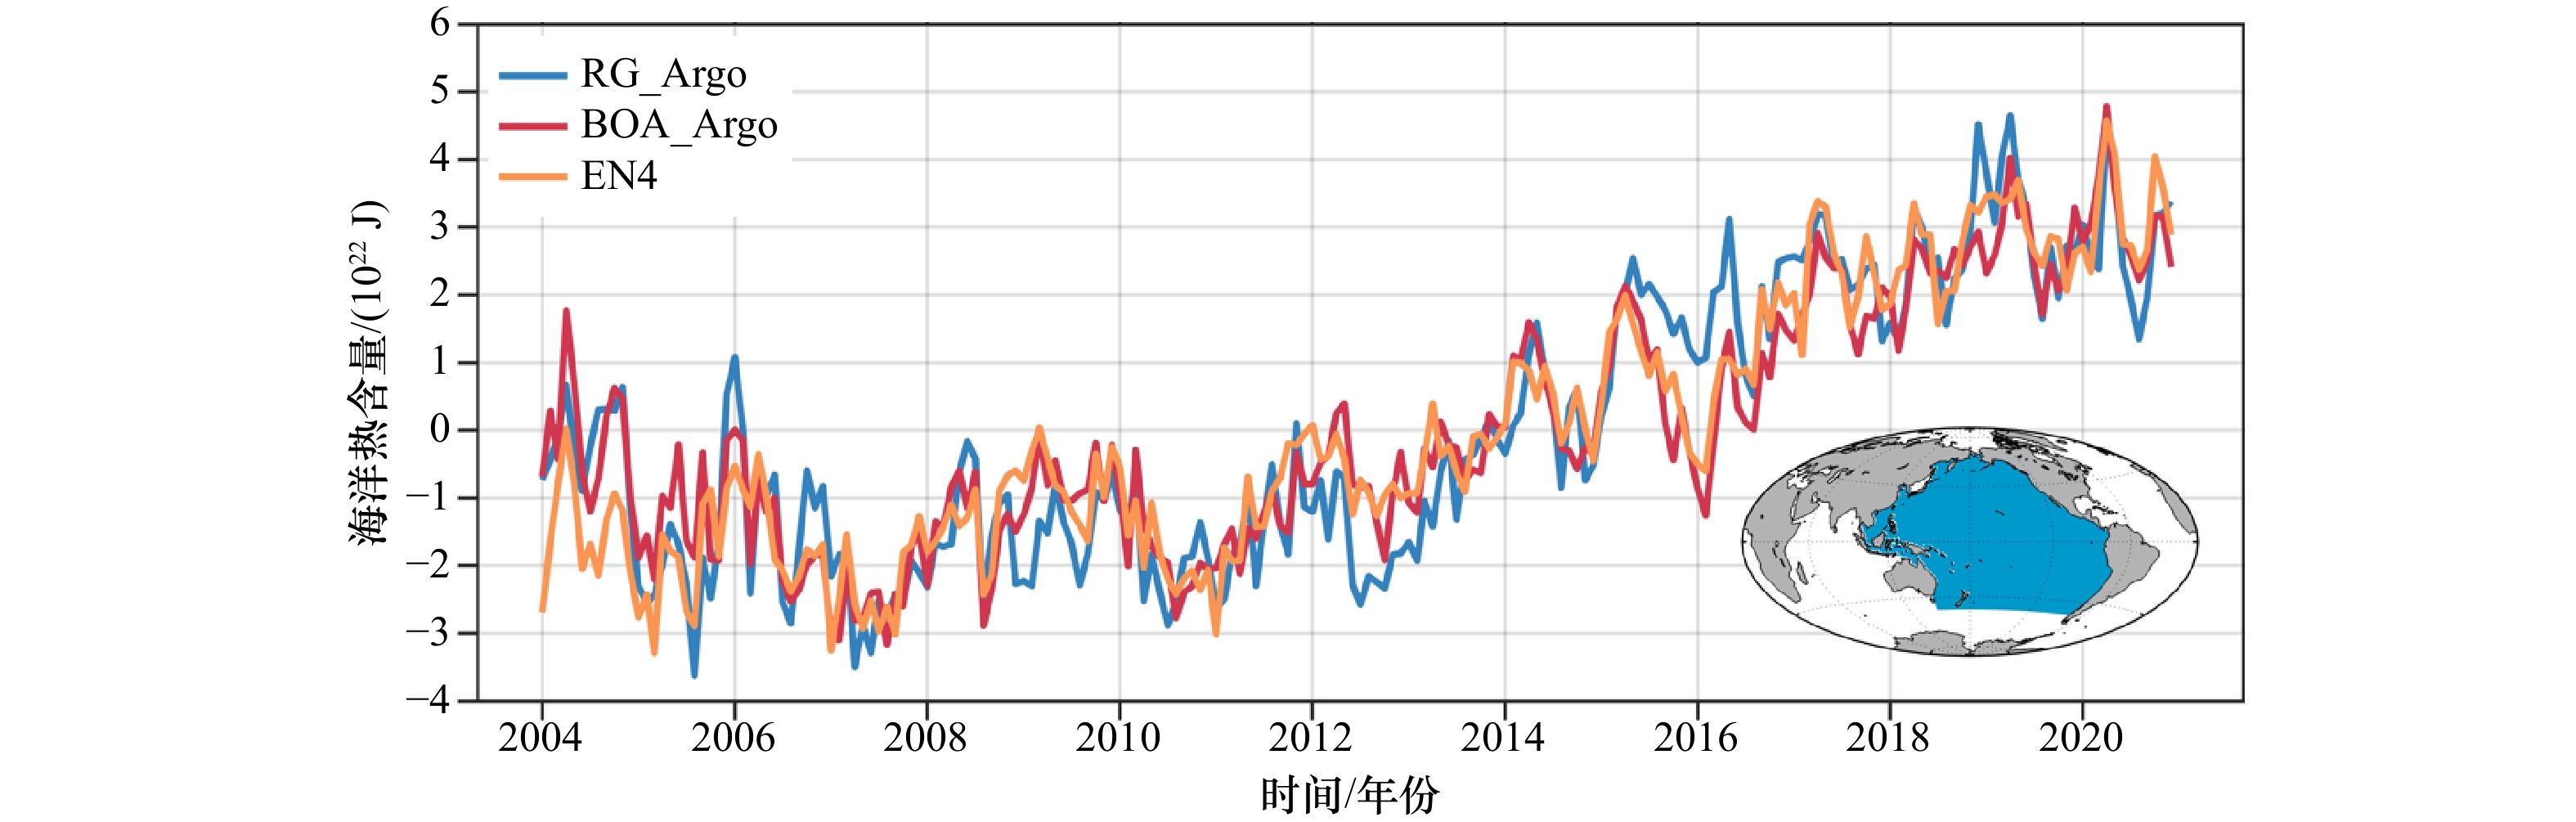
图 2 由RG_Argo、BOA_Argo和EN4数据得到的2004–2020年太平洋0~1 500 m逐月海洋热含量时间序列
右下角蓝色填色区域为研究的整个太平洋,其海盆mask来自WOA 2009
Fig. 2 Time series of the 2004–2020 monthly 0~1 500 m ocean heat content in the Pacific derived from the RG_Argo data, the BOA_Argo data, and the EN4 data
The blue shading area in the lower right corner presents the studied entire Pacific. Its basin mask comes from WOA 2009

图 3 由RG_Argo(a)、BOA_Argo(b)和EN4(c)数据得到的2004–2020年太平洋0~1 500 m年均海洋热含量累积距平。平均而言,2013年是海洋热含量趋势由负转正的年份,其累积距平值用红色圆点标出
Fig. 3 Accumulated anomalies of the 2004–2020 annual 0−1 500 m ocean heat content in the Pacific derived from RG_Argo data (a), BOA_Argo data (b), and EN4 data (c), respectively. In terms of the 17 year average, 2013 is the year when the ocean heat content trend turned from negative to positive. The red dot denotes the accumulated anomaly value in 2013 for each dataset

图 4 由RG_Argo(a)、BOA_Argo(b)和EN4(c)数据得到的2004–2012年和2013–2020年太平洋逐月0~1 500 m海洋热含量线性趋势(已经去掉了年循环)
各子图中红色实线为2004–2012年海洋热含量线性趋势,相应斜率为K1;橙色实线为2013–2020年线性趋势,相应斜率为K2。
Fig. 4 Linear trends of the 2004–2012 and 2013–2020 monthly 0–1 500 m ocean heat content in the Pacific derived from RG_Argo data (a), BOA_Argo data (b), and EN4 data (c), respectively (The annual cycle is removed from each time series)
The red line in each subplot represents the 2004–2012 ocean heat content linear trend with the corresponding slope K1. The orange line in each subplot denotes the 2013–2020 linear trend with the corresponding slope K2

图 5 由RG_Argo(a)、BOA_Argo(b)和EN4(c)数据得到的2013–2020年太平洋0~1 500 m海洋热含量线性趋势的空间分布
Fig. 5 Spatial distributions of linear trends of 0–1 500 m ocean heat content in the Pacific during 2013–2020 derived from RG_Argo (a), BOA_Argo (b), and EN4 (c) datasets, respectively

图 6 由RG_Argo得到的2013–2020年太平洋不同海域0~1 500 m海洋热含量线性趋势
a. 将研究的整个太平洋划分为4个海域,分别为北太平洋西部(WNP)、北太平洋东部(ENP)、热带太平洋(TP)和南太平洋(SP)。彩色填色为2013–2020年海洋热含量线性趋势的空间分布;b. 上述4个区域0~1 500 m海洋热含量的线性趋势;c. 区域平均的海洋热含量线性趋势
Fig. 6 Linear trends of the 0–1 500 m ocean heat content in different regions of the Pacific during 2013–2020 derived from the RG_Argo data
a. Dividing the entire Pacific into 4 regions. They are the western North Pacific (WNP), the eastern North Pacific (ENP), the Tropical Pacific (TP), and the South Pacific (SP). The color shading shows the spatial distribution of the linear trend of the 0–1 500 m ocean heat during 2013–2020; b. Linear trends of regional 0–1 500 m ocean heat content in the above 4 regions; c. Linear trends of regional mean ocean heat content

图 7 2013–2020年太平洋不同海域各水层海洋热含量的时间序列(去掉了年循环)
水层包括0~100 m(紫色实线)、0~300 m(蓝色实线)、0~500 m(绿色实线)、0~700 m(橙色实线)以及0~1 500 m(红色实线)。a. 北太平洋西部;b. 北太平洋东部;c. 热带太平洋;d. 南太平洋。结果基于RG_Argo数据
Fig. 7 Time series of ocean heat content for different water layers in different regions of the Pacific during 2013−2020 (the annual cycle is removed, respectively)
These water layers include 0−100 m (the purple line), 0−300 m (the blue line), 0−500 m (the green line), 0−700 m (the orange line), and 0−1500 m (the red line). a. The western North Pacific; b. the eastern North Pacific; c. the Tropical Pacific; d. the South Pacific. The results are based on the RG_Argo data

图 8 2013–2020年北太平洋西部0~1 500 m海洋热含量线性趋势的空间分布(a),以及黑潮和黑潮延伸体主轴位置(b)
a中0.4 × 10⁹ J/(m2·a)和–0.4 × 109 J/(m2·a)线性趋势用灰色等值线表示。结果基于RG_Argo数据;b中灰色等值线为0~1 500 m海洋热含量线性趋势,等值线间距为0.1 × 10⁹ J/(m2·a)。线性趋势为0.4 × 109 J/(m2·a)和–0.4 × 109 J/(m2·a)的等值线加粗并标注
Fig. 8 Spatial distribution of linear trends of the 0−1500 m ocean heat content in the western North Pacific during 2013−2020 (a), and the main axis positions of the Kuroshio and Kuroshio Extension (b)
a. Linear trends of 0.4 × 10⁹ J/(m2·a) and –0.4 × 10⁹ J/(m2·a) are indicated by grey contour lines. The results are based on the RG_Argo data; b. The grey contour lines show the linear trend of the 0–1 500 m ocean heat content with a spacing of 0.1 × 10⁹ J/(m2·a). The contour lines of linear trends of 0.4 × 10⁹ J/(m2·a) and –0.4 × 10⁹ J/(m2·a) are thickened and labeled

图 9 2013–2020年热带太平洋0~1 500 m海洋热含量线性趋势(a)、温跃层深度(D20)线性趋势(b)以及海表高度异常线性趋势的空间分布(c)。海洋热含量和D20趋势结果基于RG_Argo数据
Fig. 9 Spatial distributions of 0–1 500 m ocean heat content linear trend (a), thermocline depth (D20) linear trend (b), and sea level anomaly linear trend (c) in the Tropical Pacific during 2013–2020. The results of the ocean heat content trends and the D20 trends are based on the RG_Argo data
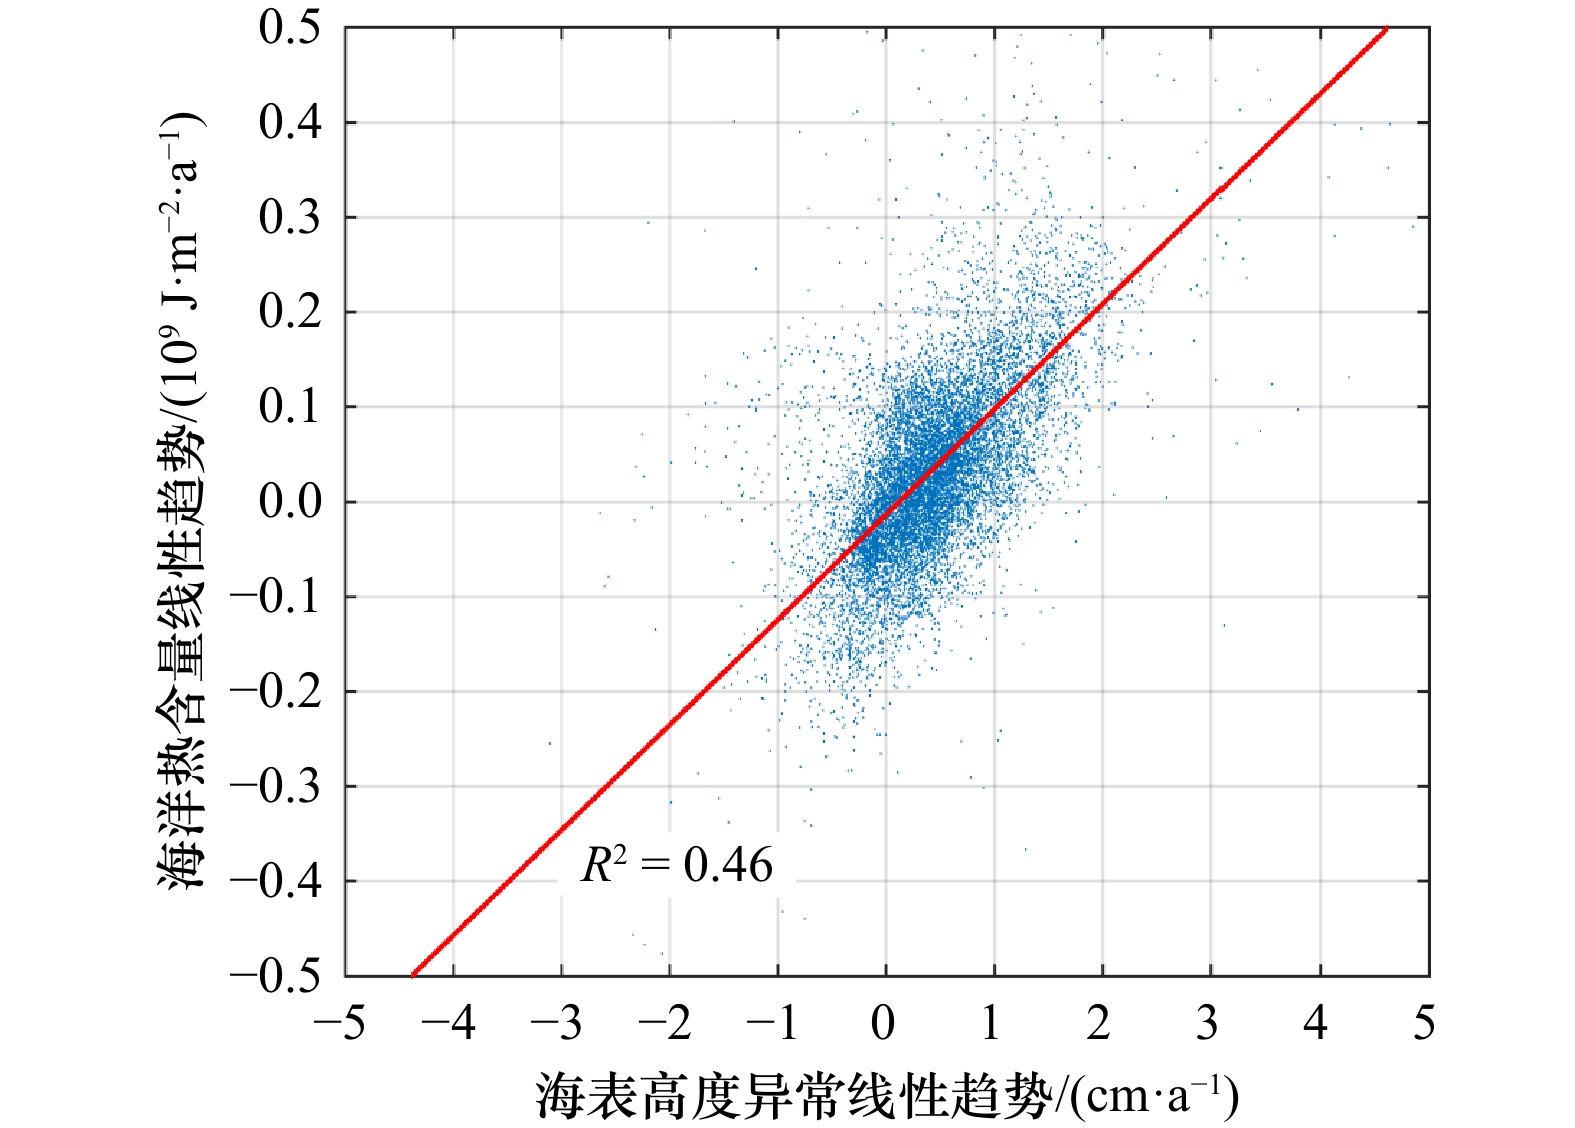
图 10 2013–2020年整个太平洋海表高度异常线性趋势与0~1 500 m海洋热含量线性趋势(基于RG_Argo数据)的散点分布
红色直线为根据最小二乘法得到的最优拟合,其拟合系数R2 = 0.46
Fig. 10 The scatter distribution of the linear trends of the sea level anomaly and 0–1 500 m ocean heat content (based on the RG_Argo data) in the entire Pacific during 2013–2020
The red line represents the best fit according to the least square method. The fit coefficient R2 = 0.46
-
[1] Levitus S, Antonov J I, Boyer T P, et al. Warming of the world ocean[J]. Science, 2000, 287(5461): 2225−2229. doi: 10.1126/science.287.5461.2225 [2] IPCC. Climate Change 2007: The Physical Science Basis. Contribution of Working Group I the Fourth Assessment Report of the Intergovernmental Panel on Climate Change[M]. Cambridge, U K: Cambridge University Press, 2007. [3] Trenberth K E, Fasullo J T. Tracking Earth's energy[J]. Science, 2010, 328(5976): 316−317. doi: 10.1126/science.1187272 [4] Cheng Lijing, Abraham J, Hausfather Z, et al. How fast are the oceans warming?[J]. Science, 2019, 363(6423): 128−129. doi: 10.1126/science.aav7619 [5] Levitus S, Antonov J I, Wang Julian, et al. Anthropogenic warming of earth's climate system[J]. Science, 2001, 292(5515): 267−270. doi: 10.1126/science.1058154 [6] Trenberth K E. An imperative for climate change planning: tracking Earth's global energy[J]. Current Opinion in Environmental Sustainability, 2009, 1(1): 19−27. doi: 10.1016/j.cosust.2009.06.001 [7] Trenberth K E, Fasullo J T, Balmaseda M A. Earth's energy imbalance[J]. Journal of Climate, 2014, 27(9): 3129−3144. doi: 10.1175/JCLI-D-13-00294.1 [8] Levitus S, Antonov J I, Boyer T P, et al. World ocean heat content and thermosteric sea level change (0−2 000 m), 1955−2010[J]. Geophysical Research Letters, 2012, 39(10): L10603. [9] Easterling D R, Wehner M F. Is the climate warming or cooling?[J]. Geophysical Research Letters, 2009, 36(8): L08706. [10] Knight J, Kennedy J J, Folland C, et al. Do global temperature trends over the last decade falsify climate predictions?[J]. Bulletin of the American Meteorological Society, 2009, 90. (查阅网上资料, 未找到对应的期号页码信息, 请确认) [11] Trenberth K E, Fasullo J T. An apparent hiatus in global warming?[J]. Earth's Future, 2013, 1(1): 19−32. doi: 10.1002/2013EF000165 [12] 林霄沛, 许丽晓, 李建平, 等. 全球变暖"停滞"现象辨识与机理研究[J]. 地球科学进展, 2016, 31(10): 995−1000.Lin Xiaopei, Xu Lixiao, Li Jianping, et al. Research on the global warming hiatus[J]. Advances in Earth Science, 2016, 31(10): 995−1000. [13] Chen Xianyao, Tung K K. Varying planetary heat sink led to global-warming slowdown and acceleration[J]. Science, 2014, 345(6199): 897−903. doi: 10.1126/science.1254937 [14] England M H, McGregor S, Spence P, et al. Recent intensification of wind-driven circulation in the Pacific and the ongoing warming hiatus[J]. Nature Climate Change, 2014, 4(3): 222−227. doi: 10.1038/nclimate2106 [15] Lee S K, Park W, Baringer M O, et al. Pacific origin of the abrupt increase in Indian Ocean heat content during the warming hiatus[J]. Nature Geoscience, 2015, 8(6): 445−449. doi: 10.1038/ngeo2438 [16] Nieves V, Willis J K, Patzert W C. Recent hiatus caused by decadal shift in Indo-Pacific heating[J]. Science, 2015, 349(6247): 532−535. doi: 10.1126/science.aaa4521 [17] Armour K C, Marshall J, Scott J R, et al. Southern Ocean warming delayed by circumpolar upwelling and equatorward transport[J]. Nature Geoscience, 2016, 9(7): 549−554. doi: 10.1038/ngeo2731 [18] Liu Wei, Xie Shangping, Lu Jian. Tracking ocean heat uptake during the surface warming hiatus[J]. Nature Communications, 2016, 7: 10926. doi: 10.1038/ncomms10926 [19] Deser C, Alexander M A, Xie Shangping, et al. Sea surface temperature variability: patterns and mechanisms[J]. Annual Review of Marine Science, 2010, 2: 115−143. doi: 10.1146/annurev-marine-120408-151453 [20] Kosaka Y, Xie Shangping. Recent global-warming hiatus tied to equatorial Pacific surface cooling[J]. Nature, 2013, 501(7467): 403−407. doi: 10.1038/nature12534 [21] Watanabe M, Shiogama H, Tatebe H, et al. Contribution of natural decadal variability to global warming acceleration and hiatus[J]. Nature Climate Change, 2014, 4(10): 893−897. doi: 10.1038/nclimate2355 [22] Trenberth K E. Has there been a hiatus?[J]. Science, 2015, 349(6249): 691−692. doi: 10.1126/science.aac9225 [23] Yan Xiaohai, Boyer T, Trenberth K, et al. The global warming hiatus: Slowdown or redistribution?[J]. Earth's Future, 2016, 4(11): 472−482. doi: 10.1002/2016EF000417 [24] Xie Shangping, Kosaka Y. What caused the global surface warming hiatus of 1998–2013?[J]. Current Climate Change Reports, 2017, 3(2): 128−140. doi: 10.1007/s40641-017-0063-0 [25] Cheng Lijing, Wang Gongjie, Abraham J P, et al. Decadal ocean heat redistribution since the late 1990s and its association with key climate modes[J]. Climate, 2018, 6(4): 91. doi: 10.3390/cli6040091 [26] Wei Meng, Qiao Fangli, Guo Yongqing, et al. Quantifying the importance of interannual, interdecadal and multidecadal climate natural variabilities in the modulation of global warming rates[J]. Climate Dynamics, 2019, 53(11): 6715−6727. doi: 10.1007/s00382-019-04955-2 [27] Roemmich D, Gilson J. The 2004−2008 mean and annual cycle of temperature, salinity, and steric height in the global ocean from the Argo Program[J]. Progress in Oceanography, 2009, 82(2): 81−100. doi: 10.1016/j.pocean.2009.03.004 [28] Li Hong, Xu Fanghua, Zhou Wei, et al. Development of a global gridded Argo data set with Barnes successive corrections[J]. Journal of Geophysical Research: Oceans, 2017, 122(2): 866−889. doi: 10.1002/2016JC012285 [29] Good S A, Martin M J, Rayner N A. EN4: quality controlled ocean temperature and salinity profiles and monthly objective analyses with uncertainty estimates[J]. Journal of Geophysical Research: Oceans, 2013, 118(12): 6704−6716. doi: 10.1002/2013JC009067 [30] Akima H. A new method of interpolation and smooth curve fitting based on local procedures[J]. Journal of the ACM, 1970, 17(4): 589−602. doi: 10.1145/321607.321609 [31] Mcdougall T J, Feistel R, Millero F J, et al. The international thermodynamic equation of seawater 2010 (TEOS-10): calculation and use of thermodynamic properties[R]. Intergovernmental Oceanographic Commission IOC of Unesco, 2010. (查阅网上资料, 未找到对应的出版地信息, 请确认) [32] Qiu Bo, Chen Shuiming. Variability of the kuroshio extension jet, recirculation gyre, and mesoscale eddies on decadal time scales[J]. Journal of Physical Oceanography, 2005, 35(11): 2090−2103. doi: 10.1175/JPO2807.1 [33] Cheng Lijing, Zheng Fei, Zhu Jiang. Distinctive ocean interior changes during the recent warming slowdown[J]. Scientific Reports, 2015, 5: 14346. doi: 10.1038/srep14346 [34] Guo Yongqing, Lin Xiaopei, Wei Meng, et al. Decadal variability of North Pacific eastern subtropical mode water[J]. Journal of Geophysical Research: Oceans, 2018, 123(9): 6189−6206. doi: 10.1029/2018JC013890 [35] Kolodziejczyk N, Llovel W, Portela E. Interannual variability of upper ocean water masses as inferred from Argo array[J]. Journal of Geophysical Research: Oceans, 2019, 124(8): 6067−6085. doi: 10.1029/2018JC014866 [36] Qiu Bo. Kuroshio and oyashio currents[M]//Cochran J K, Bokuniewicz H J, Yager P L. Encyclopedia of Ocean Sciences. 3rd ed. Amsterdam: Elsevier, 2019. [37] Sugimoto S, Qiu Bo, Kojima A. Marked coastal warming off Tokai attributable to Kuroshio large meander[J]. Journal of Oceanography, 2020, 76(2): 141−154. doi: 10.1007/s10872-019-00531-8 [38] Lu Jian, Vecchi G A, Reichler T. Expansion of the Hadley cell under global warming[J]. Geophysical Research Letters, 2007, 34(6): L06805. [39] Qiu Bo, Chen Shuiming, Oka E. Why did the 2017 Kuroshio large meander event become the longest in the past 70 years?[J]. Geophysical Research Letters, 2023, 50(10): e2023GL103548. doi: 10.1029/2023GL103548 -

 下载:
下载:
 点击查看大图
计量
- 文章访问数: 80
- HTML全文浏览量: 16
- PDF下载量: 26
- 被引次数: 0
