

Observational Analyses of a Sea Fog Event over the Northern Yellow Sea when Typhoon Lekima (1909) Landed on Qingdao
-
摘要: 利用多种观测数据、再分析数据和后向追踪模式,分析了2019年9号台风Lekima影响黄海北部期间发生的一次海雾过程,结果表明台风影响下的环流形势是此次海雾形成并影响沿海的决定性因素。来自黄海南部的暖湿气团在台风中心右侧较冷的海面凝结成雾,台风中心右侧区域的偏南气流不仅使黄海南部的暖湿空气不断向北输送,为海雾的形成和发展提供充足的水汽,同时其从黄海西岸带来的暖气团和台风中心区域的下沉气流在雾区上空形成了显著逆温层,在大气边界层内形成了“上稳下湍”的层结结构,也有利于海雾在岸滨及内陆地区的维持和发展。而台风后部水平风转向和台风中心外围增强的水平风加强了大气边界层底部的垂直风切变,从而导致的湍流混合增强和大气边界层稳定度下降是引发海雾消散的重要原因。Abstract: This study focuses on the physical process of a sea fog event during Typhoon Lekima in the Northern Yellow Sea by using observation data, reanalysis data and backward trajectory model. The analysis indicates that the typhoon circulation was the decisive factor determining whether fog formed offshore and developed inland. The warm and humid southerlies from the south Yellow Sea condensed into fog on the colder sea surface besides the typhoon center, which not only provided sufficient moisture for the formation and development of the sea fog but also formed a significant inversion layer over the fog area with the downdraft in the center of the typhoon. The "stable up and turbulent down" structure in the atmospheric boundary layer improved the development of sea fog on the coast and inland area. However, the horizontal wind steering and the strengthening wind speed behind the typhoon strengthened the wind shear in the atmospheric boundary layer, resulting in the enhanced turbulent mixing and the decrease of the stability in the bottom atmospheric boundary layer, which was the main cause of the fog dissipation.
-
Key words:
- Sea fog /
- Typhoon /
- Atmospheric boundary layer structure /
- Yellow Sea
-

图 1 2019年8月11日21时MTSAT-1R卫星IR1通道云图(a)和青岛区域大气能见度观测站点海拔高度(b)
图a中黑色等值线为海平面气压(单位:hPa),黑色折线为10日15时至12日06时的台风中心移动路径,圆圈表示每3 h台风中心的位置,11日21时的台风中心位置使用白框黑色三角形标注,表1中船舶位置使用黑框白色三角形标注;图b范围如图a中白色方框所示,圆点为青岛地区大气能见度仪所在站点位置,其中青岛站(QD)、太平角站(TPJ)、大公岛站(DGD)、朝连岛站(CLD)和大管岛站(GD)用黑框圆点标注(下同)
Fig. 1 The MTSAT-IR1 satellite image at 2100 BJT 11 August 2019 (a) and the heights of atmospheric visibility stations around Qingdao (b)
In Figure a, black contours at 3 hPa intervals: the sea level pressure (unit: hPa) from ERA5 data, black circles: typhoon moving track with 3-h intervals from 15:00 BJT 10 to 06:00 BJT 12. Black triangle with white frame marks the typhoon center at 21:00 BJT 11 and the white triangle with black frame marks the location of the ship in ICOADS data in Table 1. The white frame marks the area of Figure b, Fig.2 and Fig.4. In Figure b, the height of visbility stations (colored dots, the QD, TPJ, DGD, CLD and GD stations are marked with black circles)

图 2 2019年8月11日19时(a)、20时(b)、21时(c)、22时(d)、23时(e)和12日00时(f)青岛地区大气水平能见度分布图
Fig. 2 The hourly atmospheric visibility around Qingdao area at 19:00 (a), 20:00 (b), 21:00 (c), 22:00 (d), 23:00 (e) August 11 and 00:00 (f) August 12, 2019
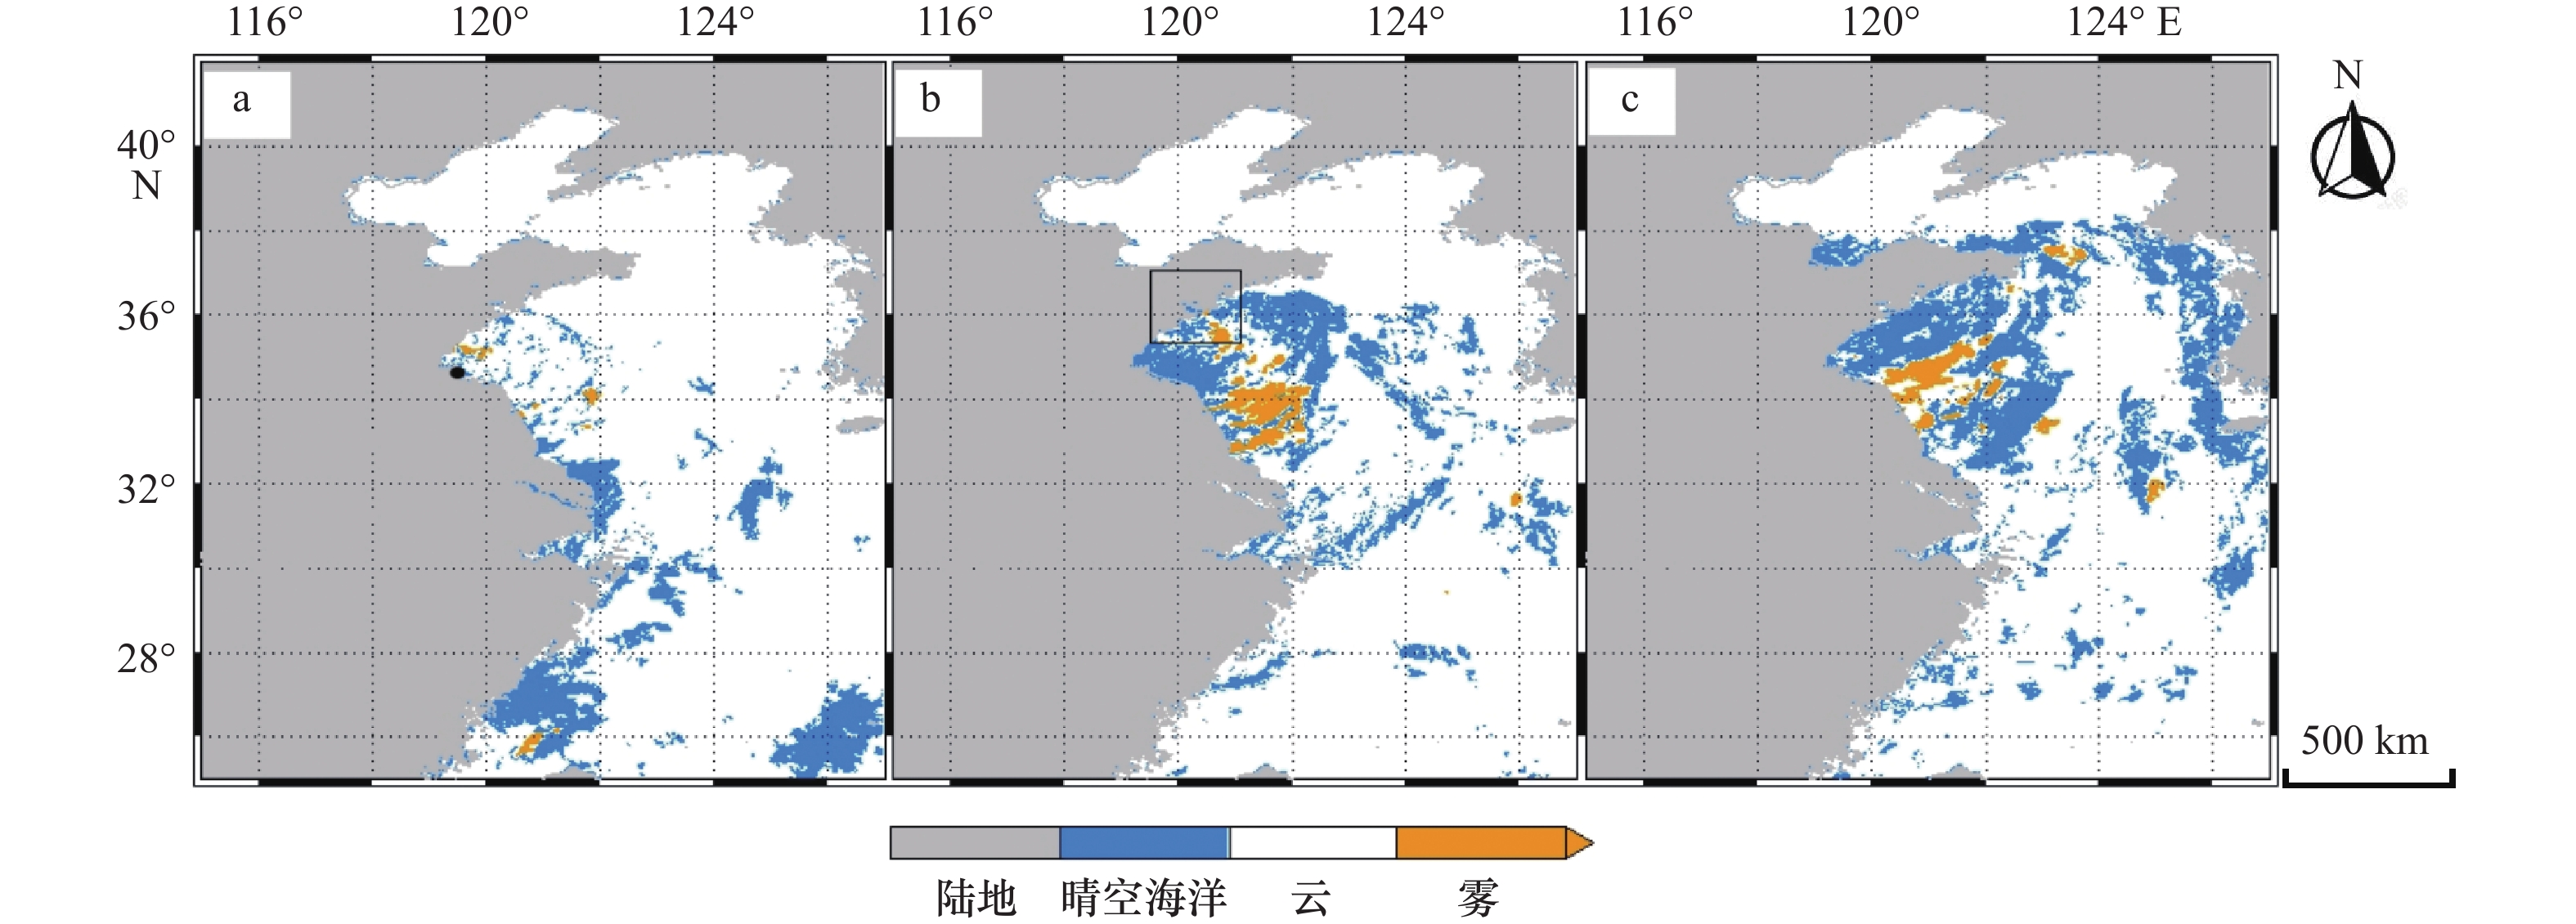
图 3 2019年8月11日18时(a)、20时(b)和22时(c)黄海海雾卫星检测结果
图a中以黑色圆点标注表1中船舶位置;图b中黑色方框所示区域为图2所示范围
Fig. 3 MTSAT satellite images and back calculation at 18:00 (a), 20:00 (b), 22:00 (c) at 11 August 2019
In Figure a, the black circle marks the location of the ship in ICOADS data in Table 1. The black frame in Figure b marks the area shown in Figure 2

图 4 2019年8月11日16:00、20:00和12日00:00青岛地区水平风速(a-c)和相对湿度(d-f)
Fig. 4 Wind speeds (a-c) and relative humidities (d-f) at 16:00, 20:00 in August 11, and 00:00 in August 12, 2019, respectively

图 5 8月11日12:00至12日02:00青岛站、太平角站和大公岛站大气能见度(a)、水平风(b)、相对湿度(c)、气温和浮标站海温(d)、降雨量(e)的时间序列
Fig. 5 The time series of observed atmospheric visibility (a), horizontal winds (b), relative humidity (c), air temperature (d) and precipitation (e) in QD, TPJ and DGD stations every 10 minutes from 12:00 in August 11th to 02:00 in August 12th 2019

图 6 2019年8月11日08:00至12日08:00青岛站探空曲线
Fig. 6 GPS soundings at QD station from 08:00 in August 11th to 02:00 in August 12th, 2019

图 7 2019年8月10日08时至12日20时青岛站探空观测数据计算垂直风切变和静力稳定度(a)、Ri数及相对湿度的时间序列(b)
图a中等值线表示静力稳定度(单位:K·100 m-1),图b中等值线表示Ri数
Fig. 7 The time series of vertical wind shear and static stability (a), relative humidity and Richardson number calculated from GPS sounding data (b) at QD station from 08:00 to 20:00 in August 12, 2019
Contours in figure a represent static stability of atmosphere (unit: K·100 m-1), contours in figure b represent Richardson Number
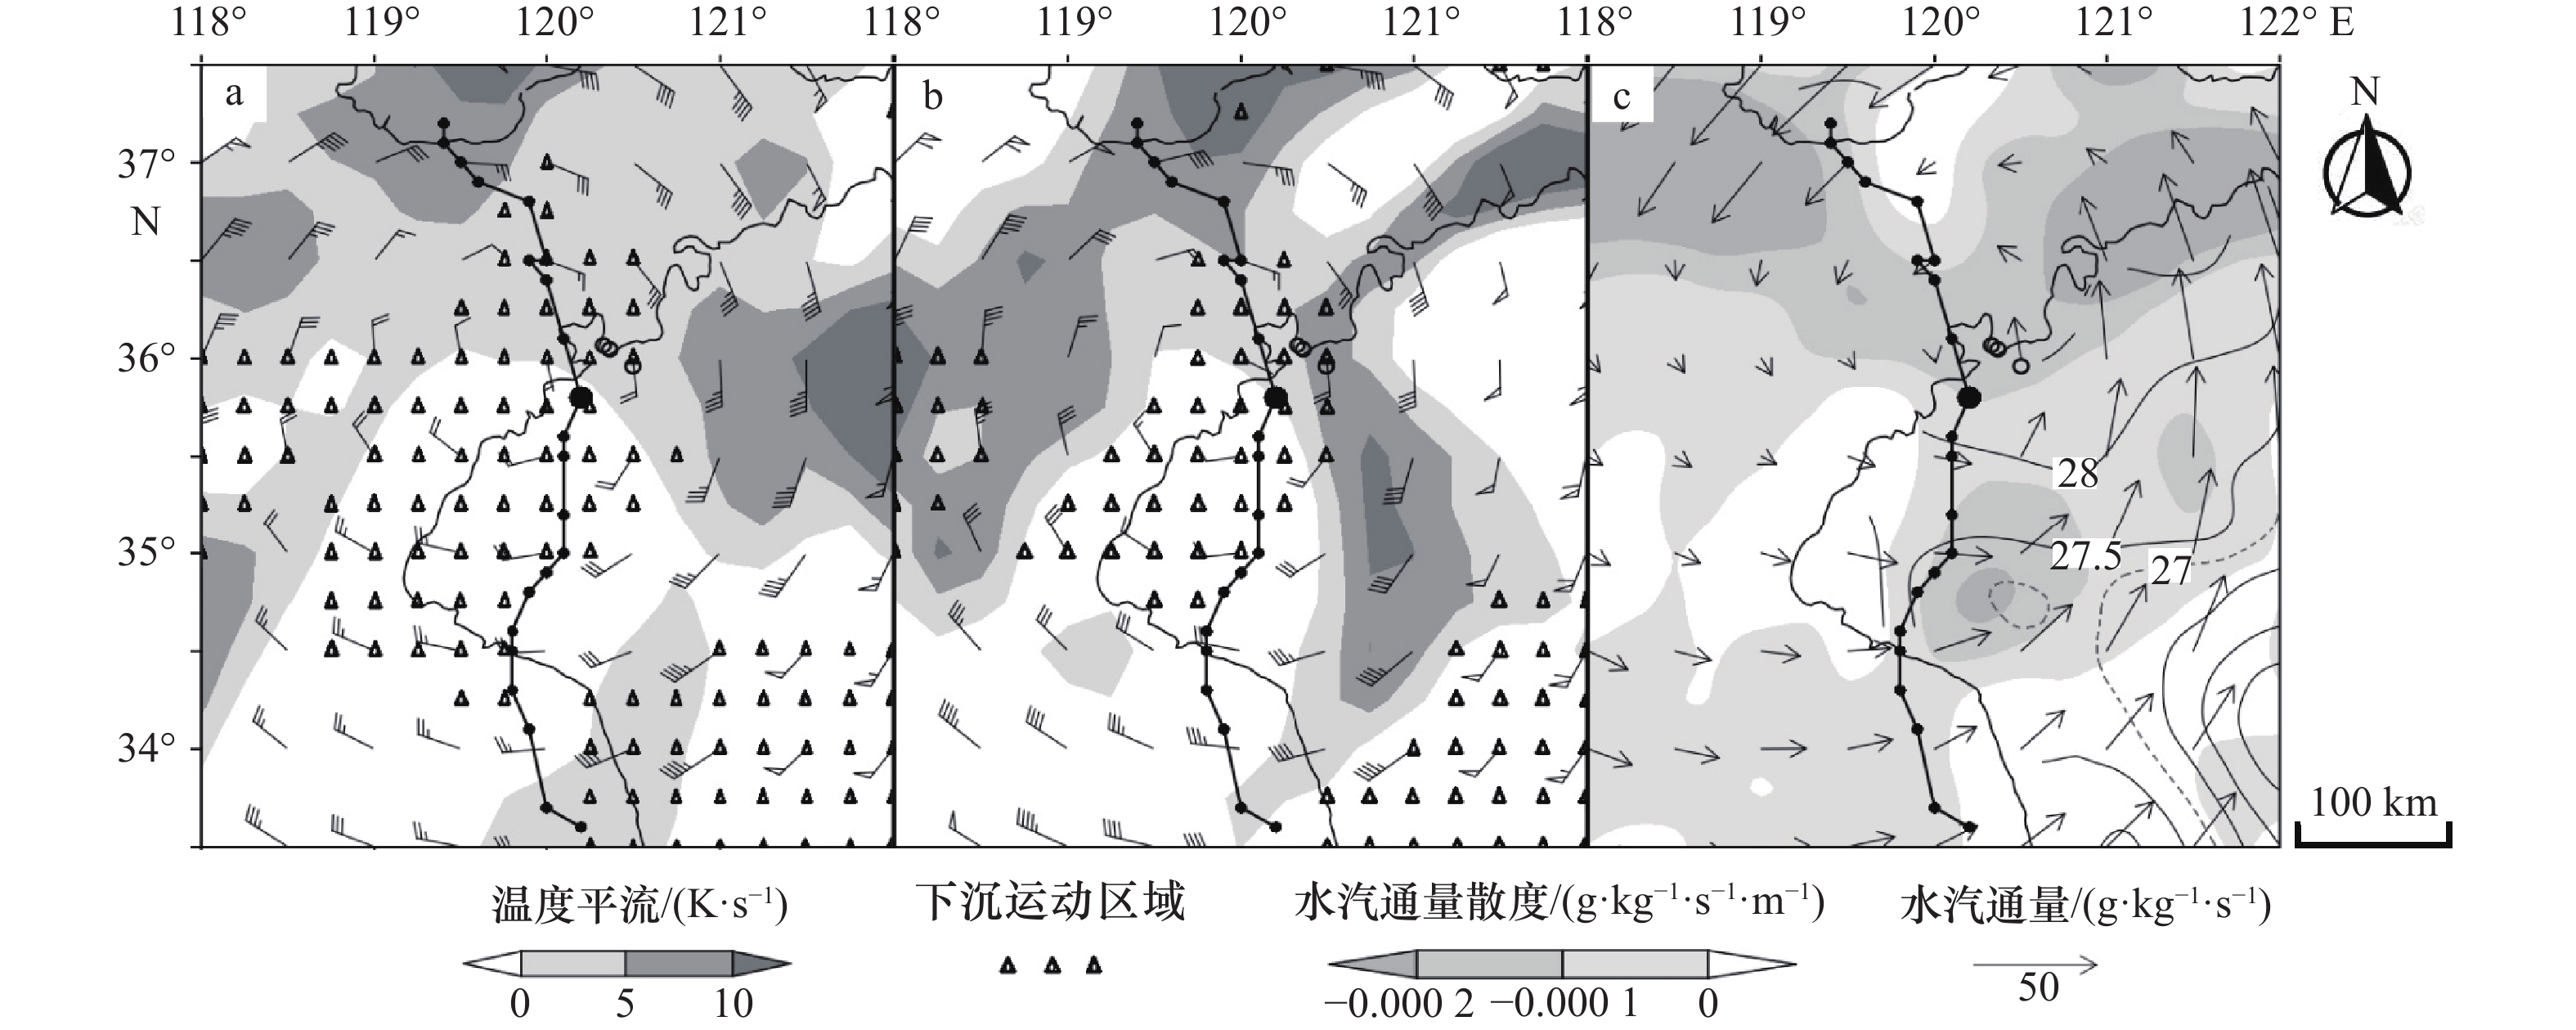
图 8 2019年8月11日20时ERA5再分析850 hPa(a),900 hPa(b)和975 hPa(c)等压面气象要素场
图c中海表面温度(单位℃)以黑色实线标注(27℃等温线以短虚线标注);黑色折线表示11日08:00至12日05:00台风中心移动路径,黑色小圆点表示每小时台风中心位置,11日20:00台风中心位置以黑色大圆点标注,3个黑框空心圆表示青岛站、太平角站、大公岛站位置
Fig. 8 ERA5 reanalysis on 850 hPa (a), 900 hPa (b) and 975 hPa (c) at 20:00 in August 11, 2019
Contours in Figure c represent sea surface temperature (unit:℃ ) (the 27 ℃ isoline marked in red lines), the hourly locations of typhoon center are marked by small black circles from 08:00 in August 11 to 05:00 in August 12, 2019, the big black circle marks the typhoon center at 20:00 in August 11, 2019, the QD, TPJ and DGD stations are marked with black circles
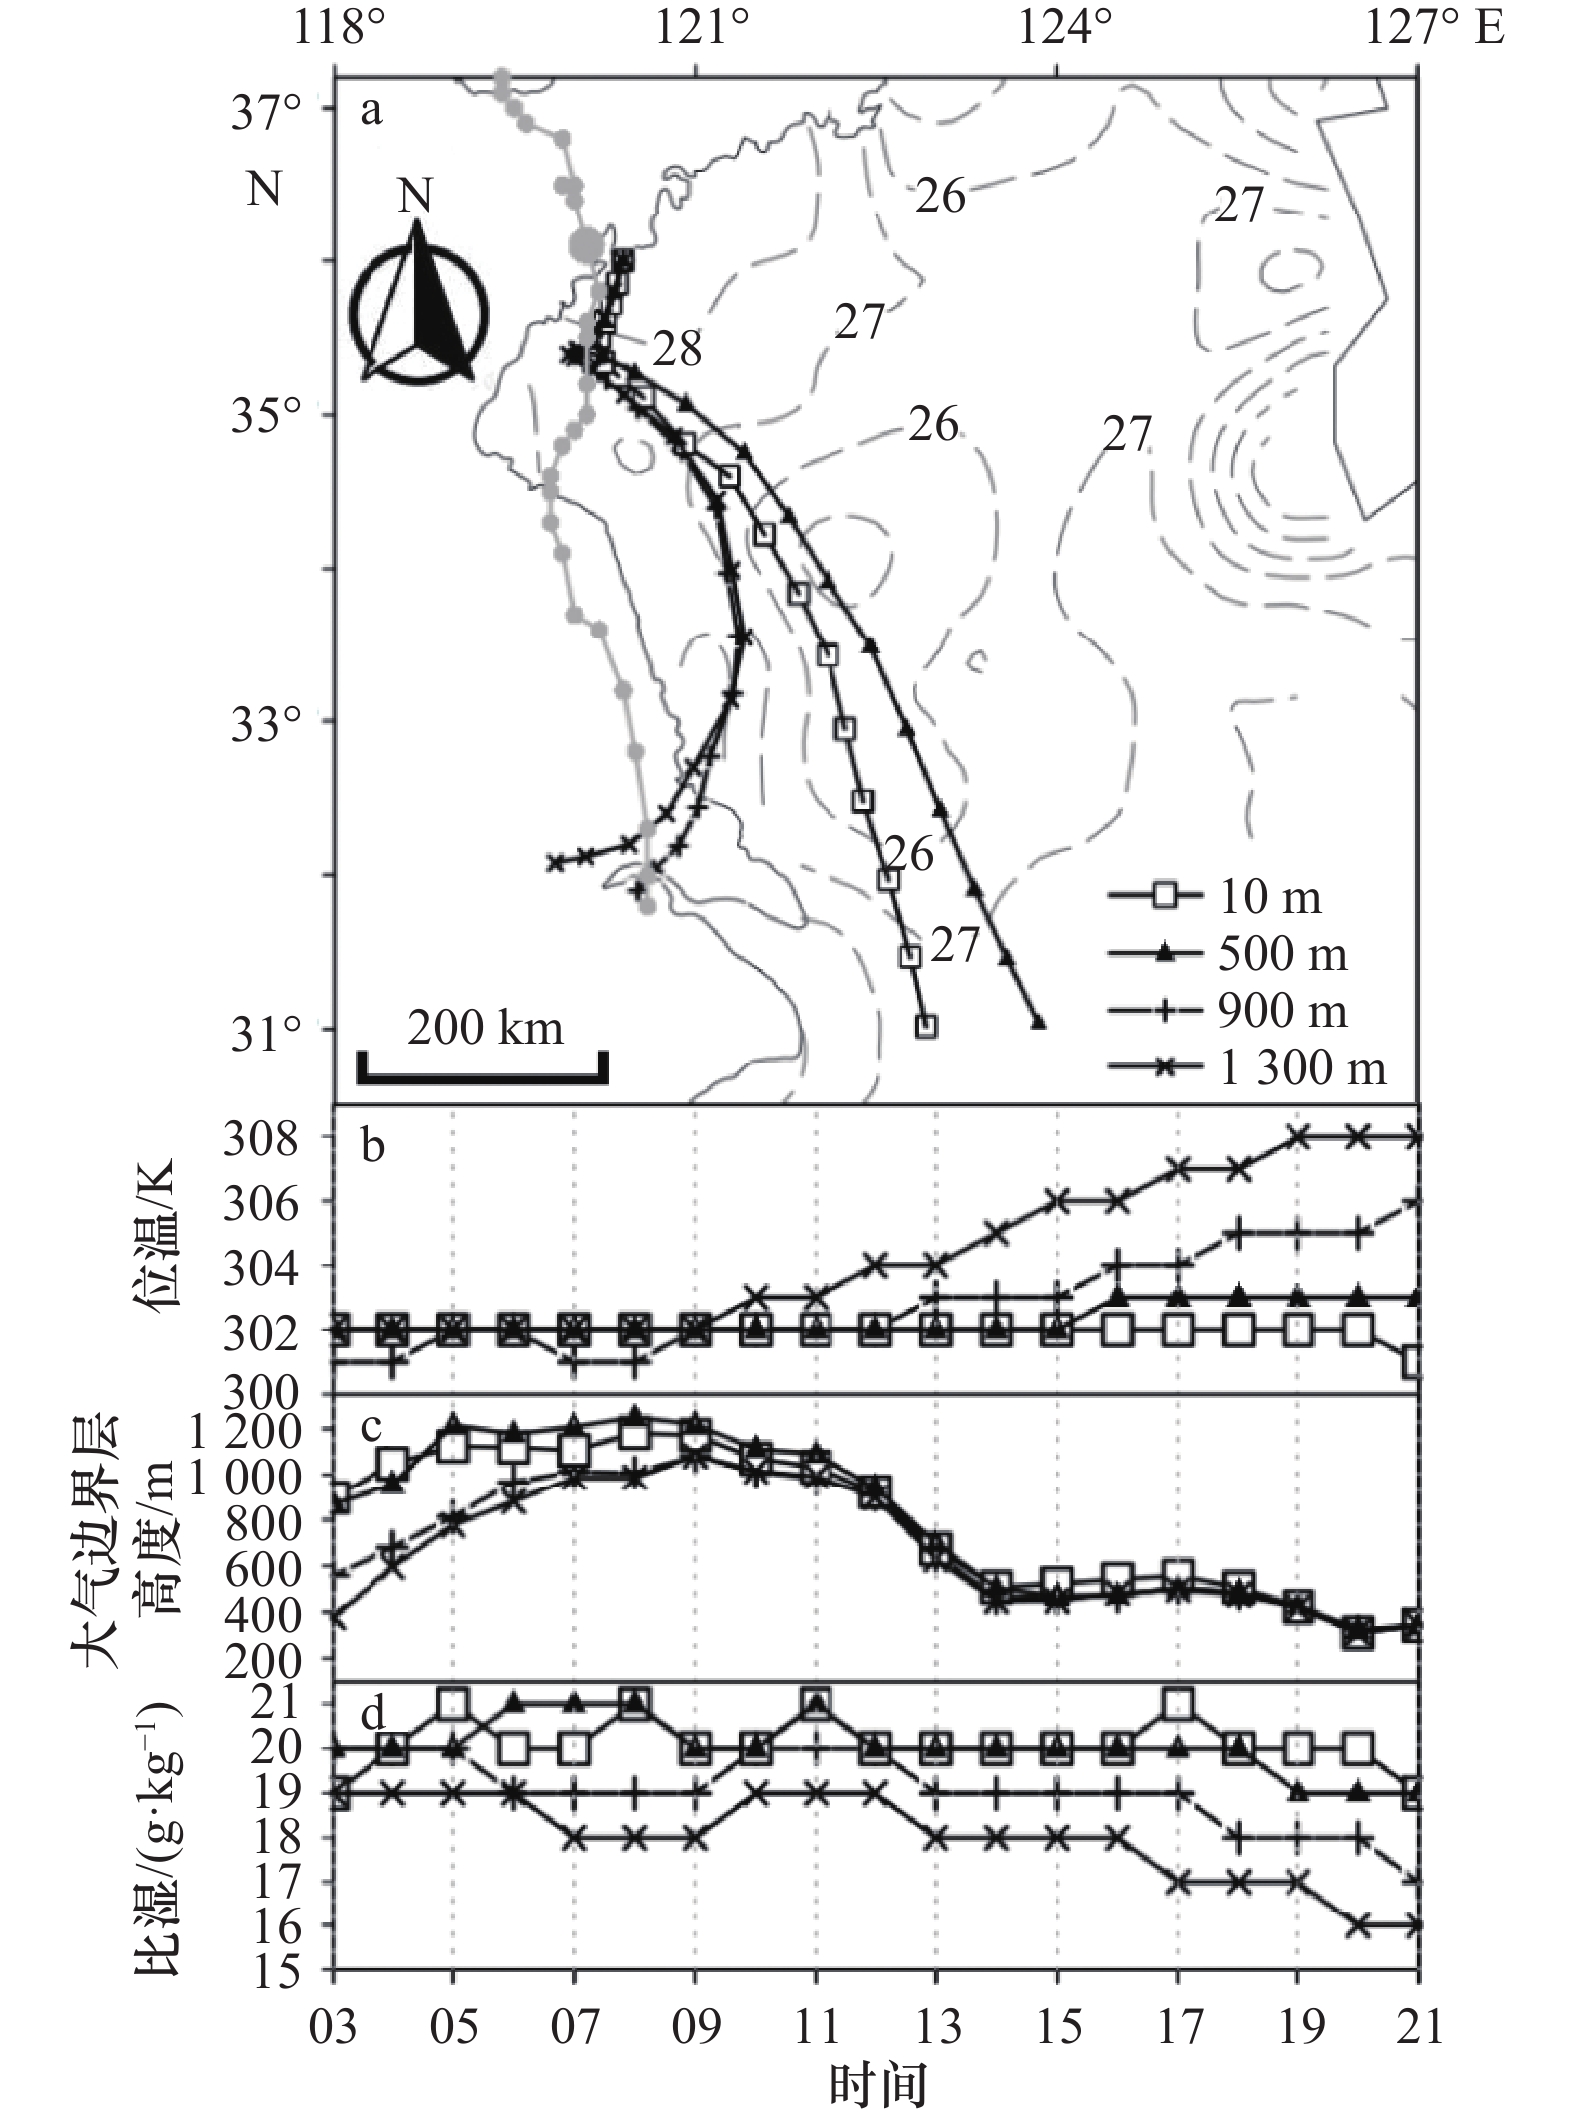
图 9 太平角站不同高度空气微团的后向追踪结果分析,包括空气微团的每小时移动路径(a)、位温(b)、大气边界层高度(c)和比湿(d)
图a中灰色虚线表示11日OISST海温(单位:℃);空气微团移动路径起始时间为11日21:00,追踪时间18个小时,终止时间为11日03:00,每小时空气微团位置以黑色符号标注;空气微团起始高度分别为10 m(□)、500 m(▲)、900 m(╋)和1 300 m(╳),灰色圆点表示11日03:00至12日05:00每小时台风中心位置,11日21:00台风中心位置以灰色大圆点表示
Fig. 9 The trajectories of airflow from different levels at TPJ station, including the hourly track (a), potential temperature (b), atmospheric boundary layer (c) and specific humidity (d)
In Figure a, blue dotted contours represent OISST (unit:℃), symbols represent trajectories of airflow from 10 m (□), 500 m (▲), 900 m (╋) and 1 300 m (╳) from 03:00 to 21:00 in August 11, small gray circles represent the hourly locations of typhoon center from 03:00 to 05:00 in August 12, big gray circle represent the typhoon center at 21:00 in August 11, 2019

图 10 青岛及其近海地区空气微团后向追踪结果的分类统计,包括3类空气微团的平均每小时移动路径(a)、大气边界层高度(b)和比湿(c)
图a中各类空气微团初始区域以虚线边框标注,追踪时间同图9,初始高度为10 m,每小时路径a(□)、路径b(▲)和路径c(╳)的空气微团位置以符号标注,台风中心位置以灰色大圆点表示
Fig. 10 Area synthesis of trajectories in Qingdao and offshore, including the average hourly track (a), atmospheric boundary layer (b) and specific humidity (c) of the airflows in three areas
In Figure a, dotted frame represent initial areas, symbols represent synthetic trajectories of airflows in area a (□), area b (▲), and area c (╳) from 03:00 to 21:00 in August 11, 2019, big gray circle represent the typhoon center
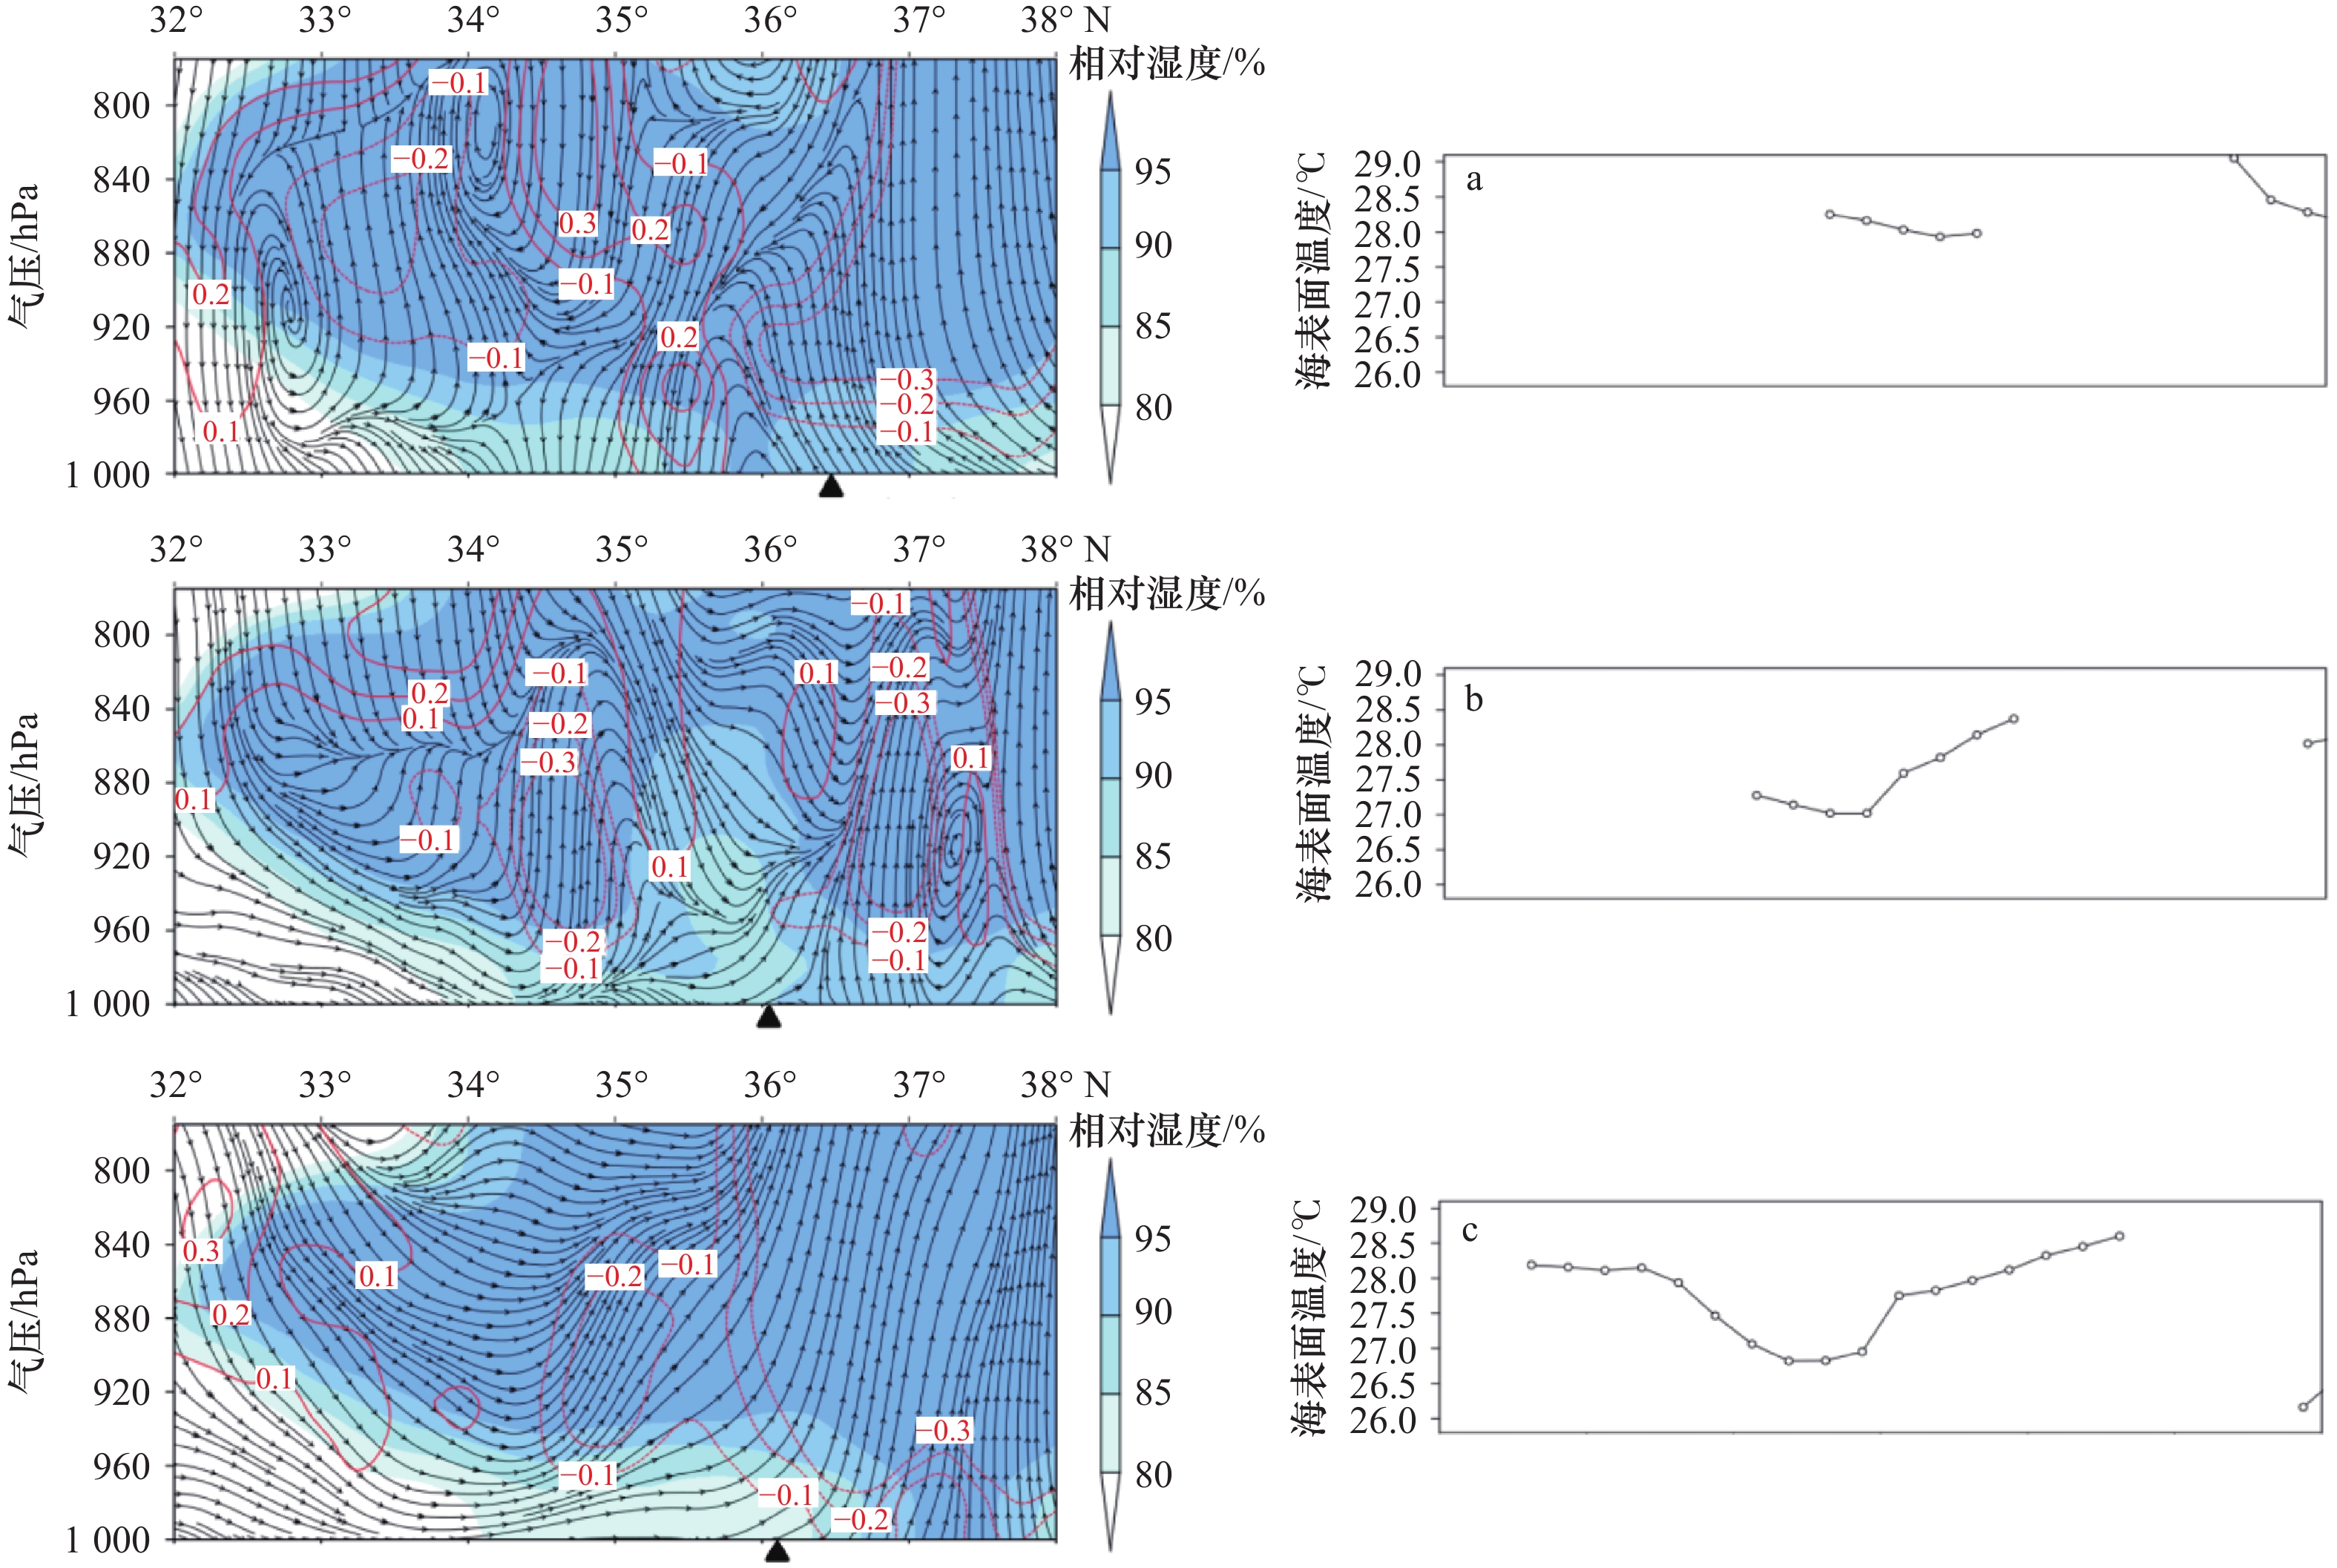
图 11 2019年8月11日20时沿119.5°E(a)、120.25°E(b)和121°E(c)经线的纬度-高度剖面图
各图的上图中,阴影为相对湿度(单位:%),流线为径向风速(单位:m·s-1)和垂直速度(单位: -Pa/(100 s)),红色等值线为绝热下沉项(单位: K/(104 s)),各路径起始位置以标注,此时台风中心位于(35.8°N,120.2°E)。
Fig. 11 The latitude-height profile maps along 119.5°E (a), 120.25°E (b) and 121°E (c) at 20:00 in August 11, 2019
In upper figures, shaded represent relative humidity (unit: %), streamlines represent radial winds (unit: m/s) and vertical velocity (unit: -Pa/(100 s), red contours represent adiabatic sinking term (unit: K/(104 s)), ▲ marks the original position of each trajectory, the typhoon center was in (35.8°N,120.2°E) at 20:00 in August 11, 2019
表 1 文本中使用的各种数据的基本信息
Tab. 1 Basic information about various data used in the present paper
名称 变量 空间分辨率 时间分辨率 地面气象站观测 气温、相对湿度、大气能见度、降水量、10 min平均水平风向风速、降雨量等 / 10 min L波段雷达探空观测 气温、气压、相对湿度、水平风向风速 10 m 每日08时和20时 海洋浮标观测 海温 / 10 min 风廓线加密观测 水平风向风速 10 m 每日02时 ICOADS船舶观测 坐标、时间、水平风向风速、大气能见度、云量、云高、气温、海温、天气现象等 4 任意时间 OISST V2 海温 0.25°×0.25° 日平均 MTSAT-1R云图 亮温 0.05°×0.05° 1 h ERA5再分析数据 气温、相对湿度、比湿、经向和纬向风速、垂直速度 0.25°×0.25°;25 hPa 1 h  下载: 导出CSV
表 2 ICOADS船舶观测数据
Tab. 2 ICOADS ship observations collected in ICOADS data
位置 时间 风向/(°) 风速/(m·s−1) 大气能见度/km 天气现象 气温/℃ 海温/℃ 云量 云高/m 34.7°N 119.4°E 11日16:00 270 11.3 4 连续性中雨 25 25 不明 1 500~2 000 11日17:00 270 9.3 4 连续性中雨 26 26 不明 >2 500 11日18:00 270 7.7 4 间歇性小雨 26 26 不明 >2 500 11日19:00 240 9.8 4 云在增厚 24 22.5 9~10 1 000~1 500 11日20:00 / / 2 云在变薄 24 22.5 9~10 2 000~2 500 11日21:00 240 12.9 2 云在变薄 23 21.5 9~10 2 000~2 500 11日22:00 / / 2 云无变化 23 21.5 9~10 2 000~2 500 11日23:00 / / 2 云无变化 23 21.5 9~10 2 000~2 500 12日00:00 250 7.7 10 云在增厚 23 21.5 2~3 1 000~1 500
下载: 导出CSV
-
[1] 王彬华. 海雾[M]. 北京: 海洋出版社, 1983: 352.Wang B H. Sea Fog[M]. Beijing: China Ocean Press, 1983: 352. (查阅网上资料, 未找到本条文献英文翻译, 请确认) [2] Sun Jianxiang, Huang Huijun, Zhang Suping, et al. How sea fog influences inland visibility on the southern China coast[J]. Atmosphere, 2018, 9(9): 344. doi: 10.3390/atmos9090344 [3] Huang Jian, Chan P W. Progress of marine meteorological observation experiment at Maoming of south China[J]. Journal of Tropical Meteorology, 2011, 17(4): 418−429. [4] Huang Huijun, Liu Hongnian, Huang Jian, et al. Atmospheric boundary layer structure and turbulence during sea fog on the southern China coast[J]. Monthly Weather Review, 2015, 143(5): 1907−1923. doi: 10.1175/MWR-D-14-00207.1 [5] Long Jingchao, Zhang Suping, Chen Yang, et al. Impact of the Pacific-Japan teleconnection pattern on July sea fog over the northwestern Pacific: Interannual variations and global warming effect[J]. Advances in Atmospheric Sciences, 2016, 33(4): 511−521. doi: 10.1007/s00376-015-5097-4 [6] 郝姝馨, 郝增周, 黄海清, 等. 基于Himawari-8数据的夜间海雾识别[J]. 海洋学报, 2021, 43(11): 166−180.Hao Shuxin, Hao Zengzhou, Huang Haiqing, et al. Nighttime sea fog recognition based on Himawari-8 data[J]. Haiyang Xuebao, 2021, 43(11): 166−180. [7] Zhang Suping, Li Man, Meng Xiangui, et al. A comparison study between spring and summer fogs in the yellow sea-observations and mechanisms[J]. Pure and Applied Geophysics, 2012, 169(5): 1001−1017. [8] Huang Jian, Wang Bin, Wang Xin, et al. The spring Yellow Sea fog: synoptic and air-sea characteristics associated with different airflow paths[J]. Acta Oceanologica Sinica, 2018, 37(1): 20−29. doi: 10.1007/s13131-018-1155-y [9] Wang Qian, Zhang Suping, Wang Qi, et al. A fog event off the coast of the Hangzhou bay during Meiyu period in June 2013[J]. Aerosol and Air Quality Research, 2018, 18(1): 91−102. doi: 10.4209/aaqr.2016.11.0489 [10] Lee C Y, Chen S S. Stable boundary layer and its impact on tropical cyclone structure in a coupled atmosphere-ocean model[J]. Monthly Weather Review, 2014, 142(5): 1927−1944. doi: 10.1175/MWR-D-13-00122.1 [11] 吴蒙, 范绍佳, 吴兑. 台风过程珠江三角洲边界层特征及其对空气质量的影响[J]. 中国环境科学, 2013, 33(9): 1569−1576.Wu Meng, Fan Shaojia, Wu Dui. The characteristics of atmospheric boundary layer during tropical cyclone process and its influence on air quality over Pearl River Delta region[J]. China Environmental Science, 2013, 33(9): 1569−1576. [12] Fang G C, Lin S J, Chang S Y, et al. Effect of typhoon on atmospheric particulates in autumn in central Taiwan[J]. Atmospheric Environment, 2009, 43(38): 6039−6048. doi: 10.1016/j.atmosenv.2009.08.033 [13] 高晓梅, 江静, 刘畅, 等. 近67a影响山东台风频数的变化特征及其与若干气候因子的关系[J]. 气象科学, 2018, 38(6): 749−758.Gao Xiaomei, Jiang Jing, Liu Chang, et al. Frequency variation characteristics of typhoons affecting Shandong in recent 67 years and their relationship with several climate factors[J]. Journal of the Meteorological Sciences, 2018, 38(6): 749−758. [14] 马艳, 董海鹰, 郝燕, 等. 登陆青岛的热带气旋及其降水特征分析[J]. 海洋气象学报, 2021, 41(1): 109−118.Ma Yan, Dong Haiying, Hao Yan, et al. Analysis on characteristics of landfalling tropical cyclones and induced precipitation in Qingdao[J]. Journal of Marine Meteorology, 2021, 41(1): 109−118. [15] Stull R B. An Introduction to Boundary Layer Meteorology[M]. Dordrecht: Kluwer Academic Publishers, 1990: 665. [16] 高伟, 李萍, 高珊, 等. 台风“利奇马”对山东省海阳市海滩演化过程的影响[J]. 海洋学报, 2020, 42(11): 88−99.Gao Wei, Li Ping, Gao Shan, et al. Response process of the Haiyang Beach evolution to Typhoon Lekima in Shandong province[J]. Haiyang Xuebao, 2020, 42(11): 88−99. [17] Ding Yifan, Liu Jiping, Chen Shengzhe, et al. Uniqueness of Lekima compared to tropical cyclones landed in the east coast of China during 1979–2019[J]. Acta Oceanologica Sinica, 2020, 39(8): 121−124. doi: 10.1007/s13131-020-1639-4 [18] 黄辉军, 黄健, 刘春霞, 等. 茂名地区海雾的微物理结构特征[J]. 海洋学报, 2009, 31(2): 17−23.Huang Huijun, Huang Jian, Liu Chunxia, et al. Microphysical characteristics of the sea fog in Maoming area[J]. Haiyang Xuebao, 2009, 31(2): 17−23. [19] 张苏平, 任兆鹏. 下垫面热力作用对黄海春季海雾的影响——观测与数值试验[J]. 气象学报, 2010, 68(4): 439−449.Zhang Suping, Ren Zhaopeng. The influence of the thermal effect of underlaying surface on the spring sea fog over the Yellow Sea: Observations and numerical simulations[J]. Acta Meteorologica Sinica, 2010, 68(4): 439−449. [20] 黄健, 王斌, 周发琇, 等. 华南沿海暖海雾过程中的湍流热量交换特征[J]. 大气科学, 2010, 34(4): 715−725. doi: 10.3878/j.issn.1006-9895.2010.04.05Huang Jian, Wang Bin, Zhou Faxiu, et al. Turbulent heat exchange in a warm sea fog event on the coast of South China[J]. Chinese Journal of Atmospheric Sciences, 2010, 34(4): 715−725. doi: 10.3878/j.issn.1006-9895.2010.04.05 [21] 张苏平, 龙景超, 尹跃进, 等. 我国东部沿海一次局地海雾抬升成云过程分析[J]. 中国海洋大学学报, 2014, 44(2): 1−10.Zhang Suping, Long Jingchao, Yin Yuejin, et al. Analysis of the process of a local sea fog lifted into low cloud in eastern China[J]. Periodical of Ocean University of China, 2014, 44(2): 1−10. [22] Davis C, Wang Wei, Chen S S, et al. Prediction of landfalling hurricanes with the advanced hurricane WRF model[J]. Monthly Weather Review, 2008, 136(6): 1990−2005. doi: 10.1175/2007MWR2085.1 [23] Lin I I, Liu W T, Wu C C, et al. Satellite observations of modulation of surface winds by typhoon-induced upper ocean cooling[J]. Geophysical Research Letters, 2003, 30(3): 1131. doi: 10.1029/2002GL015674 [24] 饶晨泓, 毕鑫鑫, 陈光华, 等. 近海台风对“21·7”河南极端暴雨过程水汽通量和动、热力条件影响的模拟[J]. 大气科学, 2022, 46(6): 1577−1594.Rao Chenhong, Bi Xinxin, Chen Guanghua, et al. A Numerical simulation on the impacts of the offshore typhoons on water vapor flux, dynamic and thermal conditions of the extreme rainstorm event in Henan Province in July 2021[J]. Chinese Journal of Atmospheric Sciences, 2022, 46(6): 1577−1594. [25] Yang Liu, Liu Jingwu, Ren Zhaopeng, et al. Atmospheric conditions for advection-radiation fog over the western yellow sea[J]. Journal of Geophysical Research:Atmospheres, 2018, 123(10): 5455−5468. doi: 10.1029/2017JD028088 -

 点击查看大图
计量
- 文章访问数: 169
- HTML全文浏览量: 101
- PDF下载量: 58
- 被引次数: 0
