

Comparison of extreme wind speeds predicted by Monte-Carlo simulation and empirical track model
-
摘要: 台风是我国东南沿海区域每年发生的严重自然灾害之一。本文分别采用传统的Monte-Carlo模拟方法以及较为先进的经验路径模拟方法预测中国东南沿海区域台风的极值风速(10 m高度处10 min平均值),并对两种方法的预测结果进行了对比。本文将东南海岸线向内陆扩展约200 km的区域划分为0.25°×0.25°的网格,以每个网格点作为研究点。首先采用Monte-Carlo模拟方法产生每个研究点1 000年间的虚拟台风事件。然后采用经验路径模型方法构建了西北太平洋1 000年的热带气旋事件集,采用模拟圆方法从中提取对各个研究站点有影响的台风事件。接着采用Yan Meng风场模型计算每个研究点台风的最大风速,构成极值风速序列。最后采用极值分布模型预测每个研究点不同重现期的极值风速,并对两种不同方法预测的结果进行了对比。研究发现在研究区域的内陆侧经验路径方法预测的风速略高于Monte-Carlo模拟方法预测的结果,而在海岸沿线一带经验路径方法预测的结果略低,这主要是由两种方法构造的虚拟台风的中心压强存在差异以及模型本身的不确定性造成的。本文的研究结果可以为防灾减灾系统提供有益的参考。
-
关键词:
- 台风 /
- Monte-Carlo模拟 /
- 经验路径模型 /
- 风场模型 /
- 极值风速
Abstract: Typhoon is one of the most serious natural disasters in southeast coastal region of China. In this paper, the traditional Monte-Carlo simulation and the advanced empirical track model are respectively used to predict the extreme wind speed (10-min mean at 10 m height) of typhoons in the southeast coastal region of China, and the prediction results of two methods are compared. An area extending 200 km inland from the coastline is divided into 0.25°×0.25° grid cells and each grid is taken as the research point. Firstly, the Monte-Carlo method is used to generate virtual typhoons of 1 000-year for each research point. Then, we use the empirical track model to construct virtual typhoons of 1 000-year in the Northwest Pacific Ocean, from which typhoon events affecting each research site are extracted by using the simulation circle method. Next, the Yan Meng wind field model is used to calculate the wind speed of the extracted typhoons, from which samples of maximum wind speed can be derived. Finally, the extreme wind speed of different return periods for each research point is predicted by the extreme value distribution. Through comparison, we find that in some inland areas, the predicted wind speeds by empirical track model are slightly higher than those by Monte-Carlo method, and in most coastal areas the opposite is true. This is mainly caused by the difference of the central pressure of the virtual typhoons constructed by two methods and the uncertainty of the model itself. The research results of this paper can provide useful reference for the disaster prevention and mitigation system.-
Key words:
- typhoon /
- Monte-Carlo simulation /
- empirical track model /
- wind field model /
- extreme wind speed
-

图 2 CMA数据中台风的起始点以及西北太平洋区域5°×5°的网格
Fig. 2 Spatial distribution of genesis based on the CMA best-track dataset and the grid cell of 5°×5° in the Northwest Pacific Ocean

图 3 观测的台风初始移动速度(a)与移动方向(b)的概率分布拟合
Fig. 3 Modeled and observed statistical distributions of translation speed (a) and storm heading (b)

图 4 对于东向与西向运动的台风拟合的公式(11)中的系数ai和εc的分布
Fig. 4 Illustration of regression coefficients ai and εc in Eq.(11) for easterly and westerly headed storms
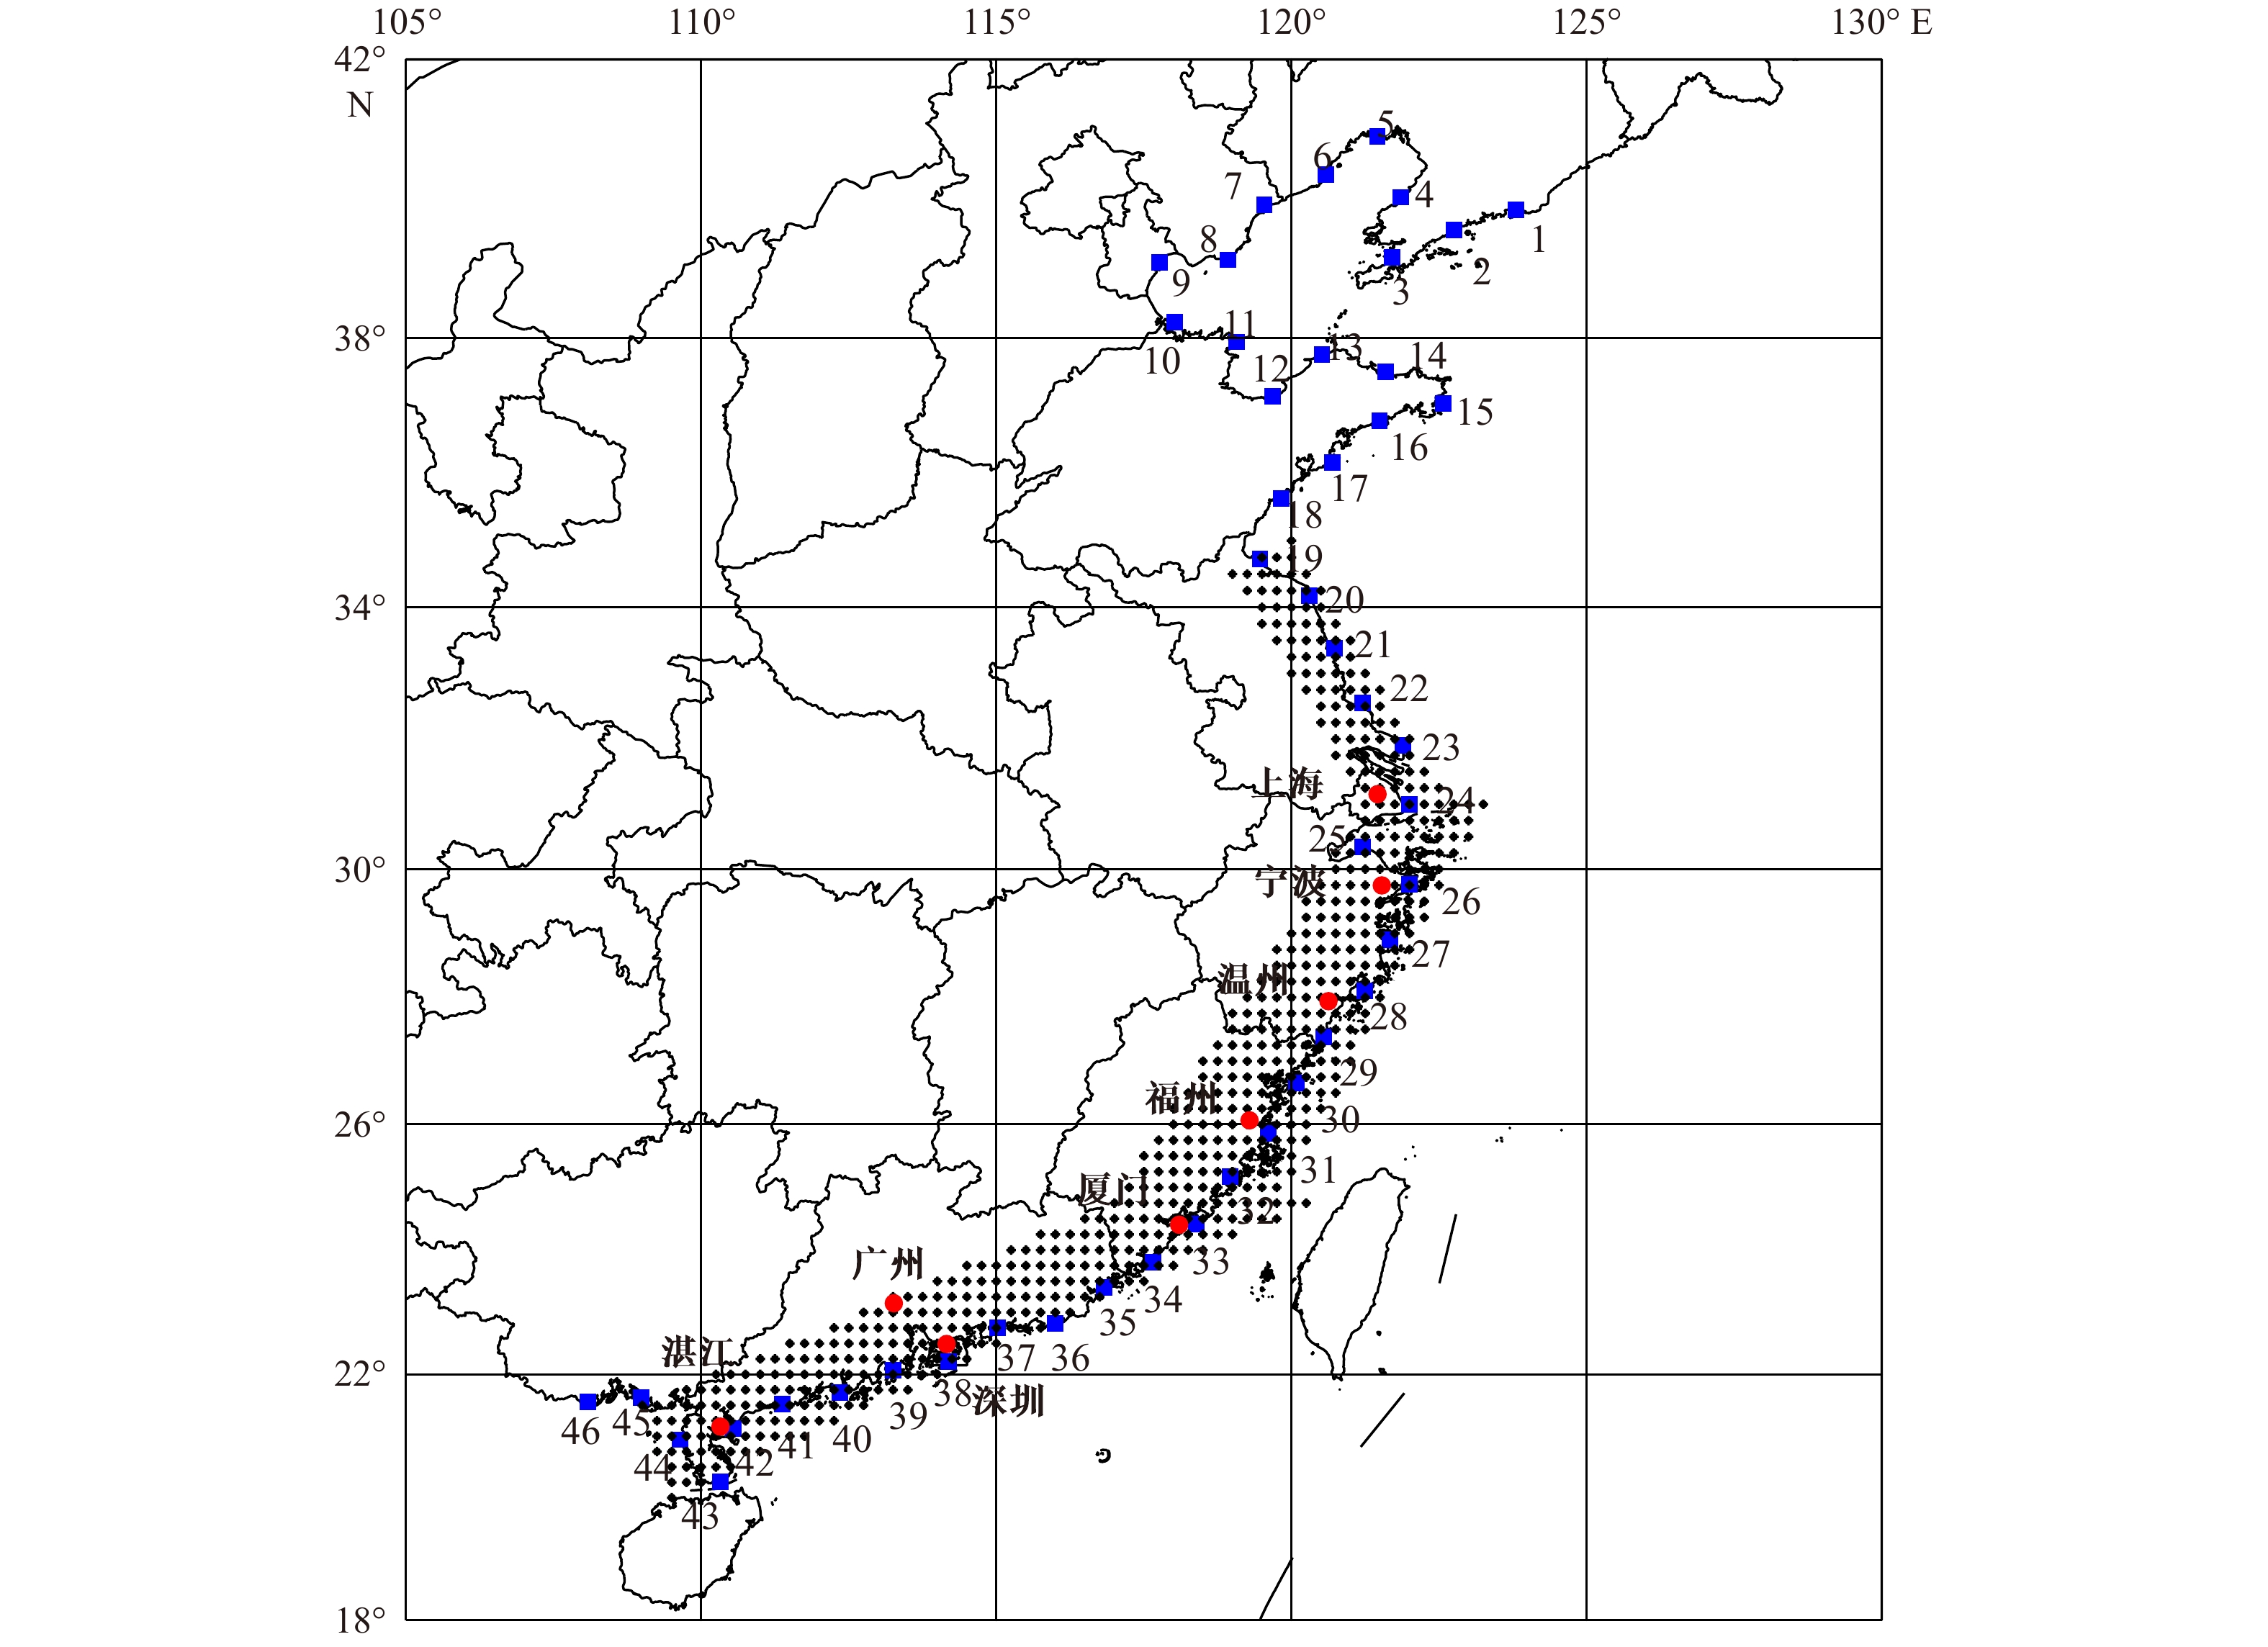
图 5 研究站点(黑色星号)、用于验证经验路径模型的站点(蓝色方框)以及8个沿岸城市(红点)的位置分布
Fig. 5 Locations of research points (black asterisks), stations for validation of empirical track model (blue squares) and 8 coastal cities (red dots)

图 6 沿岸46个站点虚拟与观测的台风关键参数的对比
Fig. 6 Comparison of key parameters of simulated and observed typhoons at 46 coastal stations
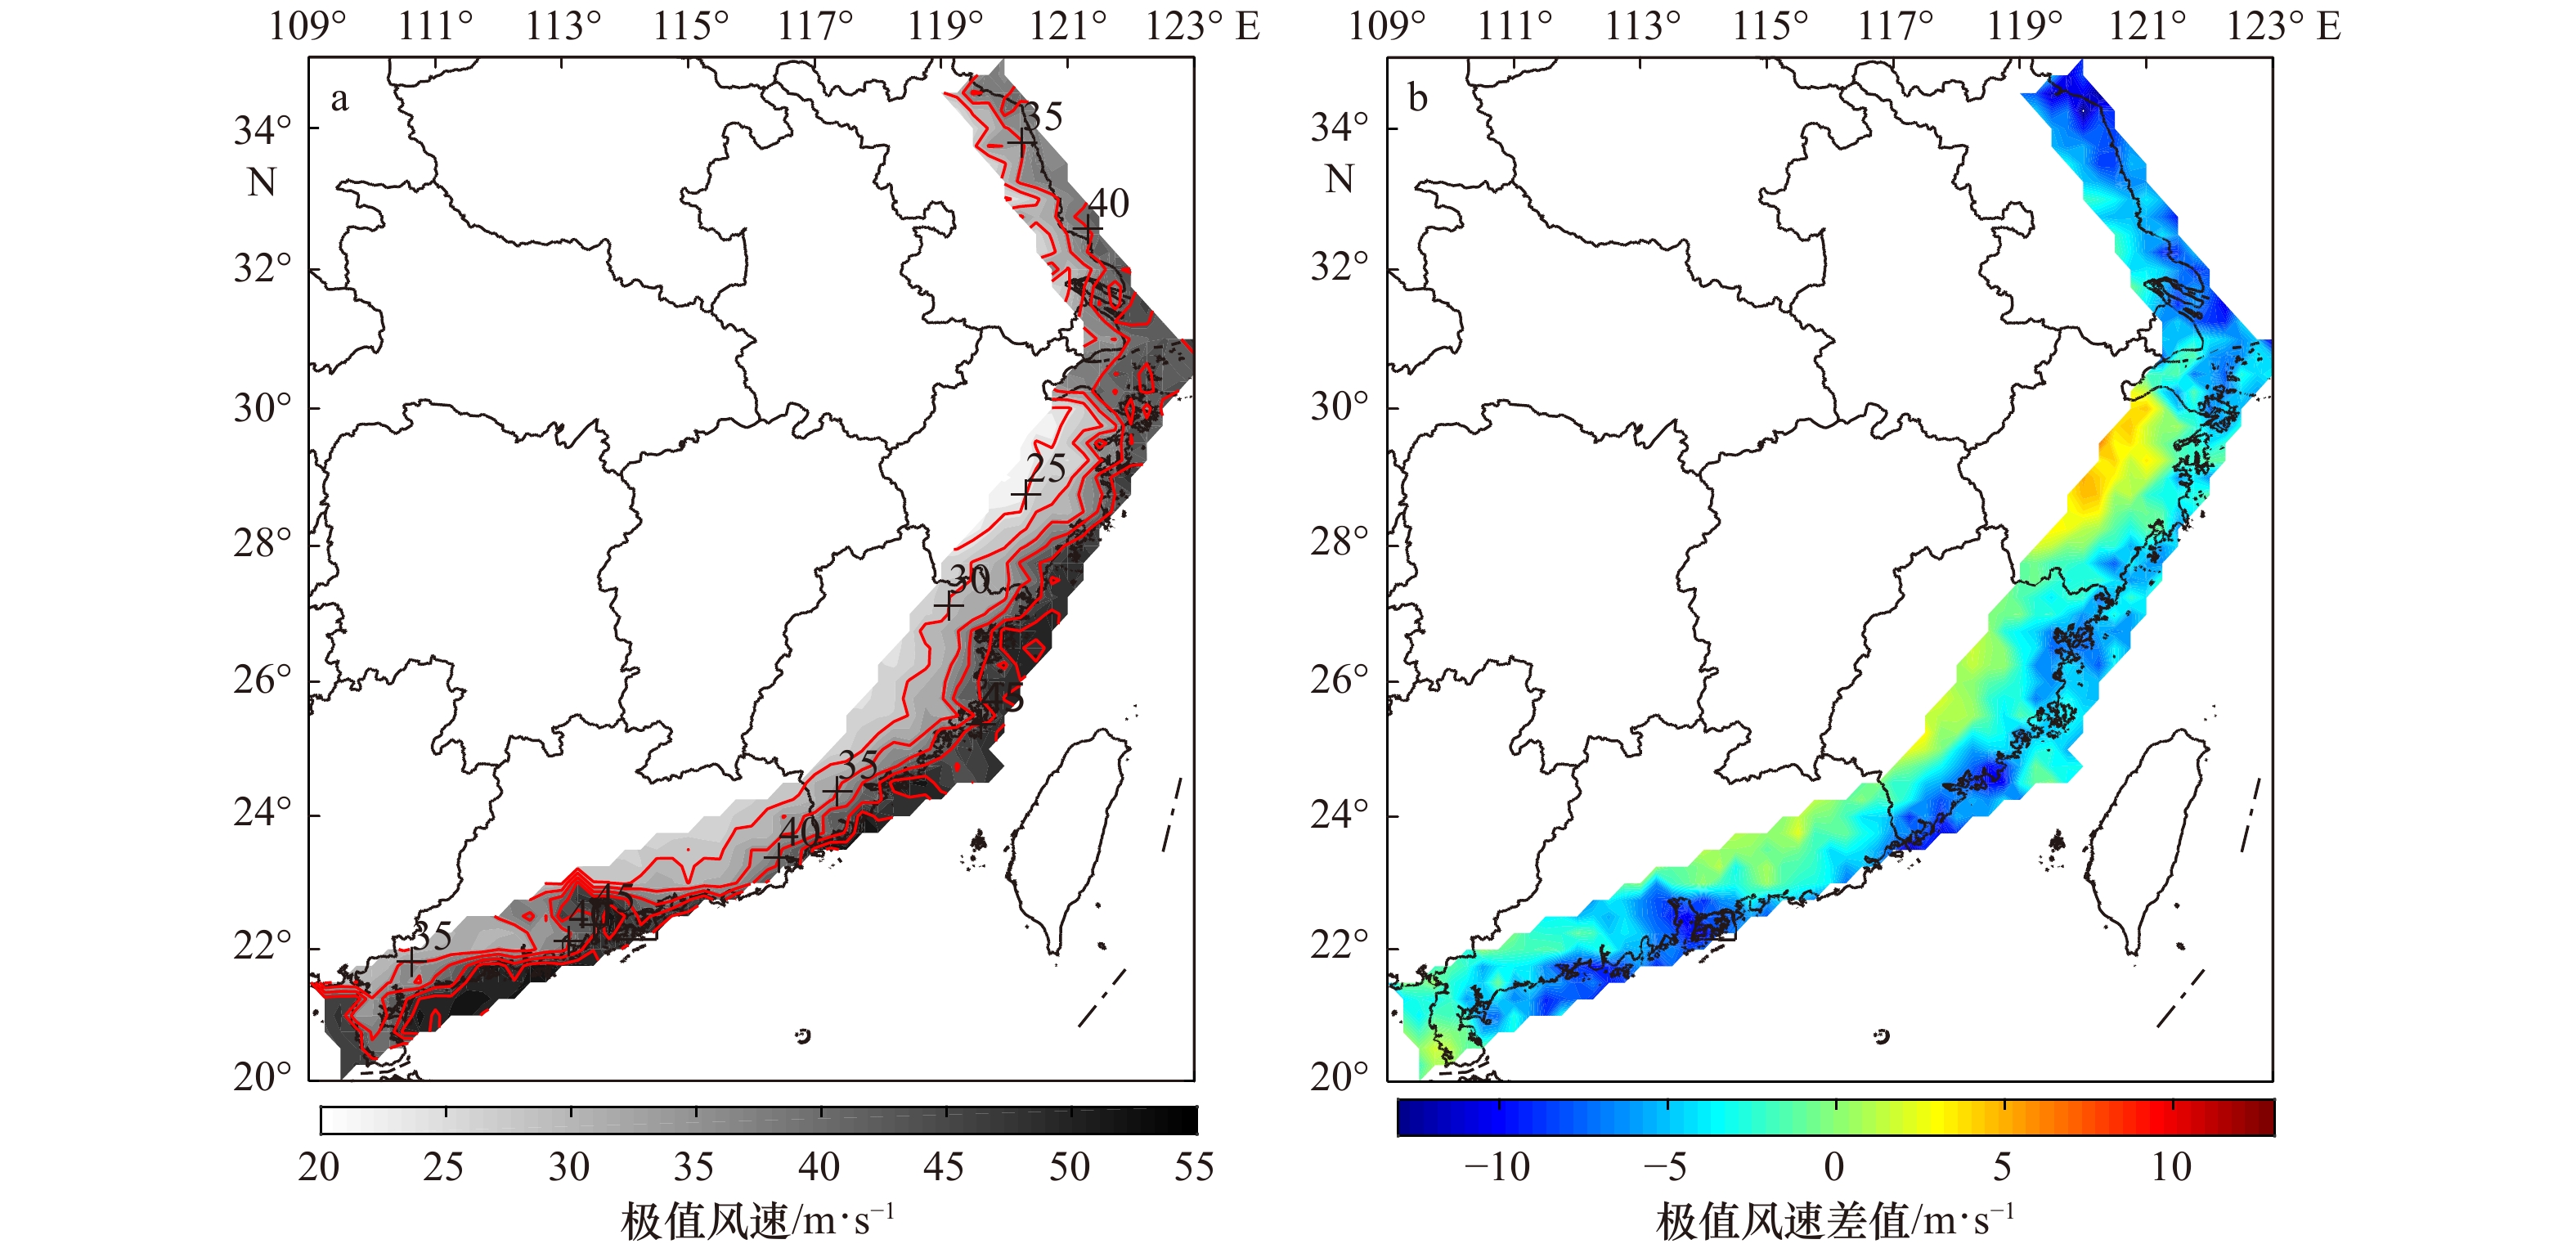
图 9 采用Monte-Carlo方法以及经验分布预测的50年重现期的极值风速(a)以及经验路径方法与Monte-Carlo方法预测结果的差值(b)
Fig. 9 Extreme wind speeds for 50-year return period by Monte-Carlo simulation and empirical distribution (a) and the wind speed difference between empirical track model and Monte-Carlo simulation (b)

图 10 采用Monte-Carlo方法以及经验分布预测的100年重现期的极值风速(a)以及经验路径方法与Monte-Carlo方法预测结果的差值(b)
Fig. 10 Extreme wind speeds for 100-year return period by Monte-Carlo simulation and empirical distribution (a) and the wind speed difference between empirical track model and Monte-Carlo simulation (b)
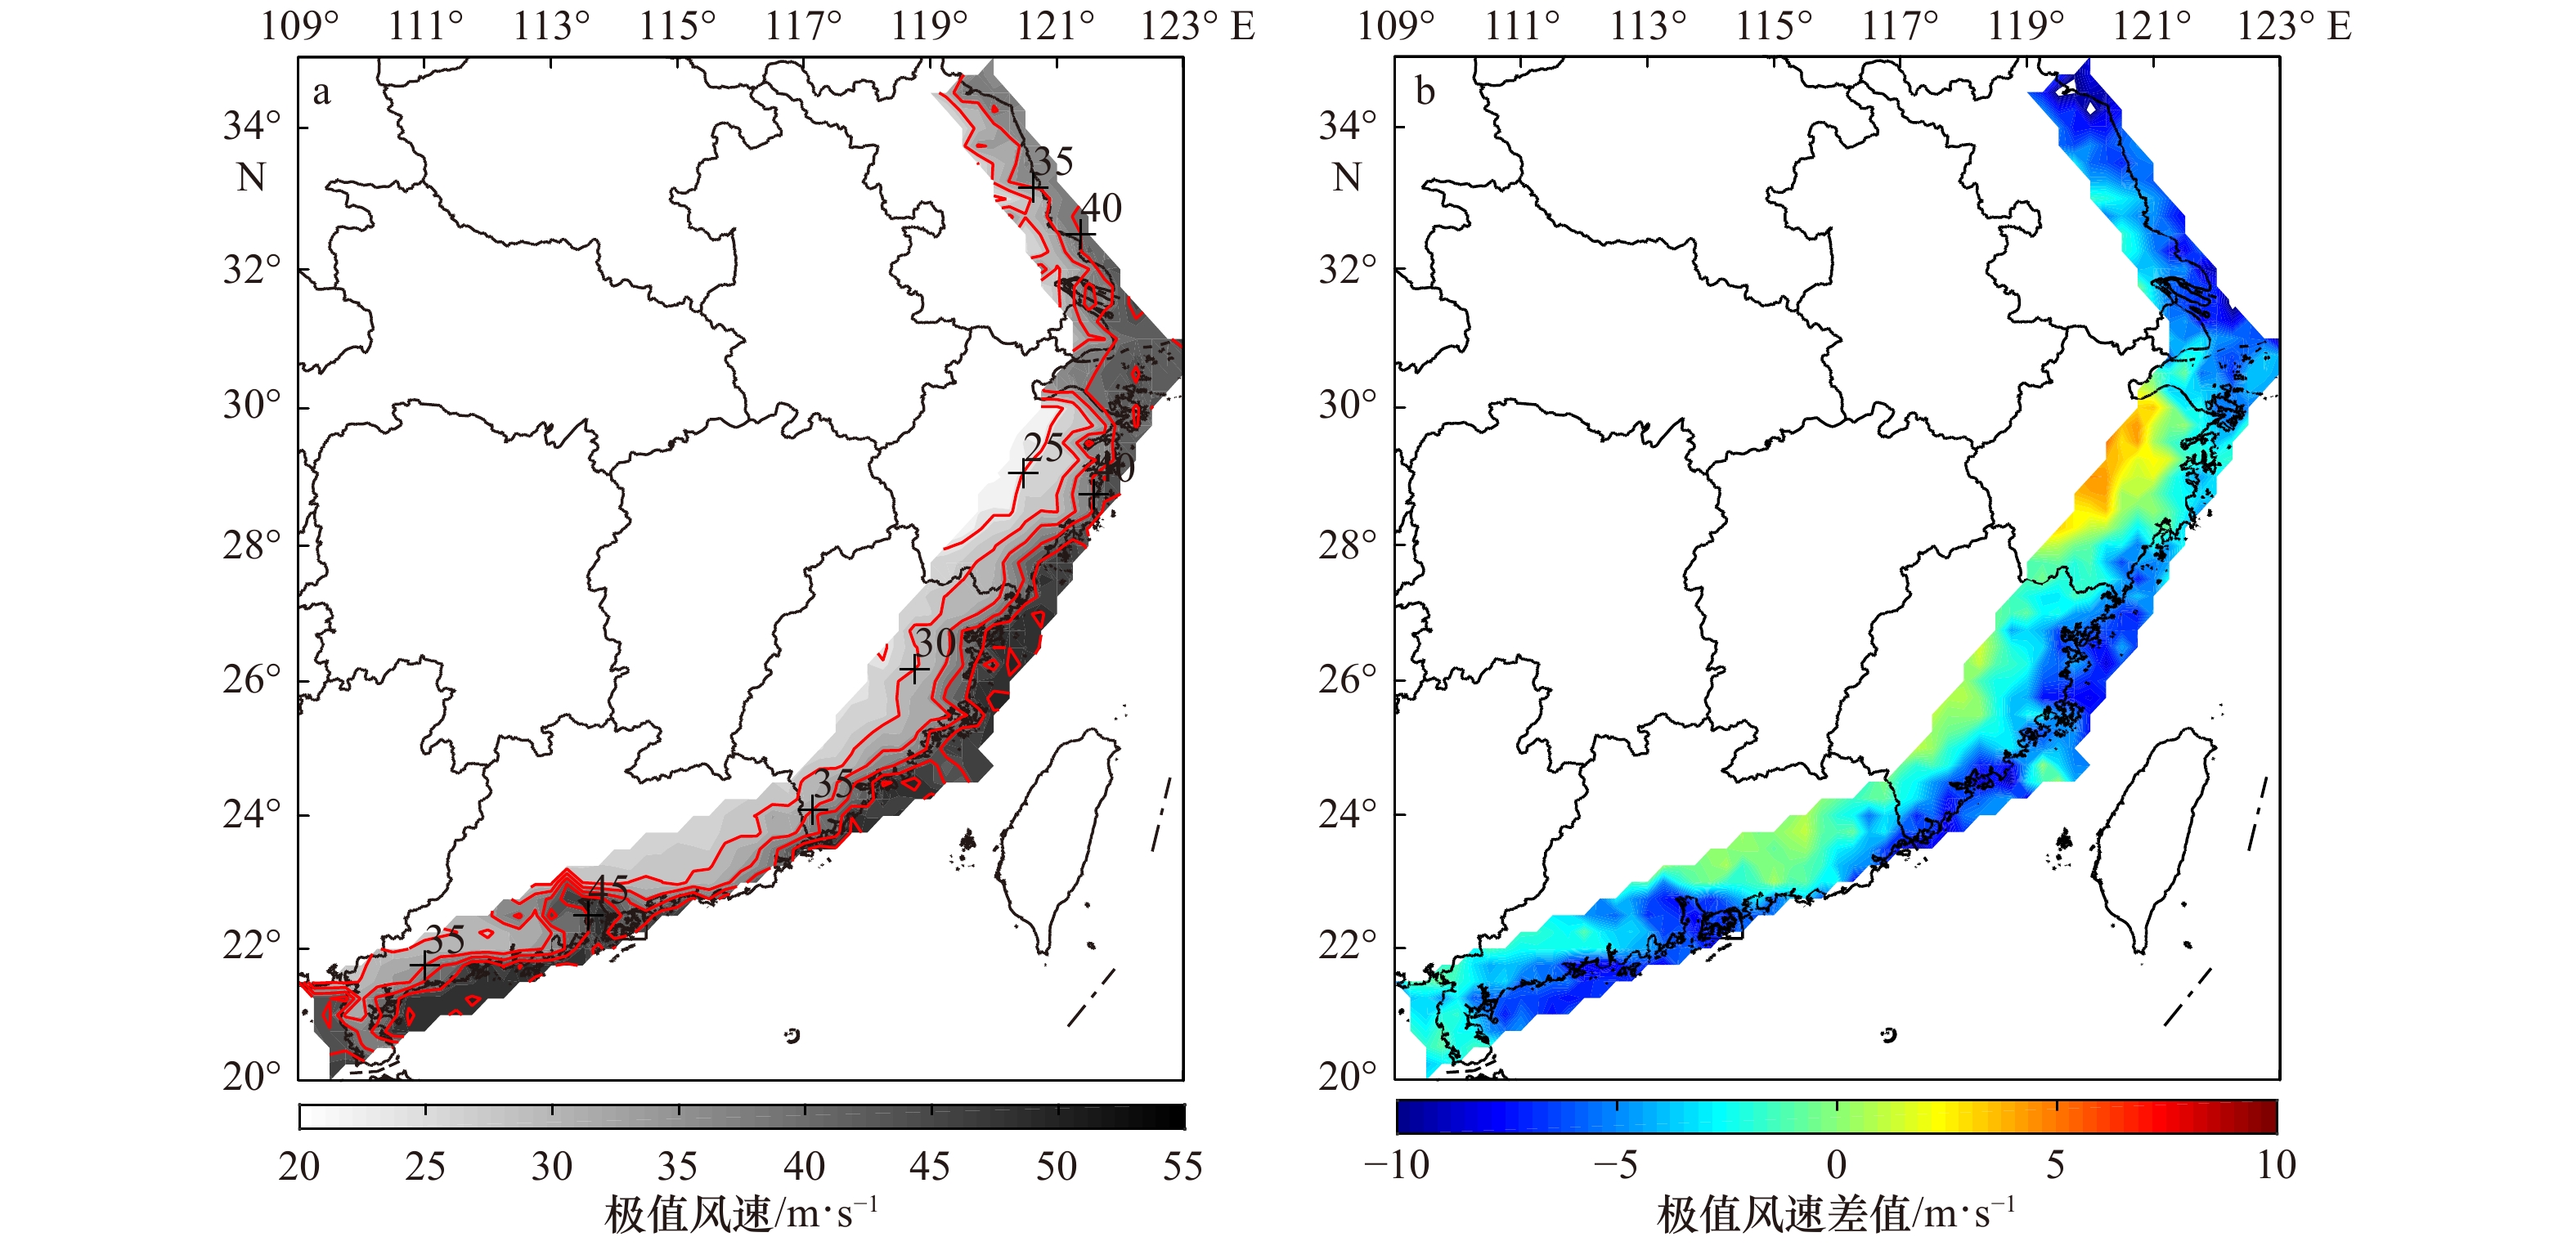
图 11 采用Monte-Carlo方法以及威布尔分布预测的50年重现期的极值风速(a)以及经验路径方法与Monte-Carlo方法预测结果的差值(b)
Fig. 11 Extreme wind speeds for 50-year return period by Monte-Carlo simulation and Weibull distribution (a) and the wind speed difference between empirical track model and Monte-Carlo simulation (b)
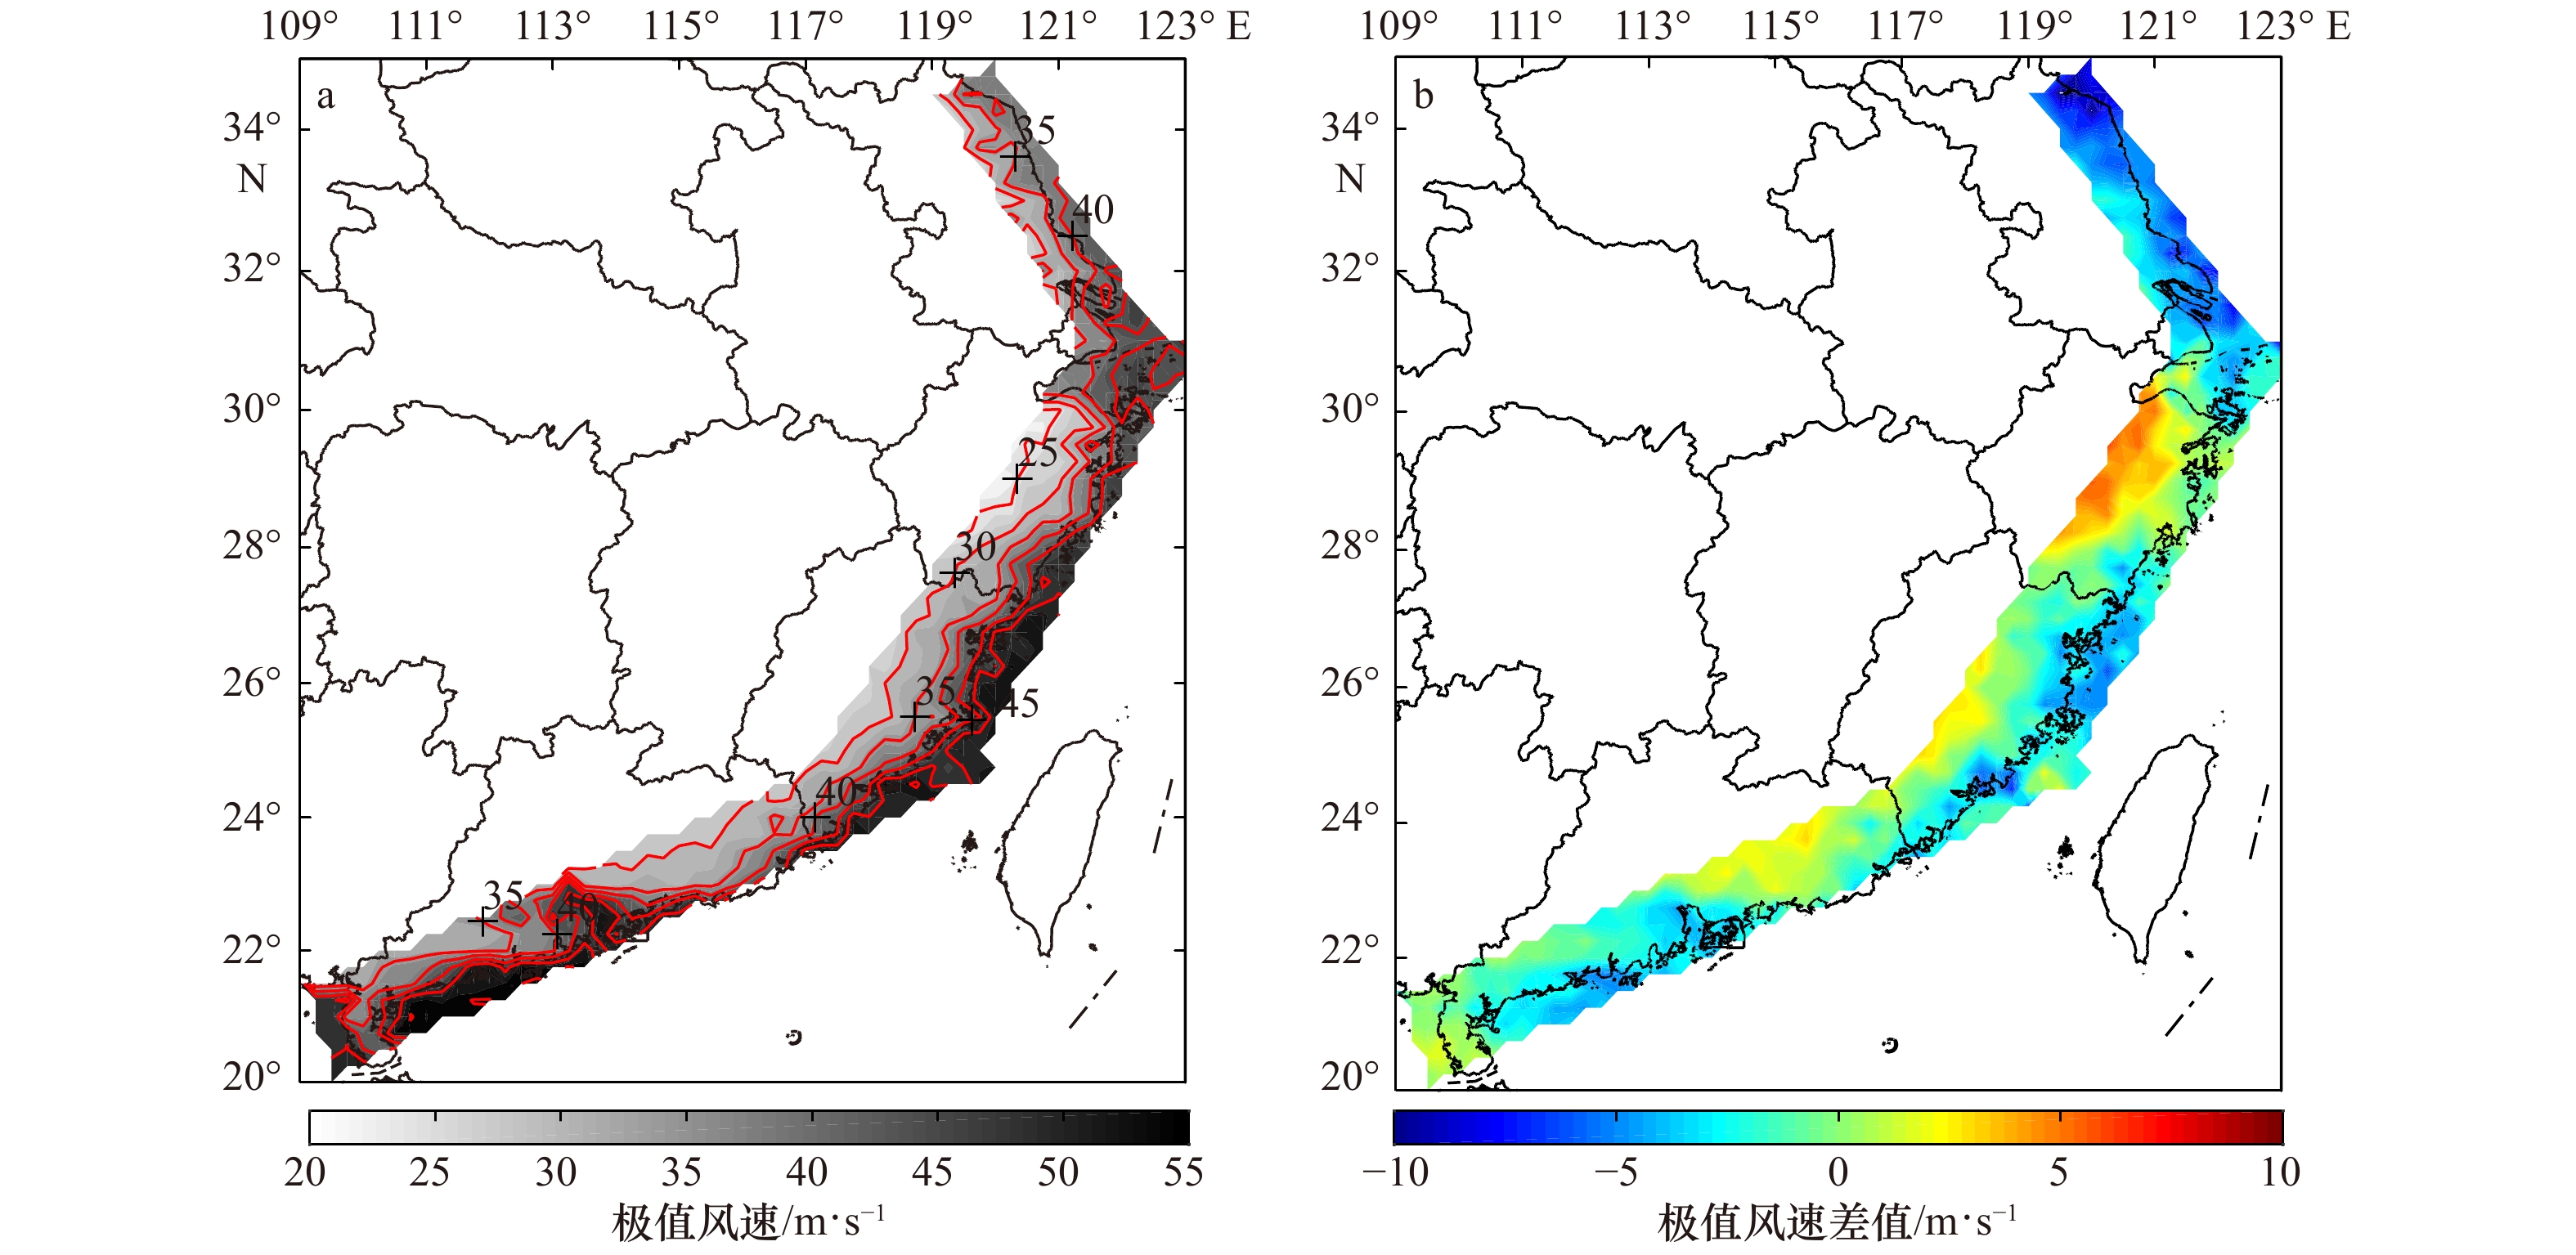
图 12 采用Monte-Carlo方法以及耿贝尔分布预测的50年重现期的极值风速(a)以及经验路径方法与Monte-Carlo方法预测结果的差值(b)
Fig. 12 Extreme wind speeds for 50-year return period by Monte-Carlo simulation and Gumbel distribution (a) and the wind speed difference between empirical track model and Monte-Carlo simulation (b)

图 13 采用Monte-Carlo方法以及经验路径方法得到的579个研究站点的中心压差的平均值的差值(a)以及图13a与 图9b正负号一致的站点(红点)与不一致的站点(蓝点)(b)
Fig. 13 The difference of the mean value of the central pressure difference for 579 research stations between Monte-Carlo simulation and empirical track method (a), and stations with the same (red dots) and different (blue dots) signs in Fig.13a and Fig.9b (b)
表 1 不同地形地貌的粗糙度
Tab. 1 Roughness length of different geomorphology
地形等级 下垫面特征 粗糙度/m I 海面、泥滩、冰雪覆盖的平原,
无障碍海岸地区等0.000 5~0.003 II 平坦开阔的田野、乡村及丛林等
(气象学标准)0.003~0.2 III 丘陵和房屋比较稀疏的
乡镇及城市郊区0.2~1.0 IV 密集建筑群的城市 1.0~2.0 V 密集建筑群且房屋较高的城市 2.0~4.0  下载: 导出CSV
表 2 公式(2)的衰减常数a
Tab. 2 Decay constant a in Eq. (2)
区域 N $a = {a_0} + {a_1}\Delta {p_0} + \varepsilon $ a0 a1 R2 σε 区域1 36 0.0078 0.00075 0.0928 0.0198 区域2 66 0.0161 0.00055 0.0946 0.0203 区域3 159 0.0137 0.0012 0.2139 0.0247 区域4 82 −0.0035 0.0019 0.4768 0.0216 区域5 40 −0.0026 0.00052 0.5321 0.0116 注:N代表各个区域中用于回归分析的样本个数,R2是回归分析的相关系数,σε是误差项的标准差。
下载: 导出CSV
-
[1] Xiao Yufeng, Duan Zhongdong, Xiao Yiqing, et al. Typhoon wind hazard analysis for southeast China coastal regions[J]. Structural Safety, 2011, 33(4/5): 286−295. [2] American Society of Civil Engineers. ASCE/SEI 7-05, Minimum design loads for buildings and other structures[S]. Reston, VA: ASCE, 2005. [3] Standards Australia. AS/NZS 1170.2: 2002, Structural design actions part 2: wind actions[S]. Sydeney: Standards Australia International Ltd, 2002. [4] Russell L B. Probability distributions for Texas Gulf coast hurricane effects of engineering interest[D]. Stanford, CA: Stanford University, 1969. [5] Russell L R. Probability distributions for hurricane effects[J]. Journal of the Waterways, Harbors and Coastal Engineering Division, 1971, 97(1): 139−154. [6] Batts M E, Simiu E, Russell L R. Hurricane wind speeds in the United States[J]. Journal of the Structural Division, 1980, 106(10): 2001−2016. [7] Shapiro L J. The asymmetric boundary layer flow under a translating hurricane[J]. Journal of the Atmospheric Sciences, 1983, 40(8): 1984−1998. doi: 10.1175/1520-0469(1983)040<1984:TABLFU>2.0.CO;2 [8] Georgiou P N. Design wind speeds in tropical cyclone-prone regions[D]. London, Ontario, Canada: Western University, 1986. [9] Vickery P J, Twisdale L A. Wind-field and filling models for hurricane wind-speed predictions[J]. Journal of Structural Engineering, 1995, 121(11): 1700−1709. doi: 10.1061/(ASCE)0733-9445(1995)121:11(1700) [10] Meng Yan, Matsui M, Hibi K. An analytical model for simulation of the wind field in a typhoon boundary layer[J]. Journal of Wind Engineering and Industrial Aerodynamics, 1995, 56(2/3): 291−310. [11] Simiu E, Scanlan R H. Wind Effects on Structures: Fundamentals and Applications to Design[M]. 3rd ed. New York: John Wiley & Sons, Inc., 1996. [12] Thompson E F, Cardone V J. Practical modeling of hurricane surface wind fields[J]. Journal of Waterway, Port, Coastal, and Ocean Engineering, 1996, 122(4): 195−205. doi: 10.1061/(ASCE)0733-950X(1996)122:4(195) [13] Vickery P J, Twisdale L A. Prediction of hurricane wind speeds in the United States[J]. Journal of Structural Engineering, 1995, 121(11): 1691−1699. doi: 10.1061/(ASCE)0733-9445(1995)121:11(1691) [14] Vickery P J, Skerlj P F, Twisdale L A. Simulation of hurricane risk in the U. S. using empirical track model[J]. Journal of Structural Engineering, 2000, 126(10): 1222−1237. doi: 10.1061/(ASCE)0733-9445(2000)126:10(1222) [15] Vickery P J, Wadhera D, Twisdale L A, et al. U. S. hurricane wind speed risk and uncertainty[J]. Journal of Structural Engineering, 2009, 135(3): 301−320. doi: 10.1061/(ASCE)0733-9445(2009)135:3(301) [16] Huang Zhigang, Rosowsky D V, Sparks P R. Hurricane simulation techniques for the evaluation of wind-speeds and expected insurance losses[J]. Journal of Wind Engineering and Industrial Aerodynamics, 2001, 89(7/8): 605−617. [17] James M K, Mason L B. Synthetic tropical cyclone database[J]. Journal of Waterway, Port, Coastal, and Ocean Engineering, 2005, 131(4): 181−192. doi: 10.1061/(ASCE)0733-950X(2005)131:4(181) [18] Emanuel K. Climate and tropical cyclone activity: a new model downscaling approach[J]. Journal of Climate, 2006, 19(19): 4797−4802. doi: 10.1175/JCLI3908.1 [19] Emanuel K, Ravela S, Vivant E, et al. A statistical deterministic approach to hurricane risk assessment[J]. Bulletin of the American Meteorological Society, 2006, 87(3): 299−314. doi: 10.1175/BAMS-87-3-299 [20] Hall T M, Jewson S. Statistical modelling of North Atlantic tropical cyclone tracks[J]. Tellus A: Dynamic Meteorology and Oceanography, 2007, 59(4): 486−498. doi: 10.1111/j.1600-0870.2007.00240.x [21] American Society of Civil Engineers. ASCE/SEI 7-10, Minimum design loads for buildings and other structures[S]. Reston, VA: ASCE, 2010. [22] Li Sihan, Hong H P. Observations on a hurricane wind hazard model used to map extreme hurricane wind speed[J]. Journal of Structural Engineering, 2015, 141(10): 04014238. doi: 10.1061/(ASCE)ST.1943-541X.0001217 [23] Vickery P J, Wadhera D. Statistical models of Holland pressure profile parameter and radius to maximum winds of hurricanes from flight-level pressure and H*Wind data[J]. Journal of Applied Meteorology and Climatology, 2008, 47(10): 2497−2517. doi: 10.1175/2008JAMC1837.1 [24] Vickery P J, Wadhera D, Powell M D, et al. A hurricane boundary layer and wind field model for use in engineering applications[J]. Journal of Applied Meteorology and Climatology, 2009, 48(2): 381−405. doi: 10.1175/2008JAMC1841.1 [25] Vickery P J. Simple empirical models for estimating the increase in the central pressure of tropical cyclones after landfall along the coastline of the United States[J]. Journal of Applied Meteorology, 2005, 44(12): 1807−1826. doi: 10.1175/JAM2310.1 [26] Mudd L, Wang Yue, Letchford C, et al. Assessing climate change impact on the U. S. east coast hurricane hazard: temperature, frequency, and track[J]. Natural Hazards Review, 2014, 15(3): 04014001. doi: 10.1061/(ASCE)NH.1527-6996.0000128 [27] Lee K H, Rosowsky D V. Synthetic hurricane wind speed records: development of a database for hazard analyses and risk studies[J]. Natural Hazards Review, 2007, 8(2): 23−34. doi: 10.1061/(ASCE)1527-6988(2007)8:2(23) [28] Rosowsky D V, Mudd L, Letchford C. Assessing climate change impact on the joint wind-rain hurricane hazard for the northeastern U. S. coastline[M]//Gardoni P, Murphy C, Rowell A. Risk Analysis of Natural Hazards: Interdisciplinary Challenges and Integrated Solutions. Heidelberg: Springer, 2016: 113−134. [29] Powell M, Soukup G, Cocke S, et al. State of Florida hurricane loss projection model: atmospheric science component[J]. Journal of Wind Engineering and Industrial Aerodynamics, 2005, 93(8): 651−674. doi: 10.1016/j.jweia.2005.05.008 [30] Legg M R, Nozick L K, Davidson R A. Optimizing the selection of hazard-consistent probabilistic scenarios for long-term regional hurricane loss estimation[J]. Structural Safety, 2010, 32(1): 90−100. doi: 10.1016/j.strusafe.2009.08.002 [31] Apivatanagul P, Davidson R, Blanton B, et al. Long-term regional hurricane hazard analysis for wind and storm surge[J]. Coastal Engineering, 2011, 58(6): 499−509. doi: 10.1016/j.coastaleng.2011.01.015 [32] Pei Bin, Pang W, Testik F Y, et al. Mapping joint hurricane wind and surge hazards for Charleston, South Carolina[J]. Natural Hazards, 2014, 74(2): 375−403. doi: 10.1007/s11069-014-1185-5 [33] Li Sihan, Hong H P. Typhoon wind hazard estimation for China using an empirical track model[J]. Natural Hazards, 2016, 82(2): 1009−1029. doi: 10.1007/s11069-016-2231-2 [34] 欧进萍, 段忠东, 常亮. 中国东南沿海重点城市台风危险性分析[J]. 自然灾害学报, 2002, 11(4): 9−17. doi: 10.3969/j.issn.1004-4574.2002.04.002Ou Jinping, Duan Zhongdong, Chang Liang. Typhoon risk analysis for key coastal cities in southeast China[J]. Journal of Natural Disasters, 2002, 11(4): 9−17. doi: 10.3969/j.issn.1004-4574.2002.04.002 [35] Yasui H, Ohkuma T, Marukawa H, et al. Study on evaluation time in typhoon simulation based on Monte Carlo method[J]. Journal of Wind Engineering and Industrial Aerodynamics, 2002, 90(12/15): 1529−1540. [36] Counihan J. Adiabatic atmospheric boundary layers: a review and analysis of data from the period 1880–1972[J]. Atmospheric Environment, 1975, 9(10): 871−905. doi: 10.1016/0004-6981(75)90088-8 [37] Choi H, Kanda J. Characteristics of the vertical wind profile for wind load estimation[J]. Journal of Wind Engineering, 1990, 45: 23−43. [38] Matsui M, Ishihara T, Hibi K. Directional characteristics of probability distribution of extreme wind speeds by typhoon simulation[J]. Journal of Wind Engineering and Industrial Aerodynamics, 2002, 90(12/15): 1541−1553. [39] 谢汝强, 李利孝, 王艳华, 等. 广东省台风数值模拟与危险性分析[J]. 安徽建筑大学学报, 2015, 23(4): 51−55. doi: 10.11921/j.issn.2095-8382.20150411Xie Ruqiang, Li Lixiao, Wang Yanhua, et al. Typhoon wind numerical simulation and hazard analysis for Guangdong Province[J]. Journal of Anhui Jianzhu University, 2015, 23(4): 51−55. doi: 10.11921/j.issn.2095-8382.20150411 [40] Holland G J. An analytic model of the wind and pressure profiles in hurricanes[J]. Monthly Weather Review, 1980, 108(8): 1212−1218. doi: 10.1175/1520-0493(1980)108<1212:AAMOTW>2.0.CO;2 [41] Li Sihan, Hong H P. Use of historical best track data to estimate typhoon wind hazard at selected sites in China[J]. Natural Hazards, 2015, 76(2): 1395−1414. doi: 10.1007/s11069-014-1555-z [42] Hong H P, Li Sihan, Duan Z D. Typhoon wind hazard estimation and mapping for coastal region in mainland China[J]. Natural Hazards Review, 2016, 17(2): 04016001. doi: 10.1061/(ASCE)NH.1527-6996.0000210 [43] Darling R W R. Estimating probabilities of hurricane wind speeds using a large-scale empirical model[J]. Journal of Climate, 1991, 4(10): 1035−1046. doi: 10.1175/1520-0442(1991)004<1035:EPOHWS>2.0.CO;2 [44] Jarvinen B R, Neumann C J, Davis M A S. A tropical cyclone data tape for the North Atlantic Basin, 1886–1983: contents, limitations, and uses[R]. Miami, FL, USA: National Hurricane Center, 1984. [45] 中华人民共和国住房和城乡建设部. GB 50009–2012, 建筑结构荷载规范[S]. 北京: 中国建筑工业出版社, 2012.Ministry of Housing and Urban-Rural Construction of the People's Republic of China. GB 50009–2012, Load code for the design of building structures[S]. Beijing: China Architecture & Building Press, 2012. -


 点击查看大图
计量
- 文章访问数: 382
- HTML全文浏览量: 56
- PDF下载量: 55
- 被引次数: 0
