

A comparison of Indian Ocean dipole prediction skill in a multi-model ensemble
-
摘要: 本文采用北美多模式集合产品数据,分析了印度洋偶极子指数在不同模式中实际预报技巧和潜在可预报性的差异,并进一步探究其可能的原因。结果表明,印度洋偶极子的有效预报时效在不同模式中差别较大,从2个月到4个月不等。其中东极子海温异常在不同模式中预报技巧的差别较西极子海表面温度异常更明显,表明模式误差和初始误差对东极子海表面温度异常演变的影响更为显著。另外,印度洋偶极子的实际预报技巧和潜在预报技巧存在明显的线性关系,潜在预报技巧高的模式,其实际预报技巧也高。最后,本文诊断、分析了厄尔尼诺对印度洋偶极子预报技巧的影响,发现在厄尔尼诺和印度洋偶极子相关性较高的气候模式中,印度洋偶极子实际预报技巧也较高。Abstract: In this work, we compare the actual prediction skills and potential predictability of the Indian Ocean Dipole (IOD) index among different models, using the North American Multi-Model Ensemble dataset. If defined by a 0.5 anomaly correlation skill, we find that skillful predictions of the IOD strongly vary among models, ranging from 2- to 4-month leads. The diversity in the prediction skills of Sea Surface Temperature Anomalies (SSTA) over the east pole of the IOD is more obvious than that over the west pole, suggesting the model errors and the initial errors have more significant effects on SSTA over the east pole region. Also, there is a significant linear relationship between the actual prediction skills and potential predictability of the IOD. Finally, we find the actual prediction skills diversity is due to the El Niño/Southern Oscillation (ENSO) influences onto the IOD in different models. The models with enhanced ENSO/IOD link tend to have high actual prediction skills.
-
Key words:
- Indian Ocean dipole /
- actual prediction skill /
- potential predictability
-

图 1 1982−2010年观测(黑线)和模式预报(红线)的DMI时间序列
预报的DMI时间序列是超前时间为1~3个月预报的平均。预报的和观测的时间序列均去掉季节内和7年以上频率的信号
Fig. 1 Evolution of observed (black) and predicted (red) DMI from 1982 to 2010
The predicted DMI is at 1−3 months of lead time. A 4−84-month bandpass filter is applied to remove the intraseasonal and long-term variations for both the predicted and observed time series
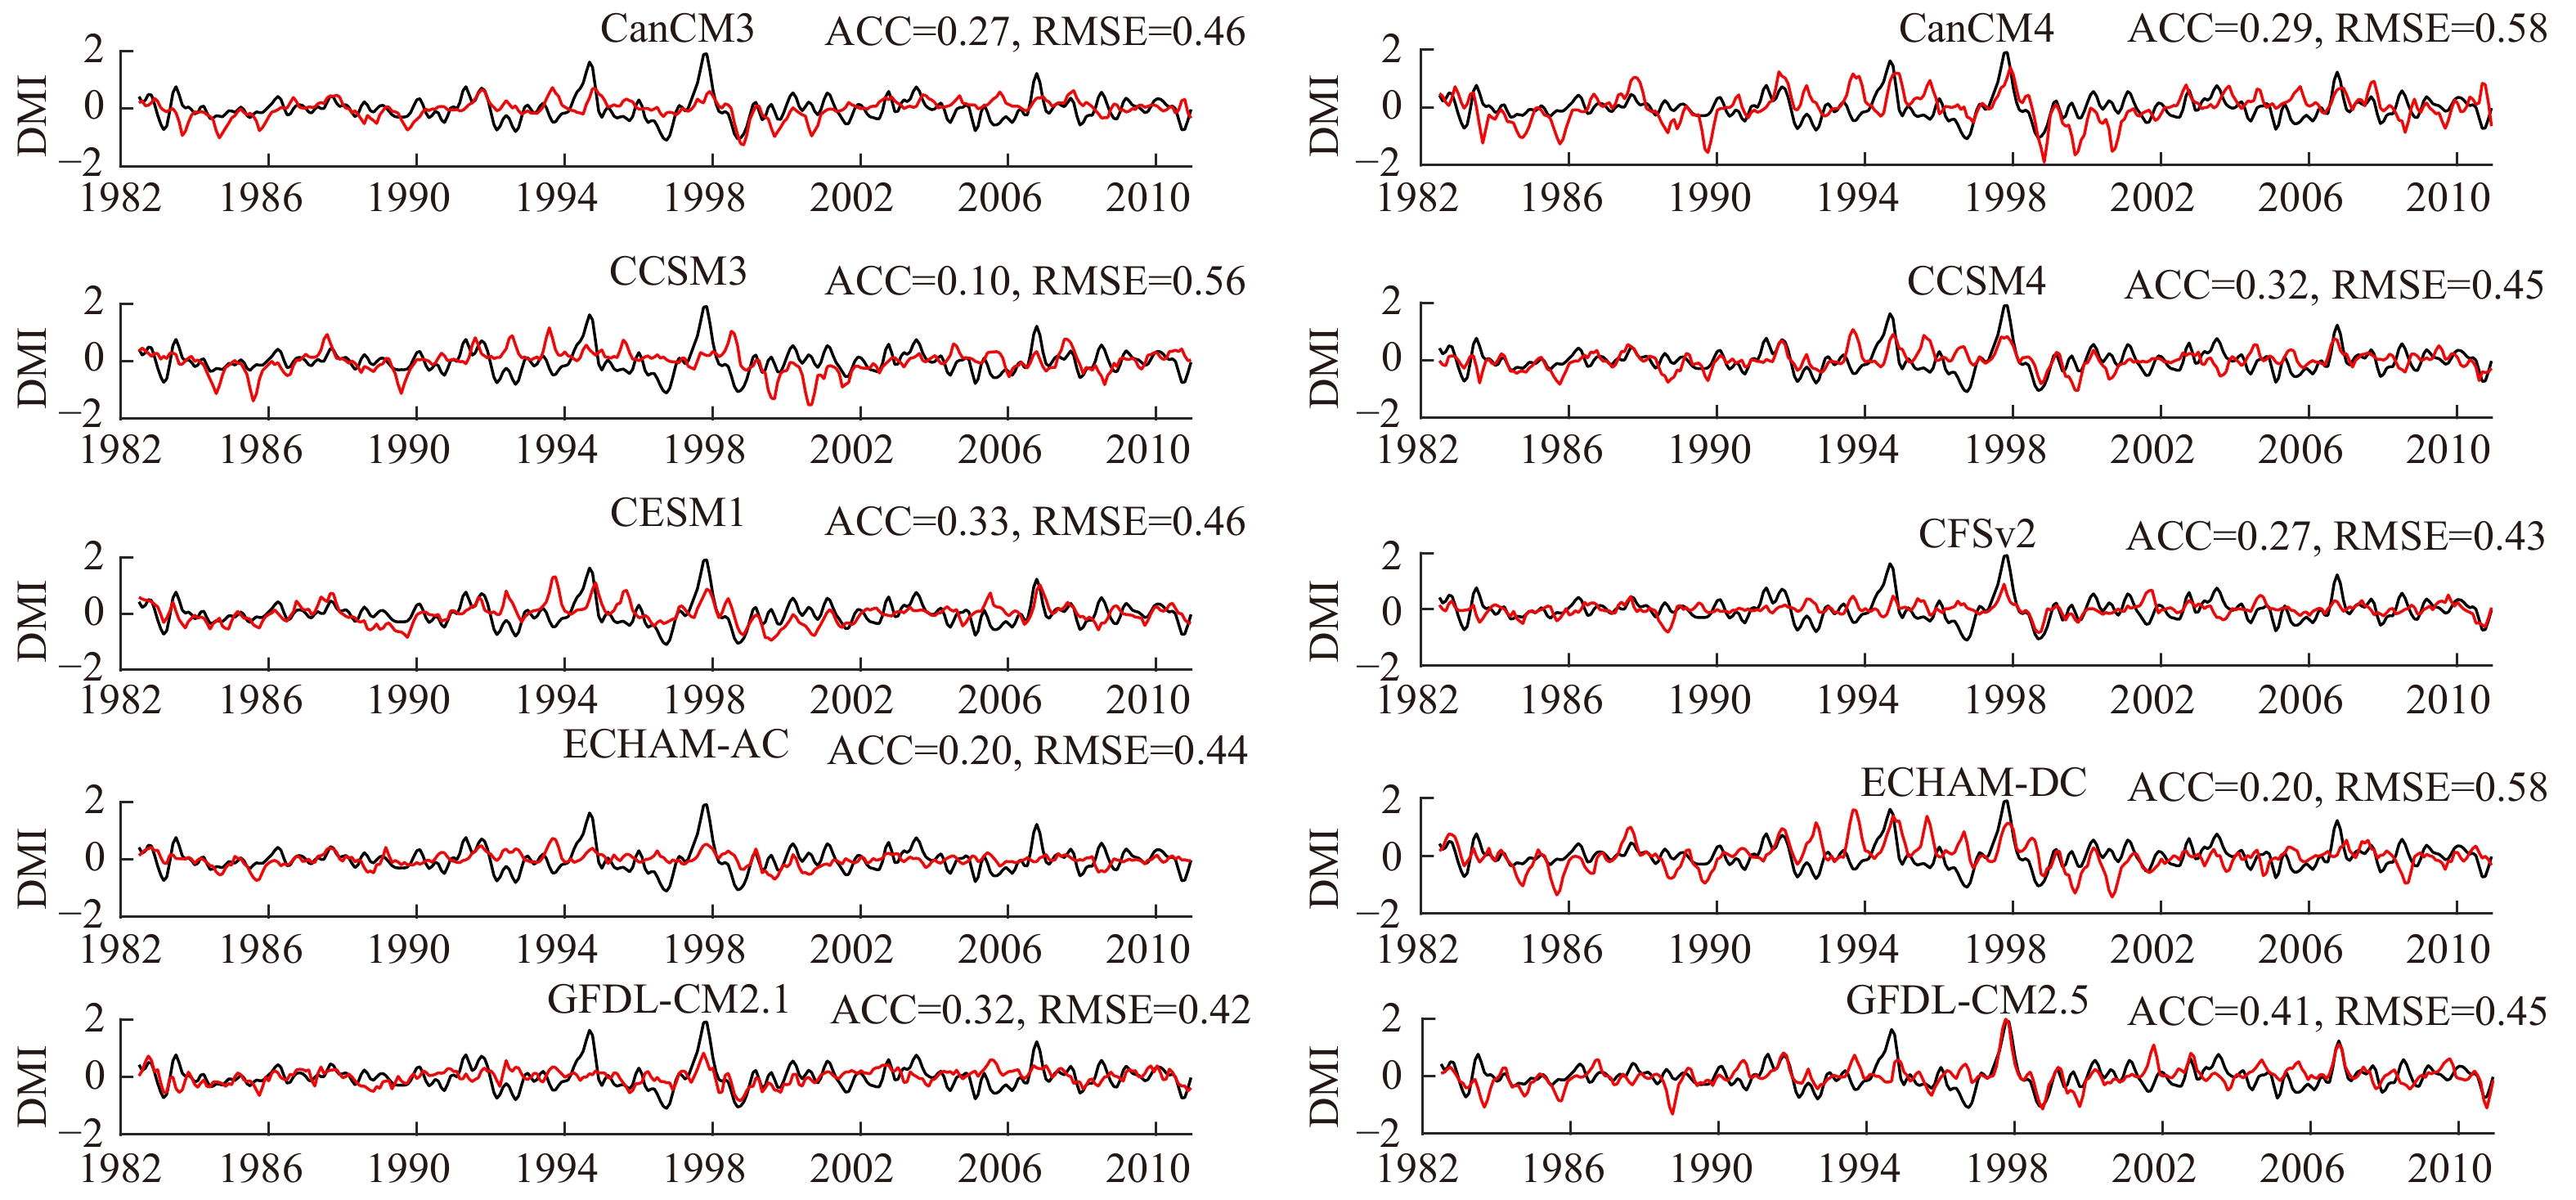
图 2 1982−2010年观测(黑线)和模式预报(红线)的DMI时间序列
预报的DMI时间序列来自超前时间为4~6个月的平均。预报的和观测的时间序列均去掉季节内和7年以上频率的信号
Fig. 2 Evolution of observed (black) and predicted (red) DMI from 1982 to 2010
The predicted DMI is at 4−6 months of lead time. A 4-84-month bandpass filter is applied to remove the intraseasonal and long-term variations for both the predicted and observed time series
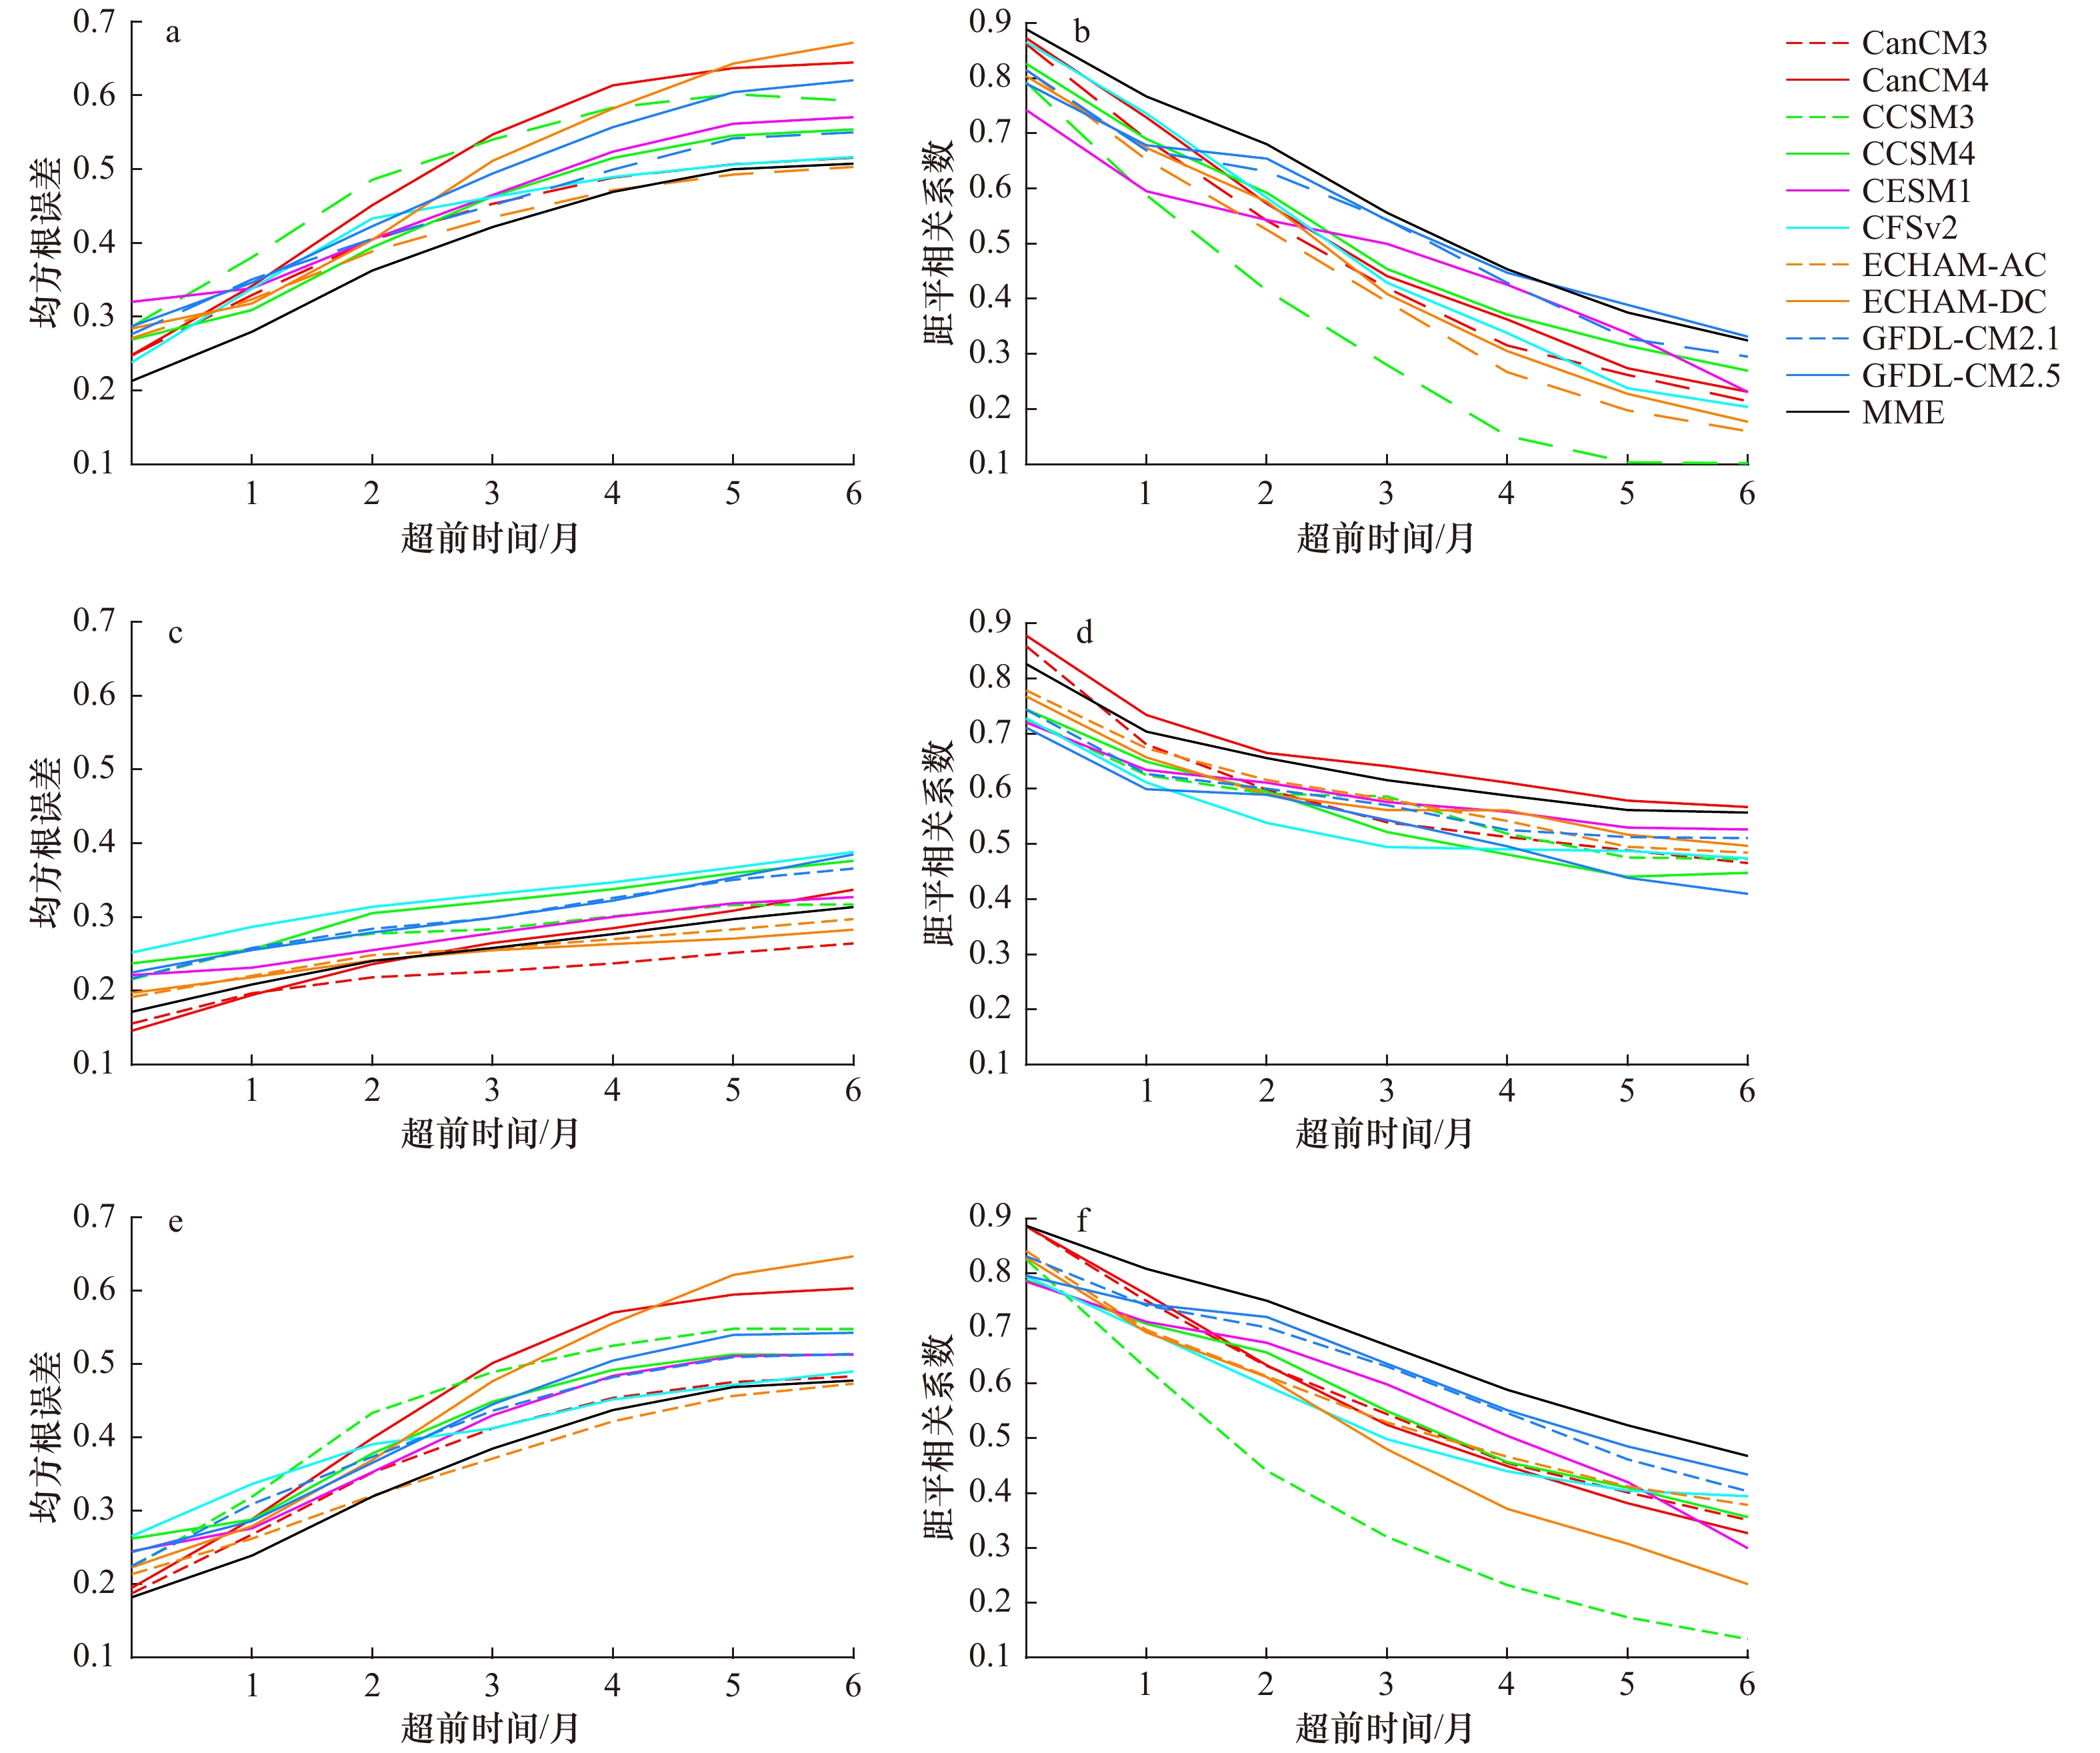
图 3 NMME中10个模式和多模式集合(MEE)对印度洋偶极子指数(a,b)、西极子(c,d)和东极子(e,f)的模式预报与观测之间的均方根误差以及距平相关系数
Fig. 3 The root mean square error and anomaly correlation coefficient for the DMI (a, b), the west pole (c, d), and the east pole (e, f) for the 10 models in the NMME and the MME
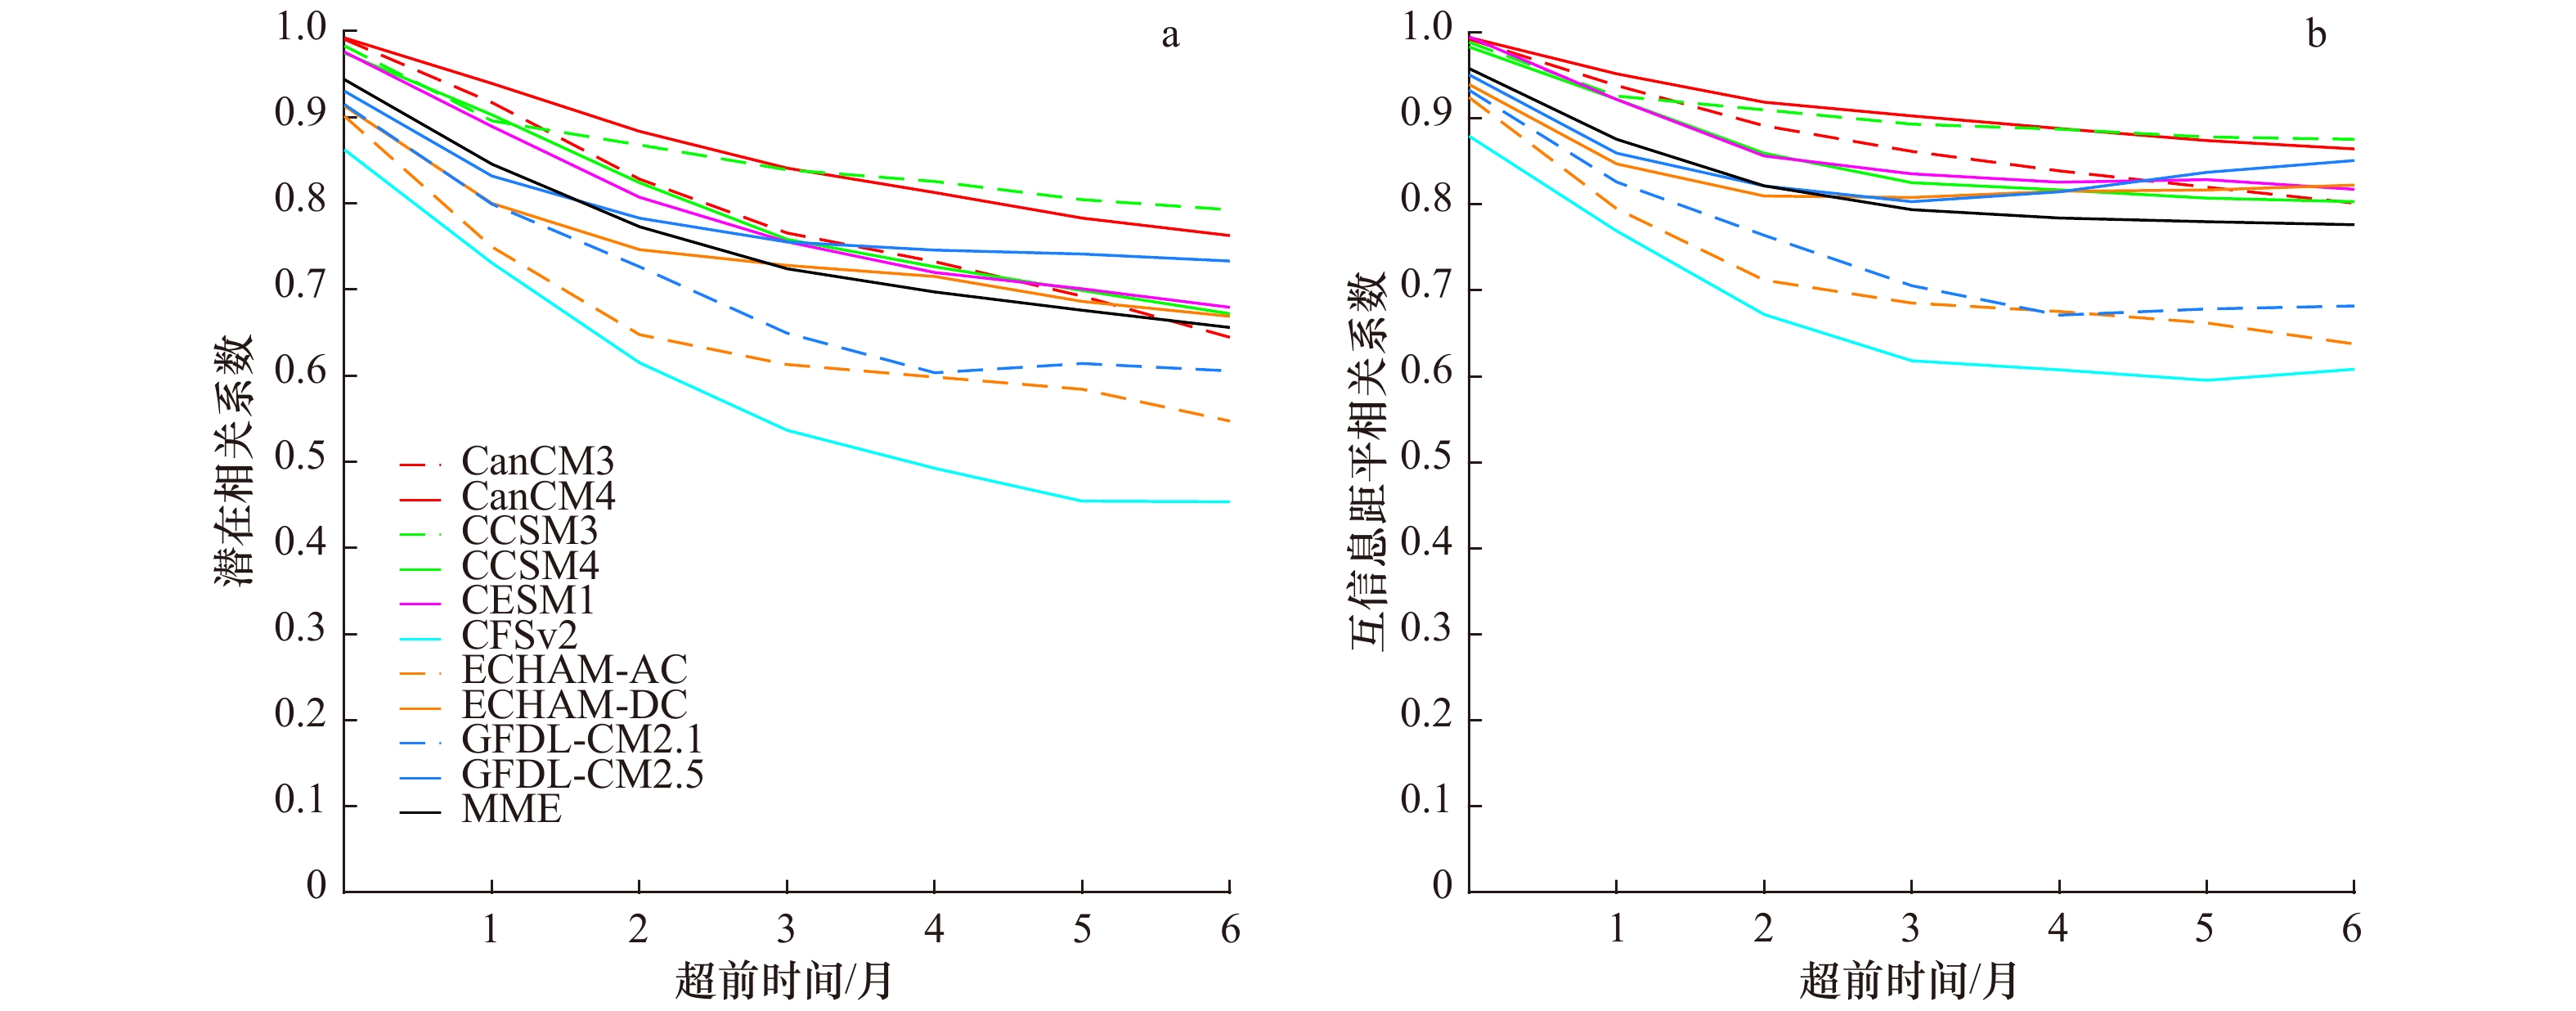
图 4 NMME中10个模式和多模式集合的潜在可预报性
a图为信噪比方法得到的潜在相关系数,b图为信息熵方法得到的互信息距平相关系数
Fig. 4 The DMI potential predictability of 10 models in NMME and MME
The potential correlation coefficient is obtained by the signal-to-noise ratio method in a, and the mutual information anomaly correlation coefficient is estimated using the information entropy theory in b
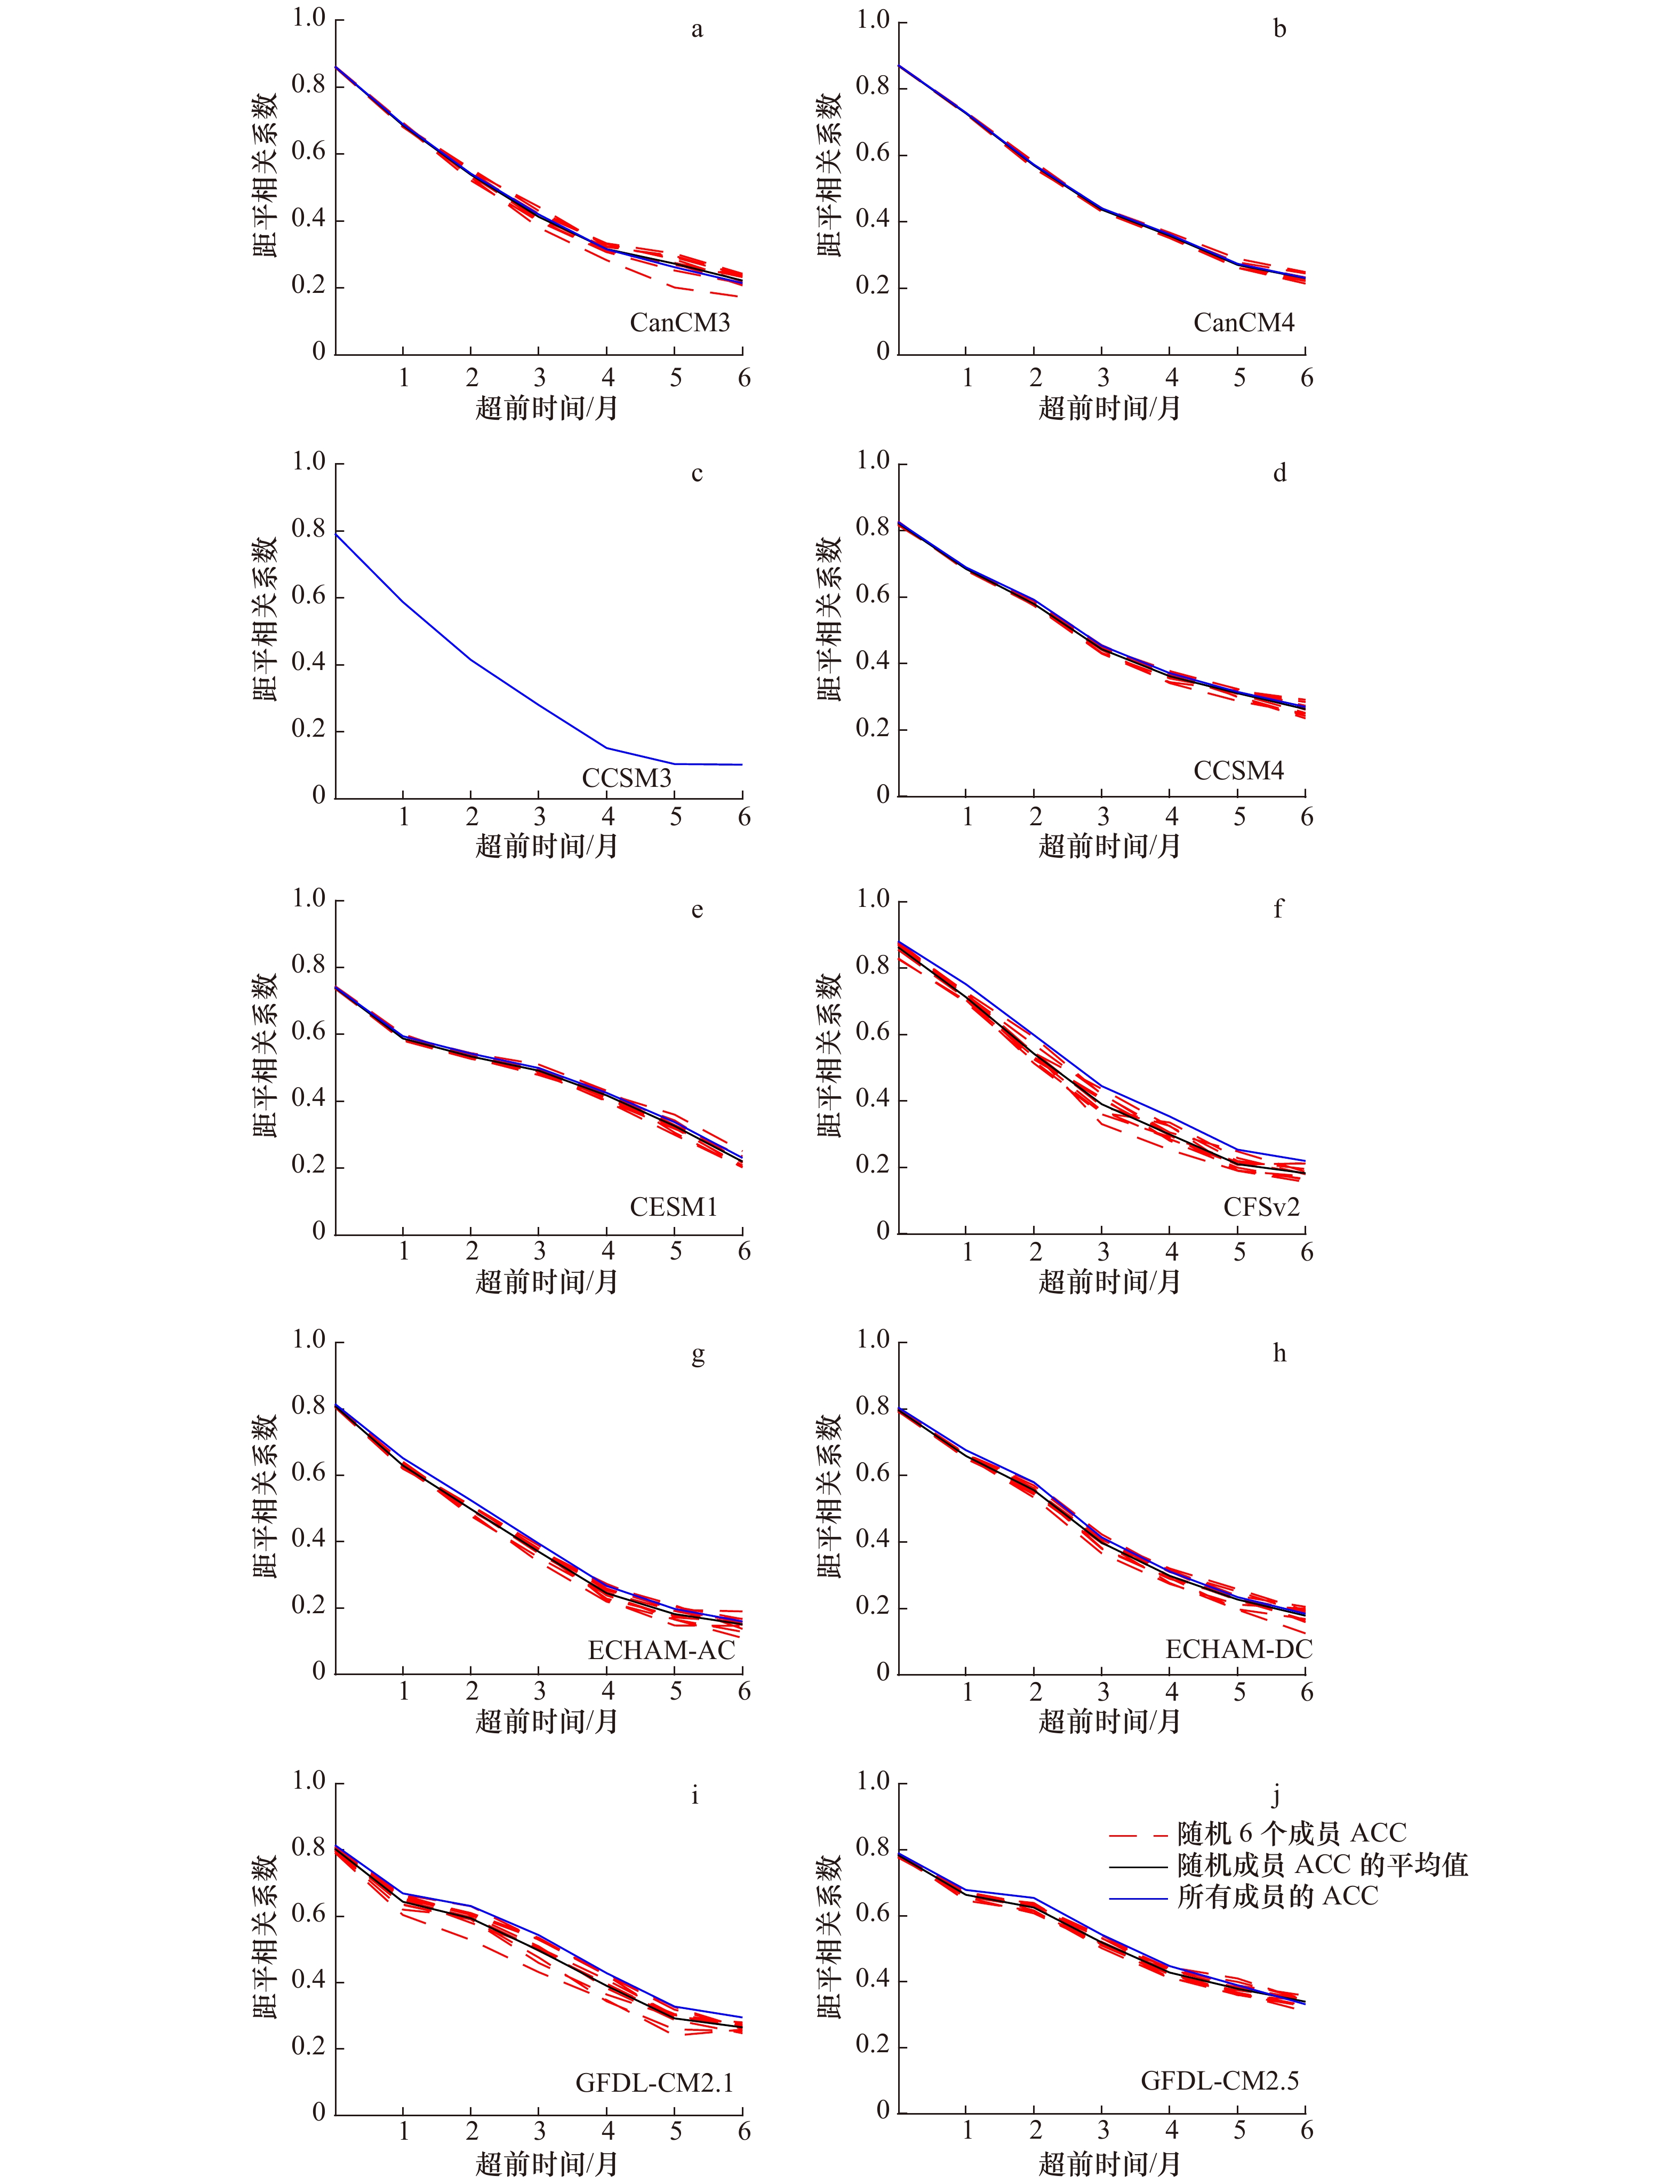
图 5 集合成员数对模式实际预报技巧的影响
随意选取的6个集合成员所得到的实际预报技巧(红色虚线)及其平均(黑色实线),各个模式所有集合成员计算得到的实际预报技巧(蓝色实线,也是图3中的DMI的距平相关系数)
Fig. 5 The influences of ensemble members on the actual prediction skills
The actual prediction skills (red dashed lines) obtained by randomly-selected six members and their average (black solid line), the actual prediction skills calculated by all the ensemble members of individual model (blue solid line, also the anomaly correlation coefficient of the DMI in Fig.3)

图 6 NMME中去除CCSM3模式后剩余的模式成员关于IOD的实际预报技巧和潜在可预报性的散点图
横轴为不同模式成员在超前时间为0~6个月的距平相关系数平均值,纵轴为超前时间为0~6个月的潜在相关系数的平均值The x axis is the mean of the DMI ACC at the lead time of 0−6 months, while the y axis is the mean of DMI PCORR at the lead time of 0−6 months
Fig. 6 Scatterplot of the actual prediction skills against potential predictability (PCORR) of the DMI (without CCSM3)
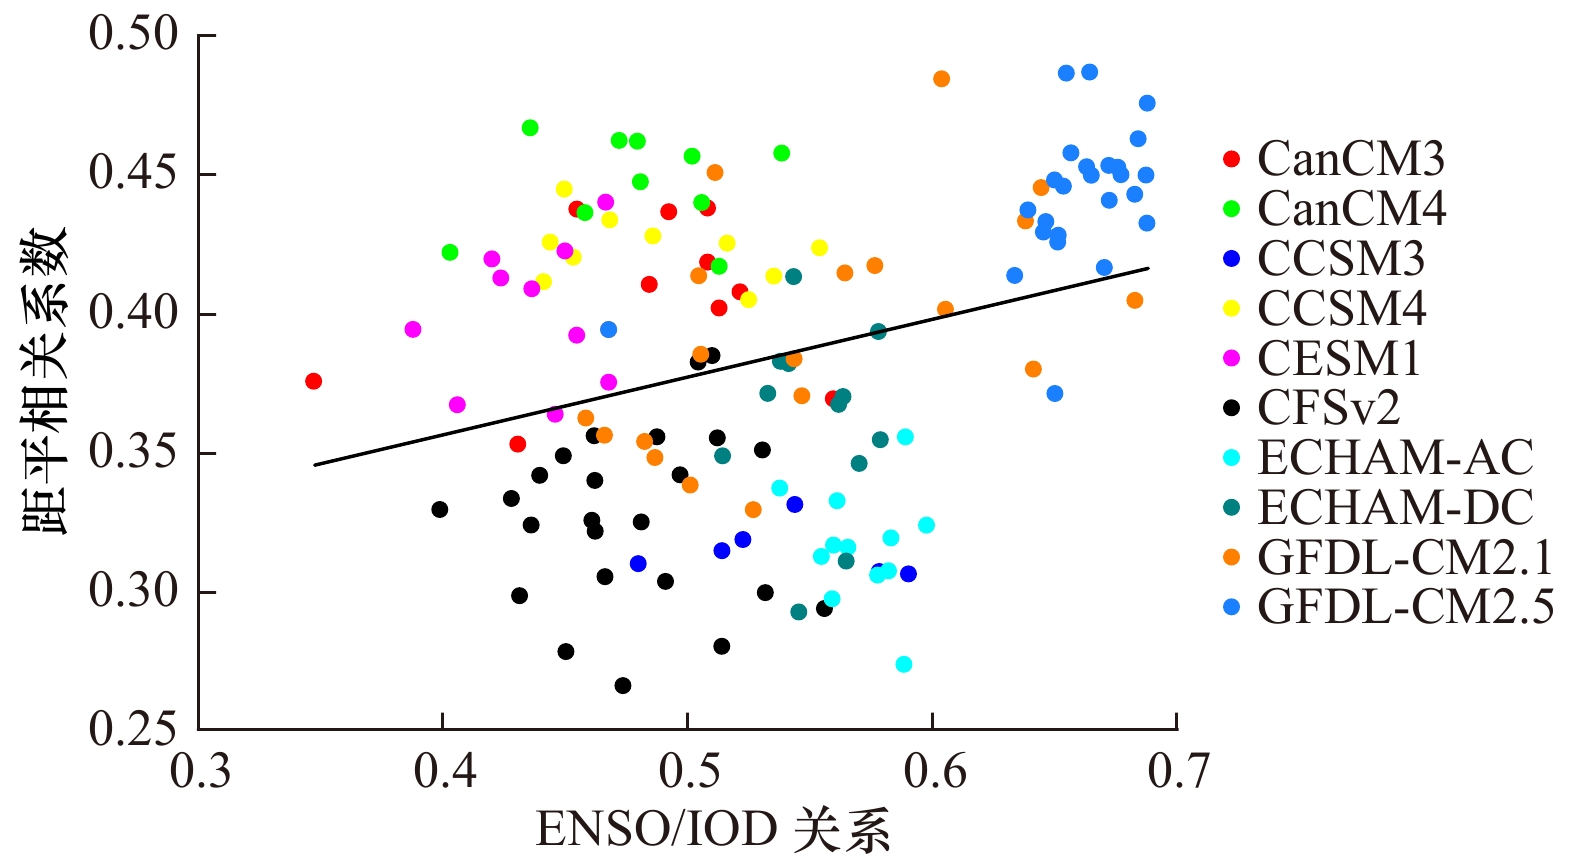
图 7 所有模式成员IOD的实际预报技巧以及ENSO/IOD关系的散点图
纵轴为不同模式成员在超前时间为0~6个月的距平相关系数(ACC)平均值,横轴为ENSO/IOD的关系。ENSO/IOD的关系为同期(9−11月)的Niño3.4指数以及DMI的相关系数
Fig. 7 Scatterplot of the DMI actual prediction skills at lead time 0−6 months against the strength of ENSO/IOD link
The actual prediction skill (y axis) is the mean of the DMI ACC at the lead time of 0−6 months. The ENSO/IOD link (x axis) is represented by the simultaneous correlation coefficient between Niño 3.4 index and the DMI during Sptember to November
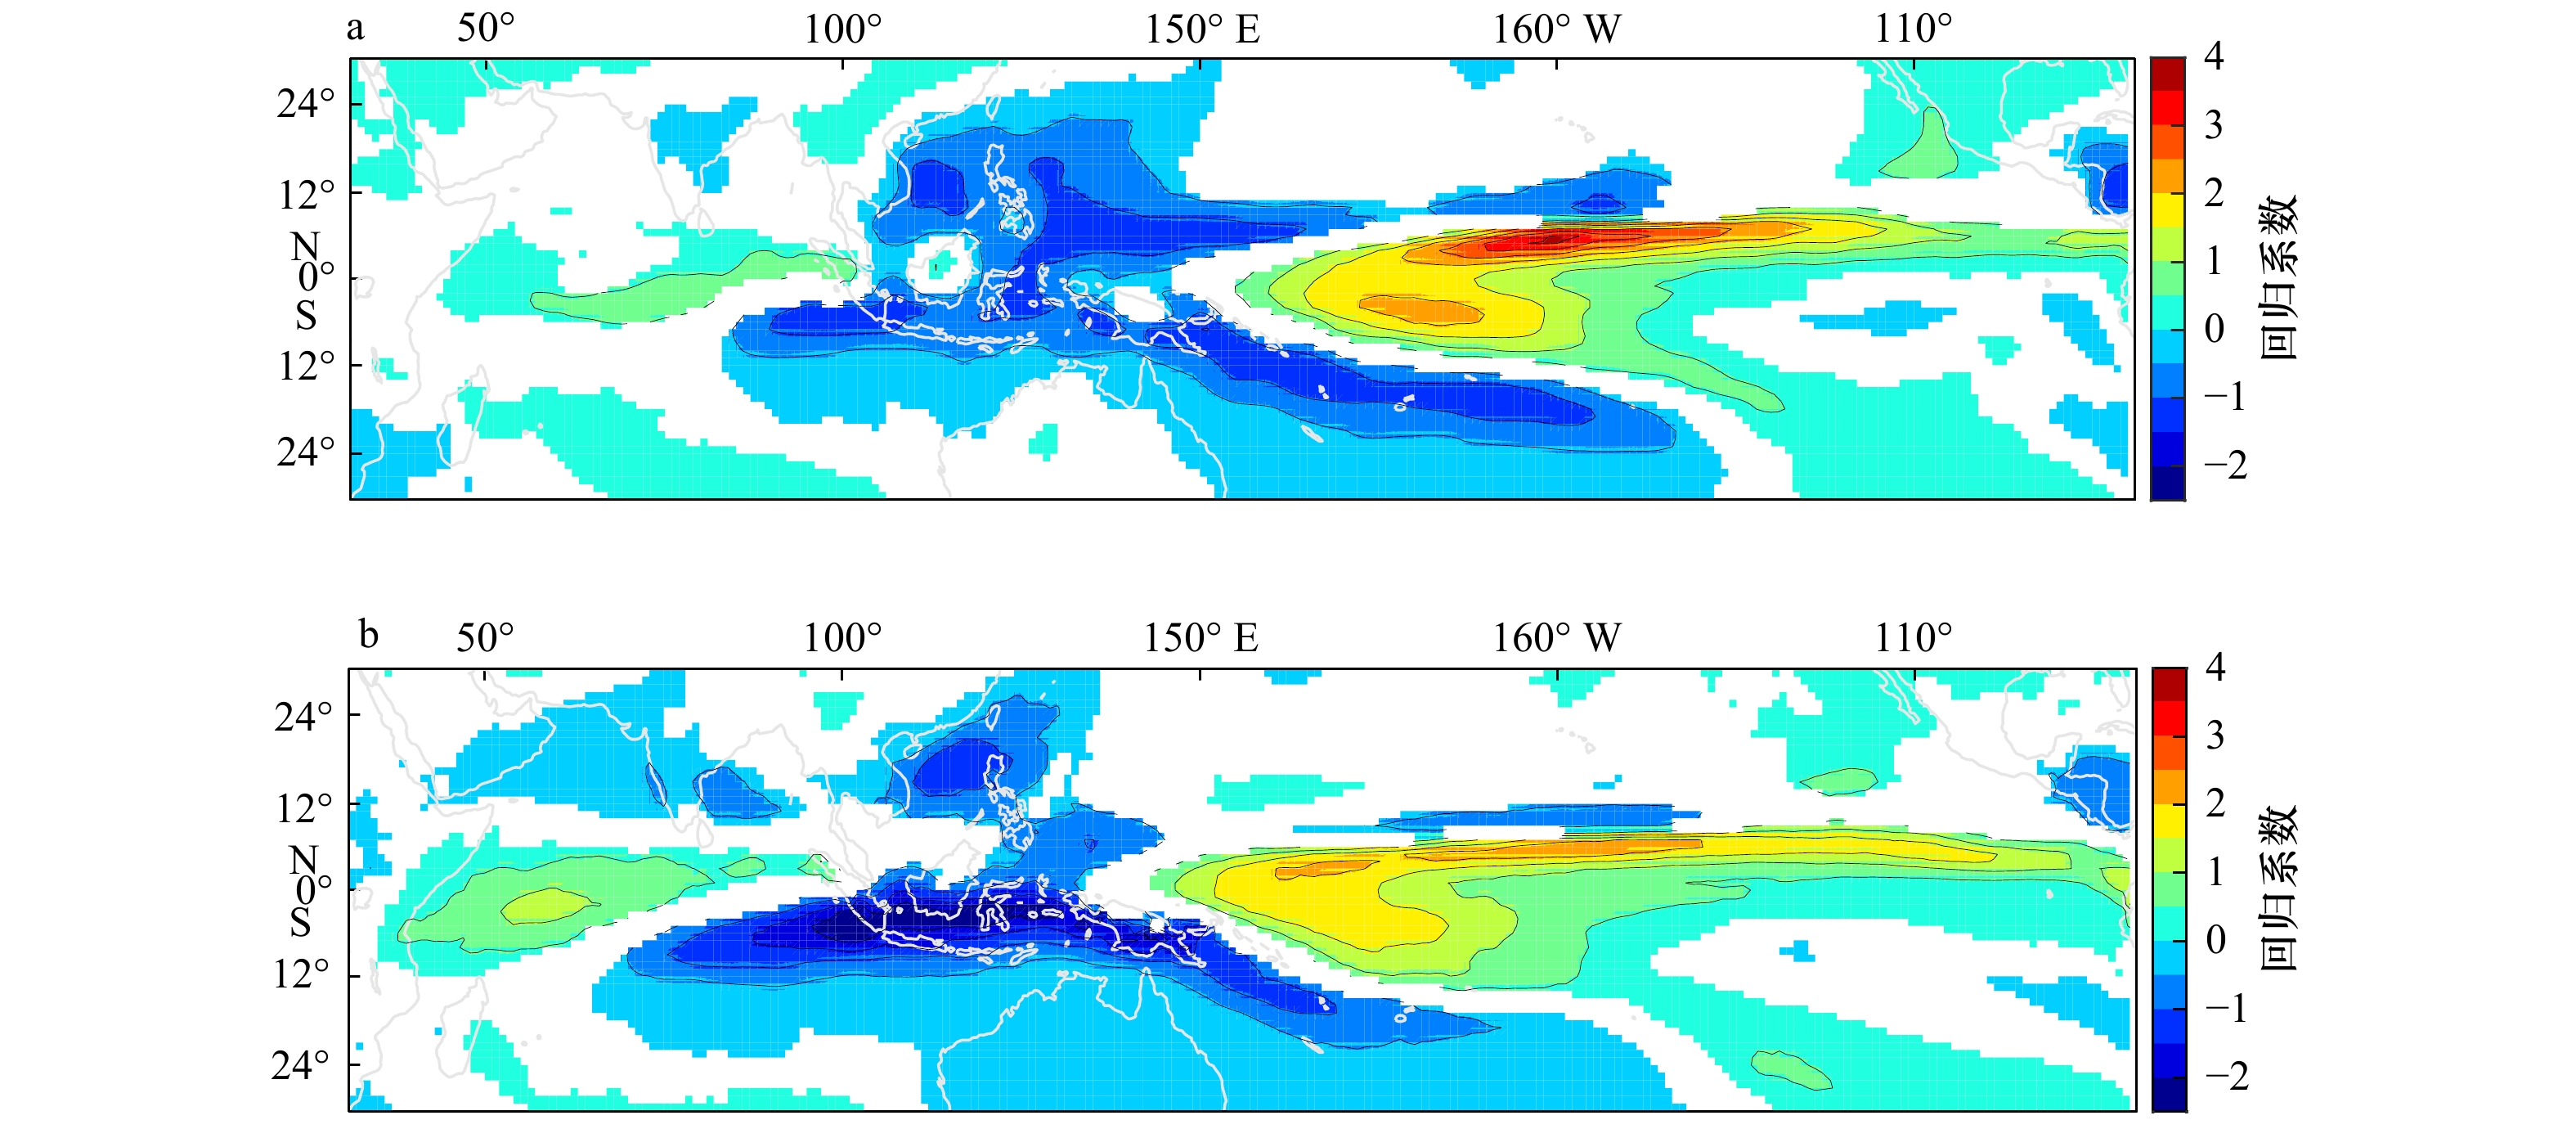
图 8 IOD预报时效最短(CCSM3/ECHAM-AC, a)及最长(GFDL-CM2.1/GFDL-CM2.5,b)的两对模式降水异常与Niño 3.4指数的同期回归系数(9-11月)
所有的颜色区域均超过95%信度检验
Fig. 8 The regression patterns for the total precipitation anomaly (mm/d) onto the Niño3.4 index during Sptember to November in the worst performance models (CCSM3/ECHAM-AC, a) and the best performance models (GFDL-CM2.1/GFDL-CM2.5, b)
Areas shown in color are significant at 95% confidence level
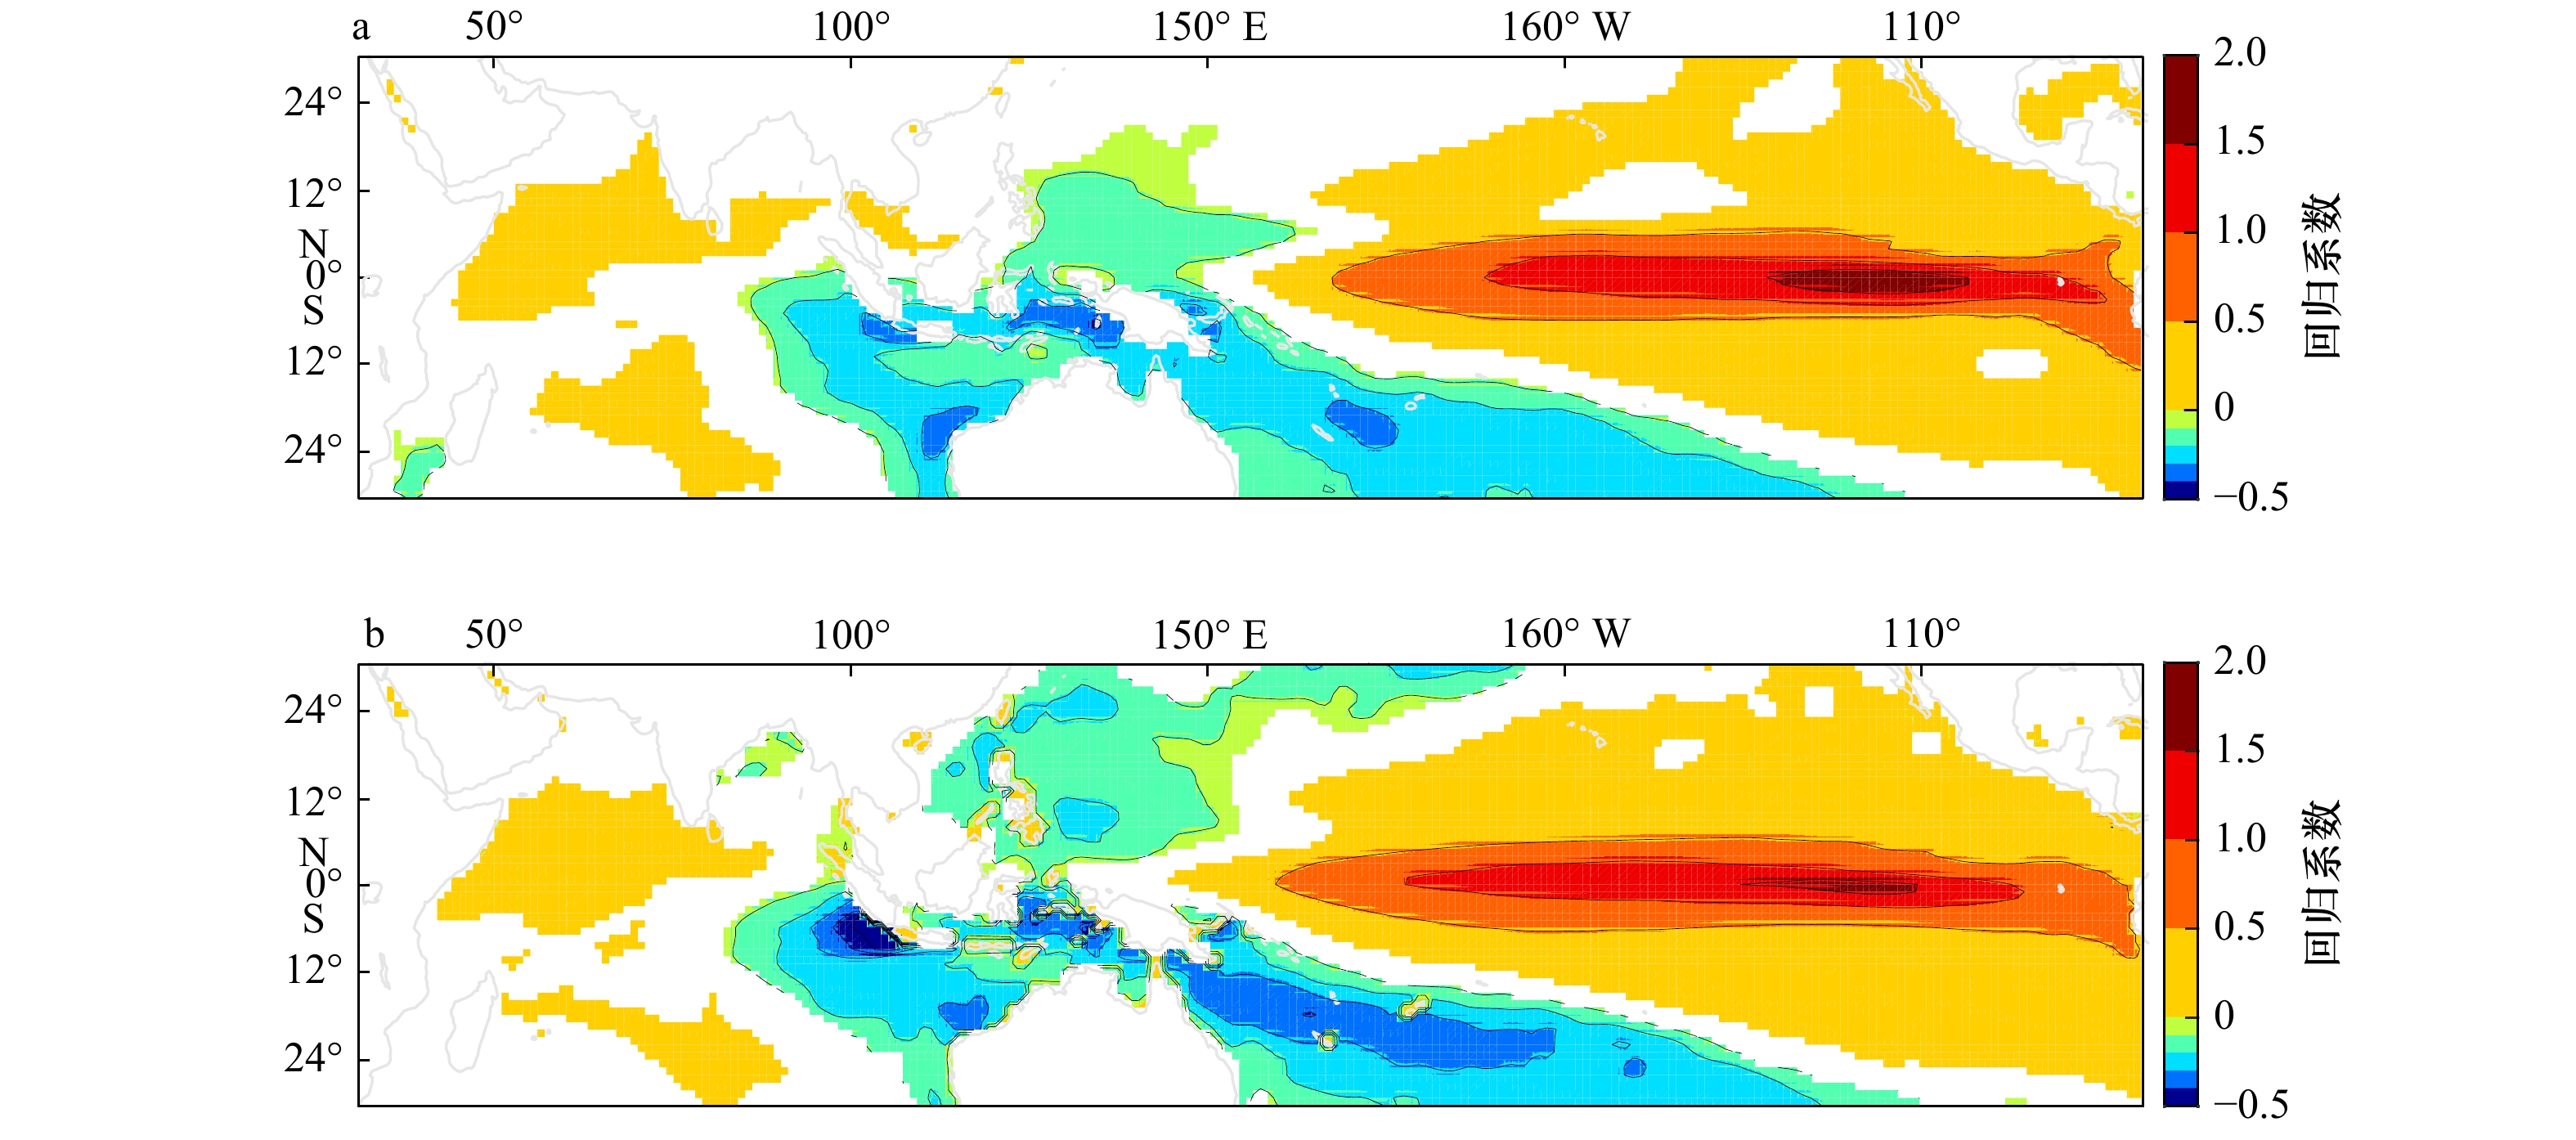
图 9 IOD预报时效最短(CCSM3/ECHAM-AC,a)及最长(GFDL-CM2.1/GFDL-CM2.5,b)的两对模式SSTA与Niño3.4指数的同期回归系数(9−11月)
所有的颜色区域均超过95%信度检验
Fig. 9 The regression patterns for SSTA onto the Niño3.4 index during Sptember to November in the worst performance models (CCSM3/ECHAM-AC, a) and the best performance models (GFDL-CM2.1/GFDL-CM2.5, b)
Areas shown in color are significant at 95% confidence level
表 1 NMME中10个模式的介绍
Tab. 1 The introduction of 10 models in NMME
模式 模式全称 来源组织 超前时间/月 集合成员数目 CanCM3 Third Generation Canadian Coupled Global Climate Model CMC 0~11 10 CanCM4 Fourth Generation Canadian Coupled Global Climate Model CMC 0~11 10 CCSM3 Community Climate System Model, version 3 NCAR 0~11 6 CCSM4 Community Climate System Model, version 4 NCAR 0~11 10 CESM1 Community Earth System Model, version 1 NCAR 0~11 10 CFSv2 Climate Forecast System, version 2 NCEP 0~9 24 ECHAM-AC European Centre Hamburg Model IRI 0~7 12 ECHAM-DC European Centre Hamburg Model IRI 0~7 12 GFDL-CM2.1 Geophysical Fluid Dynamics Laboratory Climate Model, version 2.1 GFDL 0~11 20 GFDL-CM2.5 Geophysical Fluid Dynamics Laboratory Climate Model, version 2.5 GFDL 0~11 24  下载: 导出CSV
-
[1] Klein S A, Soden B J, Lau N C. Remote sea surface temperature variations during ENSO: evidence for a tropical atmospheric bridge[J]. Journal of Climate, 1999, 12(4): 917−932. doi: 10.1175/1520-0442(1999)012<0917:RSSTVD>2.0.CO;2 [2] Venzke S, Latif M, Villwock A. The coupled GCM ECHO-2. Part Ⅱ: Indian Ocean response to ENSO[J]. Journal of Climate, 2000, 13(8): 1371−1383. doi: 10.1175/1520-0442(2000)013<1371:TCGE>2.0.CO;2 [3] Saji N H, Goswami B N, Vinayachandran P N, et al. A dipole mode in the tropical Indian Ocean[J]. Nature, 1999, 401(6751): 360−363. [4] Behera S K, Luo Jingjia, Masson S, et al. Paramount impact of the Indian Ocean dipole on the East African short rains: a CGCM study[J]. Journal of Climate, 2005, 18(21): 4514−4530. doi: 10.1175/JCLI3541.1 [5] Yu Lisan, Rienecker M M. Mechanisms for the Indian Ocean warming during the 1997-98 El Niño[J]. Geophysical Research Letters, 1999, 26(6): 735−738. doi: 10.1029/1999GL900072 [6] Rao R R, Sivakumar R. Seasonal variability of sea surface salinity and salt budget of the mixed layer of the North Indian Ocean[J]. Journal of Geophysical Research: Oceans, 2003, 108(C1): 9-1−9-14. [7] Zhao Mei, Hendon H H. Representation and prediction of the Indian Ocean dipole in the POAMA seasonal forecast model[J]. Quarterly Journal of the Royal Meteorological Society, 2009, 135(639): 337−352. doi: 10.1002/qj.370 [8] 谭言科, 张人禾, 何金海, 等. 热带印度洋海温的年际变化与ENSO[J]. 气象学报, 2004, 62(6): 831−840.Tan Yanke, Zhang Renhe, He Jinhai, et al. Relationship of the interannual variations of sea surface temperature in tropical Indian Ocean to ENSO[J]. Acta Meteorologica Sinica, 2004, 62(6): 831−840. [9] Yang Yan, Xie Shangping, Wu Lixin, et al. Seasonality and predictability of the Indian Ocean dipole mode: ENSO forcing and internal variability[J]. Journal of Climate, 2015, 28(20): 8021−8036. doi: 10.1175/JCLI-D-15-0078.1 [10] Bjerknes J. Atmospheric teleconnections from the equatorial Pacific[J]. Monthly Weather Review, 1969, 97(3): 163−172. doi: 10.1175/1520-0493(1969)097<0163:ATFTEP>2.3.CO;2 [11] Schott F A, Xie Shangping, McCreary Jr J P. Indian Ocean circulation and climate variability[J]. Reviews of Geophysics, 2009, 47(1): RG1002. [12] Saji N H, Yamagata T. Possible impacts of Indian Ocean dipole mode events on global climate[J]. Climate Research, 2003, 25(2): 151−169. [13] 赵永平, 陈永利, 王凡, 等. 热带印度洋Dipole事件的两种模态[J]. 中国科学 D辑: 地球科学, 2009, 52(3): 369−381. doi: 10.1007/s11430-009-0026-yZhao Yongping, Chen Yongli, Wang Fan, et al. Two modes of dipole events in tropical Indian Ocean[J]. Science in China Series D: Earth Sciences, 2009, 52(3): 369−381. doi: 10.1007/s11430-009-0026-y [14] Ashok K, Guan Zhaoyong, Yamagata T. Impact of the Indian Ocean dipole on the relationship between the Indian monsoon rainfall and ENSO[J]. Geophysical Research Letters, 2001, 28(23): 4499−4502. doi: 10.1029/2001GL013294 [15] Ashok K, Guan Zhaoyong, Saji N H, et al. Individual and combined influences of ENSO and the Indian Ocean dipole on the Indian summer monsoon[J]. Journal of Climate, 2004, 17(16): 3141−3155. doi: 10.1175/1520-0442(2004)017<3141:IACIOE>2.0.CO;2 [16] Saji N H, Ambrizzi T, Ferraz S E T. Indian Ocean Dipole mode events and austral surface air temperature anomalies[J]. Dynamics of Atmospheres and Oceans, 2005, 39(1/2): 87−101. [17] Li Chongyin, Mu Mingquan. The influence of the Indian Ocean dipole on atmospheric circulation and climate[J]. Advances in Atmospheric Sciences, 2001, 18(5): 831−843. doi: 10.1007/BF03403506 [18] 刘华锋, 章向明, 唐佑民, 等. 印度洋偶极子及其可预报性研究进展[J]. 海洋科学进展, 2014, 32(3): 405−414. doi: 10.3969/j.issn.1671-6647.2014.03.012Liu Huafeng, Zhang Xiangming, Tang Youmin, et al. A review of the studies on Indian Ocean dipole and its predictability[J]. Advances in Marine Science, 2014, 32(3): 405−414. doi: 10.3969/j.issn.1671-6647.2014.03.012 [19] Wajsowicz R C. Potential predictability of tropical Indian Ocean SST anomalies[J]. Geophysical Research Letters, 2005, 32(24): L24702. doi: 10.1029/2005GL024169 [20] Wajsowicz R C. Seasonal-to-interannual forecasting of tropical Indian Ocean sea surface temperature anomalies: potential predictability and barriers[J]. Journal of Climate, 2007, 20(13): 3320−3343. doi: 10.1175/JCLI4162.1 [21] Luo Jingjia, Masson S, Behera S, et al. Experimental forecasts of the Indian Ocean dipole using a coupled OAGCM[J]. Journal of Climate, 2007, 20(10): 2178−2190. doi: 10.1175/JCLI4132.1 [22] Kirtman B P, Min D, Infanti J M, et al. The North American multimodel ensemble: phase-1 seasonal-to-interannual prediction; phase-2 toward developing intraseasonal prediction[J]. Bulletin of the American Meteorological Society, 2014, 95(4): 585−601. doi: 10.1175/BAMS-D-12-00050.1 [23] Reynolds R W, Rayner N A, Smith T M, et al. An improved in situ and satellite SST analysis for climate[J]. Journal of Climate, 2002, 15(13): 1609−1625. doi: 10.1175/1520-0442(2002)015<1609:AIISAS>2.0.CO;2 [24] Shi Li, Hendon H H, Alves O, et al. How predictable is the Indian Ocean dipole?[J]. Monthly Weather Review, 2012, 140(12): 3867−3884. doi: 10.1175/MWR-D-12-00001.1 [25] Luo Jingjia, Masson S, Behera S, et al. Seasonal climate predictability in a coupled OAGCM using a different approach for ensemble forecasts[J]. Journal of Climate, 2005, 18(21): 4474−4497. doi: 10.1175/JCLI3526.1 [26] Becker E, van den Dool H, Zhang Qin. Predictability and forecast skill in NMME[J]. Journal of Climate, 2014, 27(15): 5891−5906. doi: 10.1175/JCLI-D-13-00597.1 [27] Pillai P A, Rao S A, Ramu D A, et al. Seasonal prediction skill of Indian summer monsoon rainfall in NMME models and monsoon mission CFSv2[J]. International Journal of Climatology, 2018, 38(S1): e847−e861. [28] Palmer T N, Alessandri A, Andersen U, et al. Development of a European multimodel ensemble system for seasonal-to-interannual prediction (DEMETER)[J]. Bulletin of the American Meteorological Society, 2004, 85(6): 853−872. doi: 10.1175/BAMS-85-6-853 [29] Yan Xiaoqin, Tang Youmin. An analysis of multi-model ensembles for seasonal climate predictions[J]. Quarterly Journal of the Royal Meteorological Society, 2013, 139(674): 1179−1198. doi: 10.1002/qj.2020 [30] Efron B. Bootstrap methods: another look at the jackknife[J]. The Annals of Statistics, 1979, 7(1): 1−26. doi: 10.1214/aos/1176344552 [31] Liu Huafeng, Tang Youmin, Chen Dake, et al. Predictability of the Indian Ocean Dipole in the coupled models[J]. Climate Dynamics, 2017, 48(5/6): 2005−2024. [32] Wu Yanling, Tang Youmin. Seasonal predictability of the tropical Indian Ocean SST in the North American multimodel ensemble[J]. Climate Dynamics, 2019, 53(5/6): 3361−3372. [33] Chen Dake. Indo-Pacific tripole: an intrinsic mode of tropical climate variability[M]//Gan Jianping. Advances in Geosciences: Volume 24: Ocean Science (OS). Singapore: World Scientific, 2011: 1-18. [34] Ham Y G, Choi J Y, Kug J S. The weakening of the ENSO–Indian Ocean Dipole (IOD) coupling strength in recent decades[J]. Climate Dynamics, 2017, 49(1/2): 249−261. [35] Wang Chunzai, Weisberg R H, Virmani J I. Western Pacific interannual variability associated with the El Niño-Southern Oscillation[J]. Journal of Geophysical Research: Oceans, 1999, 104(C3): 5131−5149. doi: 10.1029/1998JC900090 [36] Gill A E. Some simple solutions for heat-induced tropical circulation[J]. Quarterly Journal of the Royal Meteorological Society, 1980, 106(449): 447−462. doi: 10.1002/qj.49710644905 [37] Song Xunshu, Tang Youmin, Chen Dake. Decadal variation in IOD predictability during 1881−2016[J]. Geophysical Research Letters, 2018, 45(23): 12948−12956. -

计量
- 文章访问数: 579
- HTML全文浏览量: 139
- PDF下载量: 34
- 被引次数: 0
