

An abnormal sea surface warming event as Typhoon Bolaven passes the Yellow Sea
-
摘要: 海洋对台风的响应通常表现为海表温度的降低,然而,出现在2012年8月的台风“布拉万”在经过黄海时却引起朝鲜半岛木浦沿岸海域海表的增温(而非降温),且增温幅度达4.2°C。本研究详细分析了此次异常事件的时空特征,并探讨了其可能的成因。结果发现,此次事件的产生和黄海表层冷水斑块(Surface Cold Patch,SCP)存在密切关系,并恰好出现在木浦SCP所在位置。上升流和潮混合是木浦SCP的两大形成机制,此次增温事件主要是台风“布拉万”通过抑制其生成机制之一的上升流而导致降温不足之故。具体而言,台风“布拉万”过境时位于木浦SCP的左侧,其上的北向风应力带来向岸的Ekman输运,造成外围暖水在木浦SCP地区堆积,从而抑制了该地区原本的上升流(甚至变为下降流)。Abstract: The ocean response to typhoon is usually characterized by a cooling on the sea surface. In August 2012, however, a warming (instead of cooling) event occurs in the Yellow Sea outside Mokpo, South Korea, as the typhoon Bolaven (2012) passes. This study gives a report of this abnormal sea surface warming, and provides an exploration of the underlying dynamical processes. It is found that the event coincides in location with the Yellow Sea Surface Cold Patch (SCP) outside Mokpo; Typhoon Bolaven (2012) suppresses the surface cooling due to SCP and hence leads to the abnormal warming. Of the two basic mechanisms that account for the formation of SCPs, i.e., tidal mixing and upwelling, the latter shows a drastic response to the typhoon passage−the upwelling is turned into a downwelling. The downwelling arises from the onshore Ekman transport generated by the northward wind stress on the left hand side of the Mokpo SCP.
-
Key words:
- typhoon /
- surface cold patch /
- Yellow Sea /
- ocean response /
- upwelling /
- air-sea interaction
-
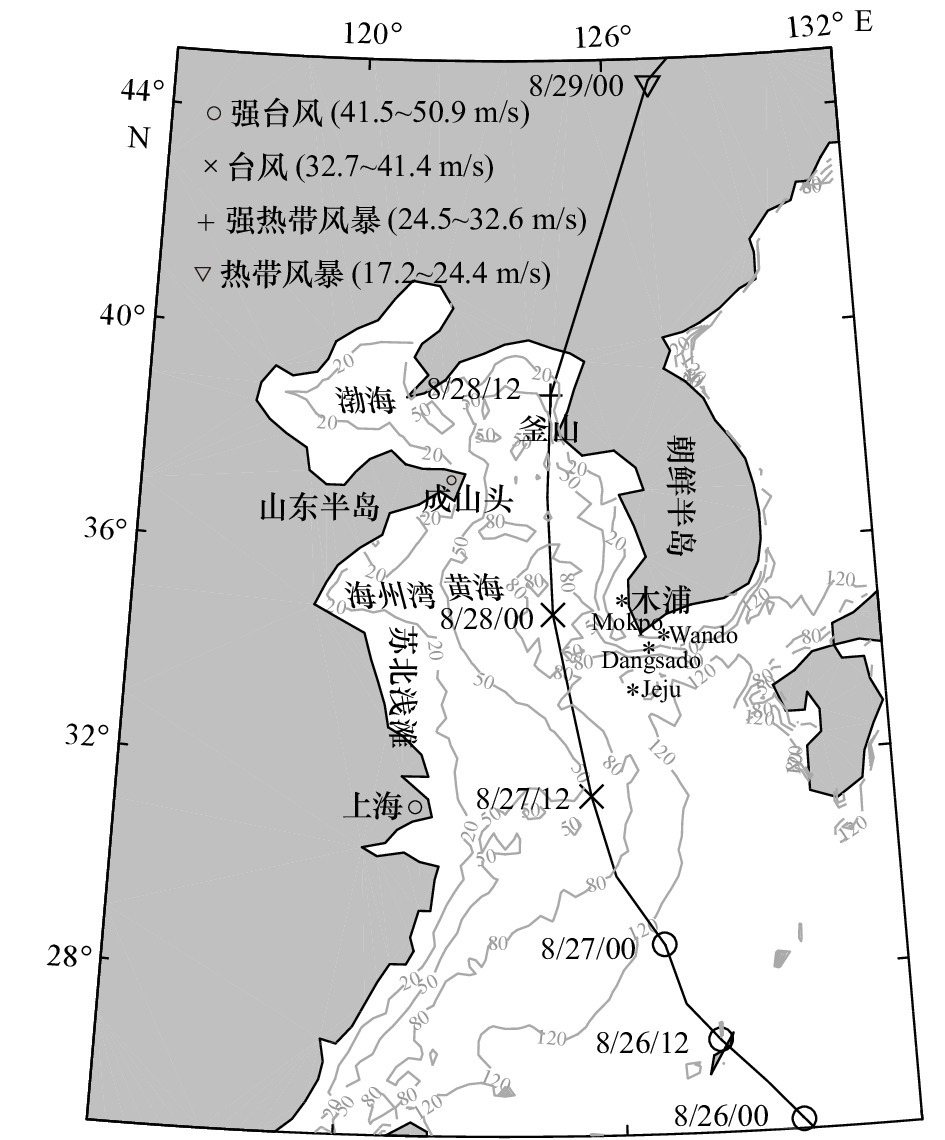
图 1 台风“布拉万”最佳路径(黑线)
星号标记出了Mokpo、Wando、Dangsado和Jeju水文站点的位置
Fig. 1 Best track of Typhoon Bolaven (black line)
The black stars indicate the locations of the observation stations: Mokpo, Wando, Dangsado, and Jeju
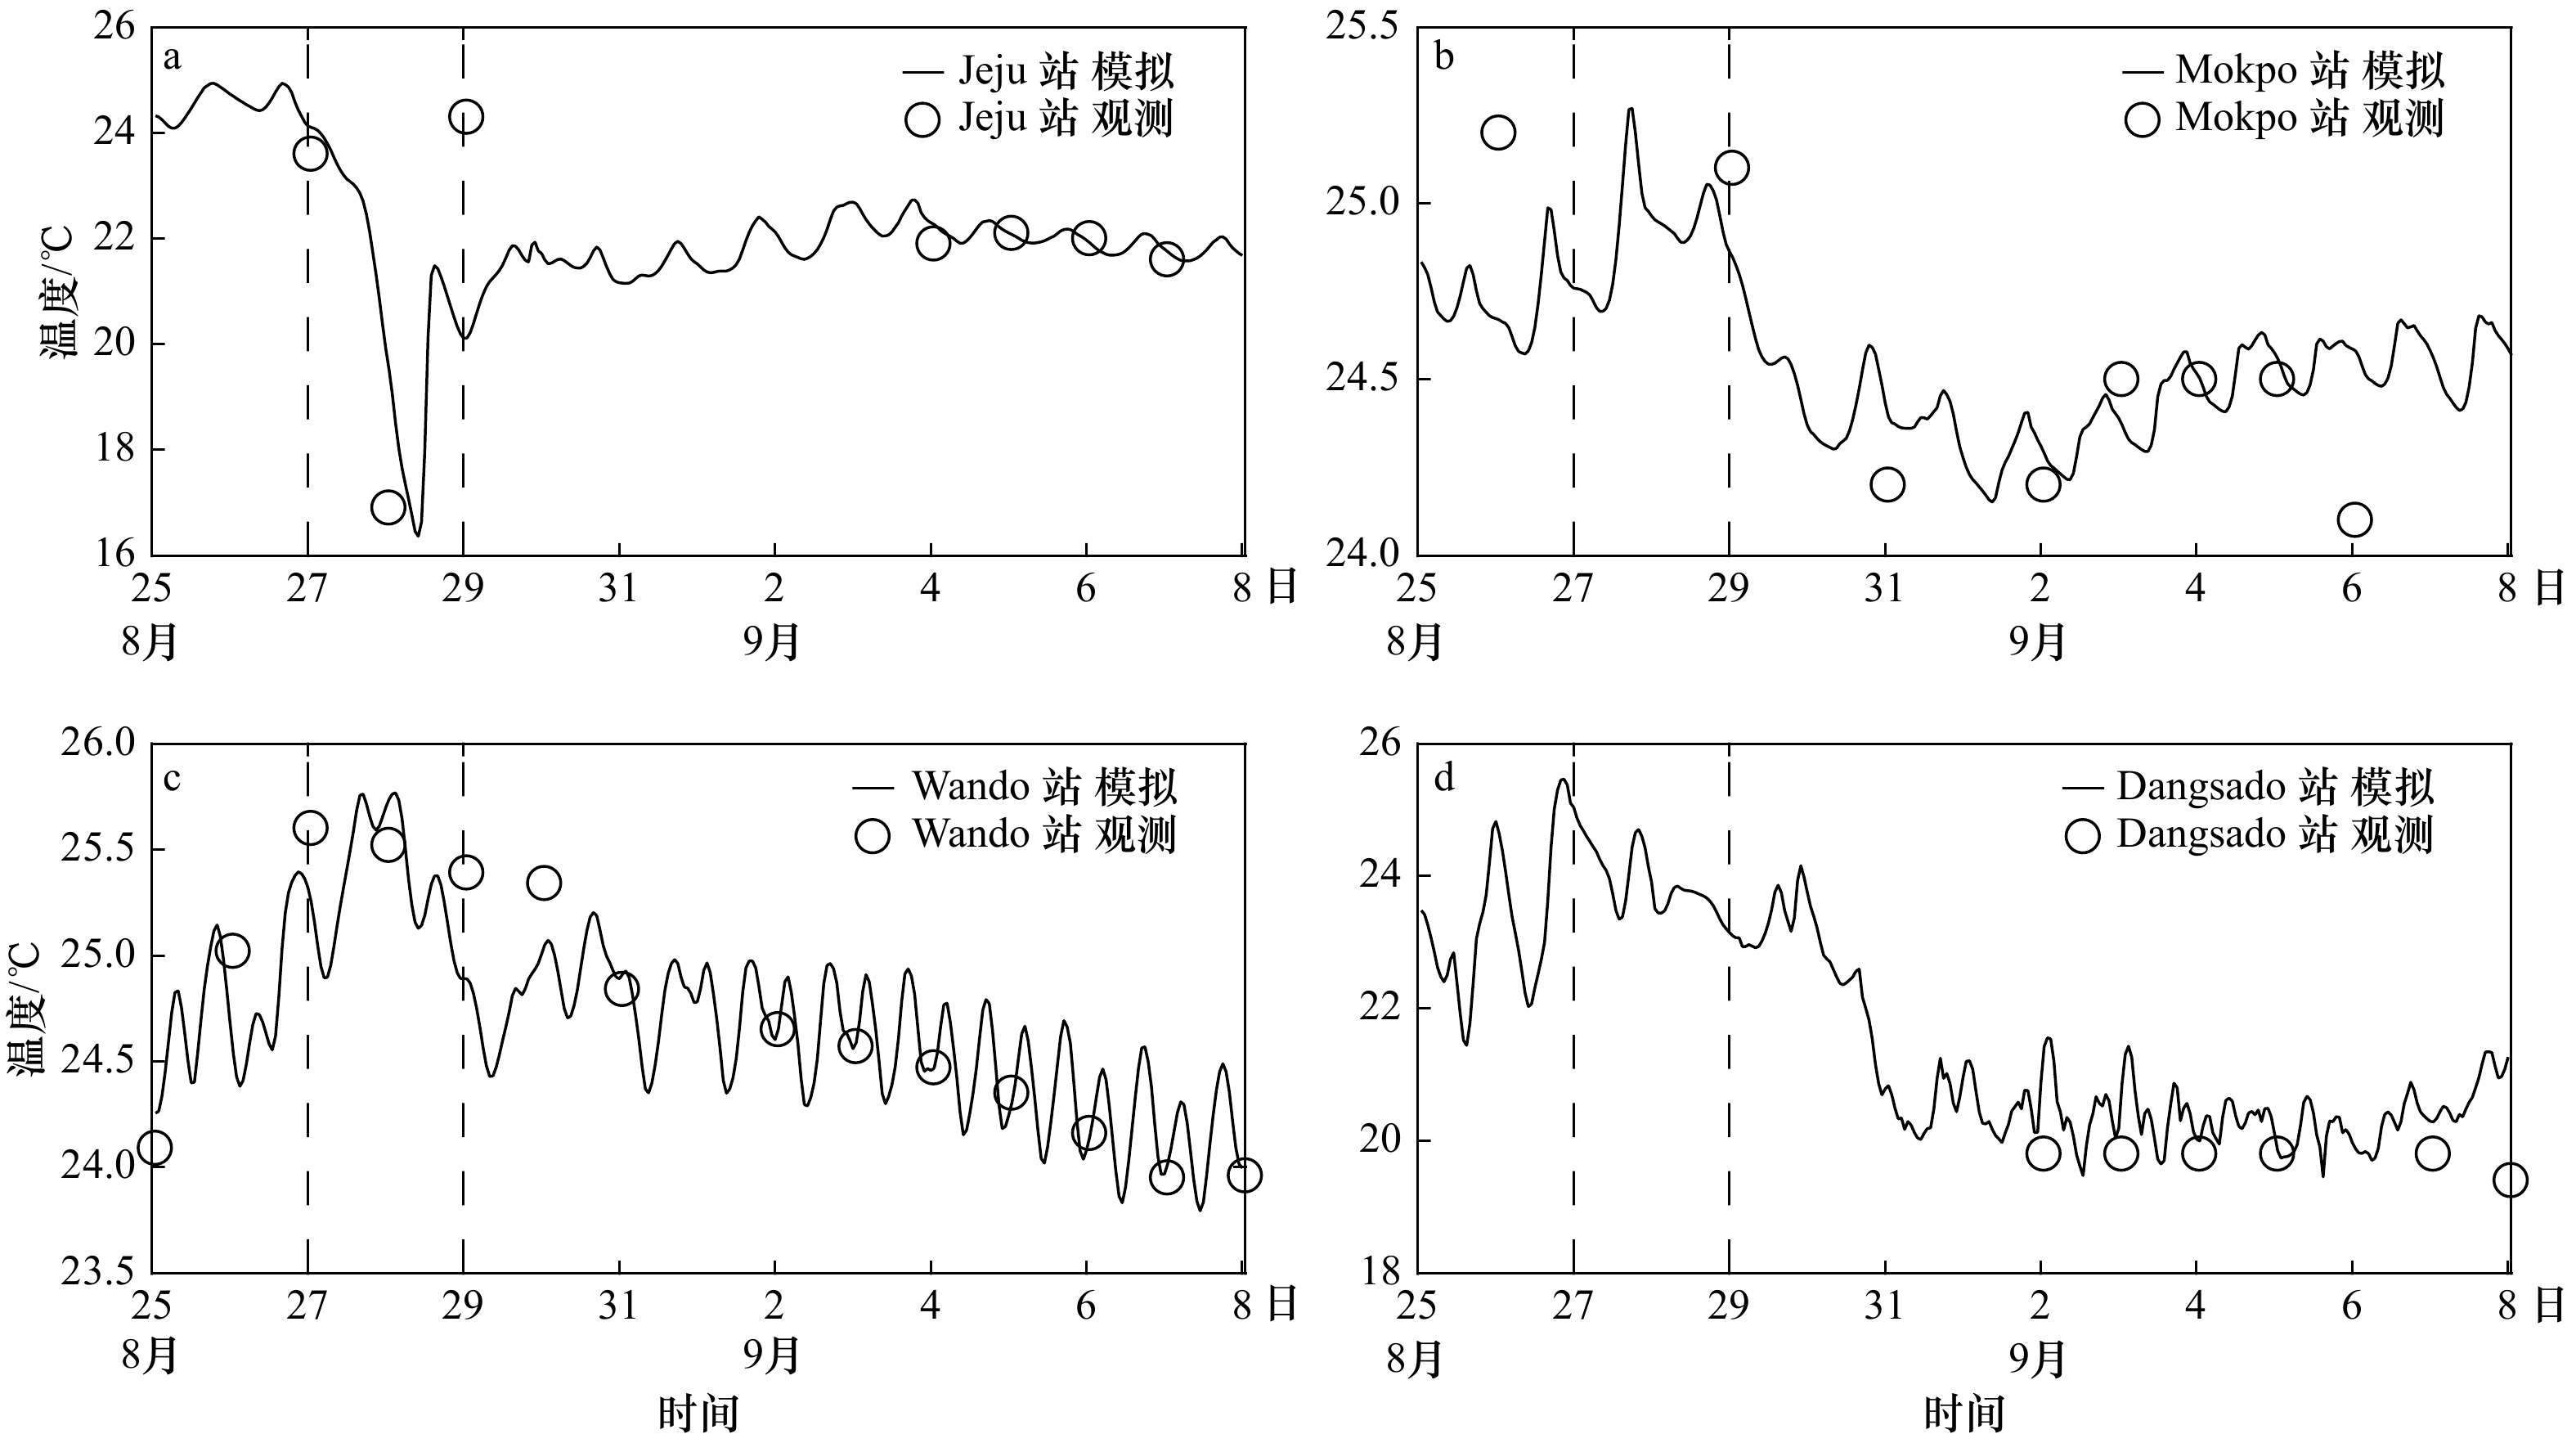
图 2 Jeju站点(a)、Mokpo站点(b)、Wando站点(c)和Dangsado站点(d)逐日SST观测数据和ECOM-si的逐小时输出结果
黑色虚线标出了台风过境时段,即在该时段内木浦表层冷水斑块位于台风7级(风速为13.9~17.1 m/s)风圈内
Fig. 2 Sea surface temperature at the Jeju Station (a), Guansan Station (b), Wando Station (c) and Dangsado Station (d) from the daily SST observing data and hourly output by ECOM-si model
Black dashed lines mark the period when the Typhoon Bolaven passes, i.e., in the period when the Mokpo SCP is located within the area enclosed by a speed contour line of 13.9–17.1 m/s

图 3 2012年8月25日和8月29日研究区SST的差值(后者减前者)分布
W1标示区域即为本文所研究的增温区域
Fig. 3 SST increase in the study area from 25 August to 29 August, 2012
W1 marks the warming area in this paper
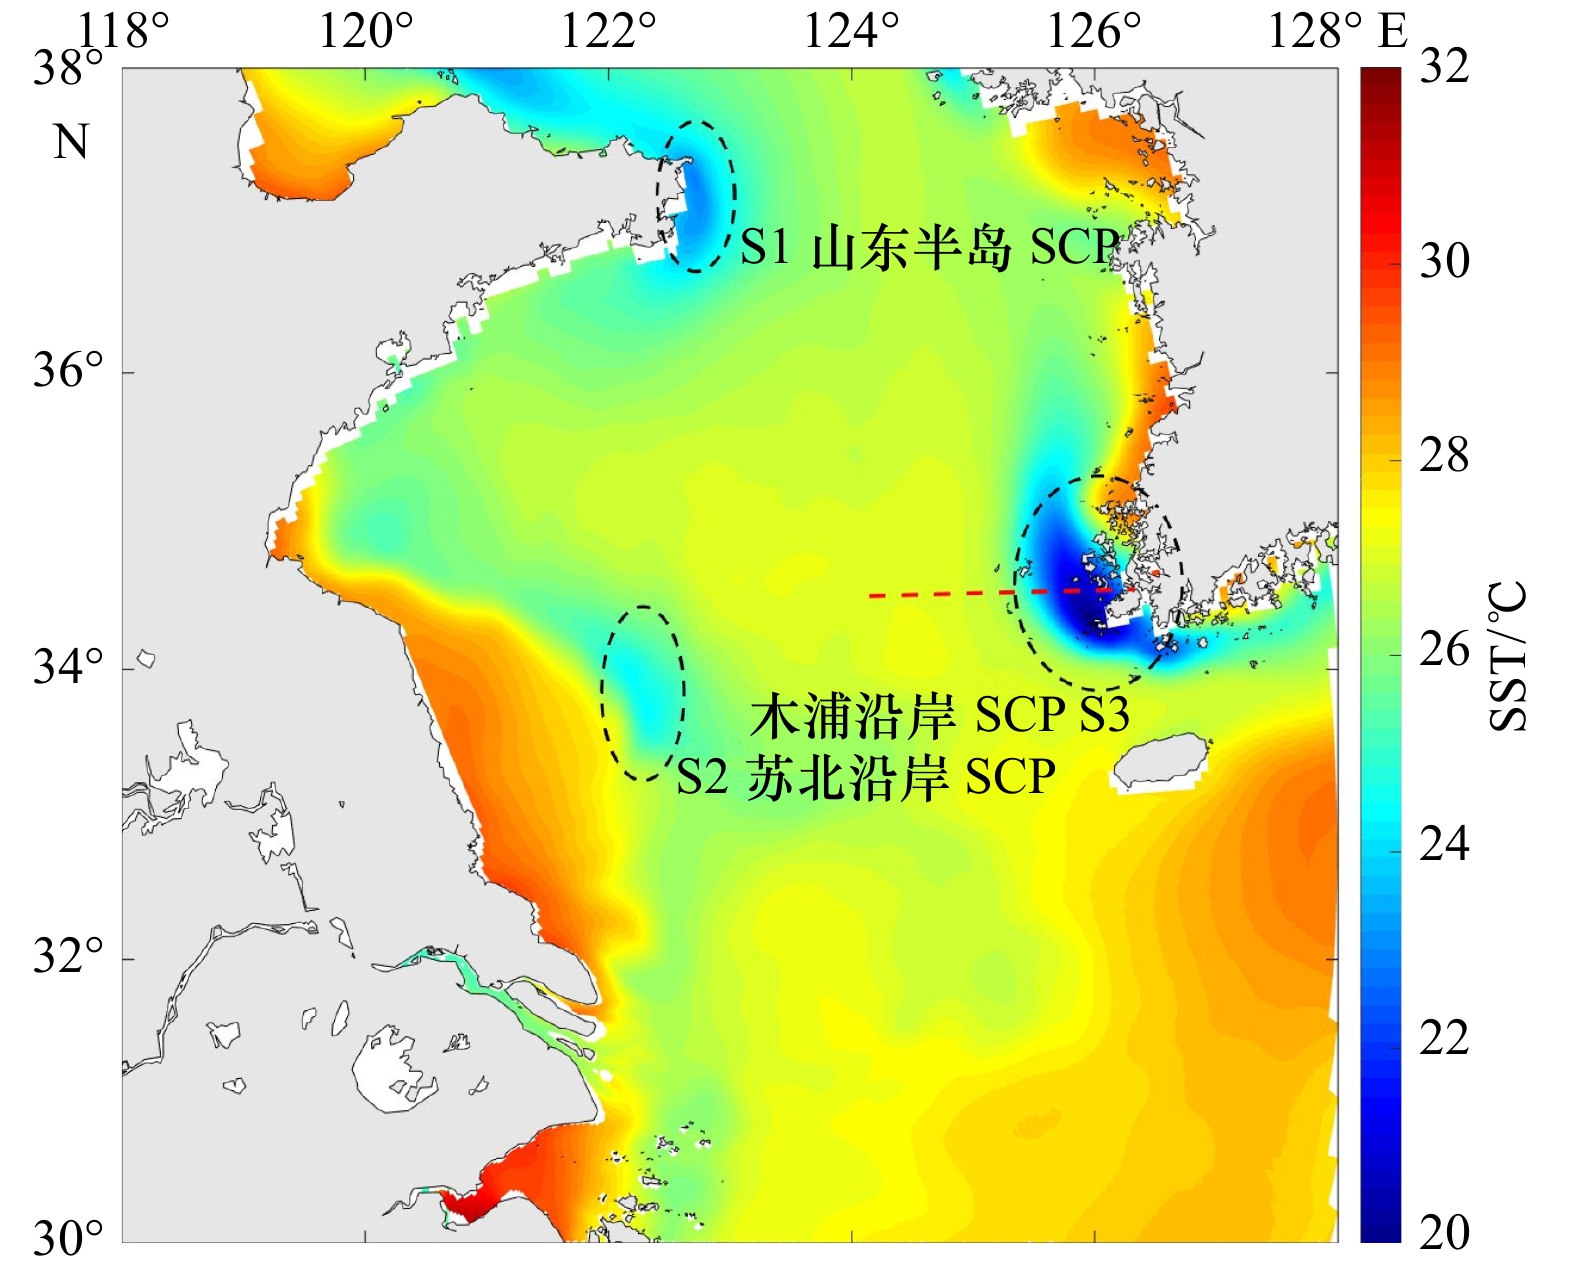
图 4 2012年8月平均的ECOM-si SST分布
黑色椭圆圈S1、S2和S3分别标示出了山东半岛、苏北沿岸以及木浦沿岸SCP,红色虚线为下文沿34.55°N所取截面的位置
Fig. 4 Distribution of the simulated average SST by ECOM-si model over August 2012
The three SCPs in the Shandong Peninsula area, Subei Coast and Mokpo area are marked with dashed ellipses S1, S2 and S3, respectively. Red line indicates the section at 34.55°N
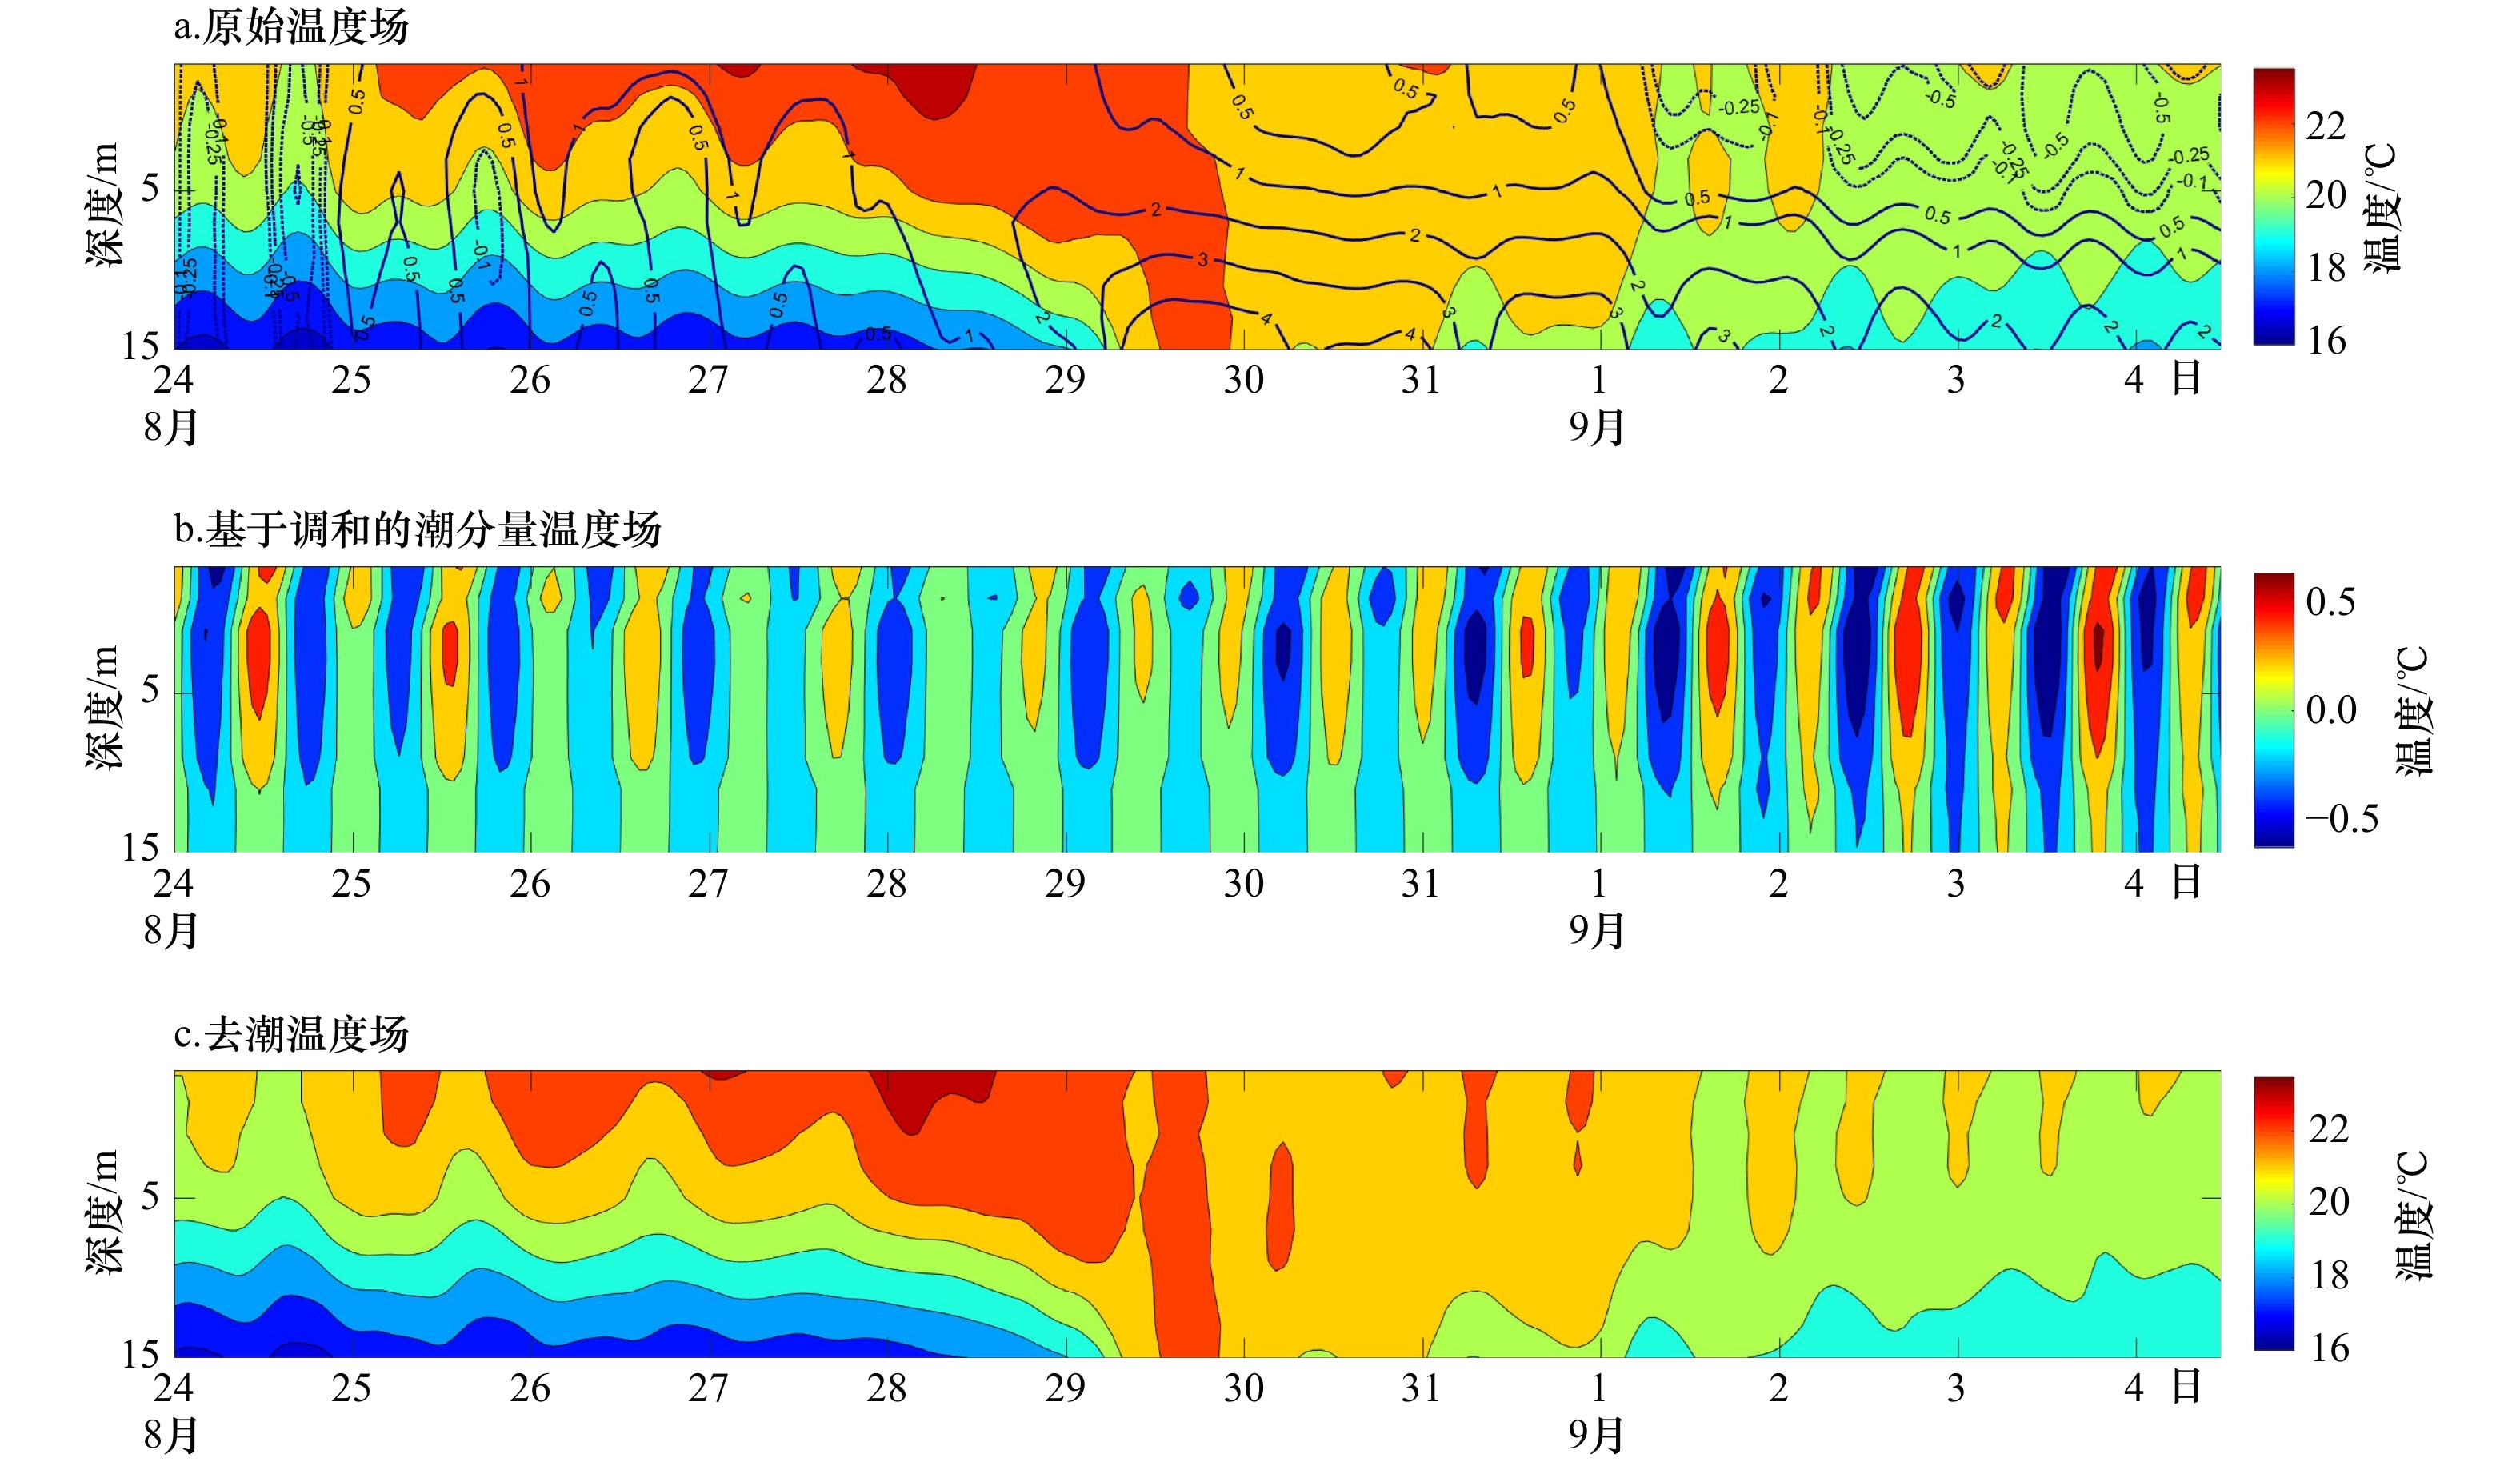
图 5 W1区平均温度的时间−深度演变
a中等值线是原始温度场相对8月24日00时的距平分布,实线表示正值,虚线表示负值
Fig. 5 Time-depth distribution of the simulated temperature averaged over the warming area W1
The contours in a show the temperature changes relative to the state at 00 on August 24. Positive and negative contours are indicated with solid lines and dashed lines respectively
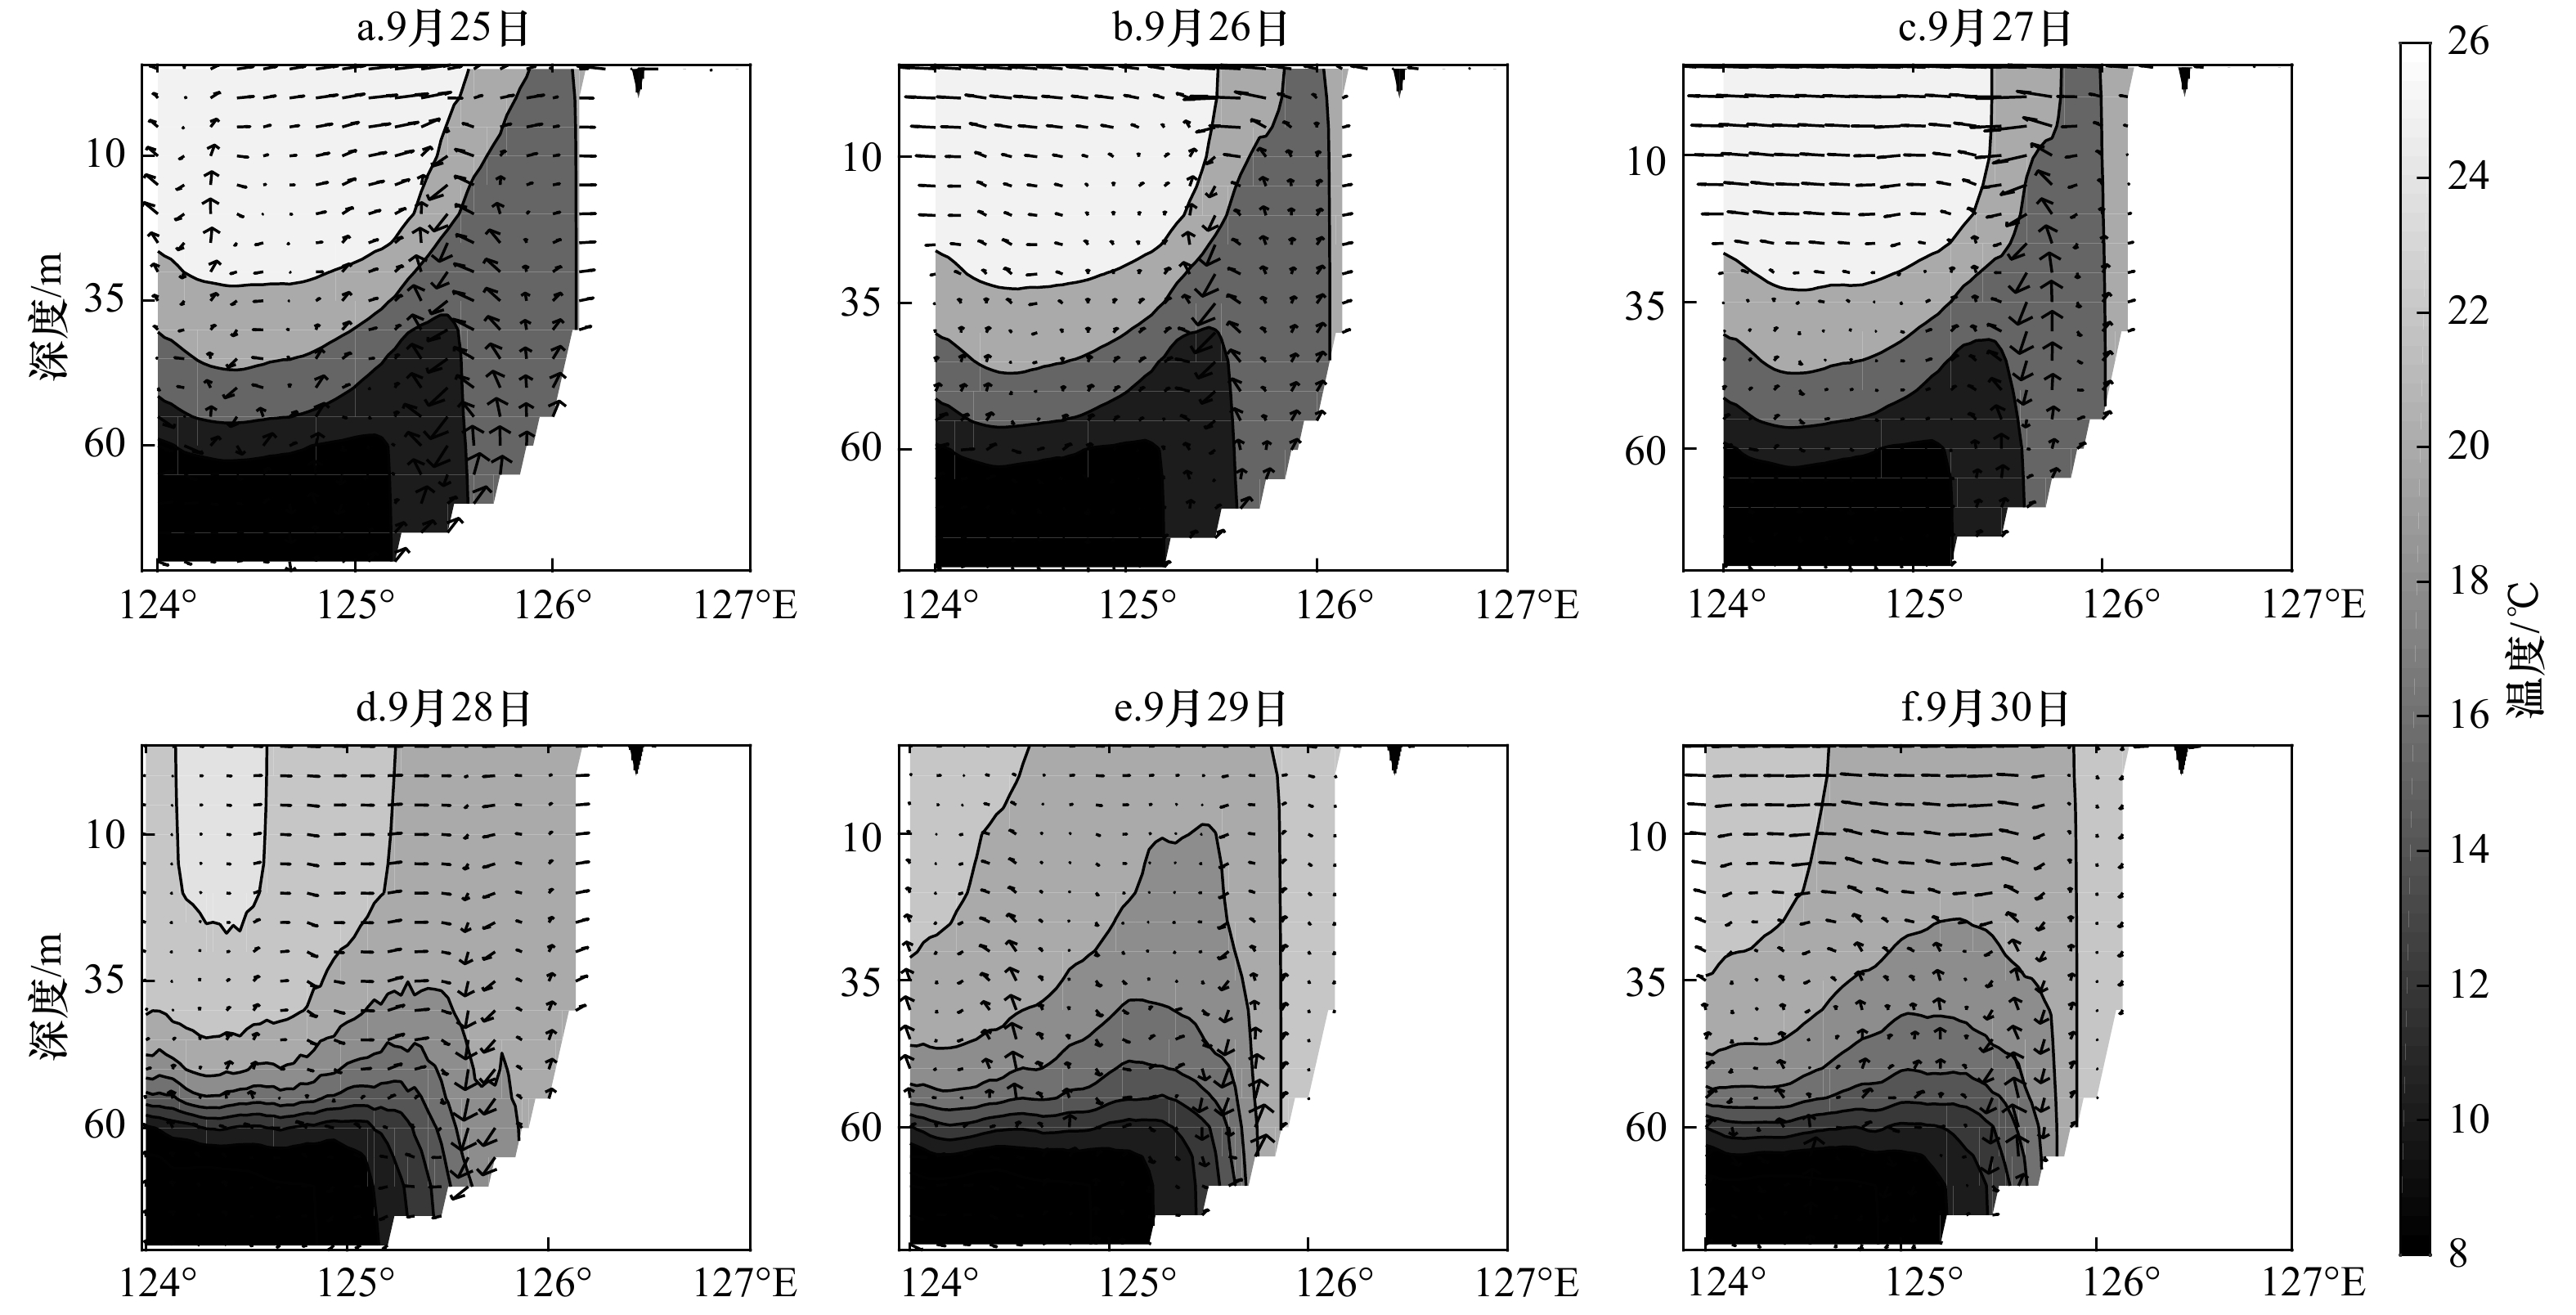
图 6 木浦SCP区域沿34.55°N的纬向垂直截面上的日平均环流场(箭头)和温度场(阴影)
垂直速度被扩大了1 000倍
Fig. 6 A sequence of the daily-averaged temperature (shade) and flow (arrow) on the transect across the Mokpo SCP along 34.55°N
The vertical velocity has been amplified by 1 000 times to better reveal the vector
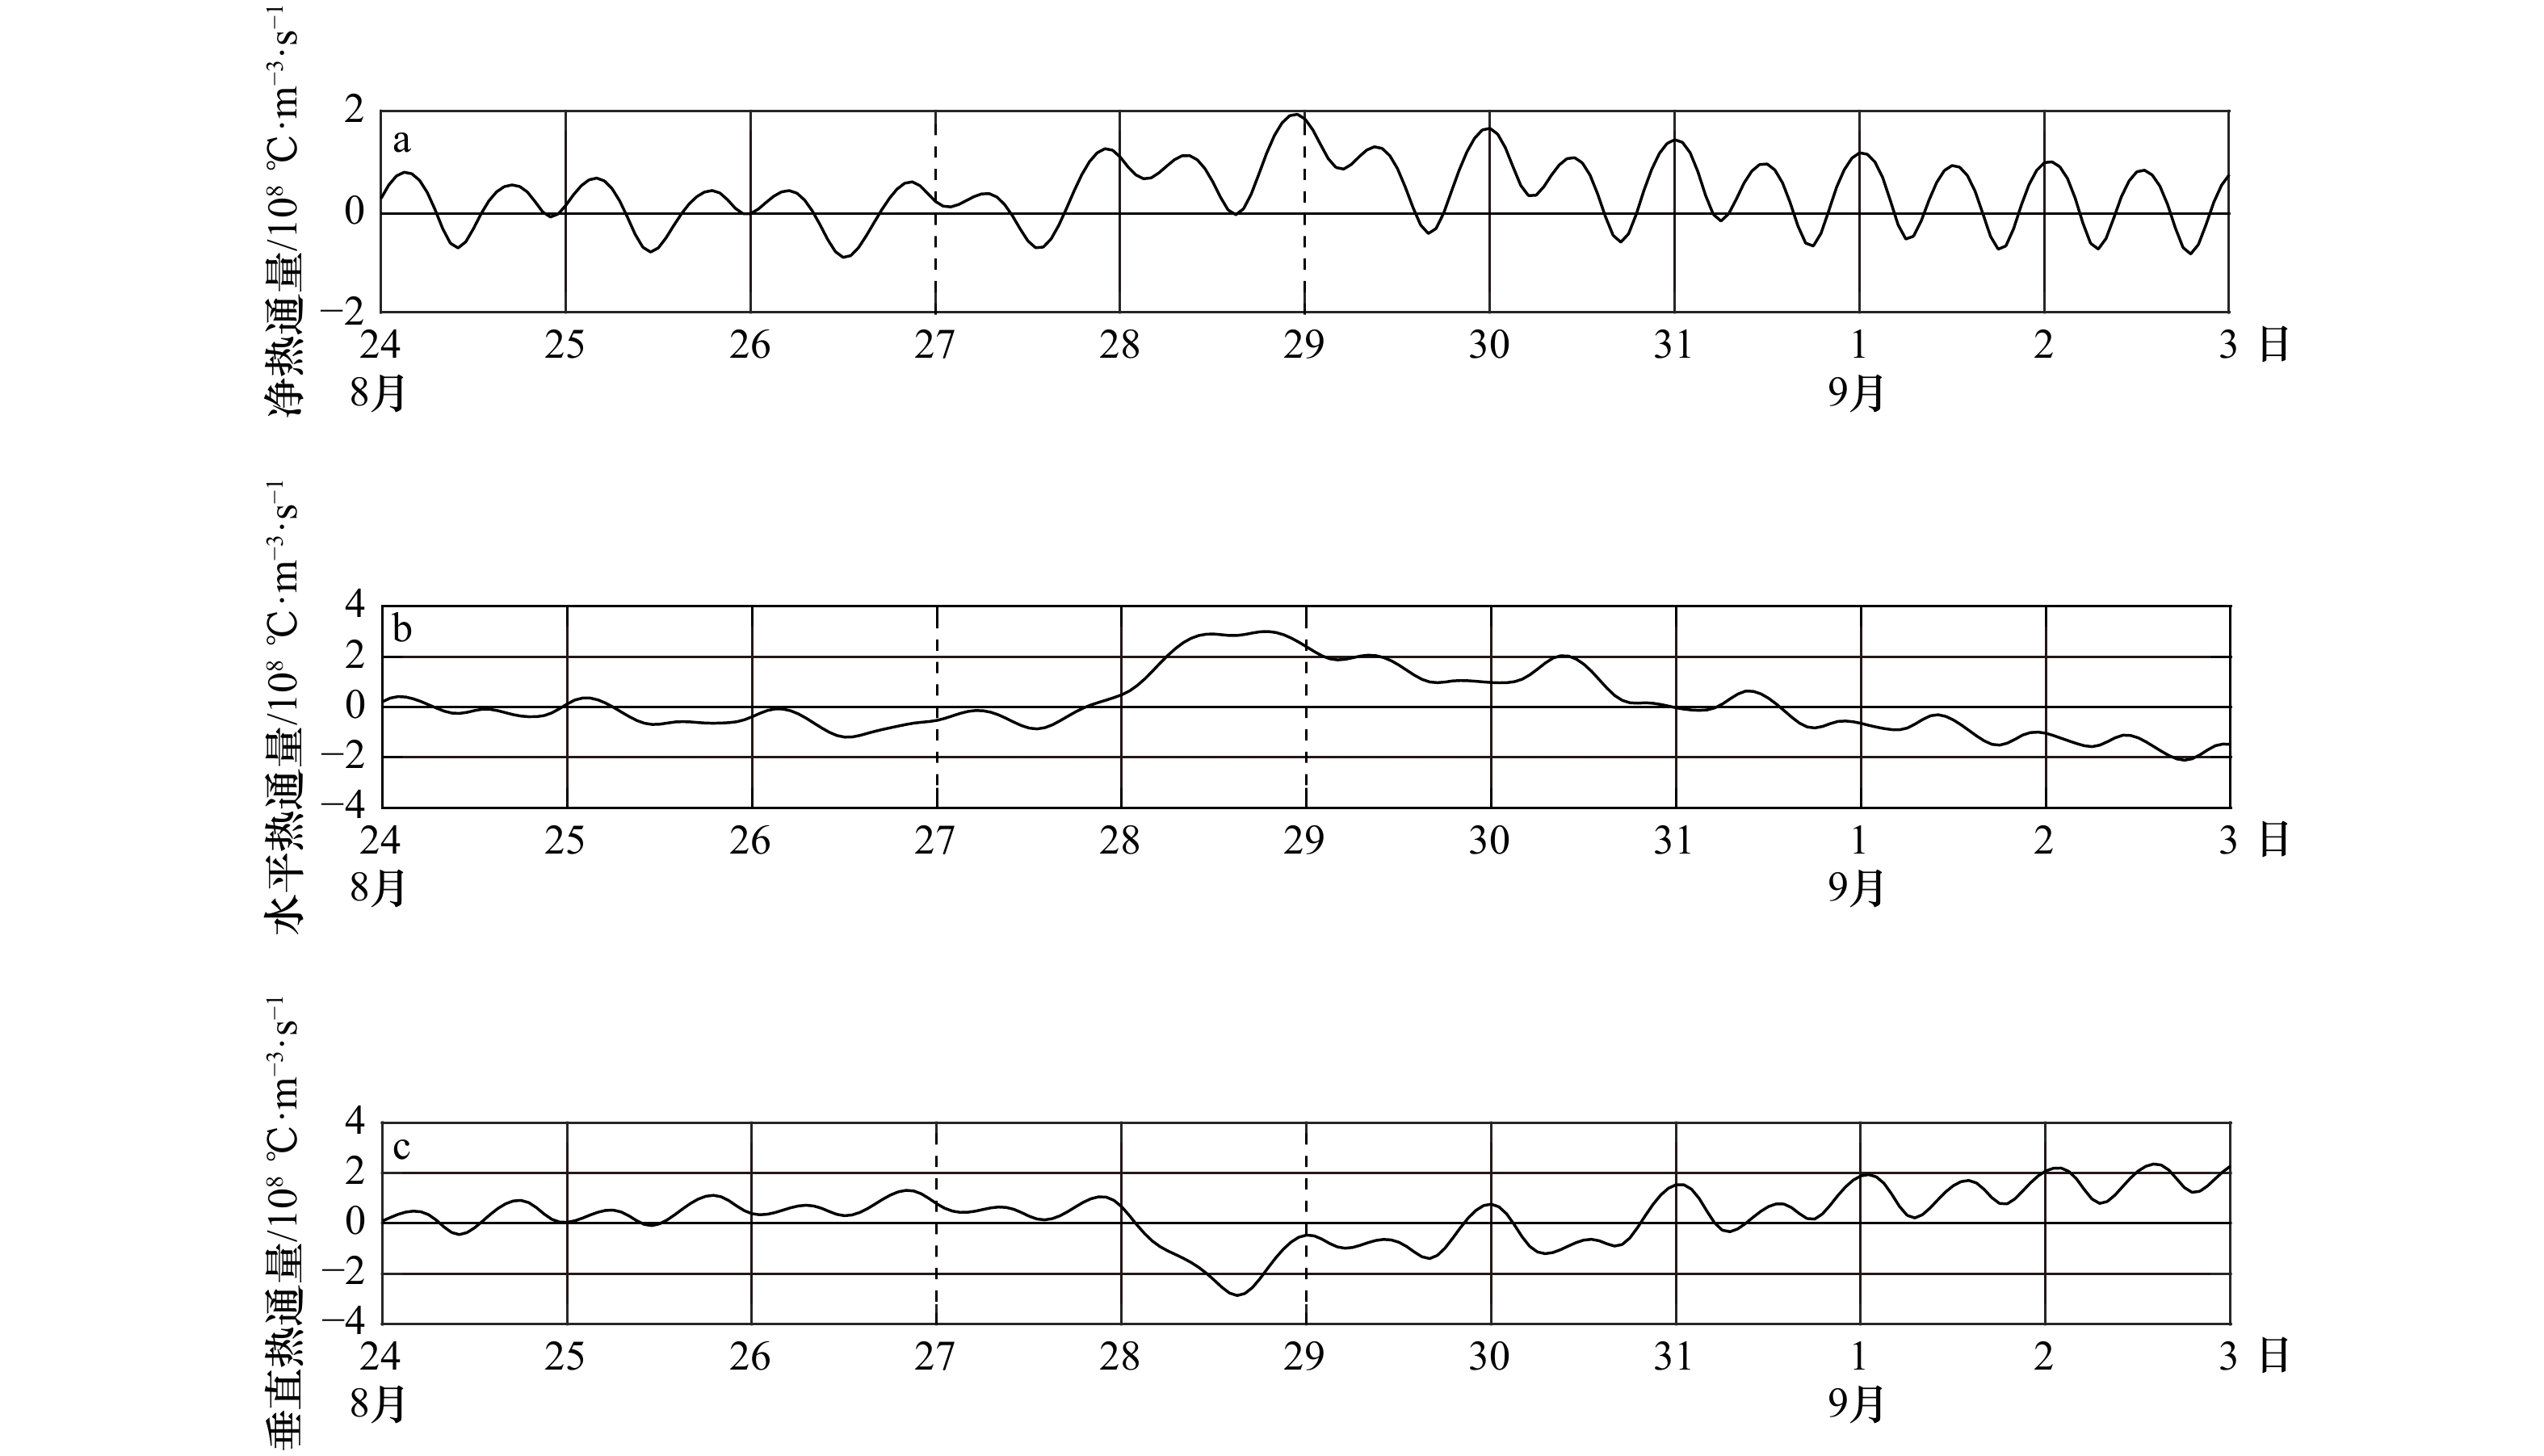
图 7 W1区域边界净热通量(a)、水平热通量(b)和垂直热通量(c)的时间变化
水平热通量为5个侧边界(图3)上的通量之和,垂直积分范围从表层到水深15 m;垂直热通量为W1区域内通过水深15 m层水平面进入上层的热量
Fig. 7 Time series of net (a), horizontal (b) and vertical (c) heat fluxes into the warming area W1
Horizontal heat fluxes is the sum of the fluxes across the five segments as marked in Fig.3, and the vertical integration range is from the surface to 15 m depth; the vertical heat fluxes is the heat entering the upper layer through the water depth of 15 m in the area W1
-
[1] 陈大可, 雷小途, 王伟, 等. 上层海洋对台风的响应和调制机理[J]. 地球科学进展, 2013, 28(10): 1077−1086. doi: 10.11867/j.issn.1001-8166.2013.10.1077Chen Dake, Lei Xiaotu, Wang Wei, et al. Upper ocean response and feedback mechanisms to typhoon[J]. Advances in Earth Science, 2013, 28(10): 1077−1086. doi: 10.11867/j.issn.1001-8166.2013.10.1077 [2] D’Asaro E A, Black P G, Centurioni L R, et al. Impact of typhoons on the ocean in the Pacific[J]. Bulletin of the American Meteorological Society, 2013, 95(9): 1405−1418. [3] He Hailun, Wu Qiaoyan, Chen Dake, et al. Effects of surface waves and sea spray on air–sea fluxes during the passage of Typhoon Hagupit[J]. Acta Oceanologica Sinica, 2018, 37(5): 1−7. doi: 10.1007/s13131-018-1208-2 [4] Han Guoqi, Ma Zhimin, Chen N, et al. Hurricane Isaac storm surges off Florida observed by Jason-1 and Jason-2 satellite altimeters[J]. Remote Sensing of Environment, 2017, 198: 244−253. doi: 10.1016/j.rse.2017.06.005 [5] Cheng Xuhua, Li Lijuan, Du Yan, et al. Mass-induced sea level change in the northwestern North Pacific and its contribution to total sea level change[J]. Geophysical Research Letters, 2013, 40(15): 3975−3980. doi: 10.1002/grl.50748 [6] Zhang Han, Chen Dake, Zhou Lei, et al. Upper ocean response to Typhoon Kalmaegi (2014)[J]. Journal of Geophysical Research: Oceans, 2016, 121(8): 6520−6535. doi: 10.1002/2016JC012064 [7] Li Yunhai, Wang Aijun, Qiao Lei, et al. The impact of Typhoon Morakot on the modern sedimentary environment of the mud deposition center off the Zhejiang–Fujian coast, China[J]. Continental Shelf Research, 2012, 37: 92−100. doi: 10.1016/j.csr.2012.02.020 [8] Price J F. Upper ocean response to a hurricane[J]. Journal of Physical Oceanography, 1981, 11(2): 153−175. doi: 10.1175/1520-0485(1981)011<0153:UORTAH>2.0.CO;2 [9] Chang G C, Dickey T D, Williams Ⅲ A J. Sediment resuspension over a continental shelf during Hurricanes Edouard and Hortense[J]. Journal of Geophysical Research: Oceans, 2001, 106(C5): 9517−9531. doi: 10.1029/2000JC900032 [10] Huang Wenrui, Mukherjee D, Chen Shuisen. Assessment of Hurricane Ivan impact on chlorophyll-a in Pensacola Bay by MODIS 250 m remote sensing[J]. Marine Pollution Bulletin, 2011, 62(3): 490−498. doi: 10.1016/j.marpolbul.2010.12.010 [11] D’Asaro S A, Sanford T B, Niiler P P, et al. Cold wake of Hurricane Frances[J]. Geophysical Research Letters, 2007, 34(15): L15609. [12] Yang Guangbing, Lü Liangang, Zhuang Zhanpeng, et al. Cruise observation of shallow water response to Typhoon Damrey 2012 in the Yellow Sea[J]. Continental Shelf Research, 2017, 148: 1−8. doi: 10.1016/j.csr.2017.09.006 [13] Chang Y C, Tseng R S, Centurioni L R. Typhoon-induced strong surface flows in the Taiwan Strait and Pacific[J]. Journal of Oceanography, 2010, 66(2): 175−182. doi: 10.1007/s10872-010-0015-y [14] Chiang T L, Wu C R, Oey L Y. Typhoon Kai-Tak: an ocean’s perfect storm[J]. Journal of Physical Oceanography, 2010, 41(1): 221−233. [15] Jacob S D, Shay L K, Mariano A J, et al. The 3D oceanic mixed layer response to Hurricane Gilbert[J]. Journal of Physical Oceanography, 2000, 30(6): 1407−1429. doi: 10.1175/1520-0485(2000)030<1407:TOMLRT>2.0.CO;2 [16] Liu Lingling, Wang Wei, Huang Ruixin. The mechanical energy input to the ocean induced by tropical cyclones[J]. Journal of Physical Oceanography, 2008, 38(6): 1253−1266. doi: 10.1175/2007JPO3786.1 [17] Subrahmanyam M V. Impact of typhoon on the north-west Pacific sea surface temperature: a case study of Typhoon Kaemi (2006)[J]. Natural Hazards, 2015, 78(1): 569−582. doi: 10.1007/s11069-015-1733-7 [18] Guan Shoude, Zhao Wei, Huthnance J, et al. Observed upper ocean response to Typhoon Megi (2010) in the Northern South China Sea[J]. Journal of Geophysical Research: Oceans, 2014, 119(5): 3134−3157. doi: 10.1002/2013JC009661 [19] Moon I J, Kwon S J. Impact of upper-ocean thermal structure on the intensity of Korean Peninsular landfall typhoons[J]. Progress in Oceanography, 2012, 105: 61−66. doi: 10.1016/j.pocean.2012.04.008 [20] Lee J H, Moon I J, Moon J H, et al. Impact of typhoons on the Changjiang plume extension in the Yellow and East China Seas[J]. Journal of Geophysical Research: Oceans, 2017, 122(6): 4962−4973. doi: 10.1002/2017JC012754 [21] Lin I I, Wu C C, Pun I F, et al. Upper-ocean thermal structure and the western north Pacific category 5 typhoons. Part I: ocean features and the category 5 typhoons’ intensification[J]. Monthly Weather Review, 2008, 136(9): 3288−3306. doi: 10.1175/2008MWR2277.1 [22] 李立, 许金殿. 近海对台风的响应注记──Ⅰ. 大亚湾海况对8708和8710号台风的综合响应[J]. 台湾海峡, 1994, 13(3): 213−218.Li Li, Xu Jindian. Notes on response of coastal waters to typhoon passage Ⅰ. Response of Daya Bay hydrological conditions to Typhoon No. 8708 and No. 8710[J]. Journal of Oceanography In Taiwan Strait, 1994, 13(3): 213−218. [23] Oey L Y, Ezer T, Wang D P, et al. Loop current warming by Hurricane Wilma[J]. Geophysical Research Letters, 2006, 33(8): L08613. [24] 谢玲玲, 何超凤, 李明明, 等. 琼东上升流区海表温度对台风过境的响应[J]. 海洋科学进展, 2017, 35(1): 8−19. doi: 10.3969/j.issn.1671-6647.2017.01.002Xie Lingling, He Chaofeng, Li Mingming, et al. Response of sea surface temperature to typhoon passages over the upwelling zone east of Hainan Island[J]. Advances in Marine Science, 2017, 35(1): 8−19. doi: 10.3969/j.issn.1671-6647.2017.01.002 [25] Wu Hui, Shen Jian, Zhu Jianrong, et al. Characteristics of the Changjiang plume and its extension along the Jiangsu Coast[J]. Continental Shelf Research, 2014, 76: 108−123. doi: 10.1016/j.csr.2014.01.007 [26] Mellor G L, Yamada T. A hierarchy of turbulence closure models for planetary boundary layers[J]. Journal of the Atmospheric Sciences, 2002, 31(7): 1791−1806. [27] Smagorinsky J. General circulation experiments with the primitive equations: I. the basic experiment[J]. Monthly Weather Review, 1963, 91(3): 99−164. doi: 10.1175/1520-0493(1963)091<0099:GCEWTP>2.3.CO;2 [28] Wu Hui, Zhu Jianrong, Shen Jian, et al. Tidal modulation on the Changjiang River plume in summer[J]. Journal of Geophysical Research: Oceans, 2011, 116(C8): C08017. [29] Huang Minghai, Liang X S, Wu Hui, et al. Different generating mechanisms for the summer surface cold patches in the Yellow Sea[J]. Atmosphere-Ocean, 2018, 56(4): 199−211. doi: 10.1080/07055900.2017.1371580 [30] Zhang Zhiwei, Wu Hui, Yin Xunqiang, et al. Dynamical response of Changjiang River plume to a severe typhoon with the surface wave-induced mixing[J]. Journal of Geophysical Research: Oceans, 2018, 123(12): 9369−9388. doi: 10.1029/2018JC014266 [31] Kim C S, Lim H S, Jeong J Y, et al. Responses of coastal waters in the Yellow Sea to Typhoon Bolaven[J]. Journal of Coastal Research, 2014, 70(S1): 278−283. [32] Liang X S. Unraveling the cause-effect relation between time series[J]. Physical Review E, 2014, 90(5): 052150. doi: 10.1103/PhysRevE.90.052150 [33] 夏综万, 郭炳火. 山东半岛和辽东半岛顶端附近水域的冷水现象及上升流[J]. 黄渤海海洋, 1983, 1(1): 13−19.Xia Zongwan, Guo Binghuo. Cold water and upwelling around the tips of Shandong Peninsula and Liaodong Peninsula[J]. Journal of Oceanography of Huanghai & Bohai Seas, 1983, 1(1): 13−19. [34] Garrett C J R, Loucks H. Upwelling along the Yarmouth shore of nova scotia[J]. Journal of the Fisheries Research Board of Canada, 1976, 33(1): 116−117. doi: 10.1139/f76-013 [35] Lie H J. Summertime hydrographic features in the southeastern Hwanghae[J]. Progress in Oceanography, 1986, 17(3/4): 229−242. [36] Kim K, Rho H G, Lee S H. Water masses and circulation around Cheju-Do in summer[J]. Journal of the Oceanological Society of Korea, 1991, 26: 262−277. [37] Lü Xingang, Qiao Fangli, Xia Changshui, et al. Upwelling and surface cold patches in the Yellow Sea in summer: Effects of tidal mixing on the vertical circulation[J]. Continental Shelf Research, 2010, 30(6): 620−632. doi: 10.1016/j.csr.2009.09.002 [38] Ren Shihe, Xie Jiping, Zhu Jiang. The roles of different mechanisms related to the tide-induced fronts in the Yellow Sea in summer[J]. Advances in Atmospheric Sciences, 2014, 31(5): 1079−1089. doi: 10.1007/s00376-014-3236-y [39] Teague W J, Perkins H T, Hallock Z R, et al. Current and tide observations in the southern Yellow Sea[J]. Journal of Geophysical Research: Oceans, 1998, 103(C12): 27783−27793. doi: 10.1029/98JC02672 [40] Pawlowicz R, Beardsley B, Lentz S. Classical tidal harmonic analysis including error estimates in MATLAB using T_TIDE[J]. Computers & Geosciences, 2002, 28(8): 929−937. -

 下载:
下载:

计量
- 文章访问数: 301
- HTML全文浏览量: 49
- PDF下载量: 34
- 被引次数: 0
