

Chlorophyll a concentration response to the typhoon “wind pump” and the Kuroshio in the northeastern South China Sea
-
摘要: 南海东北部是寡营养海域,夏季浮游植物叶绿素浓度较低,热带气旋“风泵”效应带来的上层海洋扰动可能引起表层浮游植物的显著增长。以往的研究通常关注热带气旋风应力和海洋中尺度涡对上层海洋浮游植物的影响,本文利用航次CTD、实测叶绿素a浓度、Argo温盐剖面和遥感数据,探讨了台风“风泵”和黑潮共同作用下真光层内浮游植物的变化特征及其成因。结果表明,2015年台风“莲花”过境1周后产生向吕宋海峡西北侧南海海域(A区)入侵的黑潮流套,该入侵的黑潮流套使台风前原有的气旋涡消失,抑制了台风产生的上升流对表层(0~40 m)营养盐供给,使次表层(60~90 m)营养盐富集,进而抑制了表层的叶绿素a增长,促进了次表层叶绿素a的增长;吕宋海峡西侧南海海域(B区)表层的浮游植物叶绿素a浓度增加不仅是源于叶绿素最大层浮游植物的向上输运,更是由于浮游植物的繁殖增长;A区台风引起的流套式的黑潮入侵,促进了B区台风后气旋式流场的形成,产生的持续增强的气旋涡为B区表层叶绿素持续增长提供了充足的营养盐供给。Abstract: The northeastern South China Sea is oligotrophic. In summer, the northeastern South China Sea is low in phytoplankton chlorophyll a (Chl a) concentration, and the typhoon “wind pump” induced upper ocean turbulence can transport nutrients upwards, and therefore increase the Chl a concentration in the surface and subsurface layers. Previous studies have generally focused on the effects of tropical cyclonic wind stress and ocean mesoscale eddies on the Chl a concentration in the upper ocean. This study investigates the possible effect of the Kuroshio to the Chl a concentration in the euphotic layer after typhoon using CTD data, in situ Chl a concentration, Argo profiles and remote sensing data. The results show that the Typhoon Linfa in 2015 caused a looping path of the Kuroshio intrusion into the South China Sea (Area A) through the northwestern Luzon Strait, which weakened the pre-existing cyclonic eddy after the typhoon. This typhoon “wind pump” enhanced Kuroshio inhibited the uplift of nutrients to the surface layer (0−40 m) through the typhoon Ekman Pumping, and accumulated the nutrient in the subsurface layer (60−90 m), thereby inhibiting the increase of surface Chl a concentration but promoting the growth of subsurface Chl a concentration. The increase of Chl a concentration over the western Luzon in the South China Sea (Area B) was not only the vertical redistribution of the phytoplankton, but especially the growth of the phytoplankton. The typhoon-induced looping path of Kuroshio over the northwestern Luzon promoted the formation of the cyclonic eddy over the western Luzon. This continuously enhancing cyclonic eddy provided sufficient nutrients for the significant increase of the chlorophyll in the surface layer (0−40 m).
-

图 1 研究区域及台风路径
等值线表示水深(单位:m),黑色方框表示研究区域A,粉色方框表示研究区域B,黑色折线表示台风路径,黑色带点线段表示Argo1浮标位置,粉色带点线段表示Argo2浮标位置
Fig. 1 The study area and typhoon path
The contour indicates the water depth (unit: m), the black box represents the study Area A, the pink box represents the study Area B, black line means the path of typhoon, the black line with dots represents the location of Argo1, the pink line with dots represents the location of Argo2
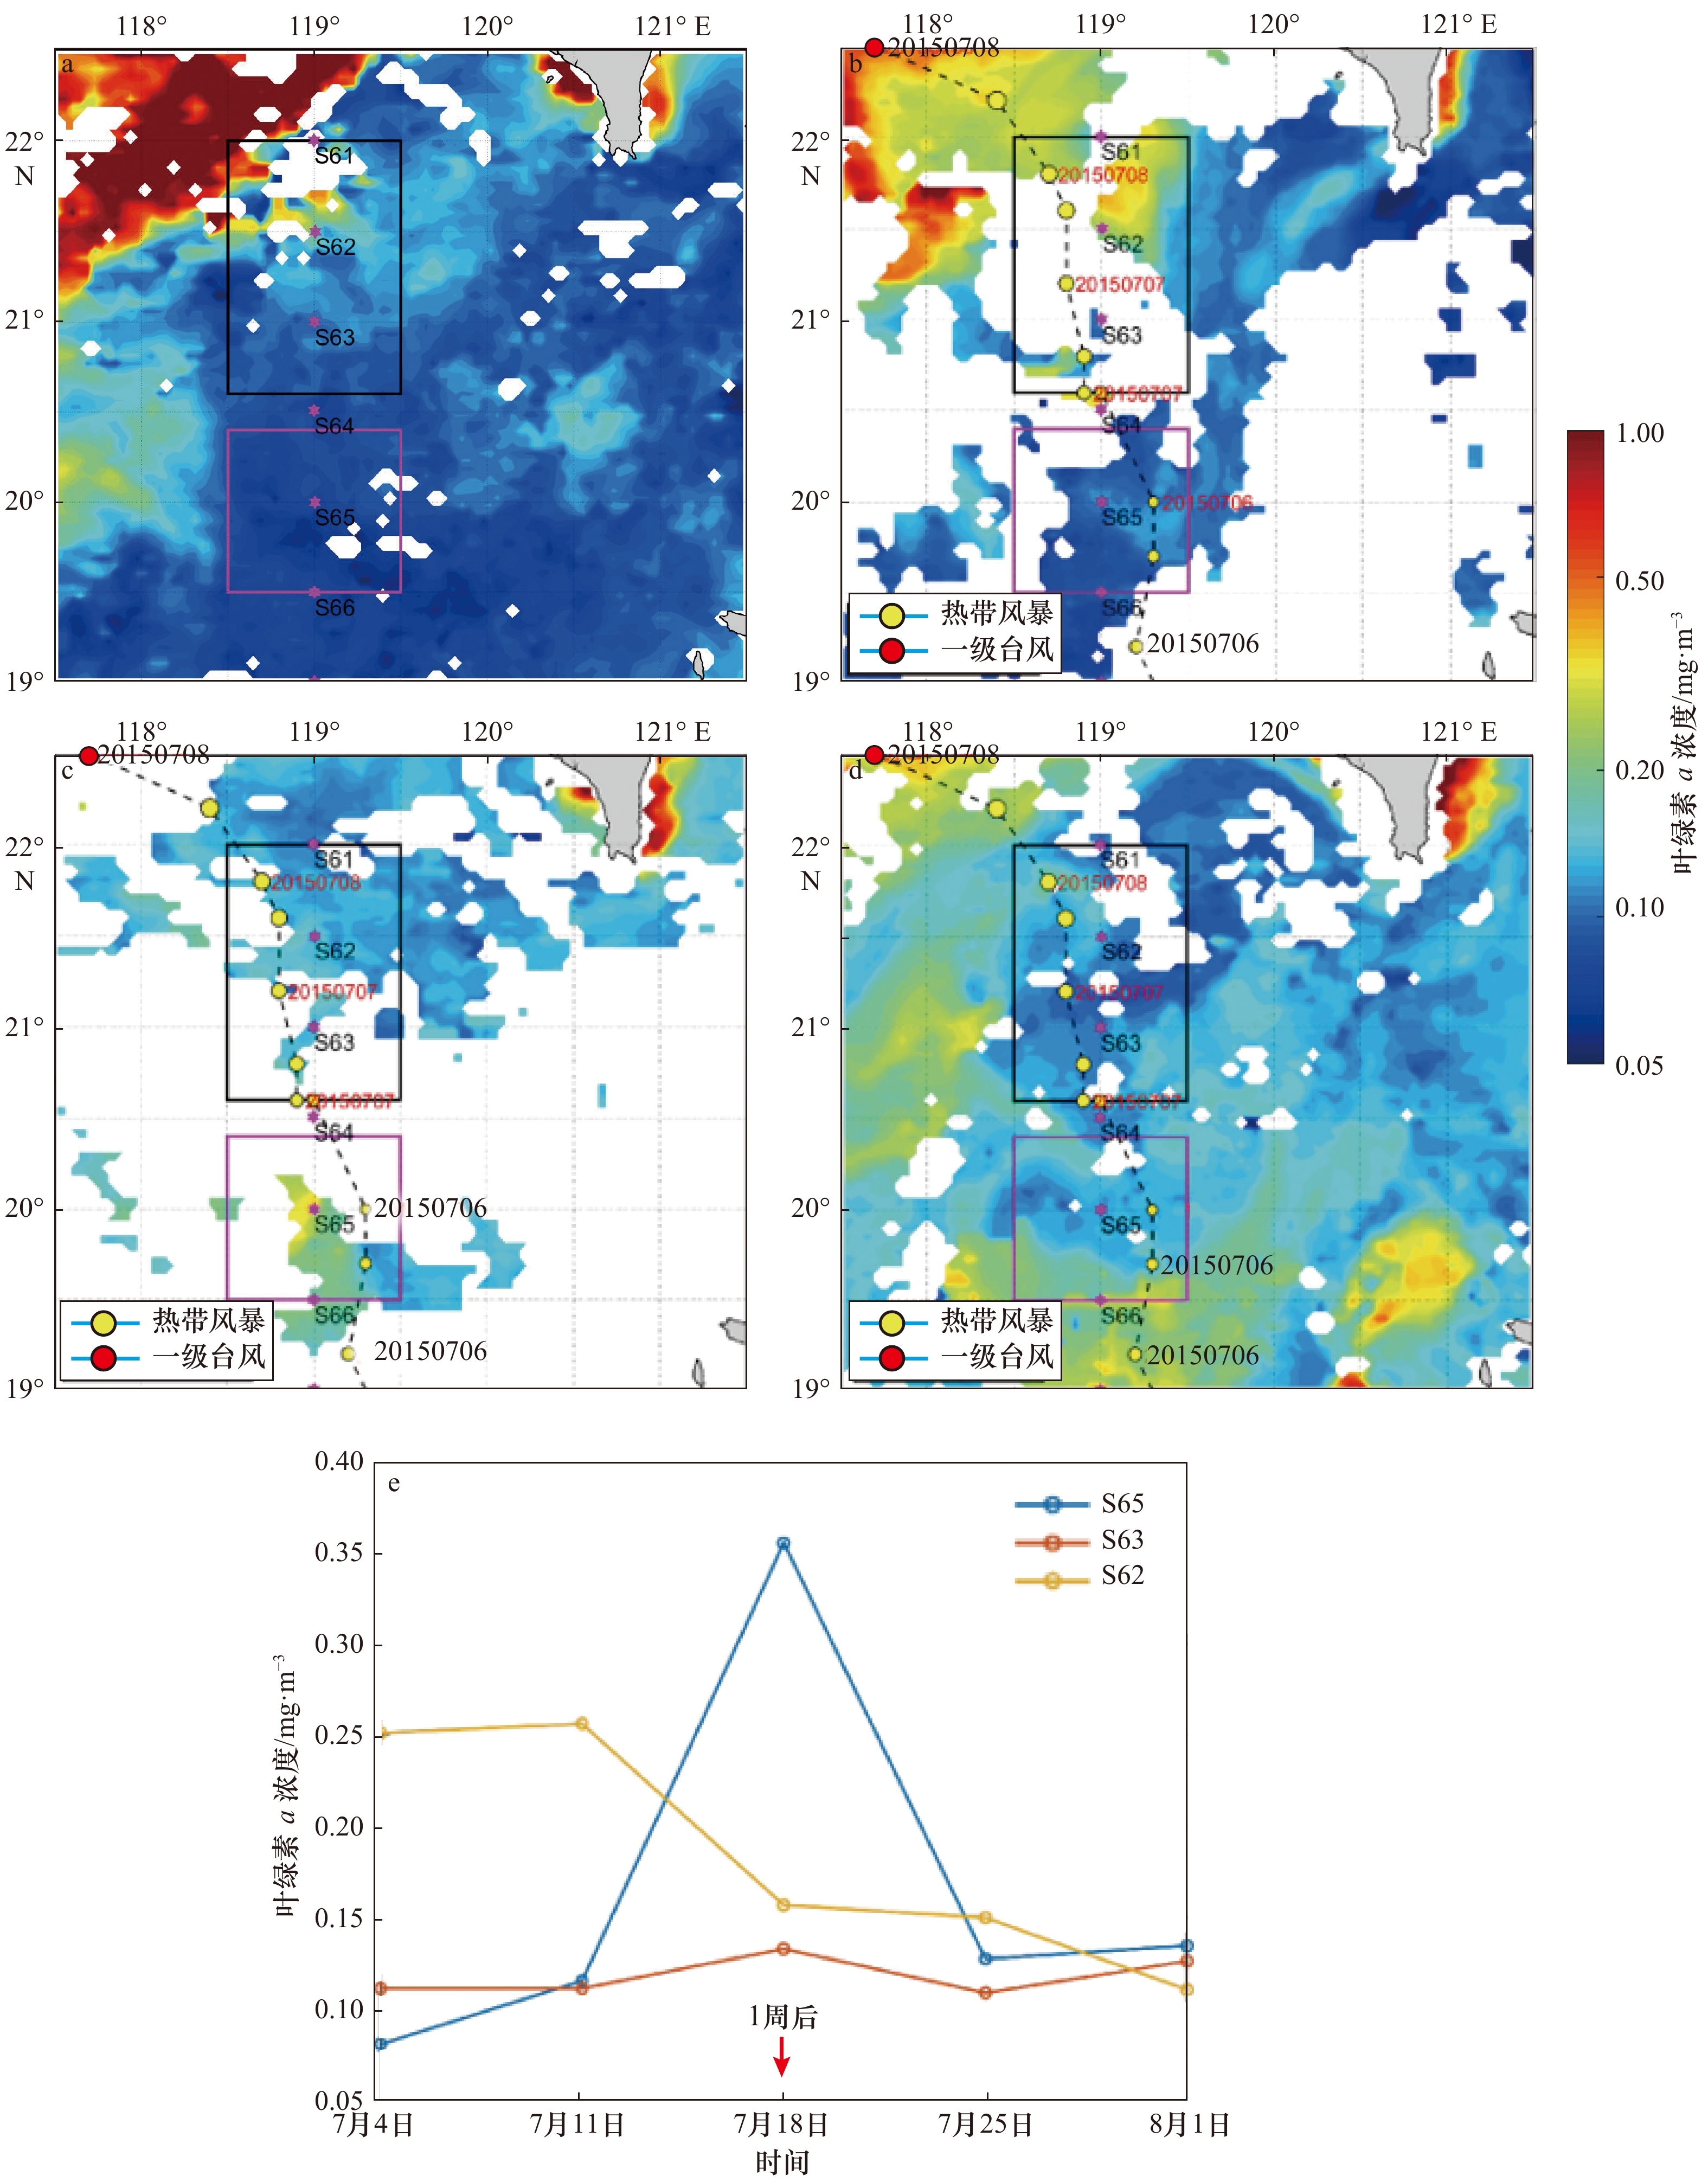
图 2 台风“莲花”过境前后Chl a浓度变化
a、b、c、d分别表示台风过境1周前、过境时、过境1周后、过境2周后的Chl a浓度分布,黑框表示研究区A区,粉框表示研究区B区;e表示研究区A区站位(S62和S63)和B区站位(S65)遥感的Chl a浓度时间序列变化
Fig. 2 The Chl a concentration changes before and after Typhoon Linfa
a, b, c, d are the distribution of Chl a concentration one week before typhoon, during typhoon, one week after typhoon, and two weeks after typhoon; the black box represents the study Area A, the pink box represents the study Area B; e is time series of the the Chl a concentration within Station S62 and Station S63 in Area A and Station S65 in Area B obtained from the MODIS data respectively
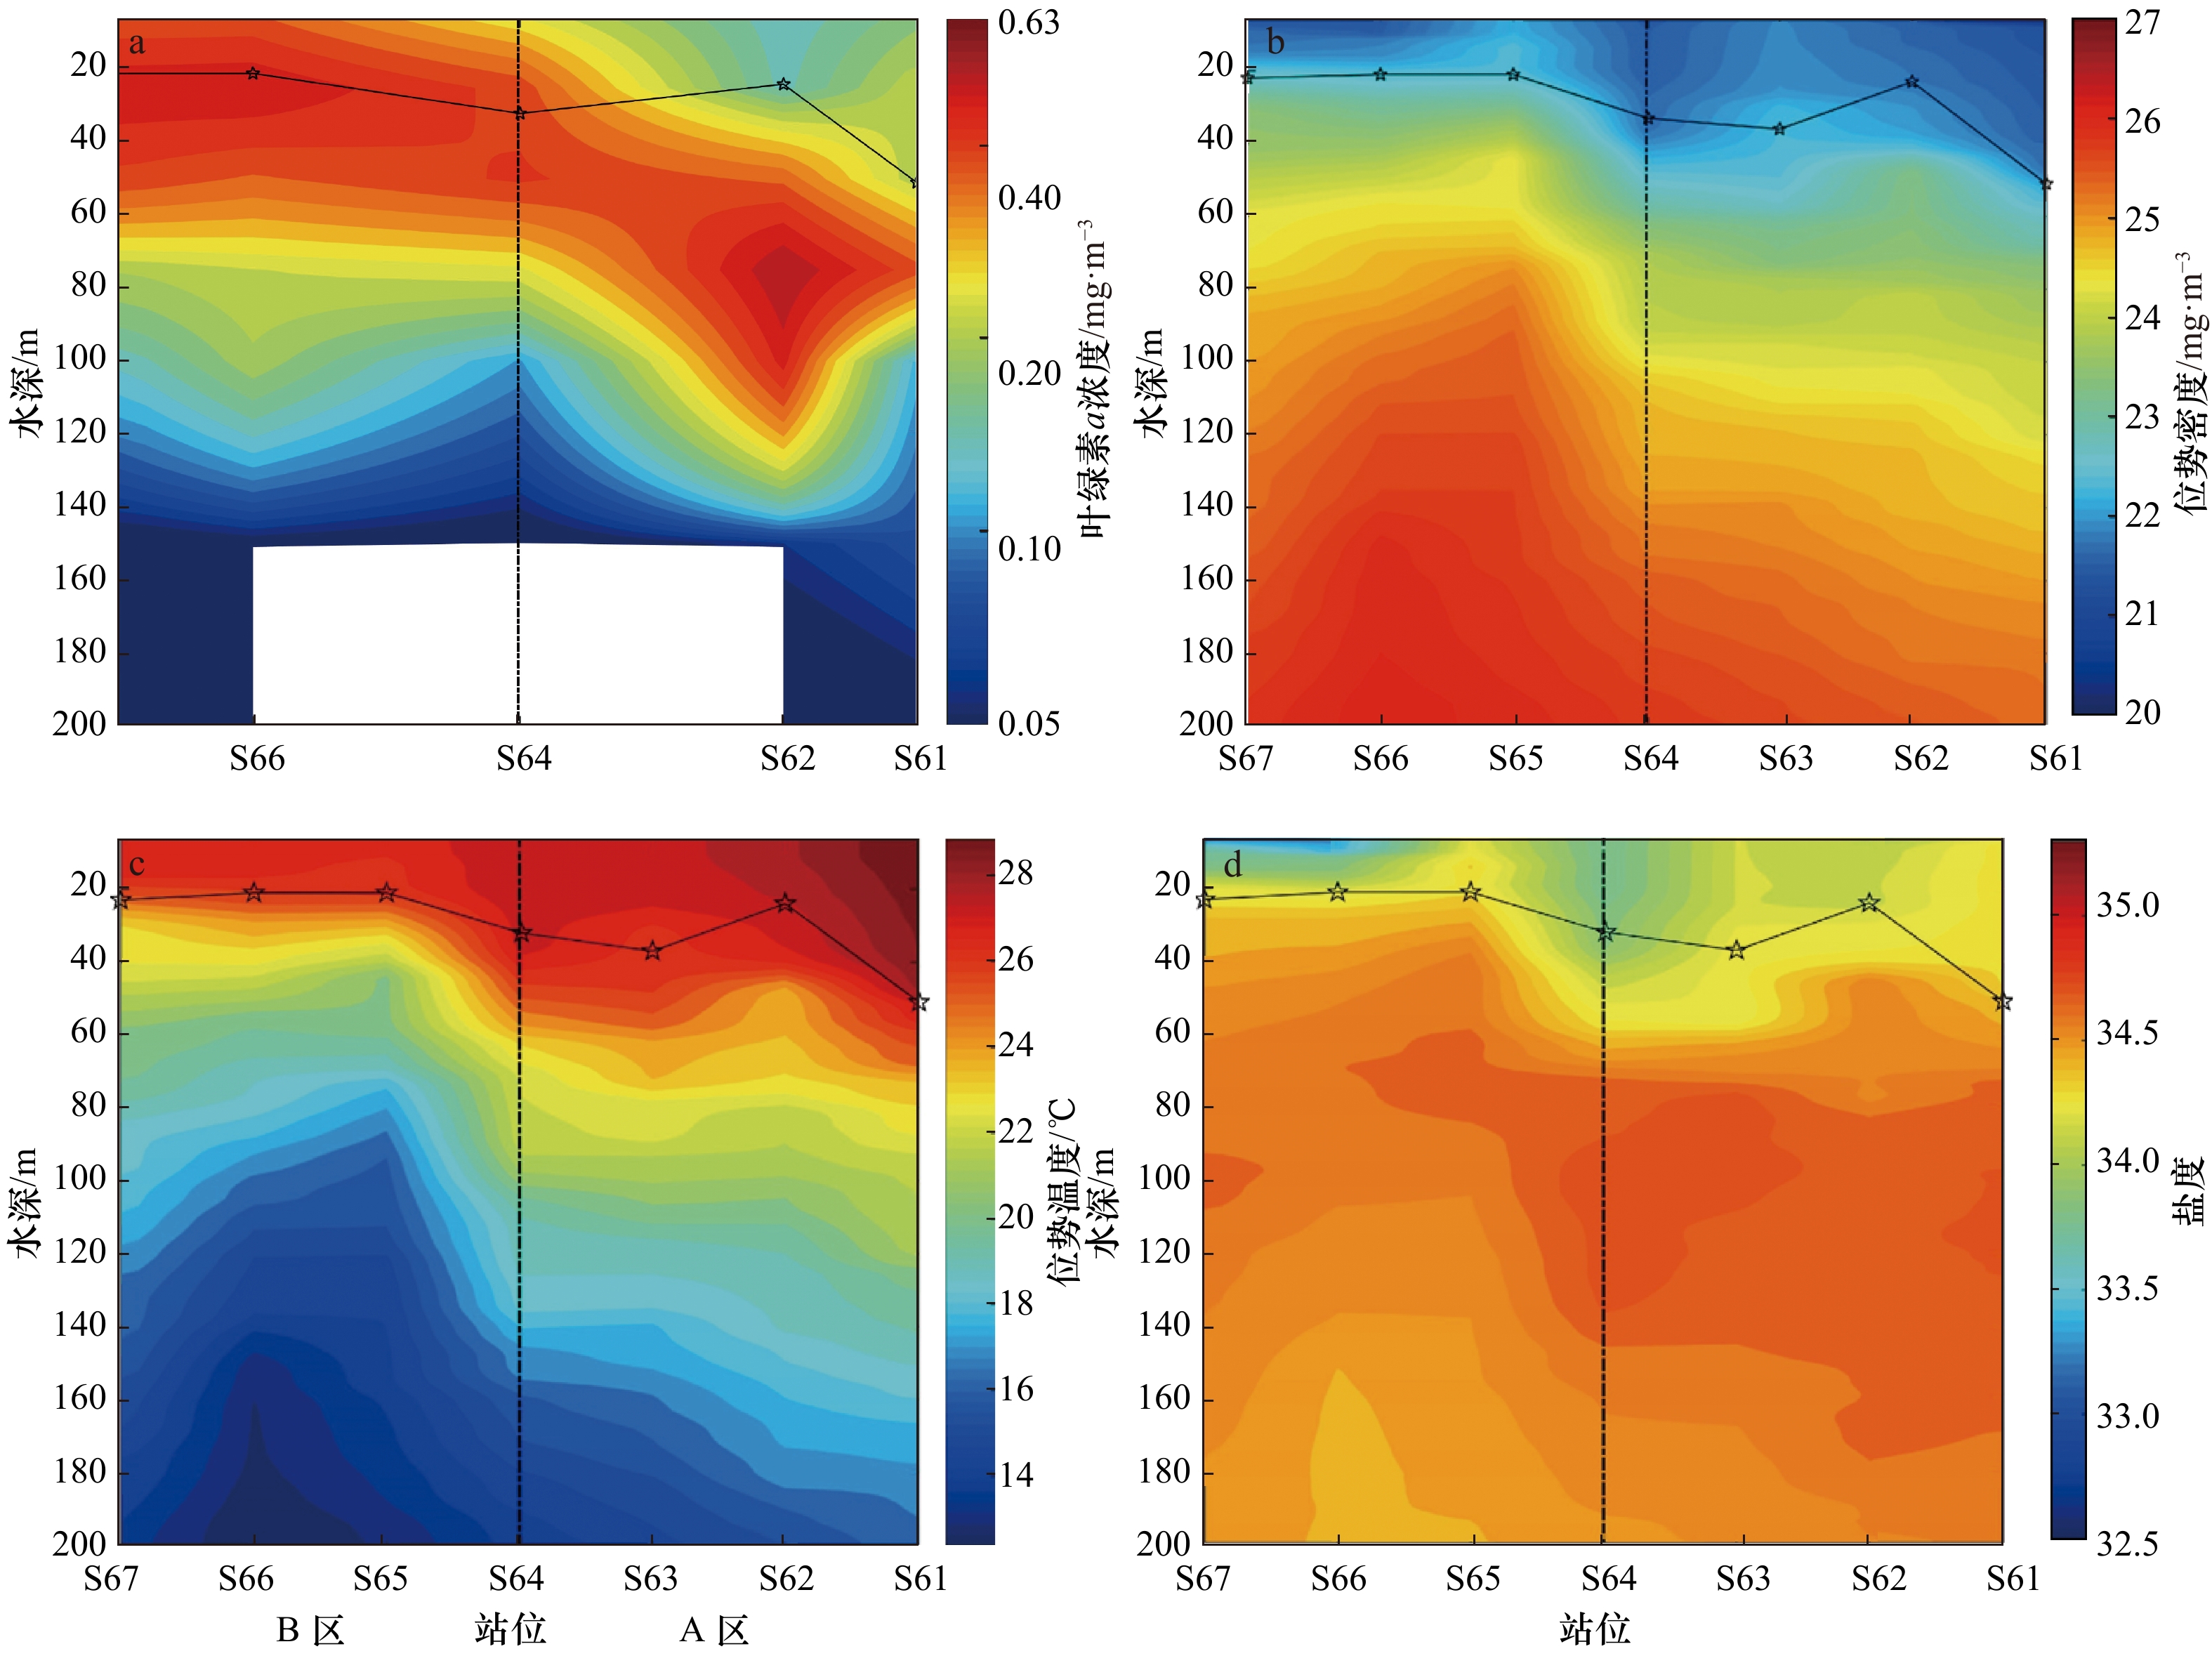
图 3 2015年7月16−17日航次实测的水文和生物断面图
a、b、c、d分别表示Chl a浓度断面、密度断面、温度断面和盐度断面,垂向黑色虚线表示研究区域A区和B区的分界线,黑色带星形点线表示密度跃层上界深度
Fig. 3 Hydrological and biological profiles from cruise data in 16−17 July, 2015
a, b, c, d are Chl a concentration profiles, density profiles, temperature profiles, and salinity profiles, respectively. Vertical black dash line represents board of study areas A and B, black line with star points indicates top of the pycnocline
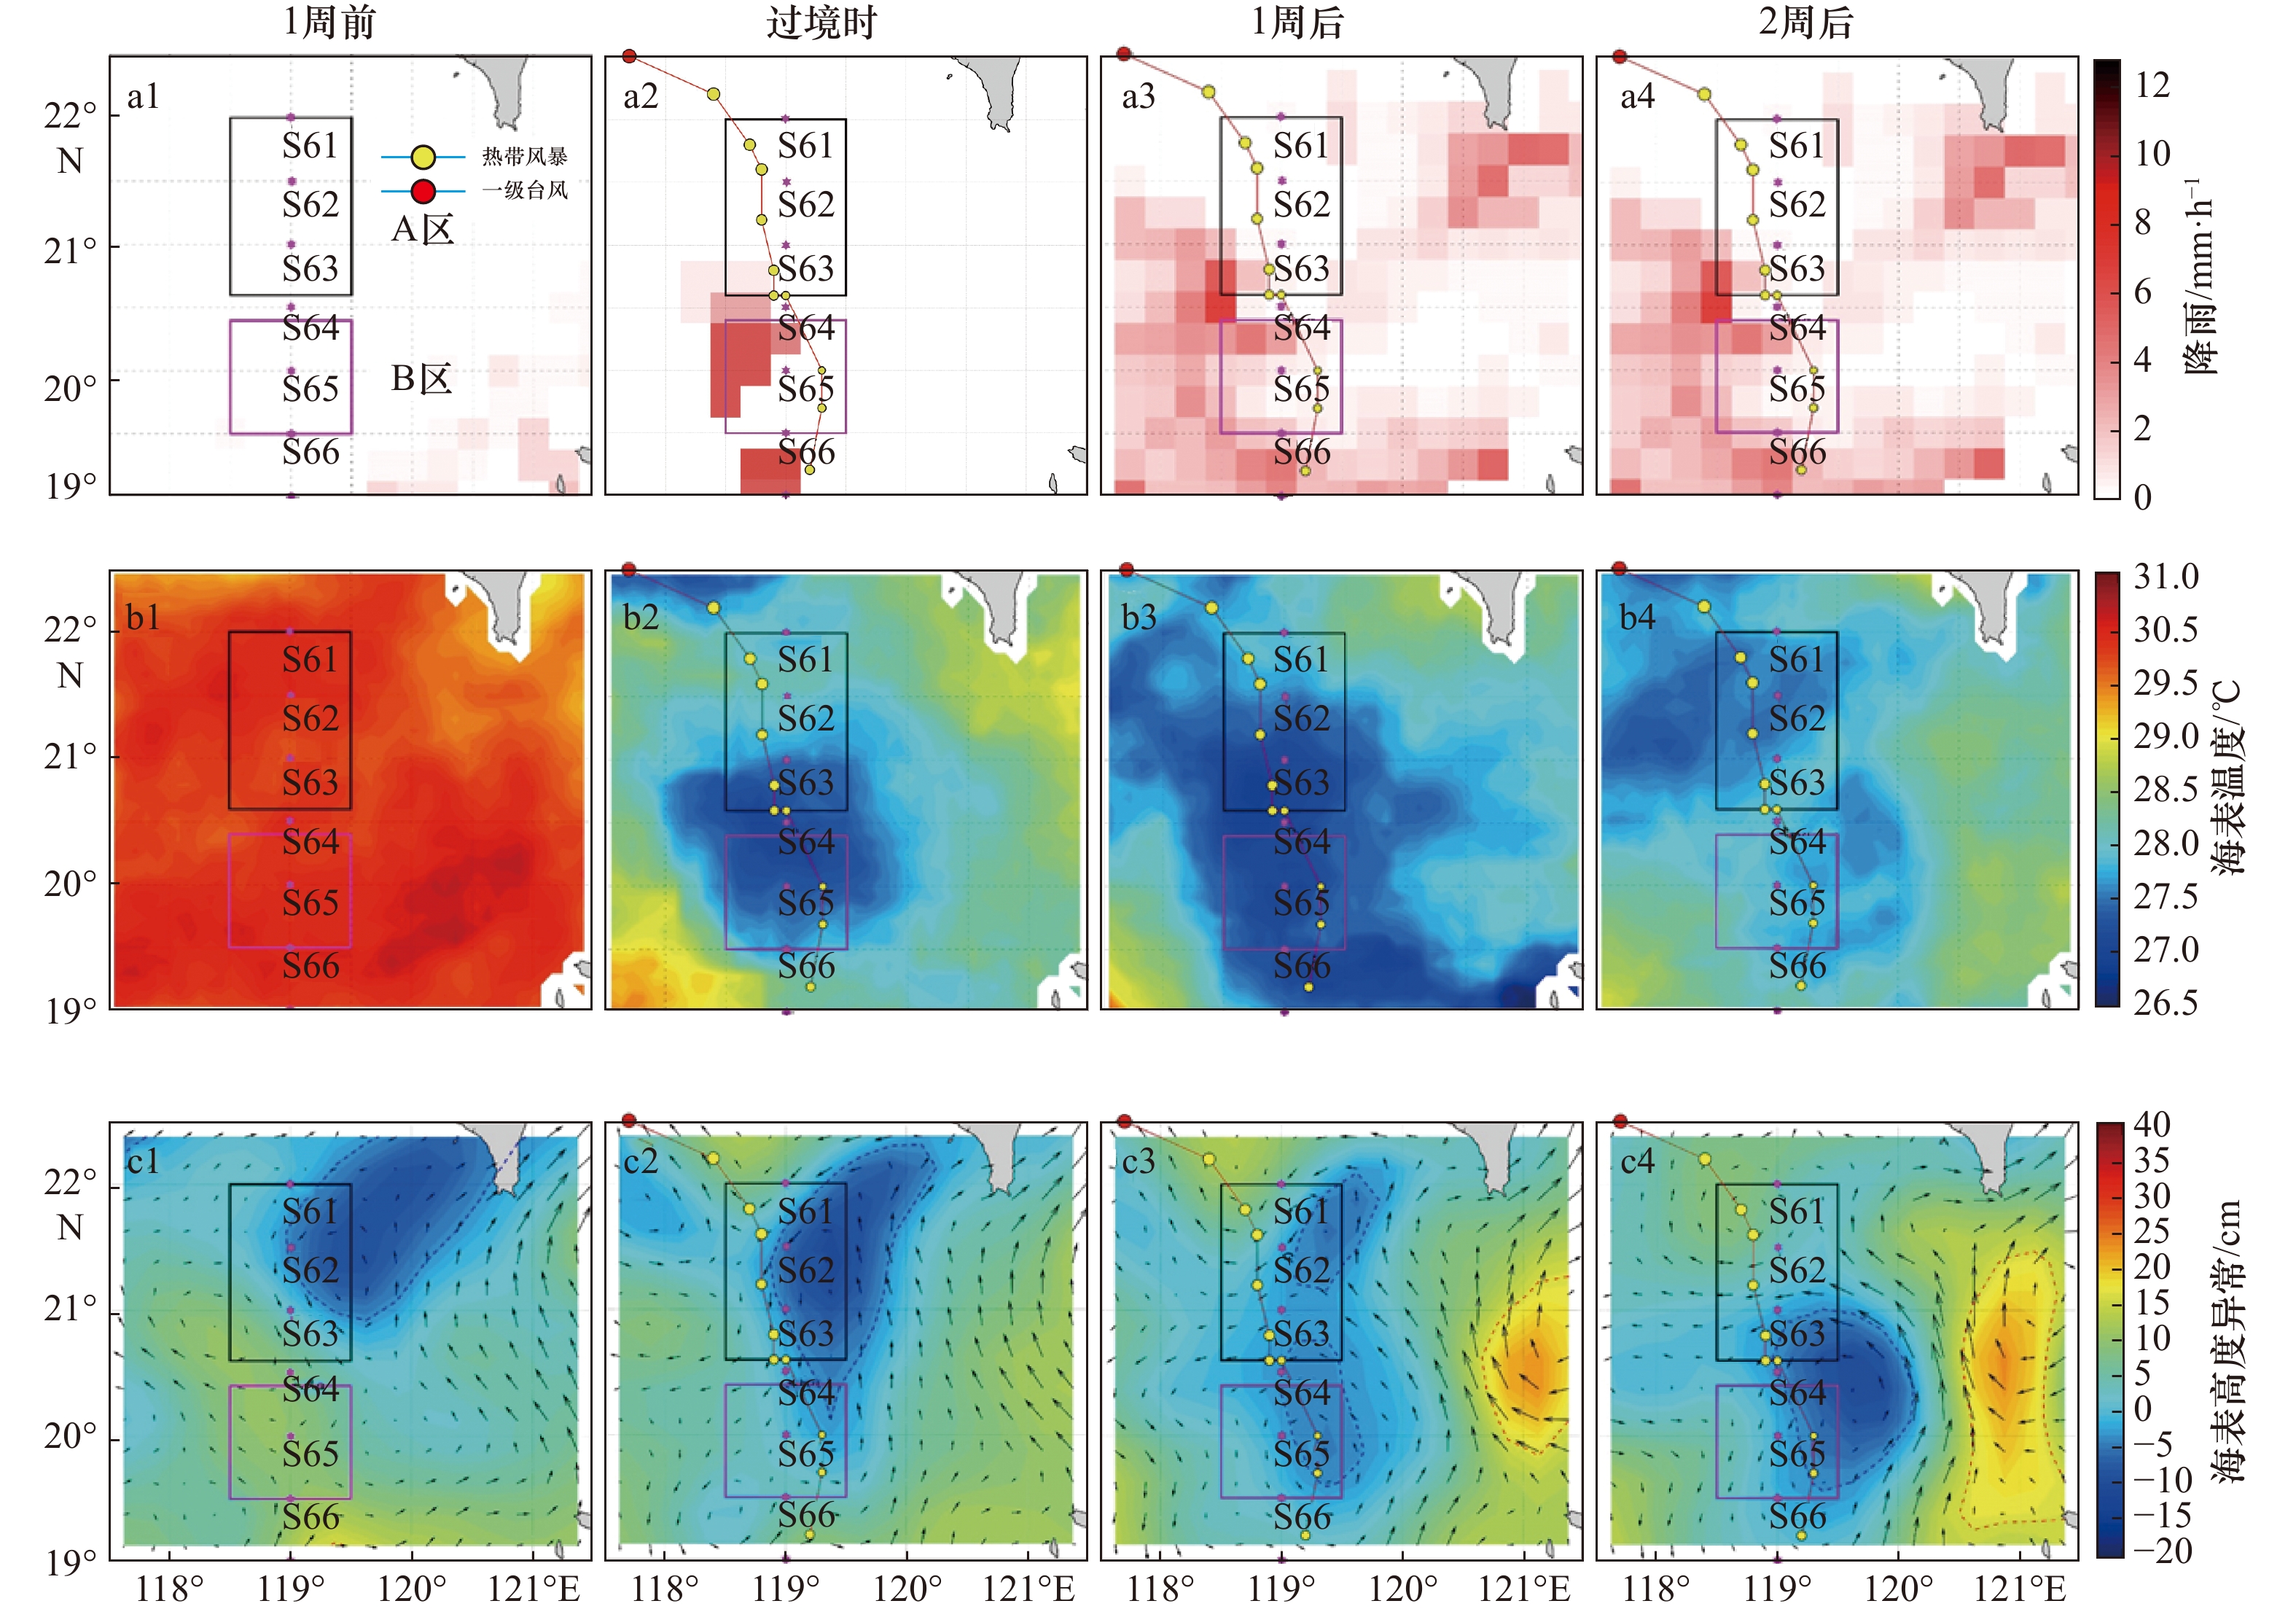
图 4 台风前后降雨、海表温度、海表高度异常叠加地转流的空间分布
Fig. 4 Spatial distribution of rainfall, sea surface temperature, sea level height anomaly with sea surface geostrophic currents before and after typhoon

图 5 台风过境1周前(a)、过境时(b)、过境1周后(c)和过境2周后(d)埃克曼抽吸速率和风场水平分布及A、B区内平埃克曼抽吸速率(e)和混合层深度时间序列(f)折线图
Fig. 5 Distribution of the Ekman pumping velocities and wind fields one week before typhoon (a), during typhoon (b), one week after typhoon (c), and two weeks after typhoon (d), and time series line charts of area average Ekman pumping velocities (e) and mixed layer depth (f)
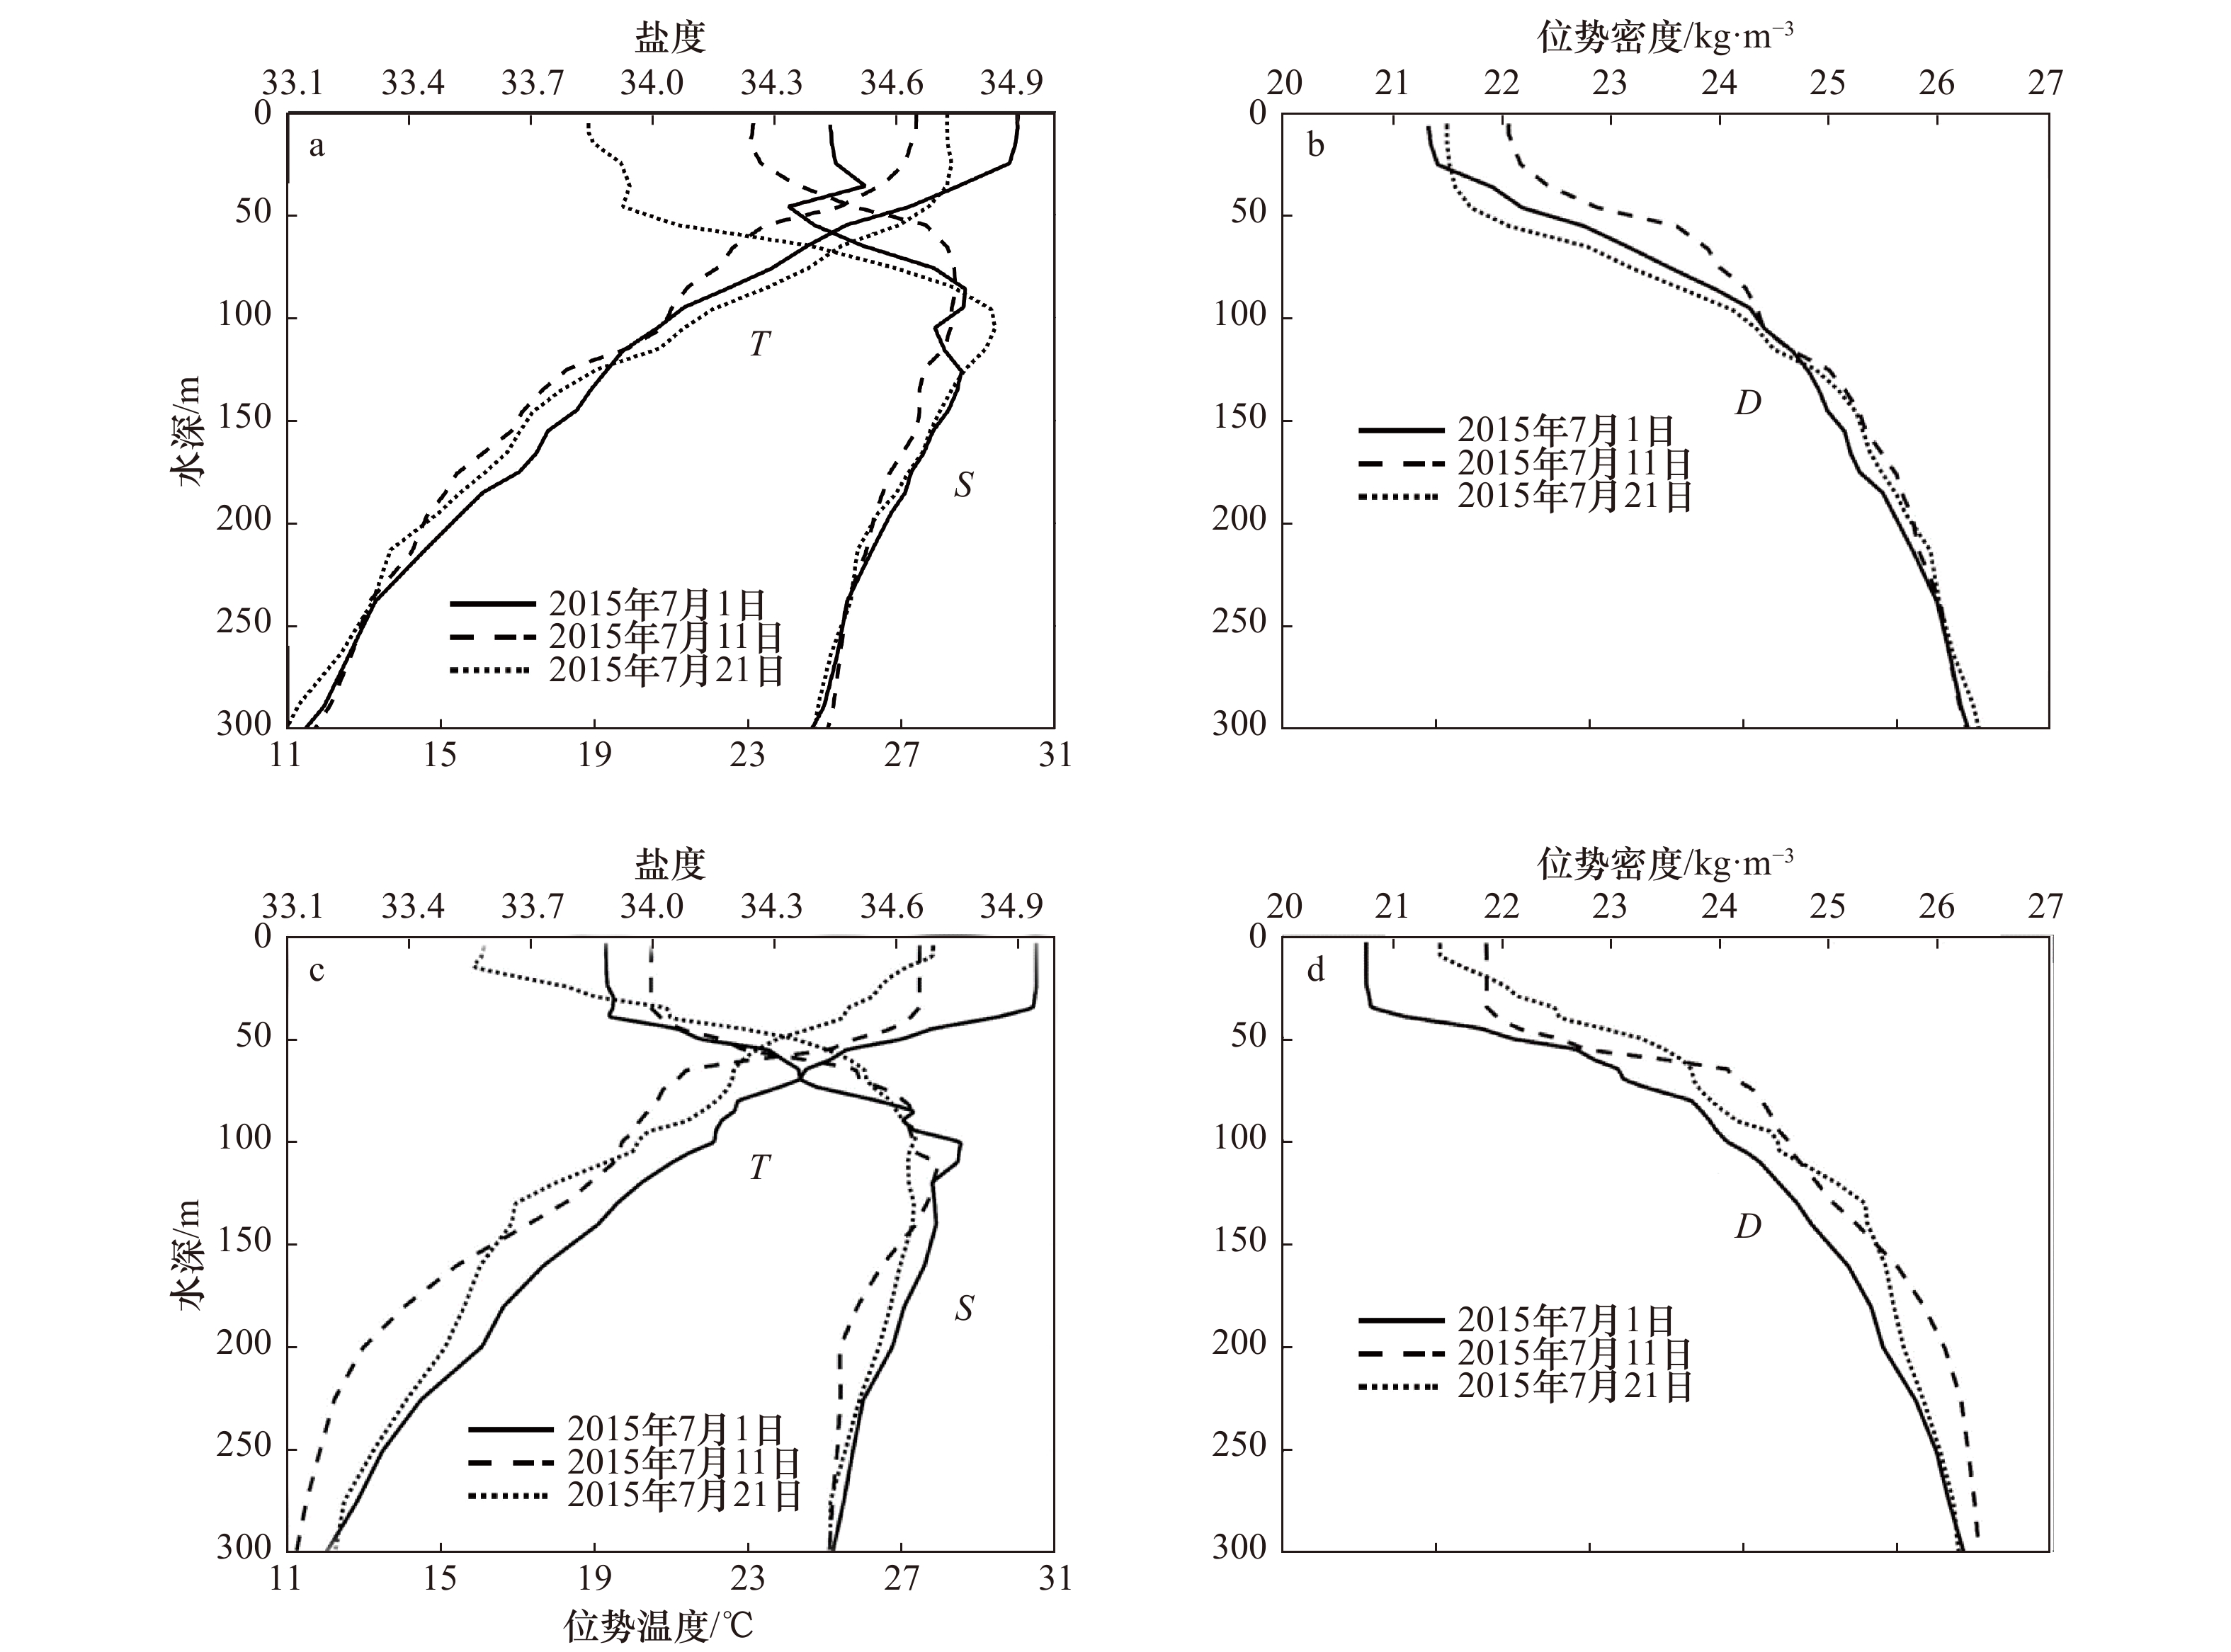
图 6 Argo1(a,b)和Argo2(c,d)温盐和密度曲线
S、T、D分别表示盐度、位势温度和位势密度,黑色实线表示台风过境前,断续线表示台风过境2~3 d后,点虚线表示台风过境2周后
Fig. 6 The potential temperature, salinity and potential density in Argo1 (a, b) and Argo2 (c, d)
S, T, D represent the potential temperature, salinity and potential density respectively. Black solid line represents pre-typhoon period, dash line represents 2−3 days after tropical cyclone, and dots line represents two weeks after tropical cyclone
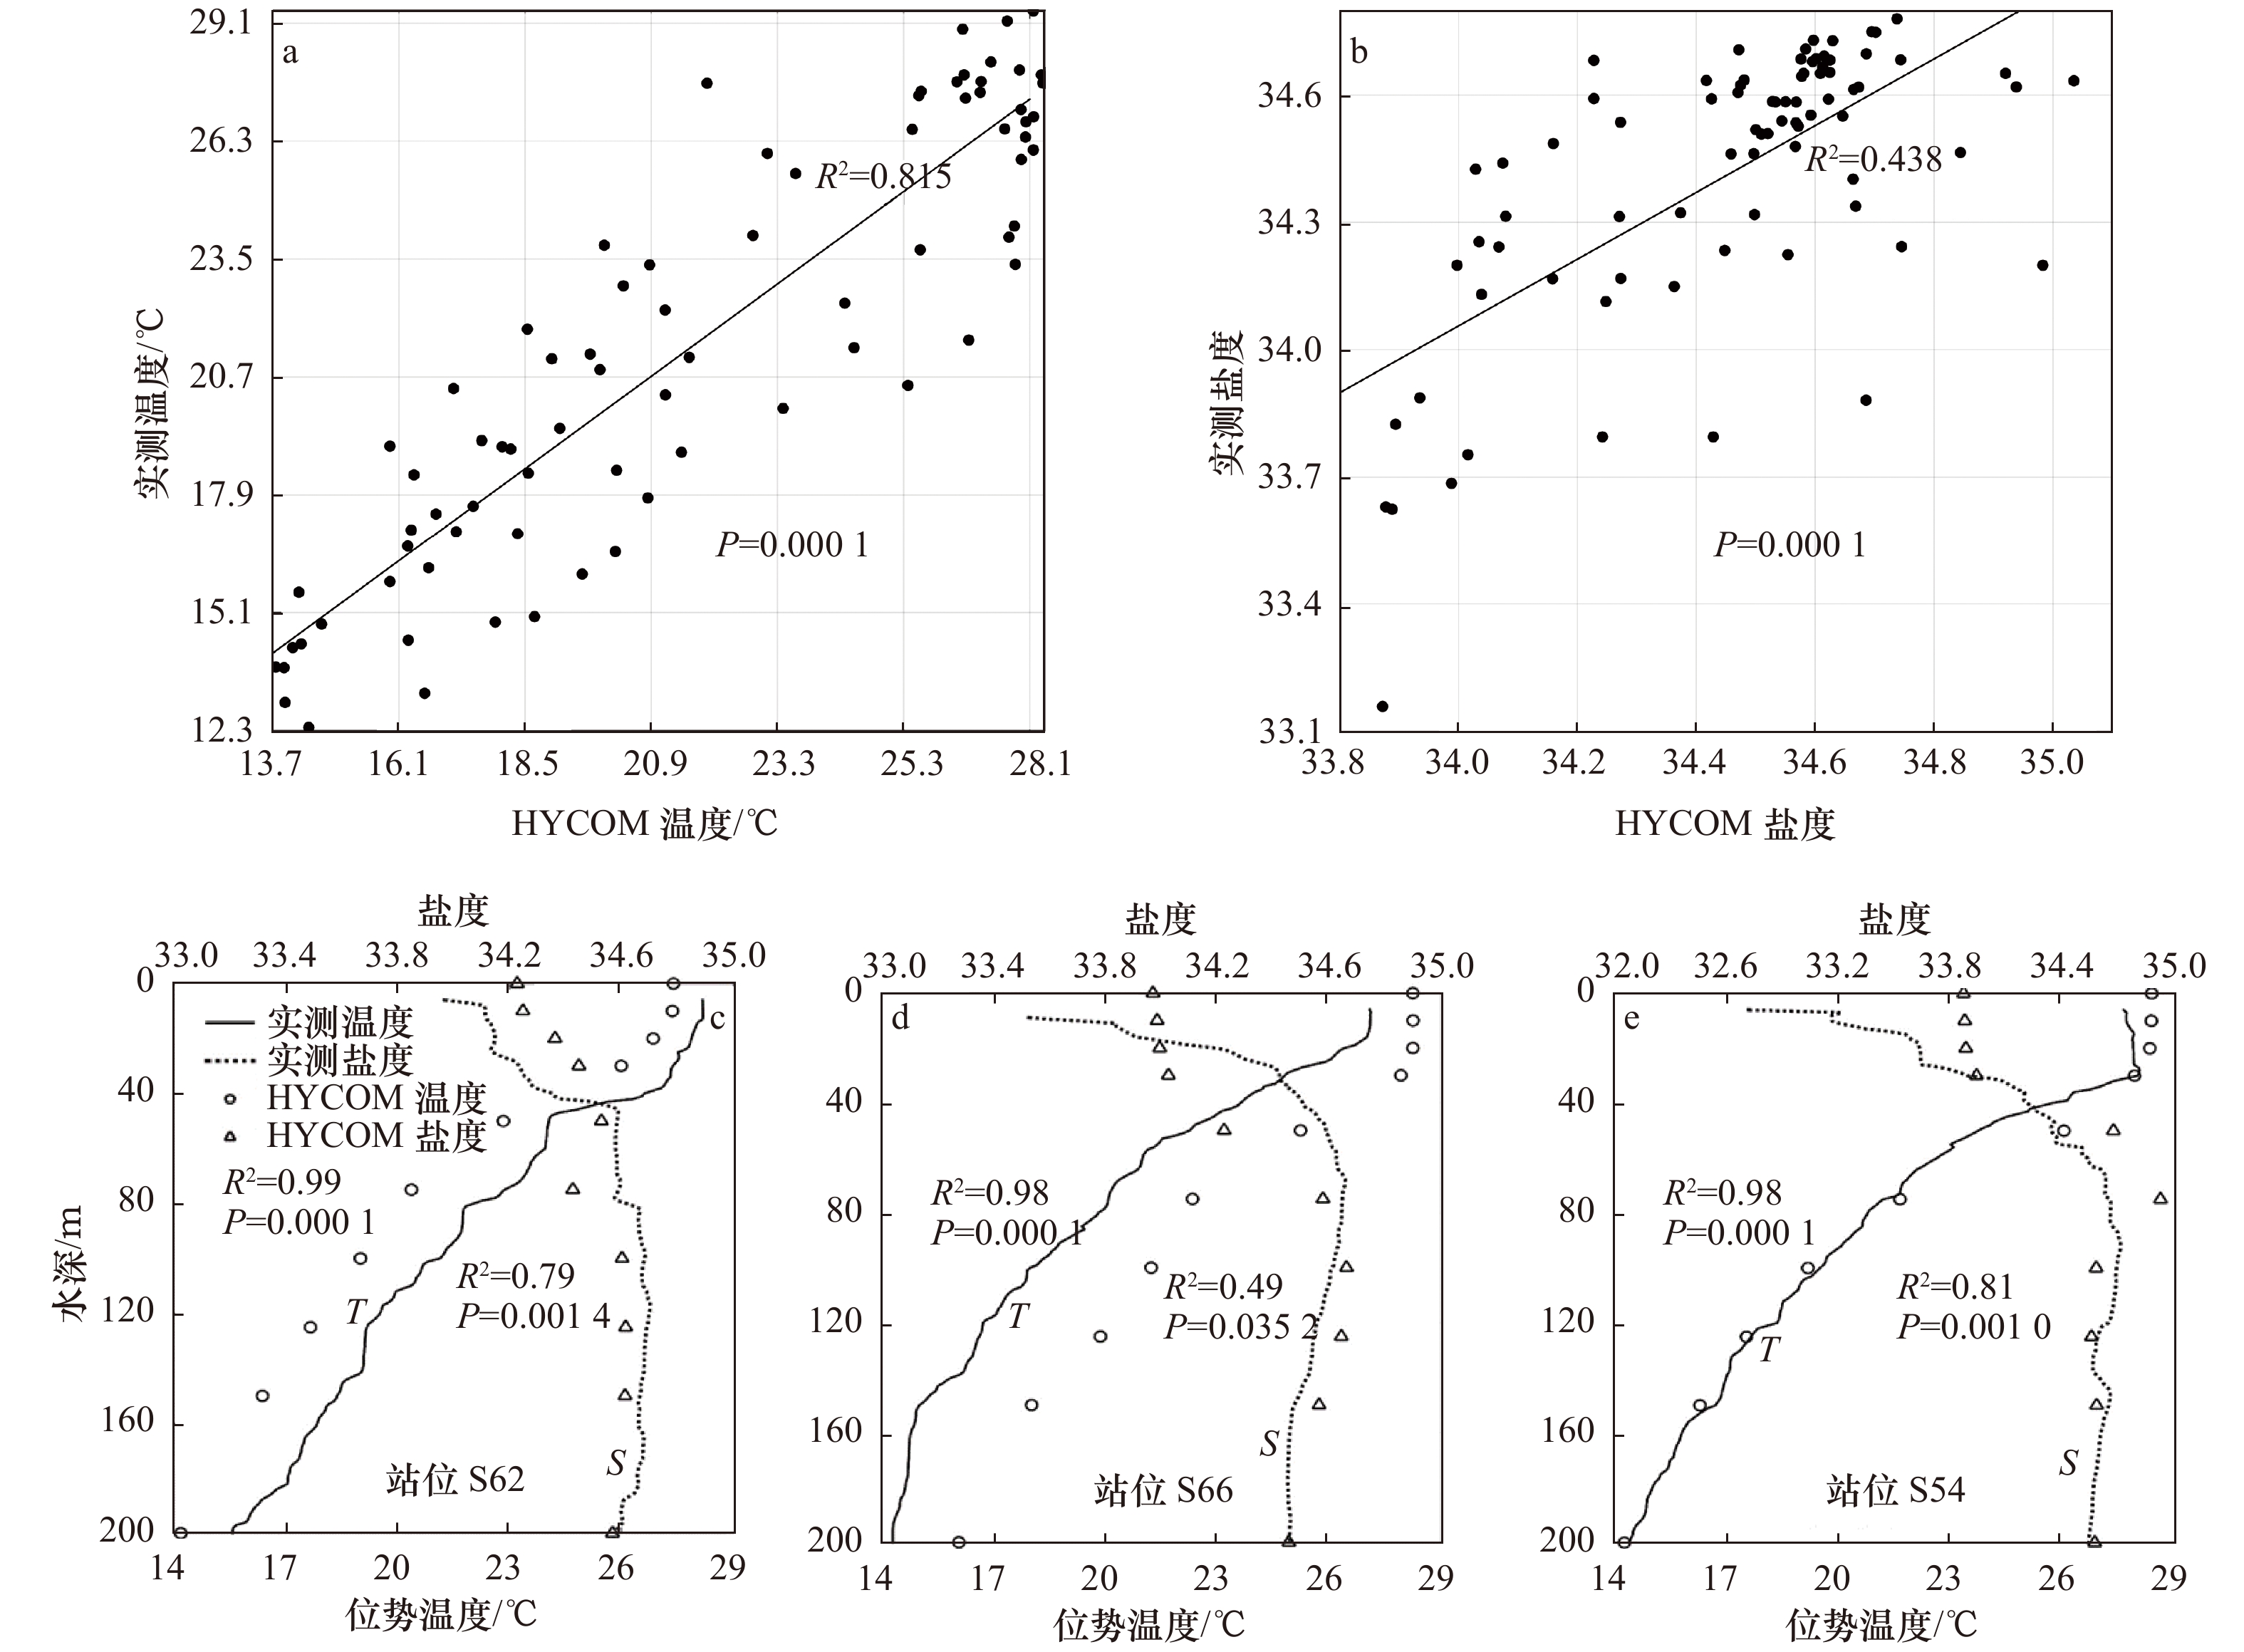
图 7 HYCOM和CTD实测温度和盐度对比
a、b分别表示HYCOM和CTD实测的温度和盐度散点对比;c、d、e分别表示站位S62、S66和S54的CTD实测温盐曲线和HYCOM温盐剖面散点的对比;T、S分别表示温度和盐度
Fig. 7 Comparisons between CTD-measured temperature and salinity and HYCOM model output data
a and b represent comparisons between HYCOM and CTD-measurements in scatter plot; c, d and e represent comparisons of temperature and salinity between CTD-measured and HYCOM data in stations S62, S66 and S54 respectively; T and S represent temperature and salinity respectively

图 8 台风过境前后各黑潮主轴变化时序图
a−c中蓝色折线表示台风路径;d为站位温盐T-S图,其中散点表示S61、S62、S66、S67站位,红色和绿色实线表示S62和S66对应点位的气候态7月平均,黑色实线表示黑潮水体,蓝色实线表示典型南海海水;e为a−c黑潮主轴提取所选的窗口范围
Fig. 8 Time series distribution of the changes in the Kuroshio mainstream before and after typhoon
Blue lines indicate tropical cyclone track in a−c; d is T-S diagram for each station, scatters represent stations S61, S62, S66 and S67, red and green solid lines indicate the climatology monthly averaged values in July, black solid line indicates Kuroshio waters, blue solid line indicates typical waters in the South China Sea; e is the running boxes for Kuroshio extraction in figures a−c
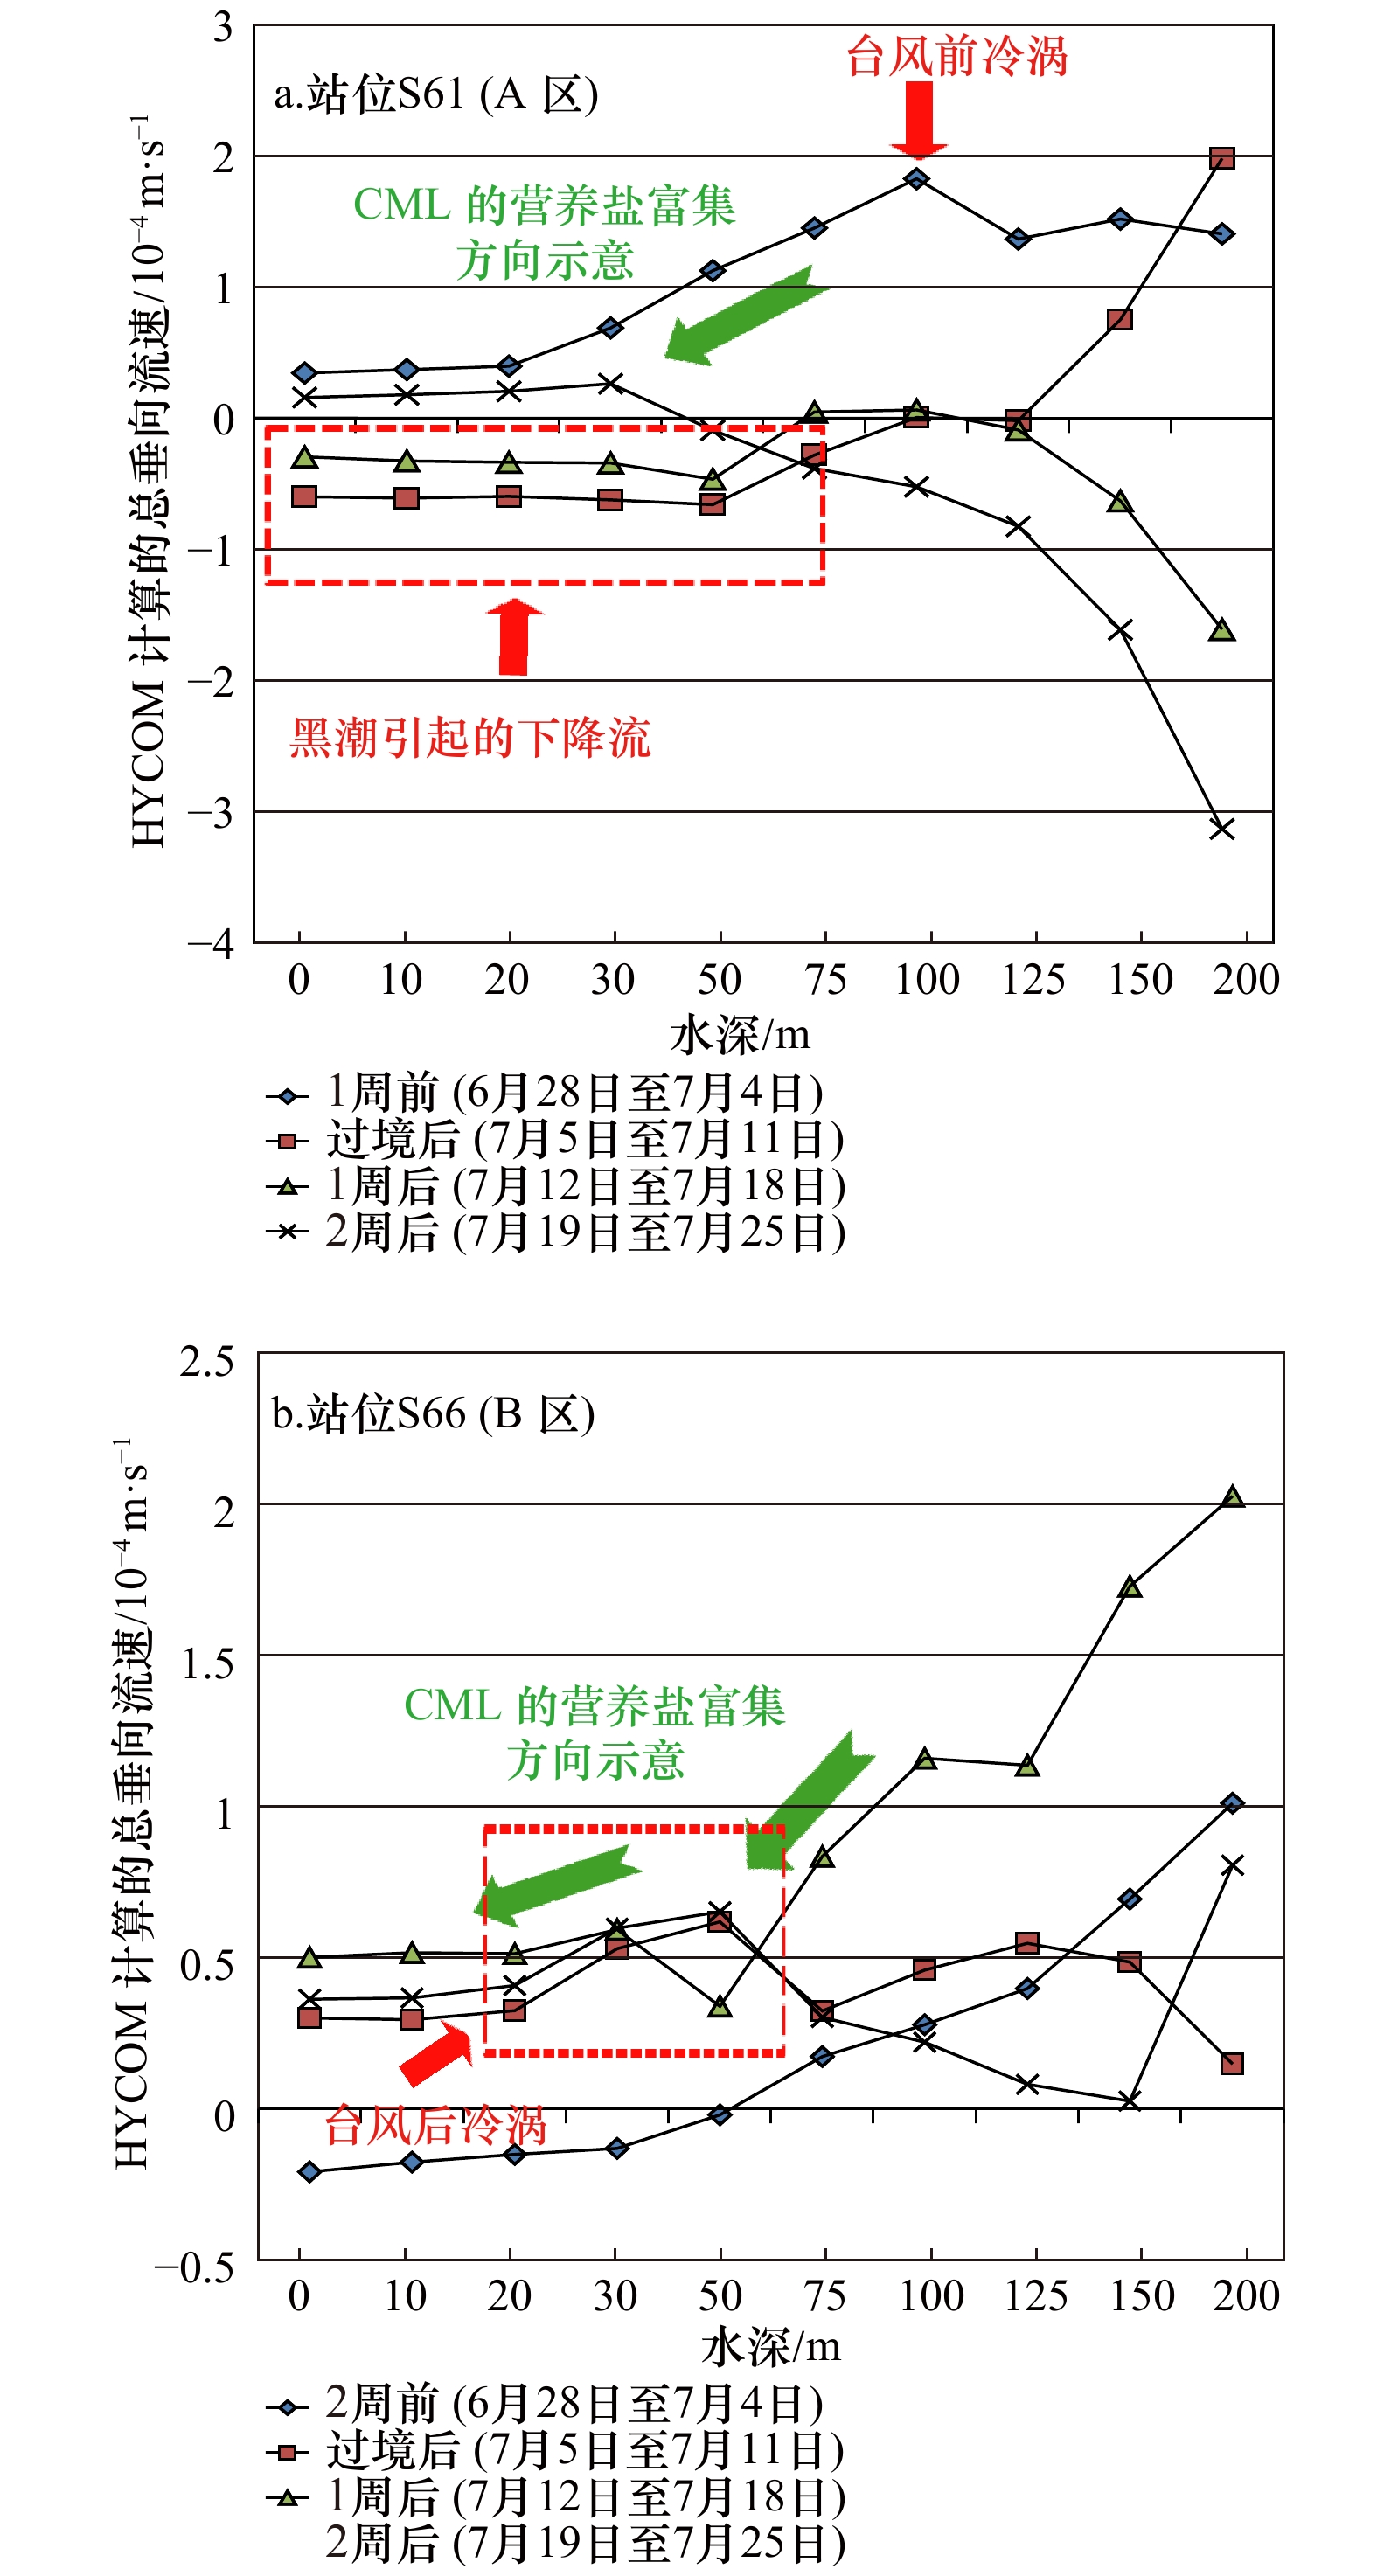
图 9 台风过境前后HYCOM计算的各标准层深度的总垂向流速时序变化时序图
Fig. 9 Time series diagram of the total vertical velocity at each depth before and after typhoon calculated from HYCOM current data
表 1 A区和B区各要素区内平均值的时间序列变化的相关性(R2)
Tab. 1 Correlation of the time-series changes of the area averaged values for each element in areas A and B (R2)
研究区 SLA SST EPV 降雨 A区 Chl a浓度 0.34 0.11 0.01 0.01 SLA − 0.05 − − B区 Chl a浓度 0.63 0.82 0.30 0.03 SLA − 0.54 − −  下载: 导出CSV
表 2 台风前后A区的S62站位和B区的S65站位各要素变化
Tab. 2 Variations of each element at Station S62 in Area A and at Station S65 in Area B before and after the typhoon
站位(研究区) 要素 过境1周前
(6月26日至7月3日)过境时
(7月4−11日)过境1周后
(7月12−19日)过境2周后
(7月20−27日)S62站位(A区) 海表Chl a浓度/mg·m−3 0.251 0.256 0.157 0.150 SLA/cm −4.7 −8.3 −2.7 2.2 EPV/m·s−1 −0.19×10⁻⁵ 2.26×10⁻⁵ 0.59×10⁻⁵ −0.37×10⁻⁵ SST/℃ 30.3 28.5 27.7 28.1 S65站位(B区) 海表Chl a浓度/mg·m−3 0.080 0.115 0.356 0.127 SLA/cm 10.7 1.1 −3.1 −3.6 EPV/m·s−1 −0.19×10⁻⁵ 0.87×10⁻⁵ 0.57×10⁻⁵ −0.26×10⁻⁵ SST/℃ 30.3 27.9 27.2 28.5
下载: 导出CSV
-
[1] Falkowski P G. The role of phytoplankton photosynthesis in global biogeochemical cycles[J]. Photosynthesis Research, 1994, 39(3): 235−258. doi: 10.1007/BF00014586 [2] Zhao Hui, Shao Jinchao, Han Guoqi, et al. Influence of typhoon matsa on phytoplankton chlorophyll-a off East China[J]. PLoS One, 2015, 10(9): e0137863. doi: 10.1371/journal.pone.0137863 [3] Ning X, Chai F, Xue H, et al. Physical-biological oceanographic coupling influencing phytoplankton and primary production in the South China Sea[J]. Journal of Geophysical Research, 2004, 109(C10): C10005. doi: 10.1029/2004JC002365 [4] 张亚锋, 王旭涛, 殷克东. 南海台风引发藻华的生物机制[J]. 生态学报, 2018, 38(16): 5667−5678.Zhang Yafeng, Wang Xutao, Yin Kedong. Biological mechanisms of typhoon-induced blooms in the South China Sea[J]. Acta Ecologica Sinica, 2018, 38(16): 5667−5678. [5] Tang Danling, Kawamura H, Van Dien T, et al. Offshore phytoplankton biomass increase and its oceanographic causes in the South China Sea[J]. Marine Ecology Progress Series, 2004, 268: 31−41. doi: 10.3354/meps268031 [6] Peñaflor E L, Villanoy C L, Liu C T, et al. Detection of monsoonal phytoplankton blooms in Luzon Strait with MODIS data[J]. Remote Sensing of Environment, 2007, 109(4): 443−450. doi: 10.1016/j.rse.2007.01.019 [7] 刘子琳, 陈忠元, 周蓓锋, 等. 黑潮源区及其邻近海域叶绿素a浓度的季节分布[J]. 海洋湖沼通报, 2006(1): 58−63. doi: 10.3969/j.issn.1003-6482.2006.01.008Liu Zilin, Chen Zhongyuan, Zhou Beifeng, et al. The seasonal distribution of the standing stock of phytoplankton in the source area of the Kuroshio and adjacent areas[J]. Transactions of Oceanology and Limnology, 2006(1): 58−63. doi: 10.3969/j.issn.1003-6482.2006.01.008 [8] Chen Gengxin, Hu Po, Chu Xiaoqing. Intrusion of the Kuroshio into the South China Sea, in September 2008[J]. Journal of Oceanography, 2011, 67(4): 439−448. doi: 10.1007/s10872-011-0047-y [9] 耿伍, 何伟宏, 邹晓理, 等. 理想台风驱动的涡旋对吕宋海峡黑潮影响的数值研究[J]. 热带海洋学报, 2013, 32(2): 66−73. doi: 10.3969/j.issn.1009-5470.2013.02.007Geng Wu, He Weihong, Zou Xiaoli, et al. A numerical study of effects due to mesoscale eddy induced by an idealized typhoon and the Kuroshio in the Luzon Strait[J]. Journal of Tropical Oceanography, 2013, 32(2): 66−73. doi: 10.3969/j.issn.1009-5470.2013.02.007 [10] Lin I, Liu W T, Wu C C, et al. New evidence for enhanced ocean primary production triggered by tropical cyclone[J]. Geophysical Research Letters, 2003, 30(13): 1718. [11] 林静柔, 唐丹玲, 娄全胜. 超级台风“南玛都”对南海北部叶绿素a、温盐及溶解氧的影响[J]. 生态科学, 2015, 34(4): 9−14.Lin Jingrou, Tang Danling, Lou Quansheng. The impact of Super Typhoon Nanmadol on the chlorophyll a, temperature, salinity and dissolved oxygen in the northern South China Sea[J]. Ecological Science, 2015, 34(4): 9−14. [12] 赵辉, 张书文, 侯一筠, 等. 热带风暴“天鹰”对南海西部浮游植物叶绿素浓度的影响[J]. 热带海洋学报, 2013, 32(5): 99−106. doi: 10.3969/j.issn.1009-5470.2013.05.014Zhao Hui, Zhang Shuwen, Hou Yijun, et al. Influence of Tropical Storm Washi on phytoplankton chlorophyll-a in the western South China Sea[J]. Journal of Tropical Oceanography, 2013, 32(5): 99−106. doi: 10.3969/j.issn.1009-5470.2013.05.014 [13] Ye Haijun, Morozov E, Tang Danling, et al. Variation of pCO2 concentrations induced by tropical cyclones “Wind-Pump” in the middle-latitude surface oceans: a comparative study[J]. PLoS One, 2020, 15(3): e0226189. doi: 10.1371/journal.pone.0226189 [14] Gong G C, Shiah F K, Liu K K, et al. Effect of the Kuroshio intrusion on the chlorophyll distribution in the southern East China Sea during spring 1993[J]. Continental Shelf Research, 1997, 17(1): 79−94. doi: 10.1016/0278-4343(96)00022-2 [15] Guo Lin, Xiu Peng, Chai Fei, et al. Enhanced chlorophyll concentrations induced by Kuroshio intrusion fronts in the northern South China Sea[J]. Geophysical Research Letters, 2017, 44(22): 11565−11572. doi: 10.1002/2017GL075336 [16] Xu Huabing, Tang Danling, Sheng Jinyu, et al. Study of dissolved oxygen responses to tropical cyclones in the Bay of Bengal based on Argo and satellite observations[J]. Science of The Total Environment, 2018, 659: 912-922. [17] Sun Qingyang, Tang Danling, Legendre L, et al. Enhanced sea-air CO2 exchange influenced by a tropical depression in the South China Sea[J]. Journal of Geophysical Research, 2014, 119(10): 6792−6804. [18] 宋勇军, 唐丹玲. 南海东北部混合层深度对热带气旋海鸥和凤凰的响应[J]. 热带海洋学报, 2017, 36(1): 15−24.Song Yongjun, Tang Danling. Mixed layer depth responses to tropical cyclones Kalmaegi and Fung-Wong in the northeastern South China Sea[J]. Journal of Tropical Oceanography, 2017, 36(1): 15−24. [19] 唐世林, 陈楚群, 詹海刚, 等. 南海真光层深度的遥感反演[J]. 热带海洋学报, 2007, 26(1): 9−15. doi: 10.3969/j.issn.1009-5470.2007.01.002Tang Shilin, Chen Chuqun, Zhan Haigang, et al. Retrieval of euphotic layer depth of South China Sea by remote sensing[J]. Journal of Tropical Oceanography, 2007, 26(1): 9−15. doi: 10.3969/j.issn.1009-5470.2007.01.002 [20] Ye H J, Sui Y, Tang D L, et al. A subsurface chlorophyll a bloom induced by typhoon in the South China Sea[J]. Journal of Marine Systems, 2013, 128: 138−145. doi: 10.1016/j.jmarsys.2013.04.010 [21] Zhao Hui, Han Guoqi, Zhang Shuwen, et al. Two phytoplankton blooms near Luzon Strait generated by lingering Typhoon Parma[J]. Journal of Geophysical Research, 2013, 118(2): 412−421. [22] Price J F. Upper ocean response to a hurricane[J]. Journal of Physical Oceanography, 1981, 11(2): 153−175. doi: 10.1175/1520-0485(1981)011<0153:UORTAH>2.0.CO;2 [23] Fu Dongyang, Pan Delu, Mao Zhihua, et al. The effects of chlorophyll-a and SST in the South China Sea area by typhoon near last decade[C]//Proceedings of Remote Sensing for Environmental Monitoring, GIS Applications, and Geology IX. Berlin, Germany: SPIE, 2009: 74782E. [24] Talley L D, Pickard G L, Emery W J, et al. Mass, salt, and heat budgets and wind forcing[M]//Talley L D, Pickard G L, Emery W J, et al. Descriptive Physical Oceanography. 6th ed. Oxford: Academic Press, 2011: 111−145. [25] He Qingyou, Zhan Haigang, Cai Shuqun, et al. Eddy effects on surface chlorophyll in the northern South China Sea: mechanism investigation and temporal variability analysis[J]. Deep-Sea Research Part I: Oceanographic Research Papers, 2016, 112: 25−36. doi: 10.1016/j.dsr.2016.03.004 [26] 刘赛赛, 张立凤, 张晓慧. 台风“彩虹”(1522)近海急剧加强的特征分析[J]. 气象科学, 2017, 37(4): 487−496.Liu Saisai, Zhang Lifeng, Zhang Xiaohui. Characteristics analysis on rapid intensification of typhoon Mujigae (1522) over the offshore area of China[J]. Journal of the Meteorological Sciences, 2017, 37(4): 487−496. [27] Chen Yongqiang, Tang Danling. Eddy-feature phytoplankton bloom induced by a tropical cyclone in the South China Sea[J]. International Journal of Remote Sensing, 2012, 33(23): 7444−7457. doi: 10.1080/01431161.2012.685976 [28] Pan Gang, Chai Fei, Tang Danling, et al. Marine phytoplankton biomass responses to typhoon events in the South China Sea based on physical-biogeochemical model[J]. Ecological Modelling, 2017, 356: 38−47. doi: 10.1016/j.ecolmodel.2017.04.013 [29] Liu Yupeng, Tang Danling, Evgeny M. Chlorophyll concentration response to the typhoon Wind-Pump induced upper ocean processes considering air–sea heat exchange[J]. Remote Sensing, 2019, 11(15): 1825. doi: 10.3390/rs11151825 [30] 刘广平, 胡建宇. 热带气旋过境期间黑潮流轴变化的初步分析[J]. 热带海洋学报, 2012, 31(1): 35−41.Liu Guangping, Hu Jianyu. A preliminary analysis of variation of the Kuroshio axis during tropical cyclone[J]. Journal of Tropical Oceanography, 2012, 31(1): 35−41. [31] Kuo Yichun, Zheng Zhewen, Zheng Quanan, et al. Typhoon–Kuroshio interaction in an air–sea coupled system: case study of typhoon nanmadol (2011)[J]. Ocean Modelling, 2018, 132: 130−138. doi: 10.1016/j.ocemod.2018.10.007 [32] Nan Feng, Xue Huijie, Chai Fei, et al. Identification of different types of Kuroshio intrusion into the South China Sea[J]. Ocean Dynamics, 2011, 61(9): 1291−1304. doi: 10.1007/s10236-011-0426-3 [33] Huang Zhida, Liu Hailong, Lin Pengfei, et al. Influence of island chains on the Kuroshio intrusion in the Luzon Strait[J]. Advances in Atmospheric Sciences, 2017, 34(3): 397−410. doi: 10.1007/s00376-016-6159-y [34] Zheng Guangming, Tang Danling. Offshore and nearshore chlorophyll increases induced by typhoon and typhoon rain[J]. Marine Ecology Progress Series, 2007, 333: 61−74. doi: 10.3354/meps333061 -

 点击查看大图
计量
- 文章访问数: 211
- HTML全文浏览量: 83
- PDF下载量: 35
- 被引次数: 0
