A comparative study of three SST reanalysis products and buoys data over the China offshore area
-
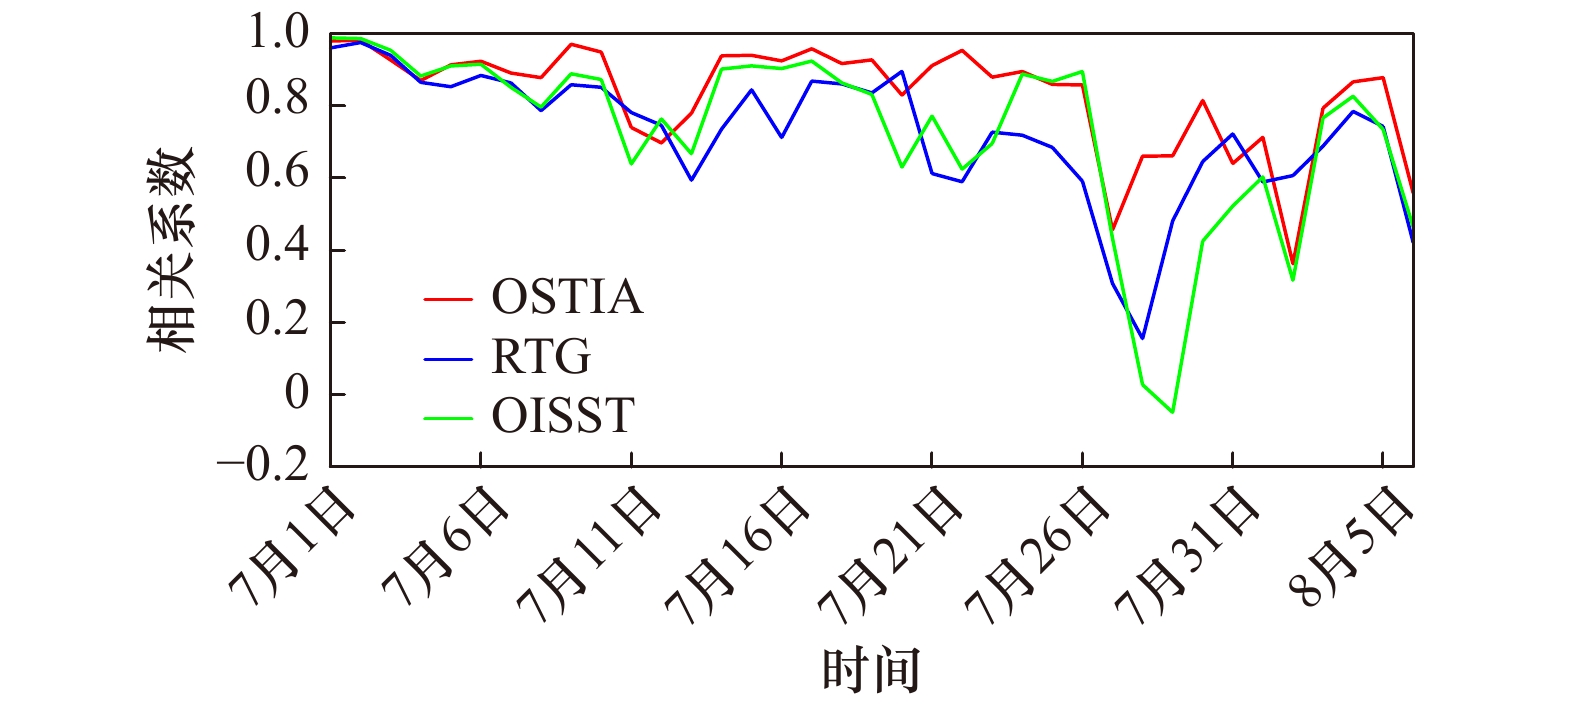
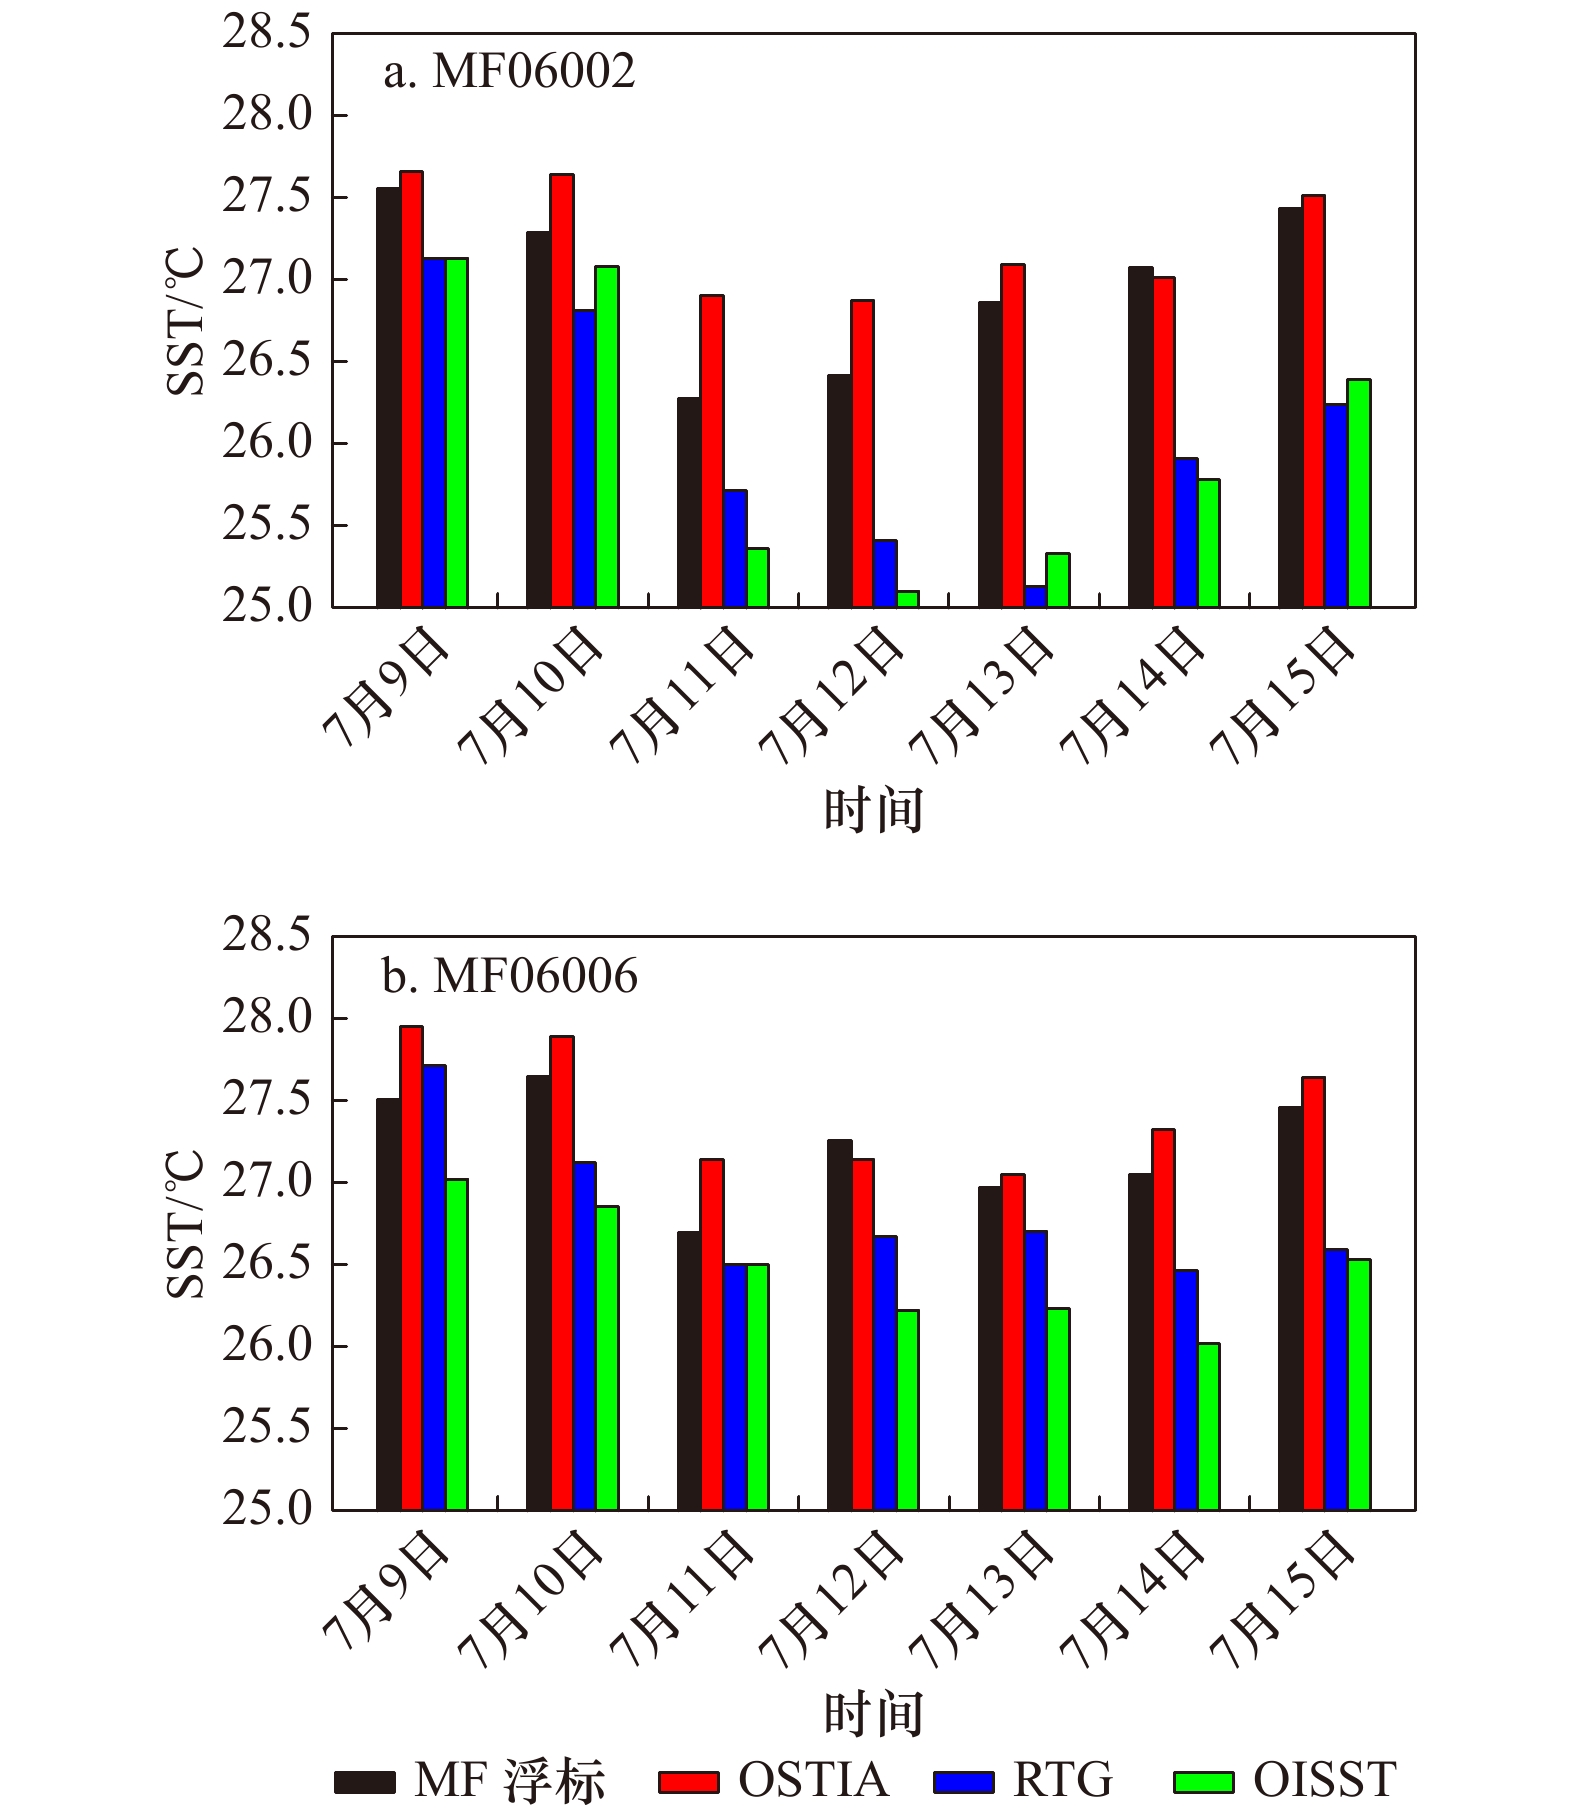
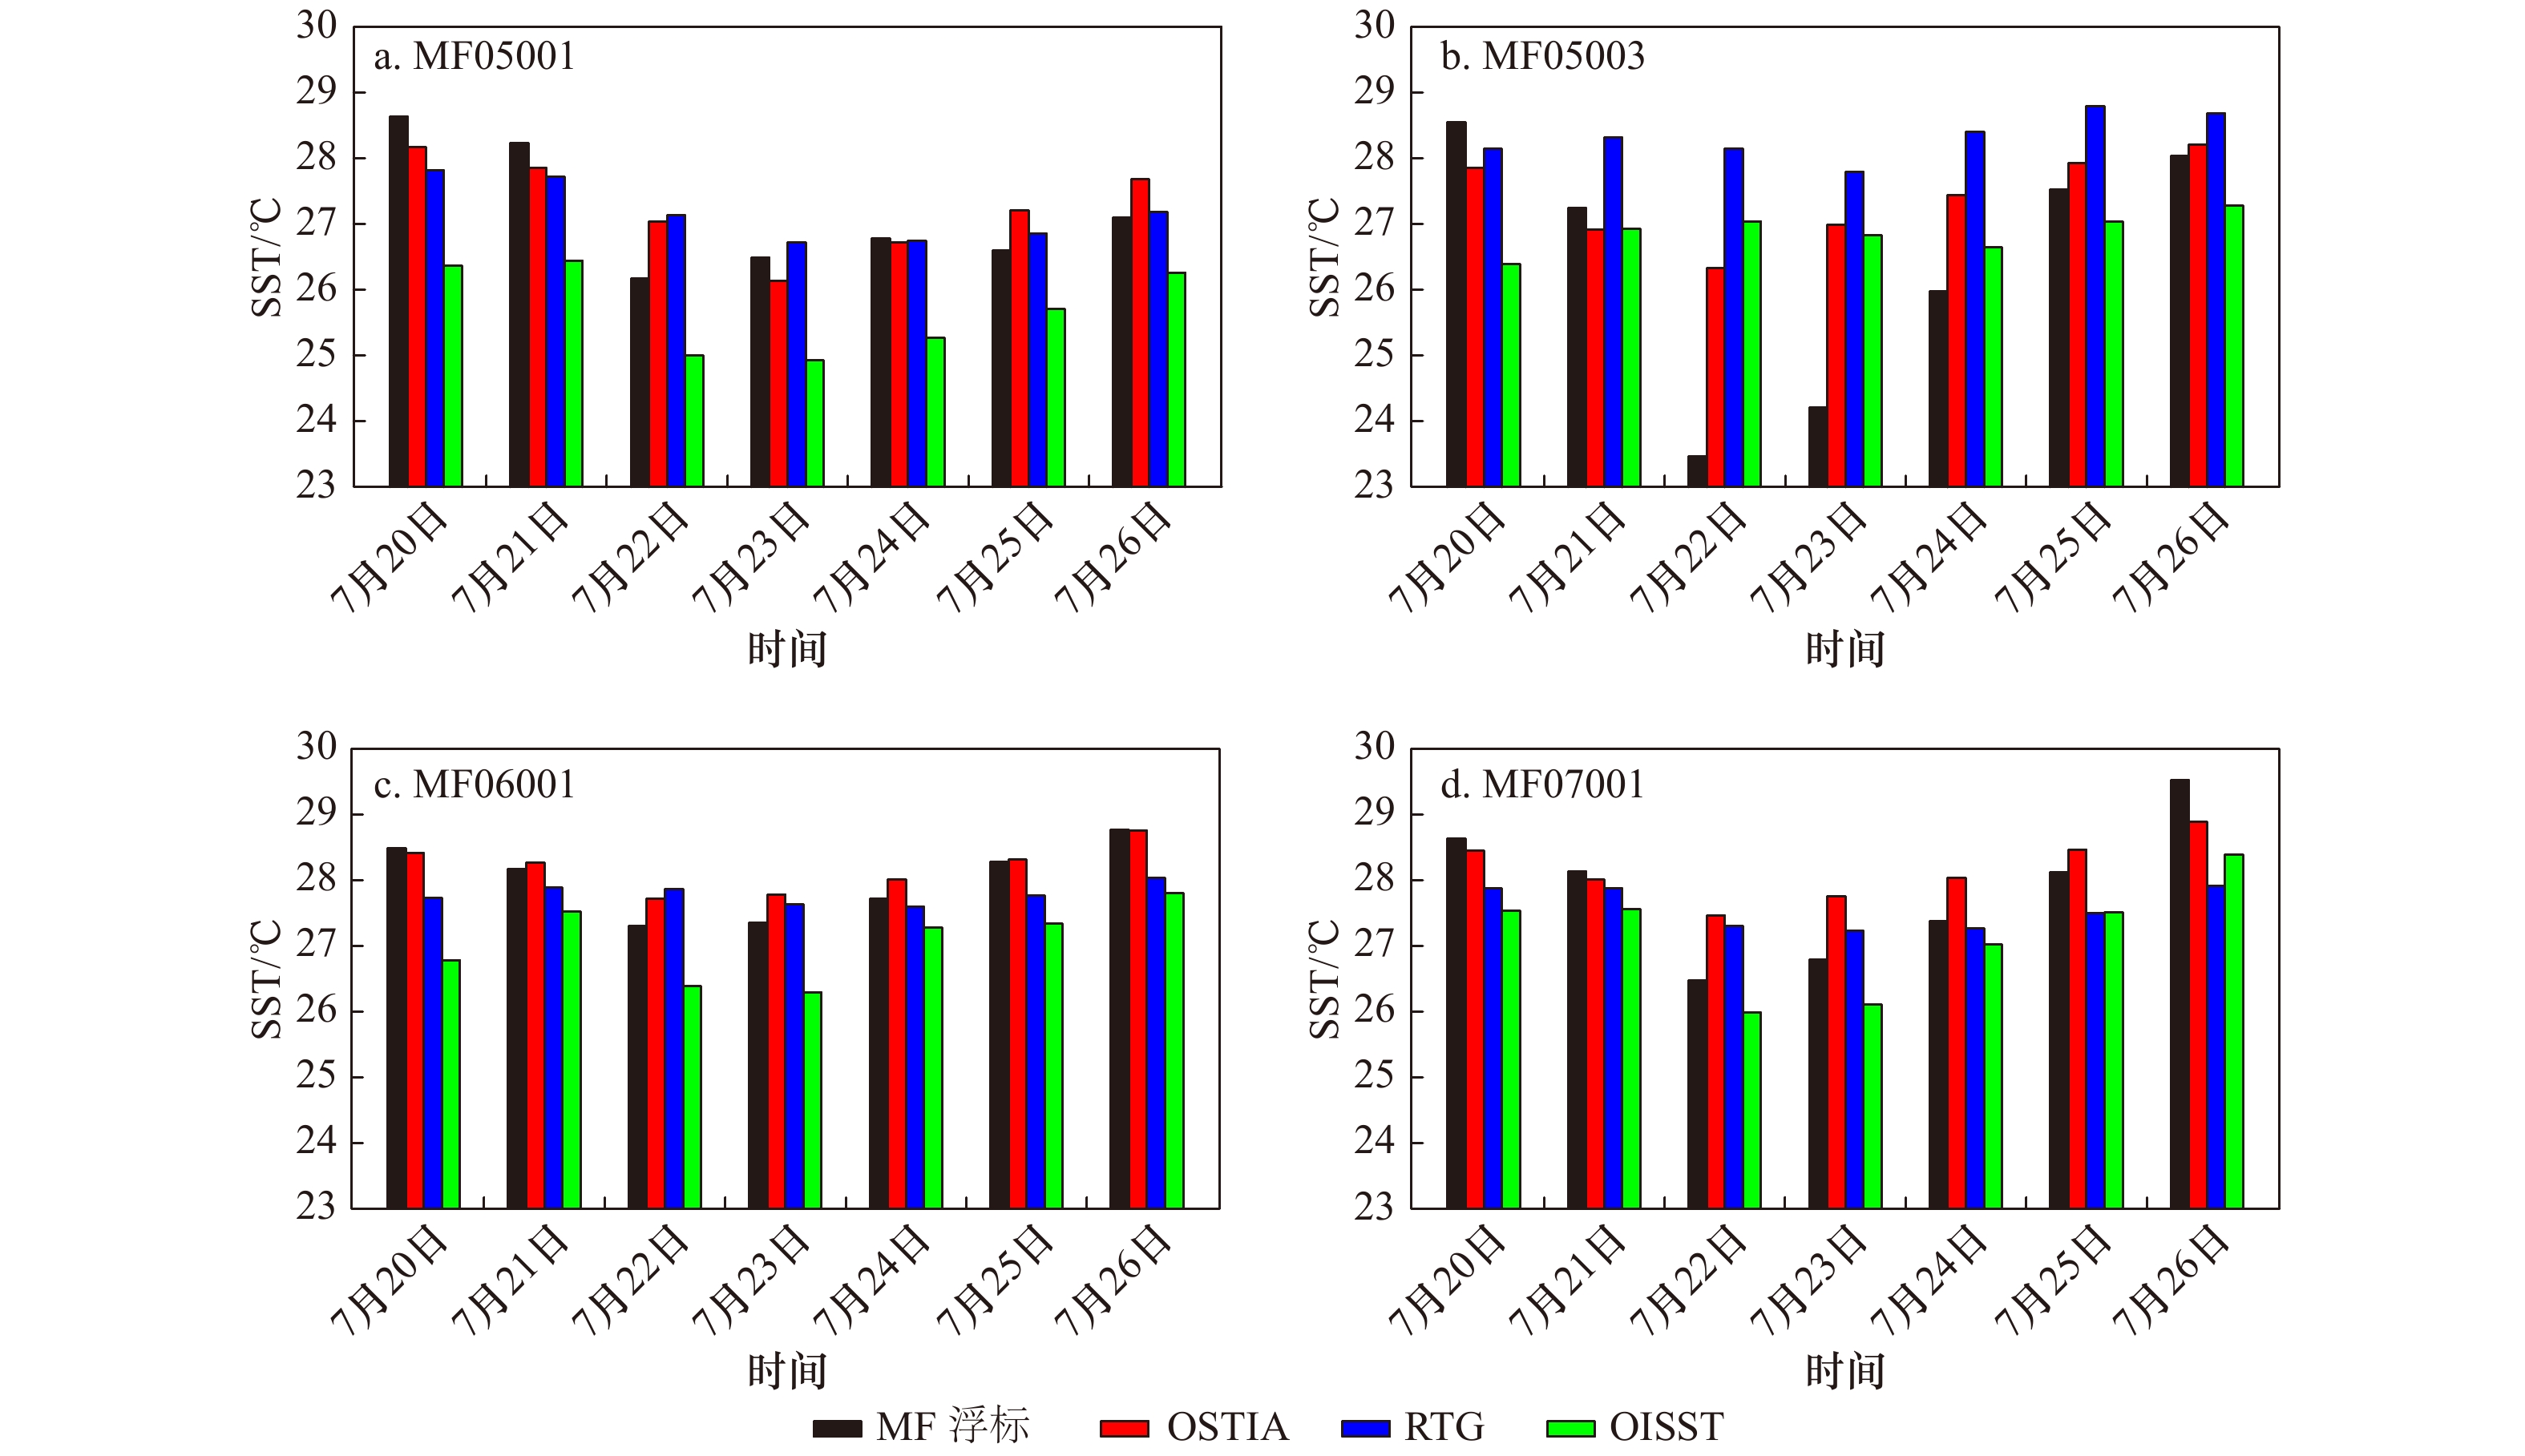
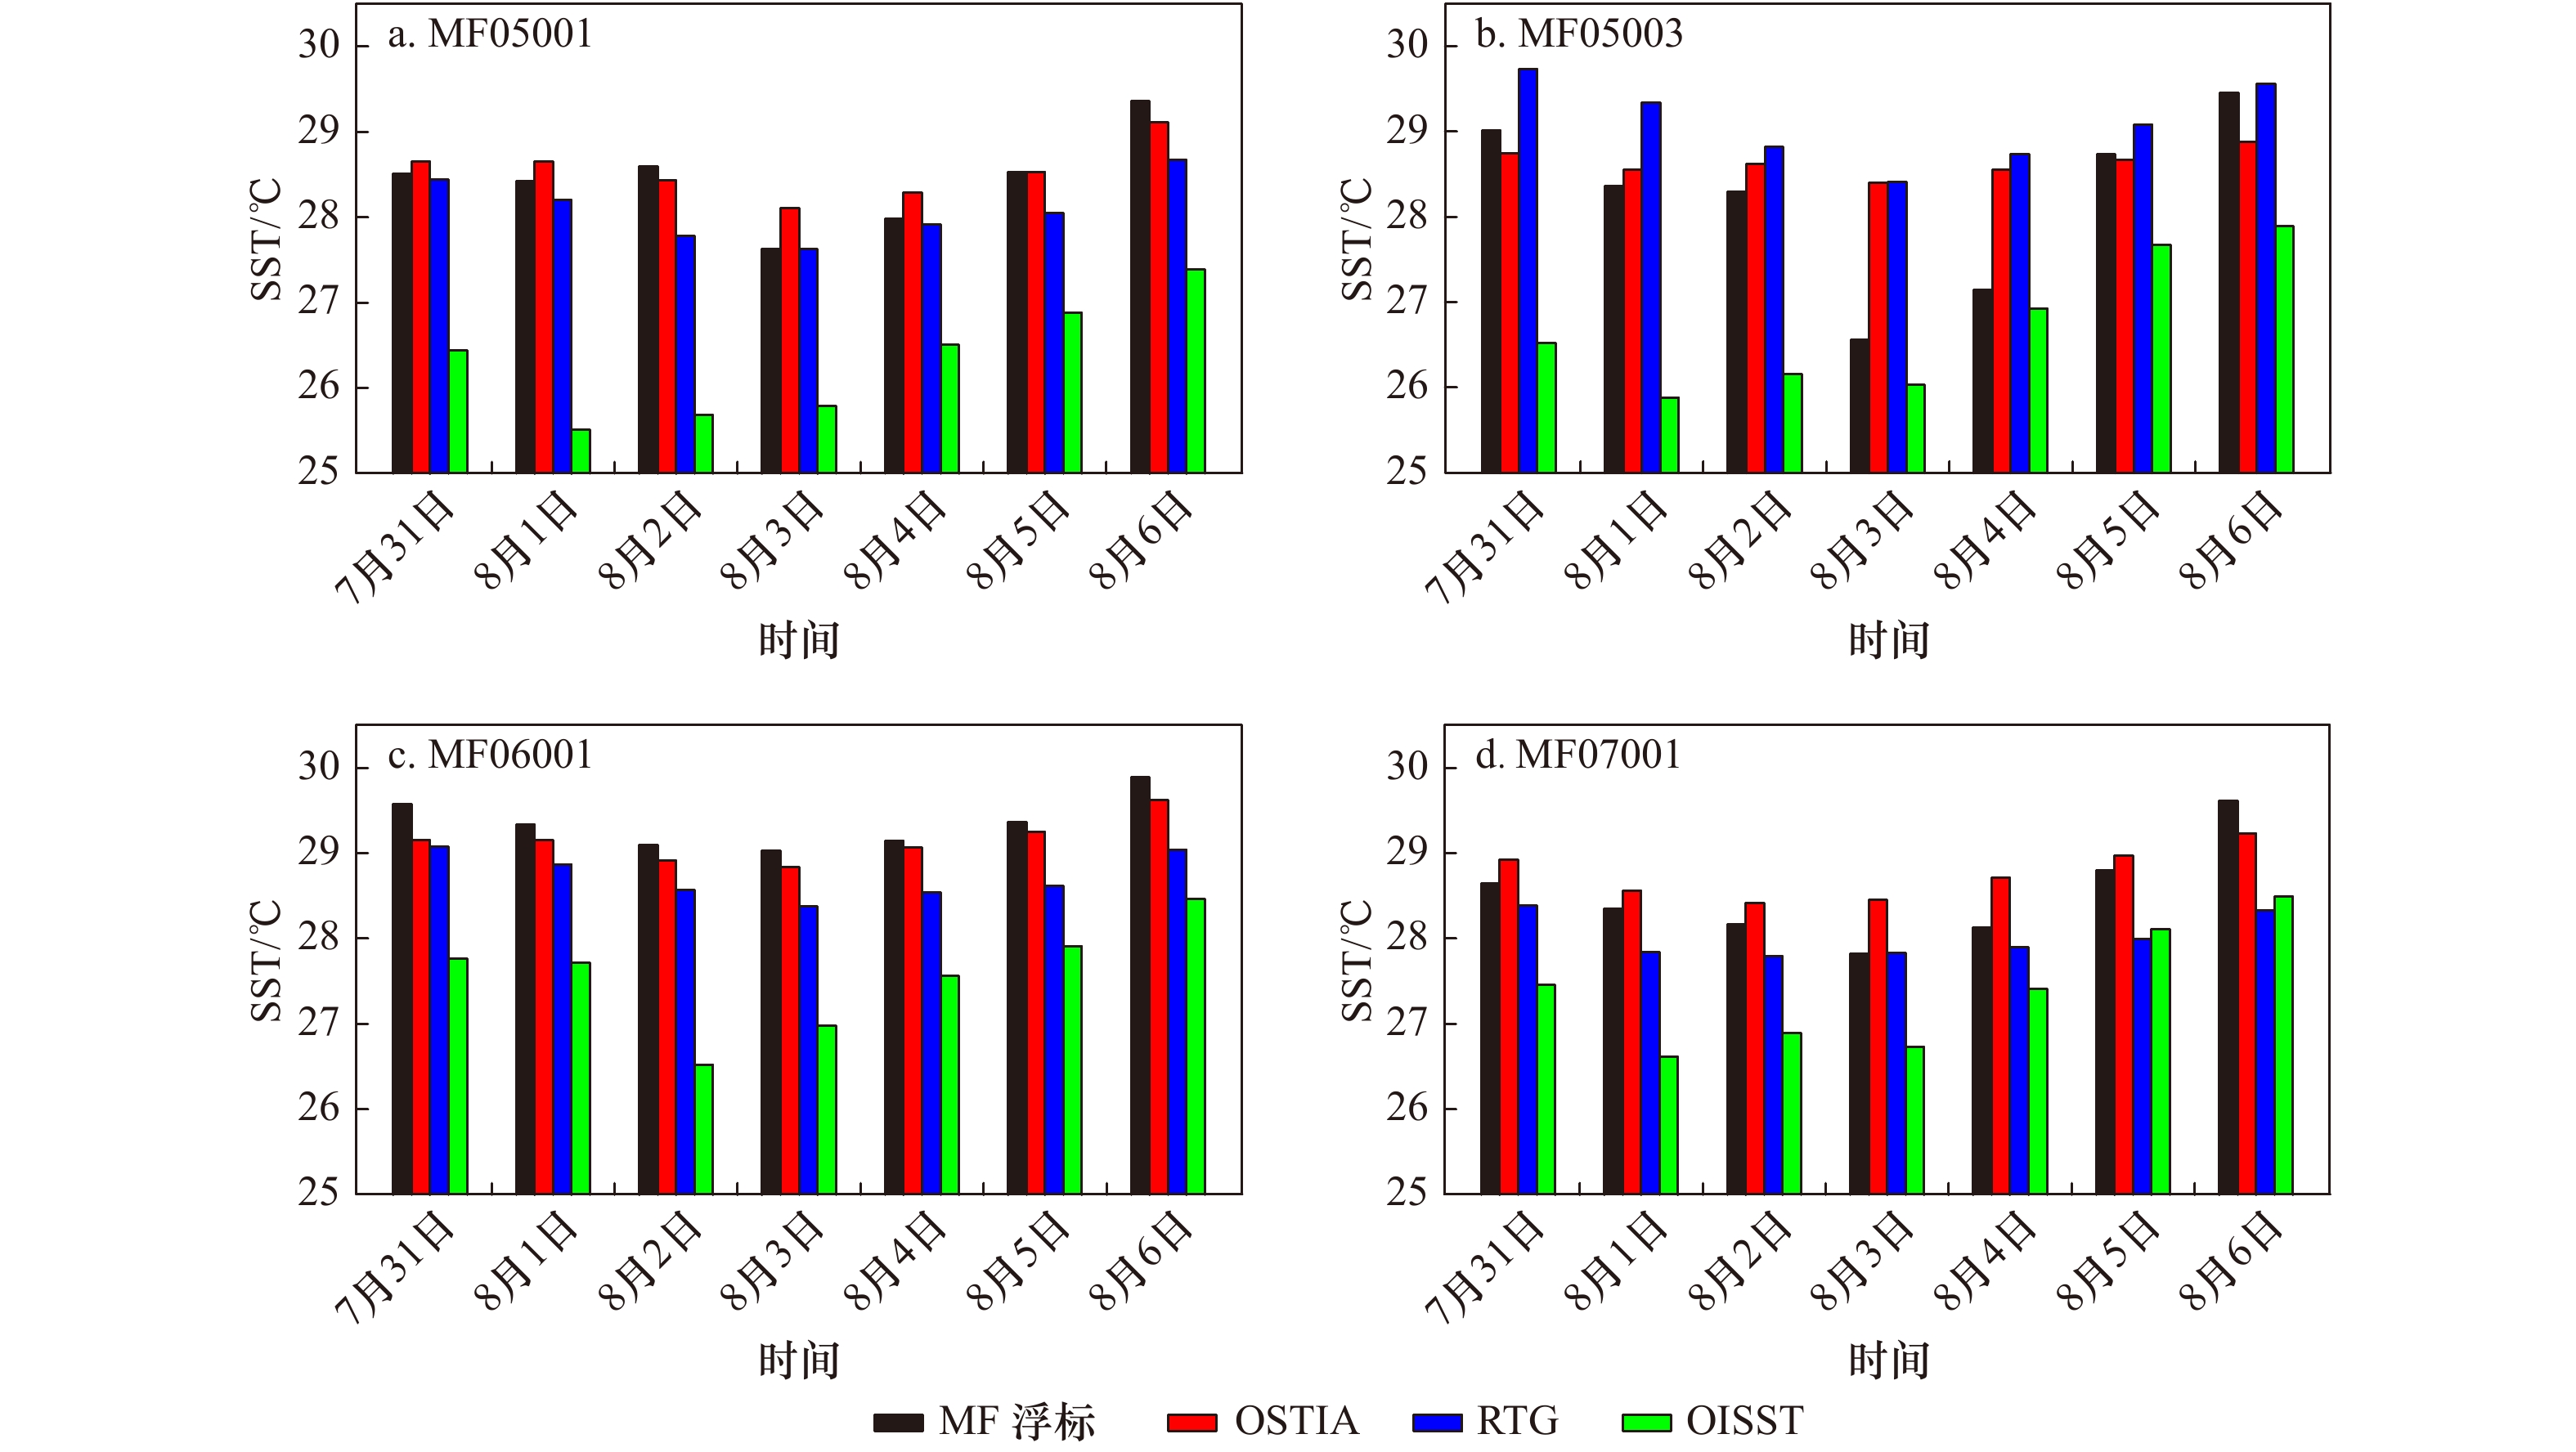
摘要: 基于自然资源部浮标数据,通过分析均值差、均方根误差、相关系数和标准差偏差4个统计量,检验了2018年7月1日至8月6日全时段及该时段内3个台风(1808号台风“玛利亚”、1810号台风“安比”、1812号台风“云雀”)过境期间,3套海表面温度(Sea Surface Temperature,SST)再分析资料(OISST、OSTIA SST、RTG SST)在中国近海区域的可靠性。对比结果表明,在全时段内,3套SST再分析资料都能在一定程度上反映中国近海SST的基本状况,其中OSTIA SST资料同浮标实测SST数据的均值差为0.12℃、相关系数为0.94,均优于OISST资料(均值差为–0.85℃、相关系数为0.90)和RTG SST资料(均值差为–0.17℃、相关系数为0.86)。通过对比单个浮标数据发现,相较约80%的MF浮标实测SST数据,OSTIA SST资料都显著优于RTG SST资料和OISST资料,具有较高的可信度。在台风过境期间,较之RTG SST资料和OISST资料,OSTIA SST资料同大部分浮标实测数据的均值差绝对值及均方根误差更小、相关系数更大,表明在高海况条件下,OSTIA SST资料能更真实地反映中国近海SST的基本状况。Abstract: Based on the buoys data over the China offshore area during July 1, 2018 to August 6, 2018 collected by the Ministry of Natural Resources, three SST reanalysis products (OISST, OSTIA SST, RTG SST) were validated and compared through analyzing the mean bias, root mean square error (RMSE), correlation coefficient and standard deviation bias. The comparison results show that in the whole time, three SST reanalysis products we used are comparable to the buoys data. The mean bias and correlation coefficient between OSTIA SST dataset and buoy SST data is 0.12℃ and 0.94, better than OISST dataset (−0.85℃, 0.90) and RTG SST dataset (−0.17℃, 0.86). Compared with 80% buoys, the reliability of OSTIA SST dataset is higher than OISST dataset and RTG SST dataset significantly. During typhoon transit periods, absolute values of mean bias and RMSE (correlation coefficient) between OSTIA SST dataset and buoy SST data are smaller (larger) than RTG SST dataset and OISST dataset, which means that OSTIA SST dataset can capture the basic characteristics of SST over the China offshore area more accurately in severe sea conditions.
-
Key words:
- China offshore area /
- buoy data /
- SST reanalysis products
-
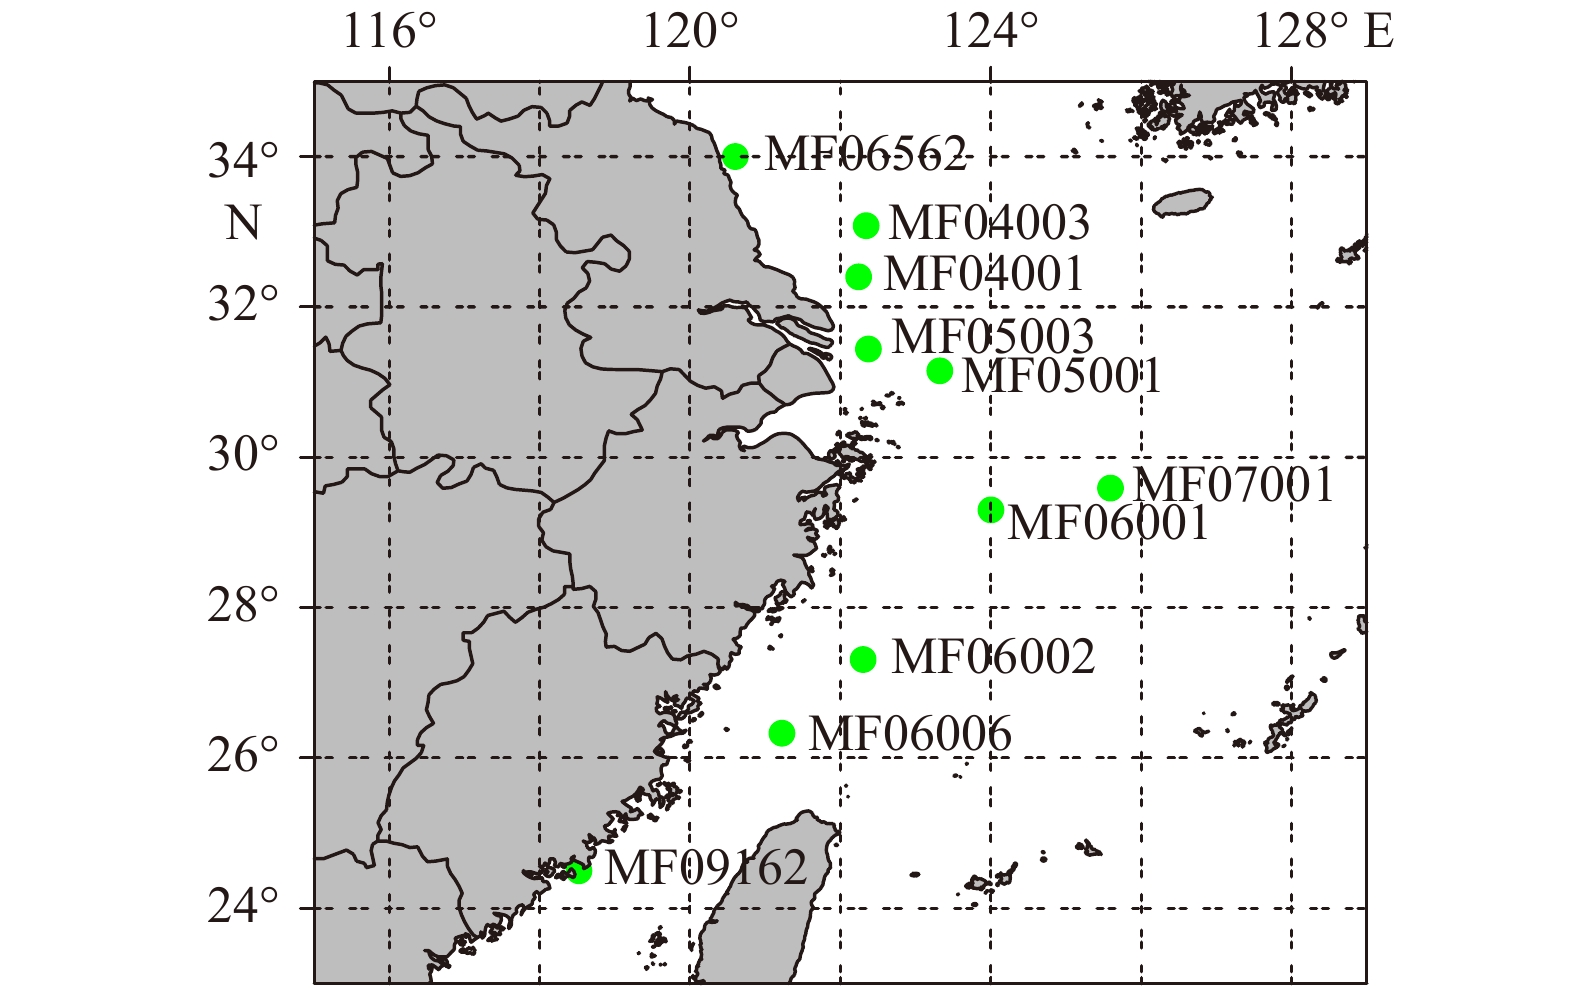
表 1 2018年7月1日至8月6日的OSTIA SST资料、RTG SST资料、OISST资料分别同MF浮标SST实测数据的均值差、均方根误差、相关系数及标准差偏差
Tab. 1 The mean bias, root mean square error, correlation coefficient and standard deviation bias between OSTIA SST dataset, RTG SST dataset, OISST dataset and the MF buoys SST data from July 1, 2018 to August 6, 2018
MF04001 MF04003 MF05001 MF05003 MF06001 OSTIA RTG OISST OSTIA RTG OISST OSTIA RTG OISST OSTIA RTG OISST OSTIA RTG OISST 均值差/℃ −0.21 0.17 −1.30 −0.42 −0.89 −1.77 0.04 −0.28 −1.46 0.33 0.47 −0.94 −0.08 −0.64 −1.26 均方根误差/℃ 1.03 1.11 1.81 0.99 1.47 2.00 0.39 0.56 1.58 1.04 1.39 1.68 0.26 0.79 1.38 相关系数 0.89 0.86 0.80 0.88 0.76 0.85 0.93 0.89 0.83 0.87 0.75 0.69 0.96 0.83 0.75 标准差偏差/℃ 0.02 −0.46 −0.46 0.09 −0.24 −0.14 −0.06 −0.13 −0.17 −0.56 −0.15 −0.65 −0.15 −0.02 −0.15 MF06002 MF06006 MF06562 MF07001 MF09162 OSTIA RTG OISST OSTIA RTG OISST OSTIA RTG OISST OSTIA RTG OISST OSTIA RTG OISST 均值差/℃ −0.07 −0.37 −0.67 0.12 0.23 −0.22 0.70 0.51 −0.33 0.20 −0.58 −0.71 0.59 −0.35 0.16 均方根误差/℃ 0.31 0.61 0.83 0.41 1.09 0.65 0.79 1.08 0.66 0.55 0.99 0.94 0.72 1.090 0.59 相关系数 0.96 0.95 0.91 0.92 0.78 0.87 0.98 0.95 0.96 0.92 0.72 0.88 0.72 0.76 0.69 标准差偏差/℃ −0.09 0.28 0.10 −0.18 0.19 0.10 0.10 0.66 0.24 −0.31 −0.33 −0.42 0.15 0.89 0.32 表 2 1808号台风期间,OSTIA SST资料、RTG SST资料、OISST资料分别同浮标MF06002及浮标MF06006的SST实测数据的均值差、均方根误差、相关系数及标准差偏差
Tab. 2 The mean bias, root mean square error, correlation coefficient and standard deviation bias between OSTIA SST dataset, RTG SST dataset, OISST dataset and the SST measurement data of buoy MF06002 and buoy MF06006 during the Typhoon 1808 period
MF06002 MF06006 OSTIA RTG OISST OSTIA RTG OISST 均值差/℃ 0.25 −0.94 −0.96 0.22 −0.40 −0.74 均方根误差/℃ 0.34 1.04 1.06 0.29 0.52 0.80 相关系数 0.90 0.76 0.86 0.85 0.64 0.61 标准差偏差/℃ −0.14 0.23 0.35 0.04 0.11 0.02 表 3 1810号台风期间,OSTIA SST资料、RTG SST资料、OISST资料分别同浮标MF05001、浮标MF05003、浮标MF06001及浮标MF07001的SST实测数据的均值差、均方根误差、相关系数及标准差偏差
Tab. 3 The mean bias, root mean square error, correlation coefficient and standard deviation bias between OSTIA SST dataset, RTG SST dataset, OISST dataset and the SST measurement data of buoy MF05001, MF05003, MF06001 and MF07001 during the Typhoon 1810 period
MF05001 MF05003 MF06001 MF07001 OSTIA RTG OISST OSTIA RTG OISST OSTIA RTG OISST OSTIA RTG OISST 均值差/℃ 0.12 0.02 −1.43 0.95 1.90 0.45 0.17 −0.22 −0.95 0.29 −0.30 −0.70 均方根误差/℃ 0.53 0.53 1.51 1.64 2.51 1.92 0.26 0.52 1.02 0.64 0.80 0.76 相关系数 0.80 0.88 0.85 0.83 0.60 −0.13 0.99 0.53 0.76 0.95 0.88 0.97 标准差偏差/℃ −0.23 −0.48 −0.27 −1.28 −1.61 −1.66 −0.20 −0.41 0.01 −0.58 −0.75 −0.21 表 4 1812号台风期间,OSTIA SST资料、RTG SST资料、OISST资料分别同浮标MF05001、浮标MF05003、浮标MF06001及浮标MF07001的SST实测数据的均值差、均方根误差、相关系数及标准差偏差
Tab. 4 The mean bias, root mean square error, correlation coefficient and standard deviation bias between OSTIA SST dataset, RTG SST dataset, OISST dataset and the SST measurement data of buoy MF05001, MF05003, MF06001 and MF07001 during the Typhoon 1812 period
MF05001 MF05003 MF06001 MF07001 OSTIA RTG OISST OSTIA RTG OISST OSTIA RTG OISST OSTIA RTG OISST 均值差/℃ 0.11 −0.33 −2.12 0.40 0.87 −1.50 −0.21 −0.61 −1.78 0.25 −0.49 −1.12 均方根误差/℃ 0.27 0.45 2.18 0.92 1.06 1.73 0.23 0.63 1.83 0.39 0.63 1.17 相关系数 0.95 0.81 0.58 0.92 0.89 0.51 0.93 0.89 0.85 0.92 0.76 0.87 标准差偏差/℃ −0.22 −0.18 0.15 −0.88 −0.56 −0.23 −0.05 −0.03 0.33 −0.29 −0.34 0.12 -
[1] 鲍献文, 万修全, 高郭平, 等. 渤海、黄海、东海AVHRR海表温度场的季节变化特征[J]. 海洋学报, 2002, 24(5): 125−133.Bao Xianwen, Wan Xiuquan, Gao Guoping, et al. The characteristics of the seasonal variability of the sea surface temperature field in the Bohai Sea, the Huanghai Sea and the East China Sea from AVHRR data[J]. Haiyang Xuebao, 2002, 24(5): 125−133. [2] Curry J A, Bentamy A, Bourassa M A, et al. Seaflux[J]. Bulletin of the American Meteorological Society, 2004, 85(3): 409−424. doi: 10.1175/BAMS-85-3-409 [3] Fischer M, Latif M, Flügel M, et al. The impact of data assimilation on ENSO simulations and predictions[J]. Monthly Weather Review, 1995, 125(5): 819−830. [4] Behringer D W, Ji Ming, Leetmaa A. An improved coupled model for ENSO prediction and implications for ocean initialization. Part I: the ocean data assimilation system[J]. Monthly Weather Review, 1998, 126(4): 1013−1021. doi: 10.1175/1520-0493(1998)126<1013:AICMFE>2.0.CO;2 [5] Ji Ming, Behringer D W, Leetmaa A. An improved coupled model for ENSO prediction and implications for ocean initialization. Part Ⅱ: the coupled model[J]. Monthly Weather Review, 1998, 126(4): 1022−1034. doi: 10.1175/1520-0493(1998)126<1022:AICMFE>2.0.CO;2 [6] Sutton R T, Hodson D L R. Influence of the ocean on North Atlantic climate variability 1871−1999[J]. Journal of Climate, 2003, 16(20): 3296−3313. doi: 10.1175/1520-0442(2003)016<3296:IOTOON>2.0.CO;2 [7] 宝乐尔其木格, 任国玉. 海温观测方法及常用海温资料数据集比较[J]. 气象科技进展, 2013, 3(6): 52−57.Baoleerqimuge, Ren Guoyu. Sea surface temperature observation methods and comparison of commonly used sea surface temperature datasets[J]. Advances in Meteorological Science and Technology, 2013, 3(6): 52−57. [8] 王世红, 赵一丁, 尹训强, 等. 全球海洋再分析产品的研究现状[J]. 地球科学进展, 2018, 33(8): 794−807. doi: 10.11867/j.issn.1001-8166.2018.08.0794Wang Shihong, Zhao Yiding, Yin Xunqiang, et al. Current status of global ocean reanalysis datasets[J]. Advances in Earth Science, 2018, 33(8): 794−807. doi: 10.11867/j.issn.1001-8166.2018.08.0794 [9] 乔方利, Zhang Shaoqing. 现代海洋/大气资料同化方法的统一性及其应用进展[J]. 海洋科学进展, 2002, 20(4): 79−93. doi: 10.3969/j.issn.1671-6647.2002.04.013Qiao Fangli, Zhang Shaoqing. The unification and application reviews of modern oceanic/atmospheric data assimilation algorithms[J]. Advances in Marine Science, 2002, 20(4): 79−93. doi: 10.3969/j.issn.1671-6647.2002.04.013 [10] Hurlburt H E, Brassington G B, Drillet Y, et al. High-resolution global and basin-scale ocean analyses and forecasts[J]. Oceanography, 2009, 22(3): 110−127. doi: 10.5670/oceanog.2009.70 [11] Guinehut S, Dhomps A L, Larnicol G, et al. High resolution 3-D temperature and salinity fields derived from in situ and satellite observations[J]. Ocean Science, 2012, 8(5): 845−857. doi: 10.5194/os-8-845-2012 [12] 蒋兴伟, 奚萌, 宋清涛. 六种遥感海表温度产品的比对分析[J]. 海洋学报, 2013, 35(4): 88−97.Jiang Xingwei, Xi Meng, Song Qingtao. A comparison analysis of six sea surface temperature products[J]. Haiyang Xuebao, 2013, 35(4): 88−97. [13] 赵洪臣, 刘永学, 周兴华, 等. 基于志愿观测船舶和浮标数据的SST日产品质量评价研究[J]. 海洋科学进展, 2016, 34(4): 462−473. doi: 10.3969/j.issn.1671-6647.2016.04.002Zhao Hongchen, Liu Yongxue, Zhou Xinghua, et al. Quality evaluation of SST daily products based on VOS and buoy measurements[J]. Advances in Marine Science, 2016, 34(4): 462−473. doi: 10.3969/j.issn.1671-6647.2016.04.002 [14] Gentemann C L, Wentz F J, Mears C A, et al. In situ validation of tropical rainfall measuring mission microwave sea surface temperatures[J]. Journal of Geophysical Research: Oceans, 2004, 109(C4): C04021. [15] 周为峰, 张运刚. 基于ARGO资料的MTSAT海温产品误差分析[J]. 海洋湖沼通报, 2008(4): 1−6. doi: 10.3969/j.issn.1003-6482.2008.04.001Zhou Weifeng, Zhang Yungang. Error characteristics analysis of sea surface temperatures retrieved from MTSAT satellite using ARGO data[J]. Transactions of Oceanology and Limnology, 2008(4): 1−6. doi: 10.3969/j.issn.1003-6482.2008.04.001 [16] 李明, 刘骥平, 张占海, 等. 利用南大洋漂流浮标数据评估AMSR-E SST[J]. 海洋学报, 2010, 32(6): 47−55.Li Ming, Liu Jiping, Zhang Zhanhai, et al. Evaluation of AMSR-E SST in the Southern Ocean using drifting buoy data[J]. Haiyang Xuebao, 2010, 32(6): 47−55. [17] Reynolds R W, Chelton D B. Comparisons of daily sea surface temperature analyses for 2007-08[J]. Journal of Climate, 2010, 23(13): 3545−3562. doi: 10.1175/2010JCLI3294.1 [18] Kachi M, Naoki K, Hori M, et al. AMSR2 validation results[C]//2013 IEEE International Geoscience and Remote Sensing Symposium. VIC, Australia: IEEE, 2014. [19] Kachi M, Shibata A, Murakami H, et al. Japanese GHRSST activities and the AMSR2 SST Validations[C]//EGU General Assembly Conference. Vienna, Austria: EGU, 2014. [20] 朱恩泽, 张雷, 石汉青, 等. 2004年—2013年WindSat海表面温度产品与浮标观测对比[J]. 遥感学报, 2016, 20(2): 315−327.Zhu Enze, Zhang Lei, Shi Hanqing, et al. Accuracy of WindSat sea surface temperature: Comparison of buoy data from 2004 to 2013[J]. Journal of Remote Sensing, 2016, 20(2): 315−327. [21] 雷小途, 陈佩燕, 杨玉华, 等. 中国台风灾情特征及其灾害客观评估方法[J]. 气象学报, 2009, 67(5): 875−883.Lei Xiaotu, Chen Peiyan, Yang Yuhua, et al. Characters and objective assessment of disasters caused by typhoons in China[J]. Acta Meteorologica Sinica, 2009, 67(5): 875−883. [22] Holland G J. The maximum potential intensity of tropical cyclones[J]. Journal of the Atmospheric Sciences, 1997, 54(21): 2519−2541. doi: 10.1175/1520-0469(1997)054<2519:TMPIOT>2.0.CO;2 [23] 蔡树群, 张文静, 王盛安. 海洋环境观测技术研究进展[J]. 热带海洋学报, 2007, 26(3): 76−81. doi: 10.3969/j.issn.1009-5470.2007.03.014Cai Shuqun, Zhang Wenjing, Wang Sheng’an. An advance in marine environment observation technology[J]. Journal of Tropical Oceanography, 2007, 26(3): 76−81. doi: 10.3969/j.issn.1009-5470.2007.03.014 [24] 王军成. 海洋资料浮标原理与工程[M]. 北京: 海洋出版社, 2013.Wang Juncheng. Principle and Project of the Oceanic Data Buoy[M]. Beijing: China Ocean Press, 2013. [25] 王波, 李民, 刘世萱, 等. 海洋资料浮标观测技术应用现状及发展趋势[J]. 仪器仪表学报, 2014, 35(11): 2401−2414.Wang Bo, Li Min, Liu Shixuan, et al. Current status and trend of ocean data buoy observation technology applications[J]. Chinese Journal of Scientific Instrument, 2014, 35(11): 2401−2414. [26] Wang Juncheng, Wang Zhongqiu, Wang Yiming, et al. Current situation and trend of marine data buoy and monitoring network technology of China[J]. Acta Oceanologica Sinica, 2016, 35(2): 1−10. doi: 10.1007/s13131-016-0815-z [27] Reynolds R W, Rayner N A, Smith T M, et al. An improved in situ and satellite SST analysis for climate[J]. Journal of Climate, 2002, 15(13): 1609−1625. doi: 10.1175/1520-0442(2002)015<1609:AIISAS>2.0.CO;2 [28] Reynolds R W, Smith T M, Liu Chunying, et al. Daily high-resolution-blended analyses for sea surface temperature[J]. Journal of Climate, 2007, 20(22): 5473−5496. doi: 10.1175/2007JCLI1824.1 [29] Kilpatrick K A, Podestá G, Walsh S, et al. A decade of sea surface temperature from MODIS[J]. Remote Sensing of Environment, 2015, 165: 27−41. doi: 10.1016/j.rse.2015.04.023 [30] Donlon C J, Martin M, Stark J, et al. The operational sea surface temperature and sea ice analysis (OSTIA) system[J]. Remote Sensing of Environment, 2012, 116: 140−158. doi: 10.1016/j.rse.2010.10.017 [31] Breivik L A, Eastwood S, Gødoy Ø, et al. Sea ice products for EUMETSAT satellite application facility[J]. Canadian Journal of Remote Sensing, 2001, 27(5): 403−410. doi: 10.1080/07038992.2001.10854883 [32] Andersen S, Breivik L, Eastwood S, et al. Ocean & sea ice SAF-sea ice product manual version3.8[M/OL].[2015−11−09]. http://saf.met.no/docs/ss2_pmseaice_v3p5.pdf. [33] Chelton D B, Wentz F J. Global microwave satellite observations of sea surface temperature for numerical weather prediction and climate research[J]. Bulletin of the American Meteorological Society, 2005, 86(8): 1097−1116. doi: 10.1175/BAMS-86-8-1097 [34] Black P G. Ocean temperature changes induced by tropical cyclones[D]. Old Main, University Park, PA, USA: The Pennsylvania State University, 1983. [35] Wada A. Numerical simulations of sea surface cooling by a mixed layer model during the passage of typhoon Rex[J]. Journal of Oceanography, 2005, 61(1): 41−57. doi: 10.1007/s10872-005-0018-2 [36] 罗曼. 高海况下卫星雷达高度计参数反演的影响因素分析研究[D]. 武汉: 华中科技大学, 2016.Luo Man. Analysis of influencing factors on the parameters of the satellite radar altimeter in high sea condition[D]. Wuhan: Huazhong University of Science and Technology, 2016. [37] 杨乐. 卫星雷达高度计在中国近海及高海况下遥感反演算法研究[D]. 南京: 南京理工大学, 2009.Yang Le. Study on satellite radar altimeter retrieval algorithms over coastal seas and under high sea state events[D]. Nanjing: Nanjing University of Science and Technology, 2009. -


 下载:
下载:

