

Polar sea ice concentration retrieval based on FY-3C microwave radiation imager data
-
摘要: 极区海冰影响大气和海洋环流,对全球气候变化起着重要的作用。海冰密集度是表征海冰时空变化特征的重要参数之一。本文研究了利用FY-3C微波扫描辐射计亮温数据反演极区海冰密集度的方法。经过时空匹配、线性回归,修正了FY-3C微波辐射计亮温数据。使用两种天气滤波器和海冰掩模滤除了大气影响所造成的开阔海域虚假海冰;使用最小密集度模板去除陆地污染效应。通过计算2016年、2017年极区海冰面积及范围两个参数,对得到的海冰密集度产品进行了验证,两年的海冰范围和面积趋势基本与NSIDC产品一致,平均差异小于3%。本研究结果为发布我国自主卫星的极区海冰密集度业务化产品奠定了基础,制作的产品可保障面临中断的40多年极区海冰记录的连续性。Abstract: Polar sea ice affects atmospheric and ocean circulation and it plays an important role in global climate change. The sea ice concentration is one of the important parameters to characterize the temporal and spatial variation of sea ice. The retrieval algorithm of sea ice concentration based on brightness temperature data of FY-3C microwave radiation imager in the polar region was studied. After the time-space matching and linear regression, FY-3C microwave radiometers brightness temperature data was corrected. The atmospheric effects were reduced using two weather filters and sea ice mask. A minimum ice concentration array used in the procedure reduced the land-to-ocean spillover effect. The sea ice concentration product was validated by calculating Arctic and Antarctic sea ice extent and area in 2016−2017. The sea ice extent and area trends of this two years were basically consistent with the NSIDC product, with an average difference of 3%. This research laid the foundation for the release of the polar sea ice concentration business products of China's autonomous satellites, and the products guarantee the continuity of crucial polar sea ice record that might soon be interrupted.
-
Key words:
- FY-3C /
- sea ice concentration /
- microwave radiation imager /
- Arctic /
- Antarctic
-
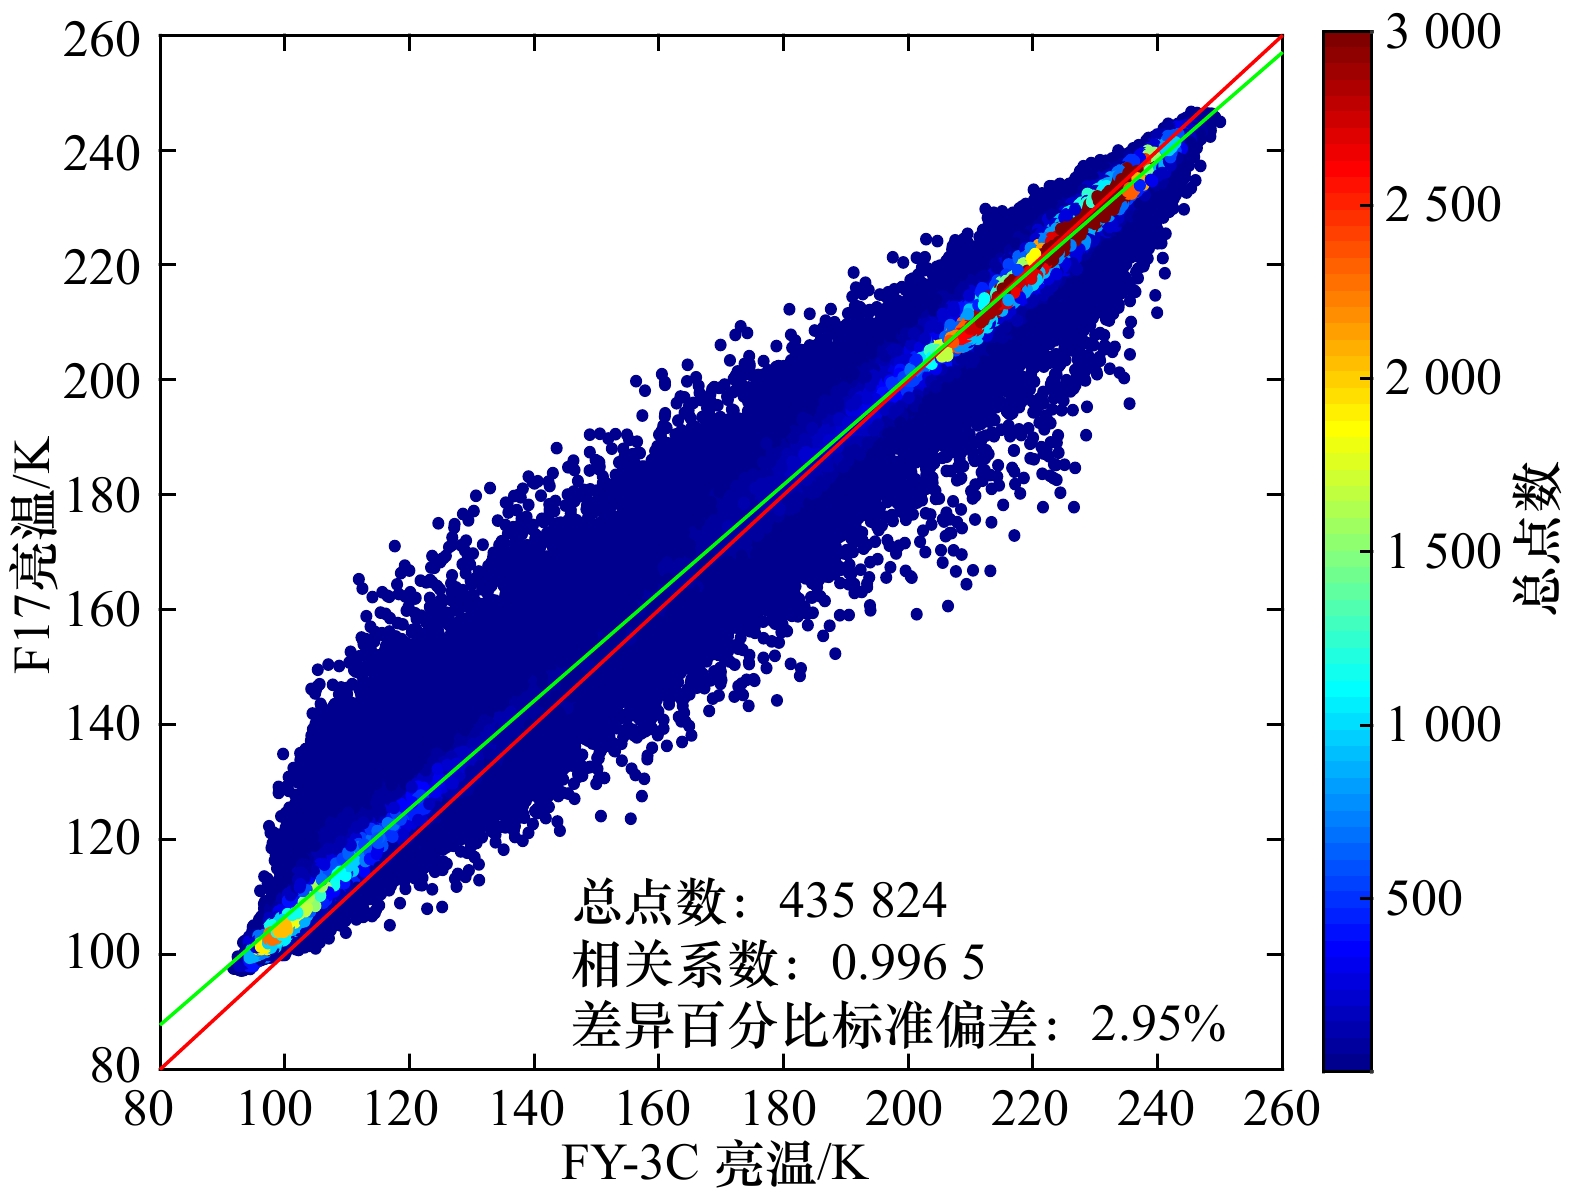
图 1 2016年3月19H通道FY-3C与F17亮温对比散点图
Fig. 1 Brightness temperature scatter plot at 19H of FY-3C and F17 on March, 2016

图 2 微波天线的粗分辨率对海岸线附近亮温的影响示意图(a),在程序中使用7×7阵列以减少陆地到海洋的溢出效应(b)(据参考文献[19])
Fig. 2 Schematic illustrating the effect of the coarse resolution of the microwave antenna on brightness temperatures near a coastline (a), and seven-by-seven array used in the procedure to reduce the land-to-ocean spillover effect (b) (refer to reference [19])
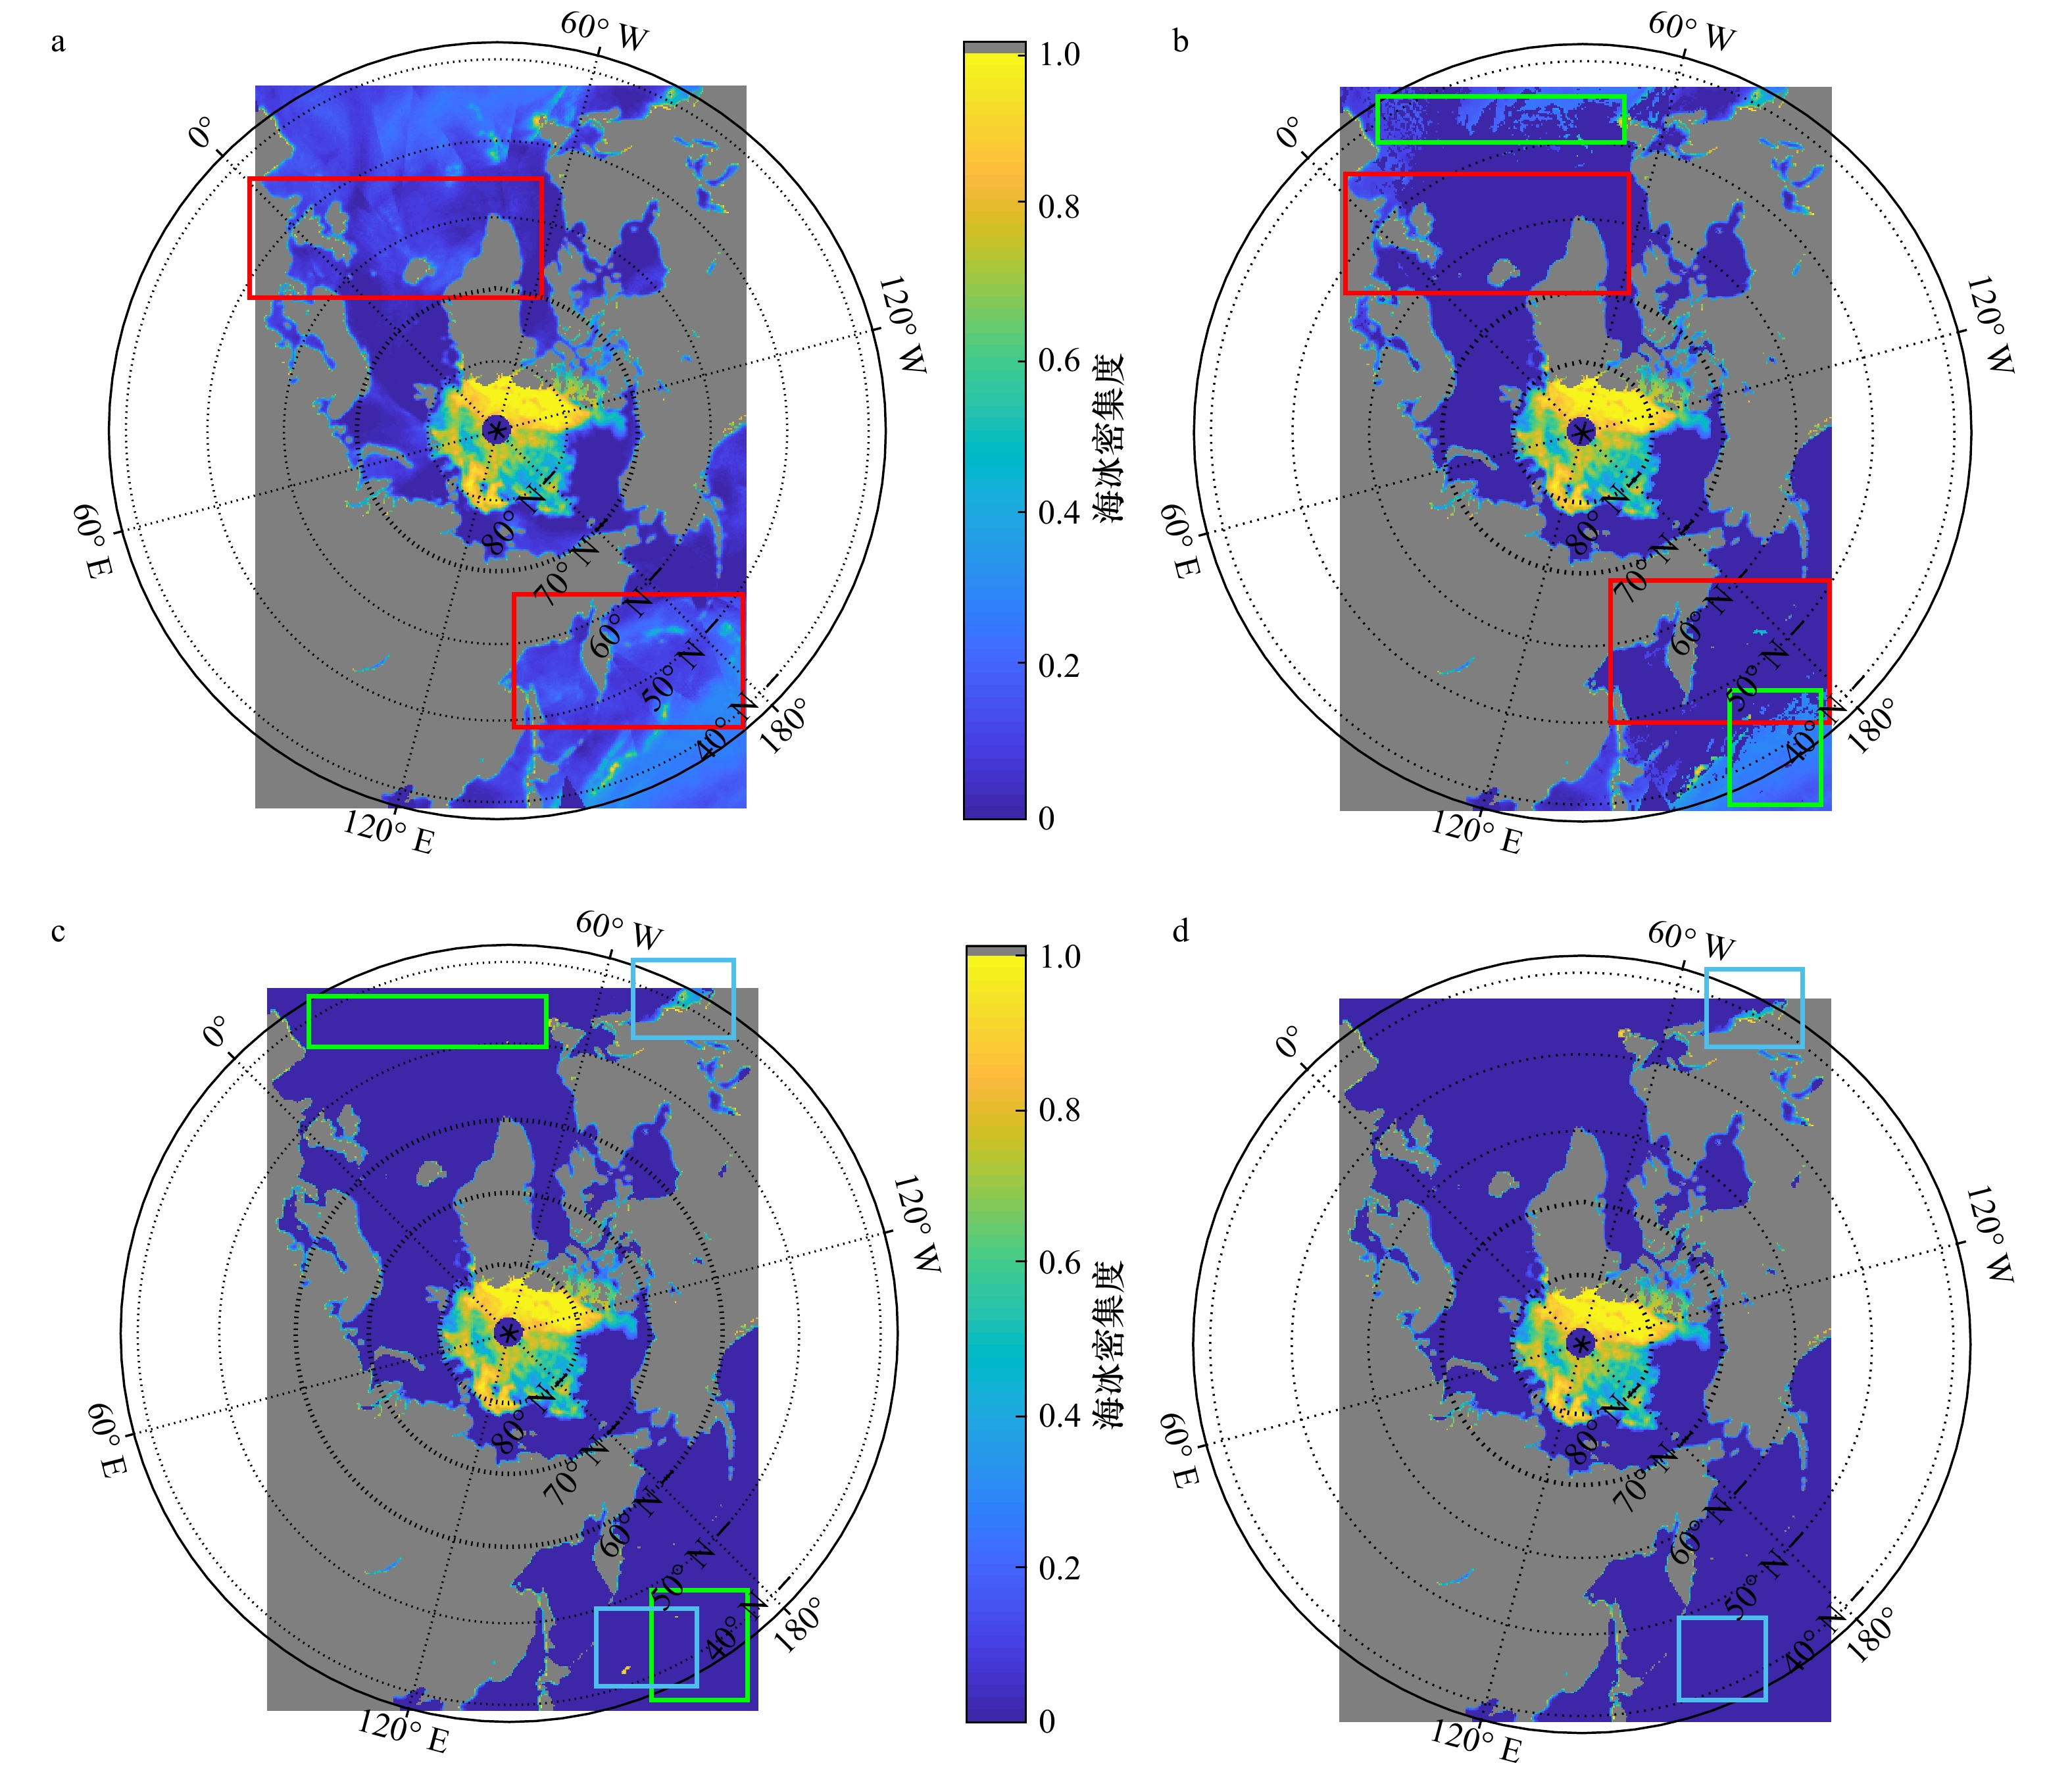
图 3 2017年8月26日北极天气效应去除和未去除的海冰密集度结果
a. 未使用天气滤波器;b. 使用GR(36.5/18.7)天气滤波器;c. 使用两种天气滤波器;d. 使用两种天气滤波器和海冰掩模
Fig. 3 Sea ice concentration result with and without weather filter of north polar zone on August 26, 2017
a. Result without using weather filter; b. result with GR (36.5/18.7) weather filter; c. result with two weather filter; d. result with two weather filter and ice mask

图 4 2017年8月26日北极海冰密集度差异
a. 未去除陆地污染与NSIDC产品的差异;b. 去除陆地污染后与NSIDC产品的差异
Fig. 4 Ice concentration difference on August 26, 2017
a. Subtract NSIDC from result with land-to-ocean spillover; b. difference between reduced the land-to-ocean spillover effect and NSIDC

图 5 2016−2017年北极(a)和南极(b)海冰范围和面积时间序列比较
Fig. 5 Daily averaged time series of total Arctic (a) and Antarctic (b) ice extent and area for 2016−2017
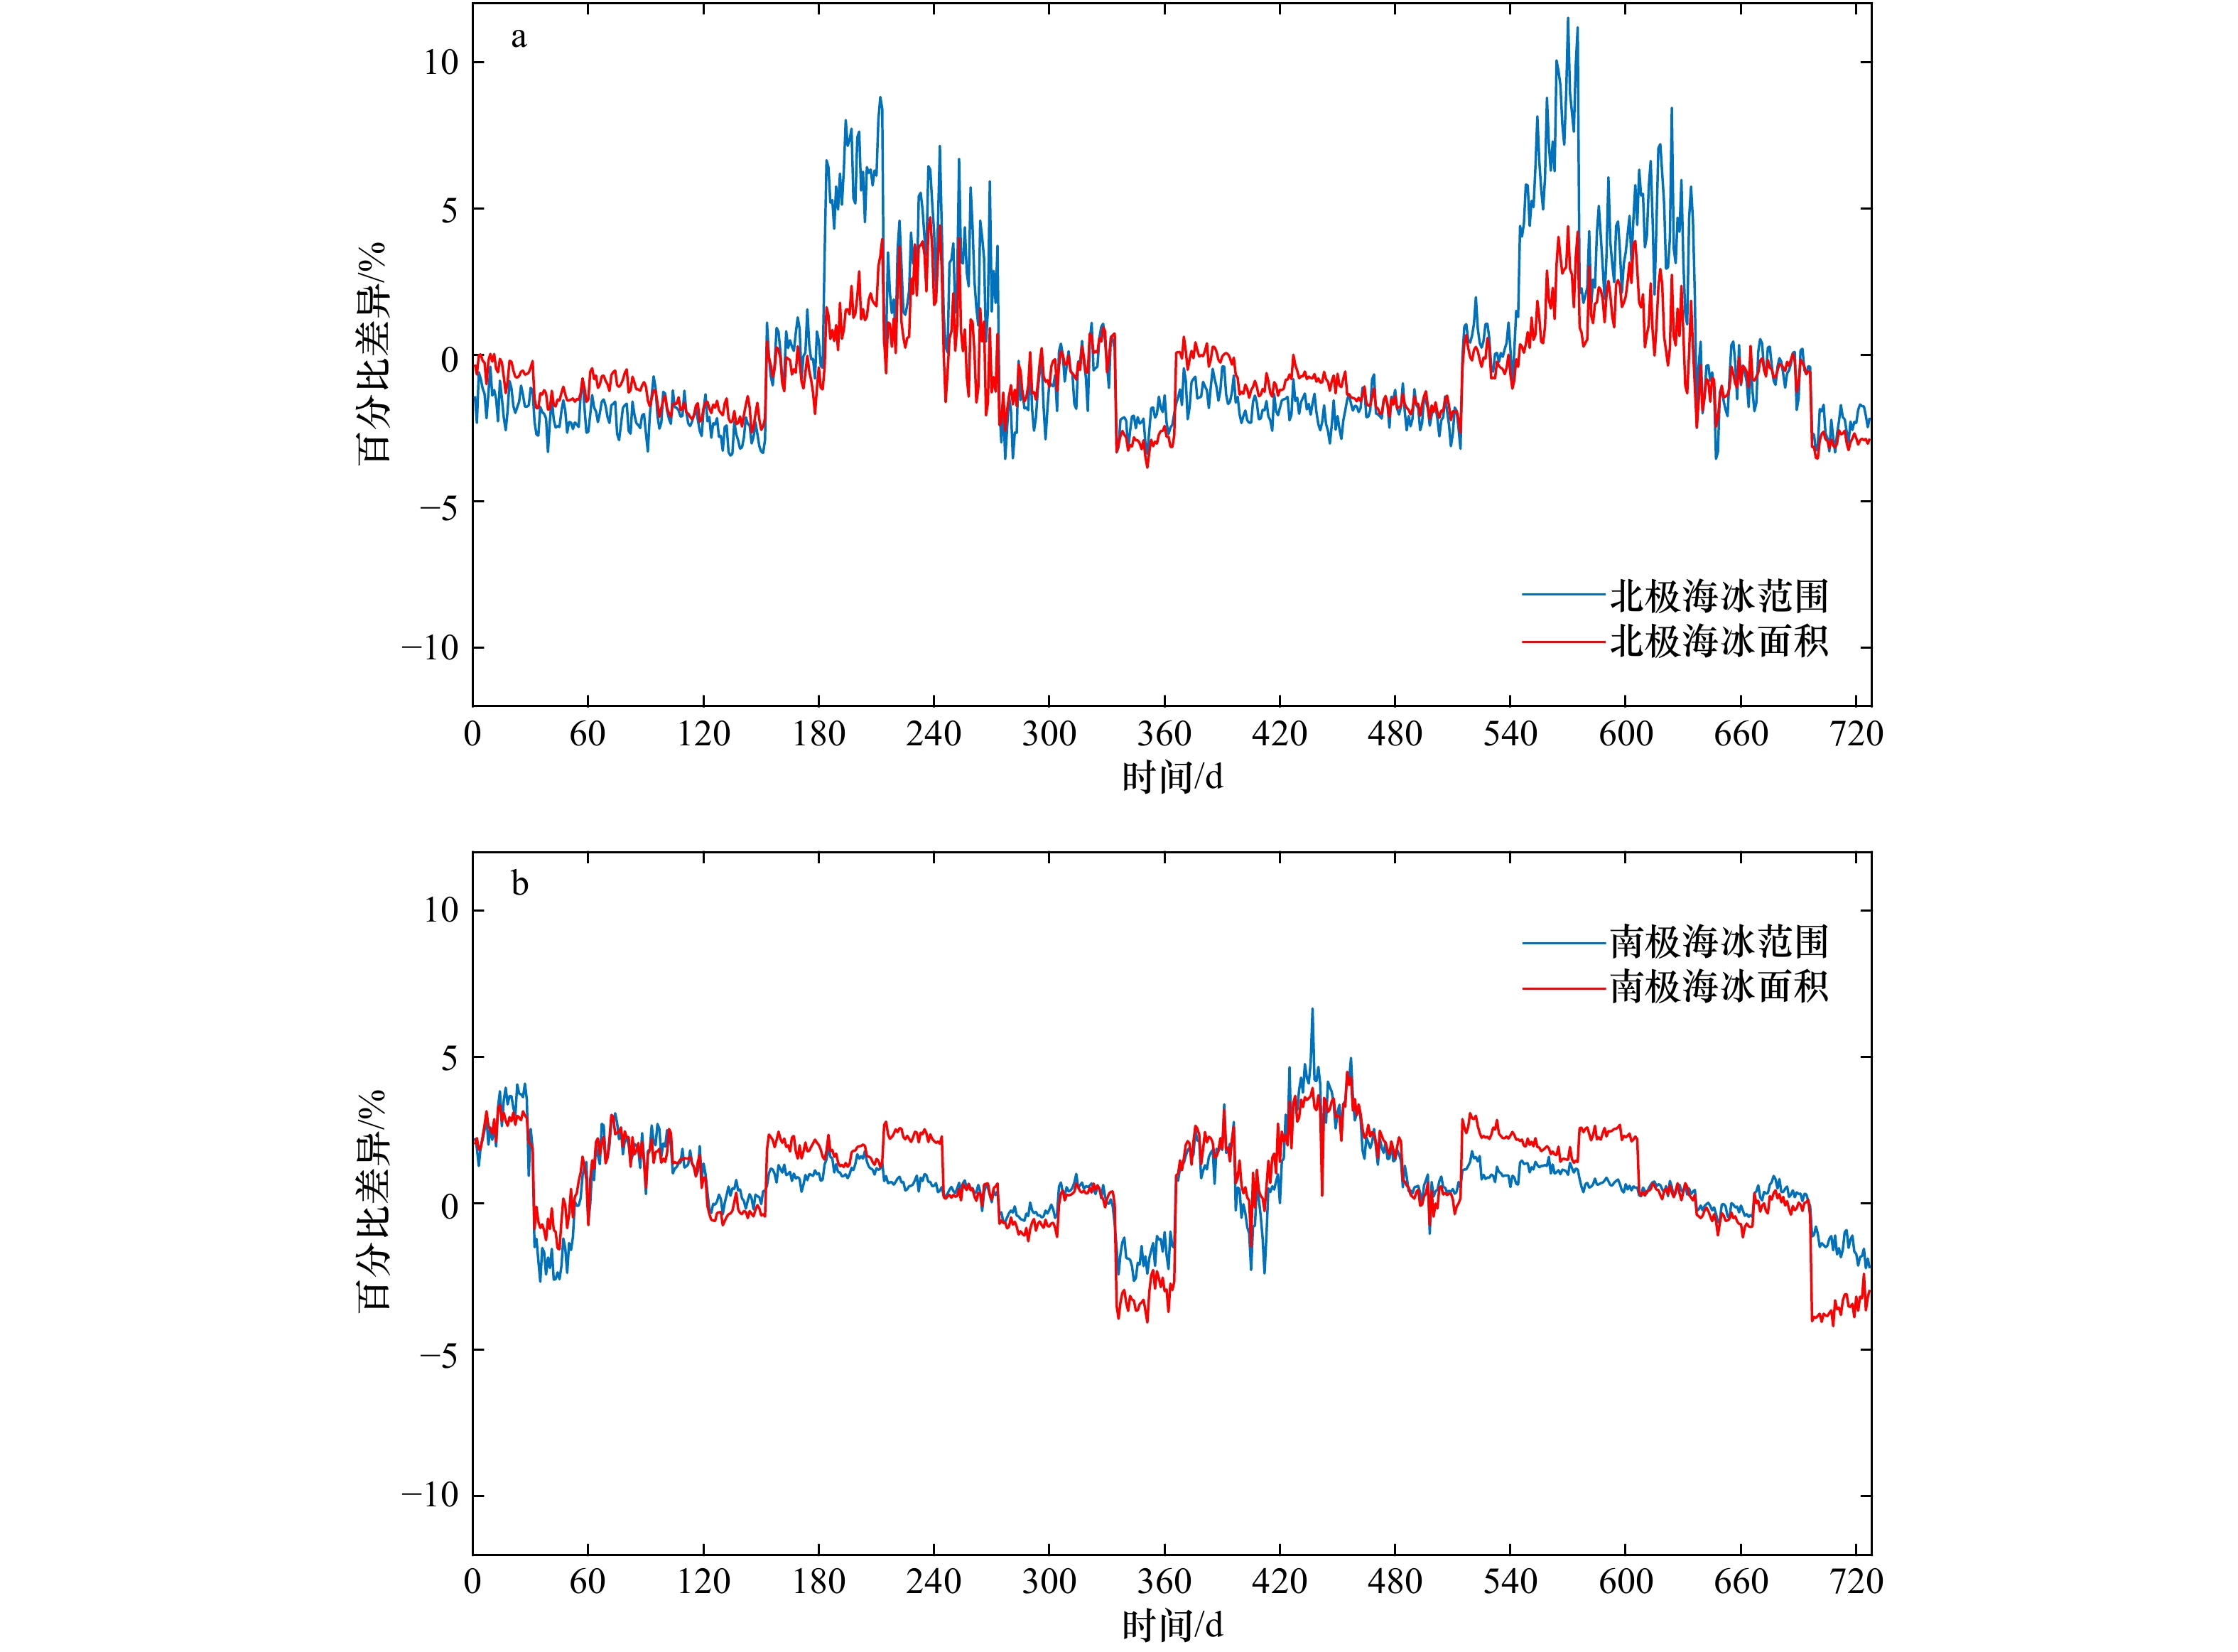
图 6 2016−2017年北半球(a)和南半球(b)FY-3C和F17海冰范围和面积的每日百分比差异的时间序列
百分比差异计算为100%(FY−F17)/F17
Fig. 6 Time series of the daily percent differences between FY-3C and F17 sea ice extents and areas of the Northern Hemisphere (a) and Southern Hemisphere (b) for 2016−2017
Percent differences are calculated as 100%(FY−F17)/F17
表 1 F17与FY-3C参数比较
Tab. 1 Parameters comparison of F17 and FY-3C
参数 DMSP-F17 FY-3C 轨道高度/km 850 836 倾斜角度/(°) 98.8 98.8 轨道周期/min 102 101 升交点过境地方时 约5:31 pm 1:40 pm−2:00 pm 算法频率/GHz 19.3, 37.0, 22.2 18.7, 36.5, 23.8 入射角/(°) 53.1 45 足迹大小/km 70×45, 38×30, 60×40 30×50, 18×30, 27×45 幅宽/km 1 700 1 400  下载: 导出CSV
表 2 定标系数
Tab. 2 Calibration coefficients
月份 斜率 19V 19H 23V 37V 37H 1 0.89 0.93 0.93 0.94 0.97 2 0.9 0.94 0.95 0.94 0.98 3 0.9 0.94 0.95 0.95 0.98 4 0.91 0.94 0.94 0.96 0.98 5 0.9 0.93 0.94 0.96 0.98 6 0.91 0.94 0.94 0.95 0.98 7 0.89 0.92 0.89 0.94 0.98 8 0.89 0.93 0.92 0.94 0.98 9 0.9 0.93 0.93 0.95 0.99 10 0.9 0.93 0.94 0.96 0.99 11 0.91 0.94 0.95 0.96 0.99 12 0.9 0.93 0.95 0.95 0.97 月份 截距 19V 19H 23V 37V 37H 1 26.12 14.81 17.3 16.31 9.33 2 23.73 12.08 12.65 16.64 7.42 3 22.91 11.98 12.96 13.71 6.82 4 23 12.71 15.17 12.1 7.37 5 23.73 14.77 16.82 13.62 8.12 6 23.77 14.72 17.24 15.99 7.67 7 28.3 18.3 26.79 17.82 7.85 8 26.31 15.67 21.61 16.67 7.26 9 24.95 15.33 17.56 15.49 6.39 10 23.36 14.92 15.6 13.51 6.27 11 22.17 12.79 12.8 12.25 6.03 12 24 13.26 13.59 15.3 8.72
下载: 导出CSV
表 3 南北半球开阔水域及不同冰型的F17系点值
Tab. 3 F17 TPs for open water and different ice types in the Northern Hemisphere and Southern Hemisphere
北半球 F17系点/K 南半球 F17系点/K 19V OW 184.9 19V OW 184.9 19H OW 113.4 19H OW 113.4 37V OW 207.1 37V OW 207.1 19V FYI 248.4 19V冰型A 253.1 19H FYI 232.0 19H冰型A 237.8 37V FYI 242.3 37V冰型A 246.6 19V MYI 220.7 19V冰型B 244.0 19H MYI 196.0 19H冰型B 211.9 37V MYI 188.5 37V冰型B 212.6 注:OW表示开阔水域,FYI表示第一年冰,MYI表示多年冰。冰型A与北冰洋的第一年冰具有相似的微波特性,但冰型B与多年冰比是一种不同的冰型,可能第一年冰含有重型雪盖。
下载: 导出CSV
表 4 2016–2017年南北极海冰范围和面积与NSIDC差异的统计分析
Tab. 4 Statistical analysis of the total Arctic and Antarctic ice extent and area difference for 2016–2017
海冰范围均
方根误差/106 km2海冰面积均
方根误差/106 km2海冰范围
相关系数海冰面积
相关系数北极 0.270 0 0.141 5 0.998 4 0.999 6 南极 0.112 0 0.153 5 0.999 9 0.999 6
下载: 导出CSV
-
[1] Cheung H H N, Keenlyside N, Omrani N E, et al. Remarkable link between projected uncertainties of Arctic sea-ice decline and winter Eurasian climate[J]. Advances in Atmospheric Sciences, 2018, 35(1): 38−51. doi: 10.1007/s00376-017-7156-5 [2] 柯长青, 彭海涛, 孙波, 等. 2002−2011年北极海冰时空变化分析[J]. 遥感学报, 2013, 17(2): 452−466. doi: 10.11834/jrs.20132044Ke Changqing, Peng Haitao, Sun Bo, et al. Spatio-temporal variability of Arctic sea ice from 2002 to 2011[J]. Journal of Remote Sensing, 2013, 17(2): 452−466. doi: 10.11834/jrs.20132044 [3] Curry J A, Schramm J L, Ebert E E. Sea ice-albedo climate feedback mechanism[J]. Journal of Climate, 1995, 8(2): 240−247. doi: 10.1175/1520-0442(1995)008<0240:SIACFM>2.0.CO;2 [4] 冯士筰, 李凤歧, 李少菁. 海洋科学导论[M]. 北京: 高等教育出版社, 1999.Feng Shizuo, Li Fengqi, Li Shaojing. An Introduction to Marine Science[M]. Beijing: Higher Education Press, 1999. [5] 刘艳霞, 王泽民, 刘婷婷. 1979−2014年南北极海冰变化特征分析[J]. 遥感信息, 2016, 31(2): 24−29. doi: 10.3969/j.issn.1000-3177.2016.02.005Liu Yanxia, Wang Zemin, Liu Tingting. Change analysis for Antarctic and Arctic sea ice concentration and extent[J]. Remote Sensing Information, 2016, 31(2): 24−29. doi: 10.3969/j.issn.1000-3177.2016.02.005 [6] Comiso J C. Increasing positive trend in the Antarctic sea ice extent and associated surface temperature changes[C]//AGU Fall Meeting. AGU Fall Meeting Abstracts, 2015. [7] 李新情, 程晓, 惠凤鸣, 等. 2014年夏季北极东北航道冰情分析[J]. 极地研究, 2016, 28(1): 87−94.Li Xinqing, Cheng Xiao, Hui Fengming, et al. Analysis of sea ice conditions in the Arctic northeast passage in summer 2014[J]. Chinese Journal of Polar Research, 2016, 28(1): 87−94. [8] 马丽娟, 陆龙骅, 卞林根. 南极海冰北界涛动指数及其与我国夏季天气气候的关系[J]. 应用气象学报, 2007, 18(4): 568−572. doi: 10.3969/j.issn.1001-7313.2007.04.019Ma Lijuan, Lu Longhua, Bian Lingen. Antarctic sea-ice extent oscillation index with the relationship between ASEOI and synoptic climate in summer of China[J]. Journal of Applied Meteorological Science, 2007, 18(4): 568−572. doi: 10.3969/j.issn.1001-7313.2007.04.019 [9] Parkinson C L. Arctic Sea Ice, 1973−1976: Satellite Passive -Microwave Observations[M]. Washington, DC: Scientific and Technical Information Branch, NASA, 1987. [10] Witze A. Ageing satellites put crucial sea-ice climate record at risk[J]. Nature, 2017, 551(7678): 13−14. doi: 10.1038/nature.2017.22907 [11] 国家卫星气象中心. 微波成像仪(MWRI)[EB/OL]. [2018−03−23]. http://satellite.nsmc.org.cn/PortalSite/StaticContent/DeviceIntro_FY3_MWRI.aspxNational Satellite Meteorological Center. Microwave Radiation Imager(MWRI)[EB/OL].[2018−03−23]. http://satellite.nsmc.org.cn/PortalSite/StaticContent/DeviceIntro_FY3_MWRI.aspx [12] Remote Sensing Systems[EB/OL].[2018−04−10]. http://www.remss.com/measurements/brightness-temperature [13] Hilburn K A, Wentz F J. Intercalibrated passive microwave rain products from the unified microwave ocean retrieval algorithm (UMORA)[J]. Journal of Applied Meteorology and Climatology, 2008, 47(3): 778−794. doi: 10.1175/2007JAMC1635.1 [14] Cavalieri D J, Parkinson C L, Gloersen P, et al. Sea Ice Concentrations from nimbus-7 SMMR and DMSP SSM/I-SSMIS passive microwave data, Version 1[EB/OL]. [2018−01−29]. https://nsidc.org/data/NSIDC-0051/versions/1 [15] 黄端, 邱玉宝, 石利娟, 等. 两种星载微波辐射计被动亮温数据的交叉定标[J]. 测绘科学, 2017, 42(1): 136−142.Huang Duan, Qiu Yubao, Shi Lijuan, et al. Cross-calibration for passive microwave measurement of MERI and AMSR-E[J]. Science of Surveying and Mapping, 2017, 42(1): 136−142. [16] Cavalieri D J, Crawford J P, Drinkwater M R, et al. Aircraft active and passive microwave validation of sea ice concentration from the defense meteorological satellite program special sensor microwave imager[J]. Journal of Geophysical Research: Oceans, 1991, 96(C12): 21989−22008. doi: 10.1029/91JC02335 [17] Cavalieri D J, Parkinson C L, Digirolamo N, et al. Intersensor calibration between F13 SSMI and F17 SSMIS for global sea ice data records[J]. IEEE Geoscience and Remote Sensing Letters, 2012, 9(2): 233−236. doi: 10.1109/LGRS.2011.2166754 [18] Cavalieri D J, St. Germain K M, Swift C T. Reduction of weather effects in the calculation of sea-ice concentration with the DMSP SSM/I[J]. Journal of Glaciology, 1995, 41(139): 455−464. doi: 10.1017/S0022143000034791 [19] Cavalieri D J, Parkinson C L, Gloersen P, et al. Arctic and Antarctic sea ice concentrations from multichannel passive-microwave satellite data sets: October 1978 to September 1995 User's guide[R]. Washington D.C.: NASA Technical Memorandum, 1997. [20] Remote Sensing Systems[EB/OL].[2018−11−19]. http://images.remss.com/amsr/amsr2_data_daily.html#top [21] Ivanova N, Pedersen L T, Tonboe R T, et al. Inter-comparison and evaluation of sea ice algorithms: towards further identification of challenges and optimal approach using passive microwave observations[J]. The Cryosphere, 2015, 9(5): 1797−1817. doi: 10.5194/tc-9-1797-2015 [22] Kern S, Rösel A, Pedersen L T, et al. The impact of melt ponds on summertime microwave brightness temperatures and sea-ice concentrations[J]. The Cryosphere, 2016, 10(5): 2217−2239. doi: 10.5194/tc-10-2217-2016 -

 点击查看大图
计量
- 文章访问数: 264
- HTML全文浏览量: 31
- PDF下载量: 89
- 被引次数: 0
