

Research on typhoon wind profile information extraction based on sea surface wind field data of HY-2A microwave scatterometer
-
摘要: 台风风剖面信息是直观反映与台风中心不同距离的各点与平均风速关系的曲线,它是确定各级台风风圈范围的重要基础。本文利用HY-2A微波散射计海面风场资料,结合Holland风场模型提出了一种新的台风风剖面信息提取方法,并选取2012–2017年期间16期典型台风进行应用。结果表明:34 kt与50 kt风圈半径的平均均方根误差为37.6 km与18.3 km,该方法具有较好的适用性和精度。本研究对于描述台风结构特征及潜在的破坏力和台风可能的影响范围具有一定的现实意义。Abstract: The typhoon wind profile information is a curve that directly reflects the relationship between the points at different distances from the typhoon center and the average wind speed. It is an important basis for determining the wind radius at different speed. In this paper, a new typhoon wind profile information extraction method is proposed by using the HY-2A microwave scatterometer sea surface wind field data and the Holland wind field model. We selected 16 typical typhoons during 2012−2017 for application, the results show that the average root mean square error of the 34 kt and 50 kt wind radii is 37.6 km and 18.3 km. This method has good applicability and accuracy. This study has certain practical significance for describing the structural characteristics of typhoon and its potential destructive power and possible range of typhoon.
-
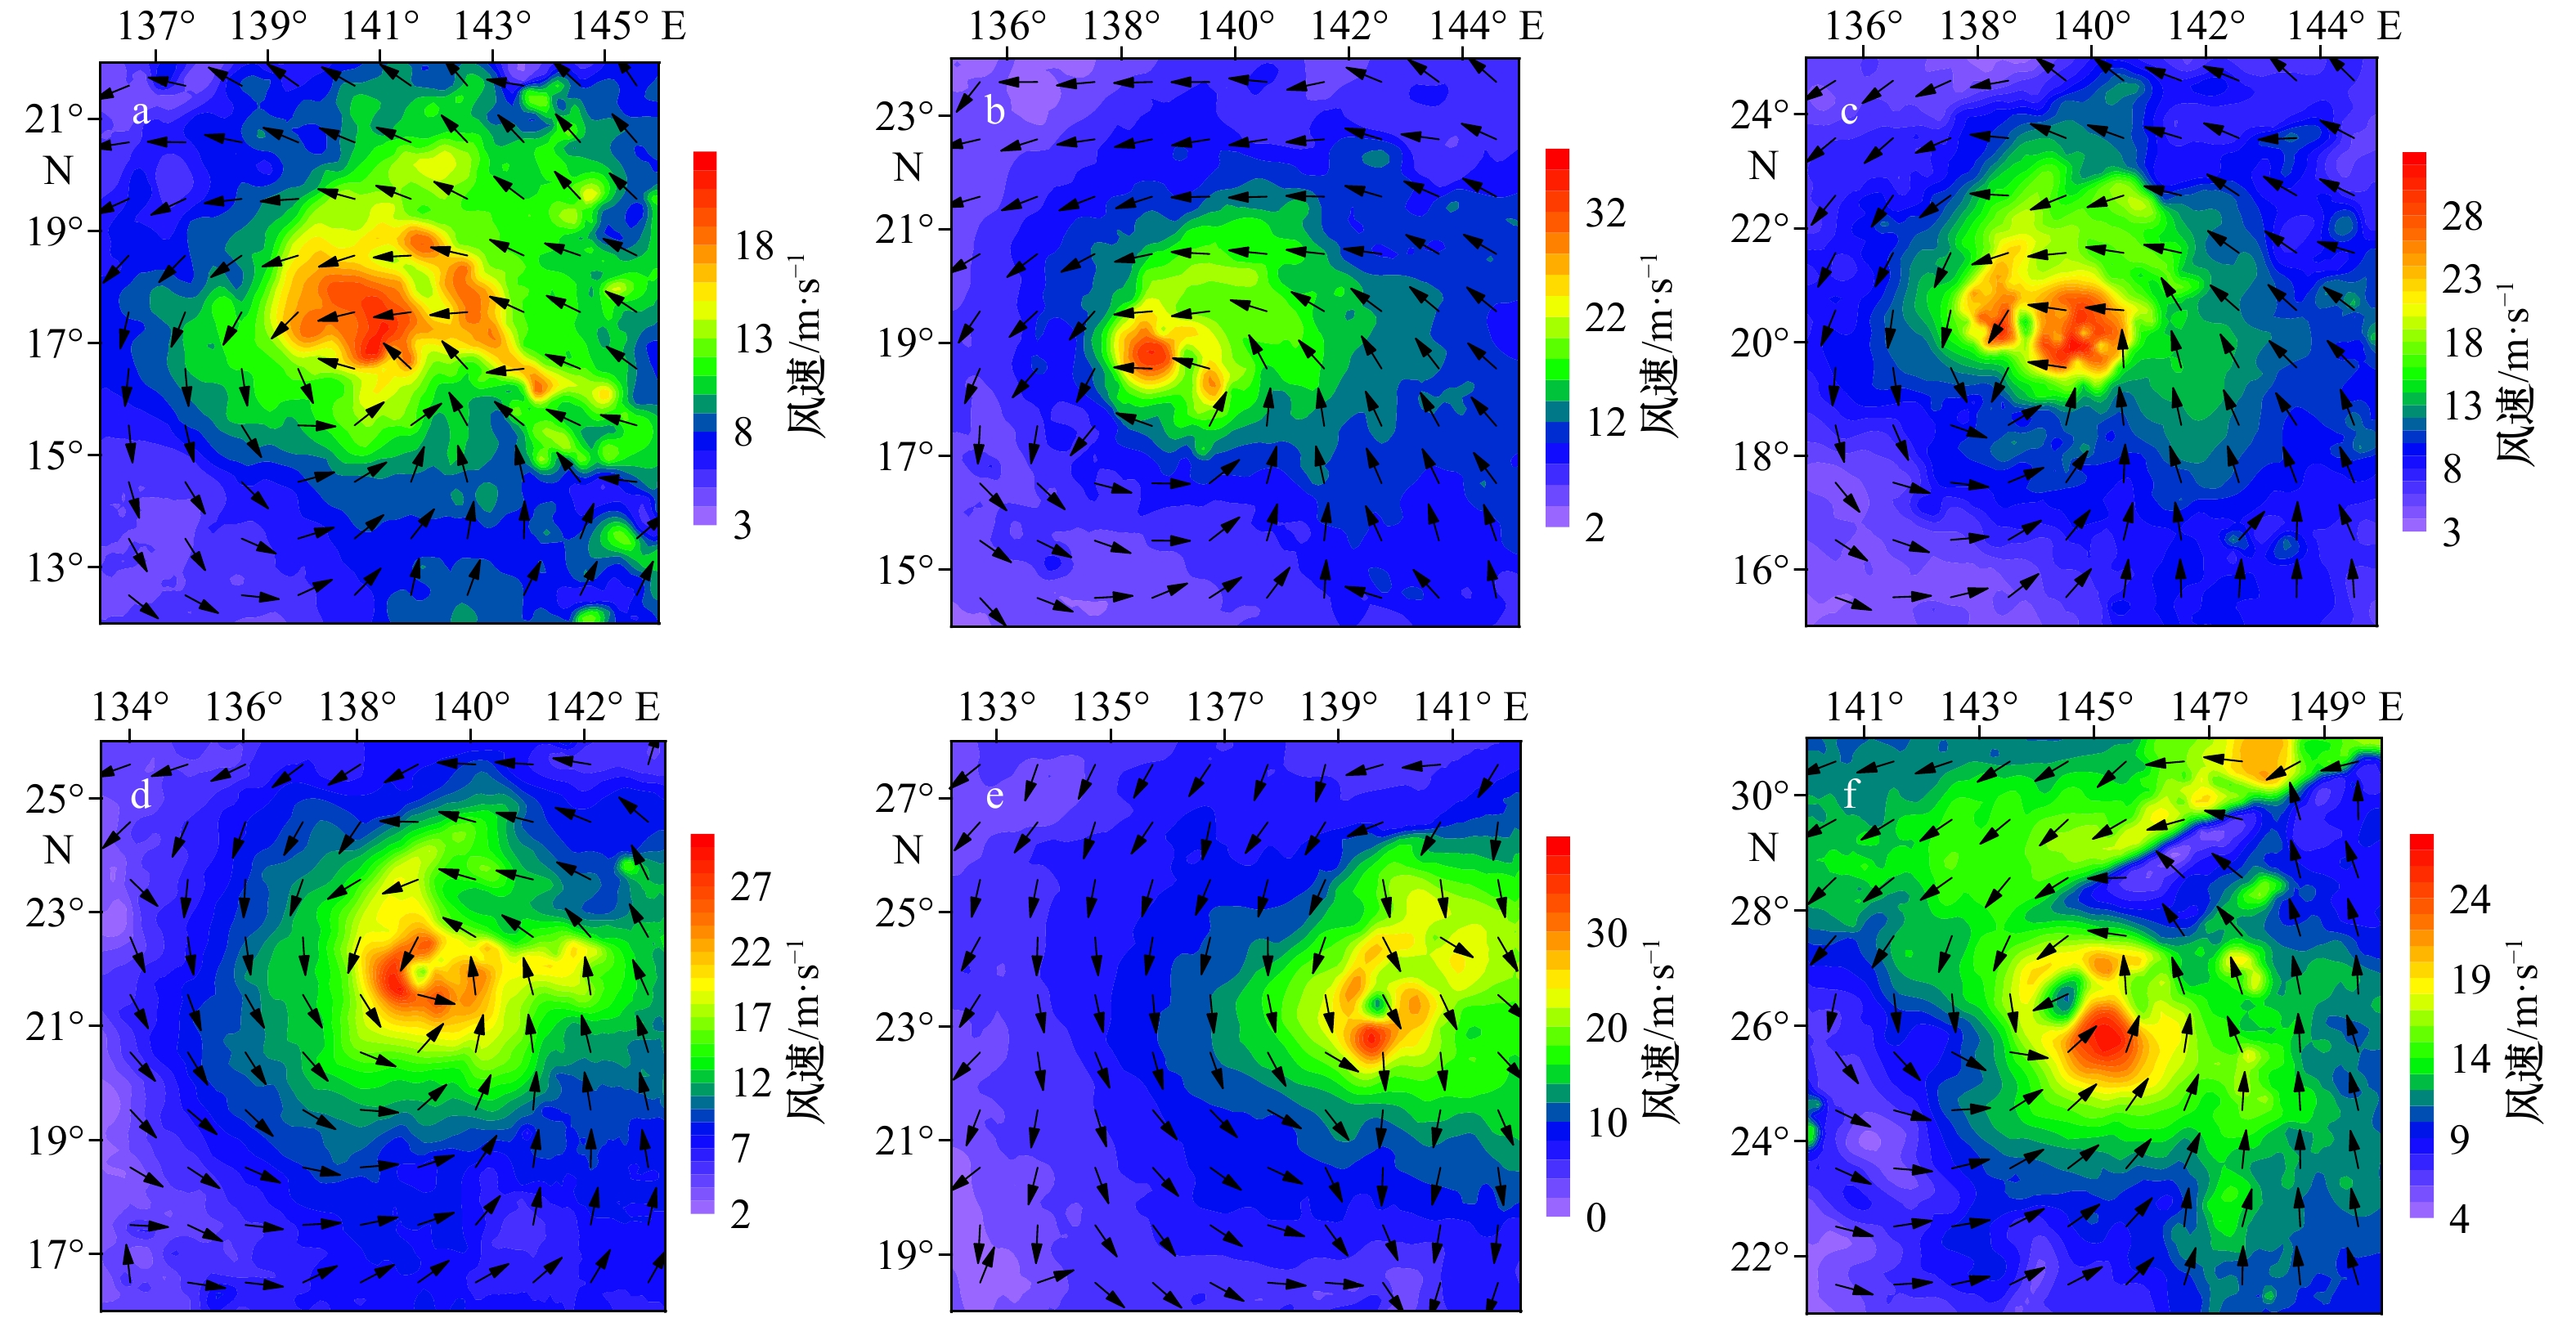
图 3 台风“珊瑚”风场
a. 5月23日09时;b. 5月23日21时;c. 5月24日09时;d. 5月24日21时;e. 5月25日09时;f. 5月26日20时
Fig. 3 Wind field map of Typhoon Sanvu
a. 09:00 on May 23;b. 21:00 on May 23;c. 09:00 on May 24;d. 21:00 on May 24;e. 09:00 on May 25;f. 20:00 on May 26
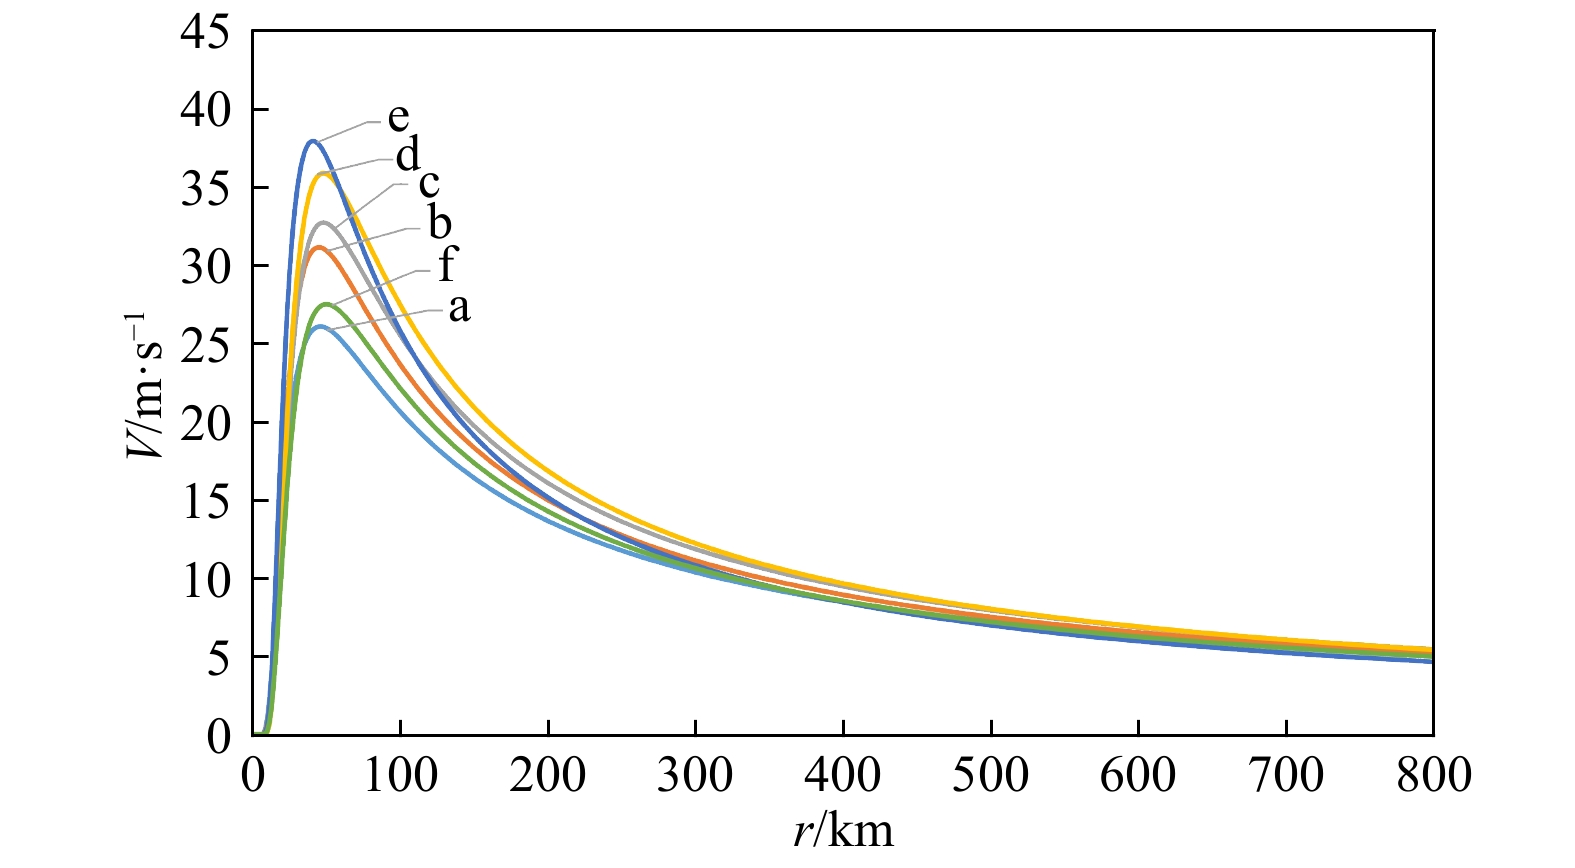
图 4 台风“珊瑚”Willoughby B值计算法风速剖面拟合曲线
a. 5月23日09时;b. 5月23日21时;c. 5月24日09时;d. 5月24日21时;e. 5月25日09时;f. 5月26日20时
Fig. 4 Wind speed profile fitting curve of Typhoon Sanvu with value B calculated by Willoughby’s method
a. 09:00 on May 23;b. 21:00 on May 23;c. 09:00 on May 24;d. 21:00 on May 24;e. 09:00 on May 25;f. 20:00 on May 26
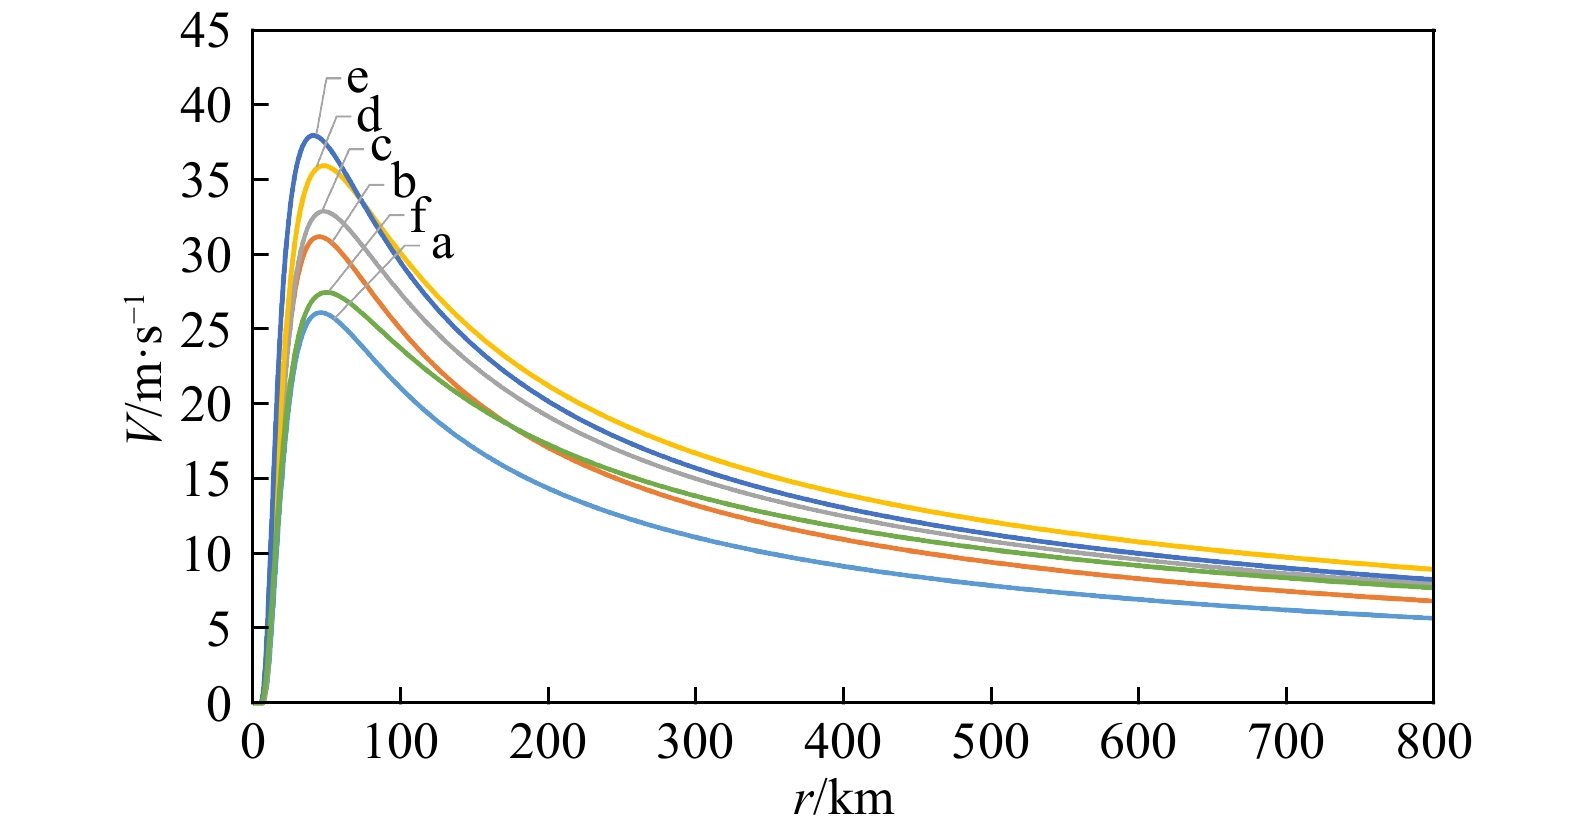
图 5 台风“珊瑚”Vickery B值计算法风速剖面拟合曲线
a. 5月23日09时;b. 5月23日21时;c. 5月24日09时;d. 5月24日21时;e. 5月25日09时;f. 5月26日20时
Fig. 5 Wind speed profile fitting curve of Typhoon Sanvu with value B calculated by Vickery’s method
a. 09:00 on May 23;b. 21:00 on May 23;c. 09:00 on May 24;d. 21:00 on May 24;e. 09:00 on May 25;f. 20:00 on May 26
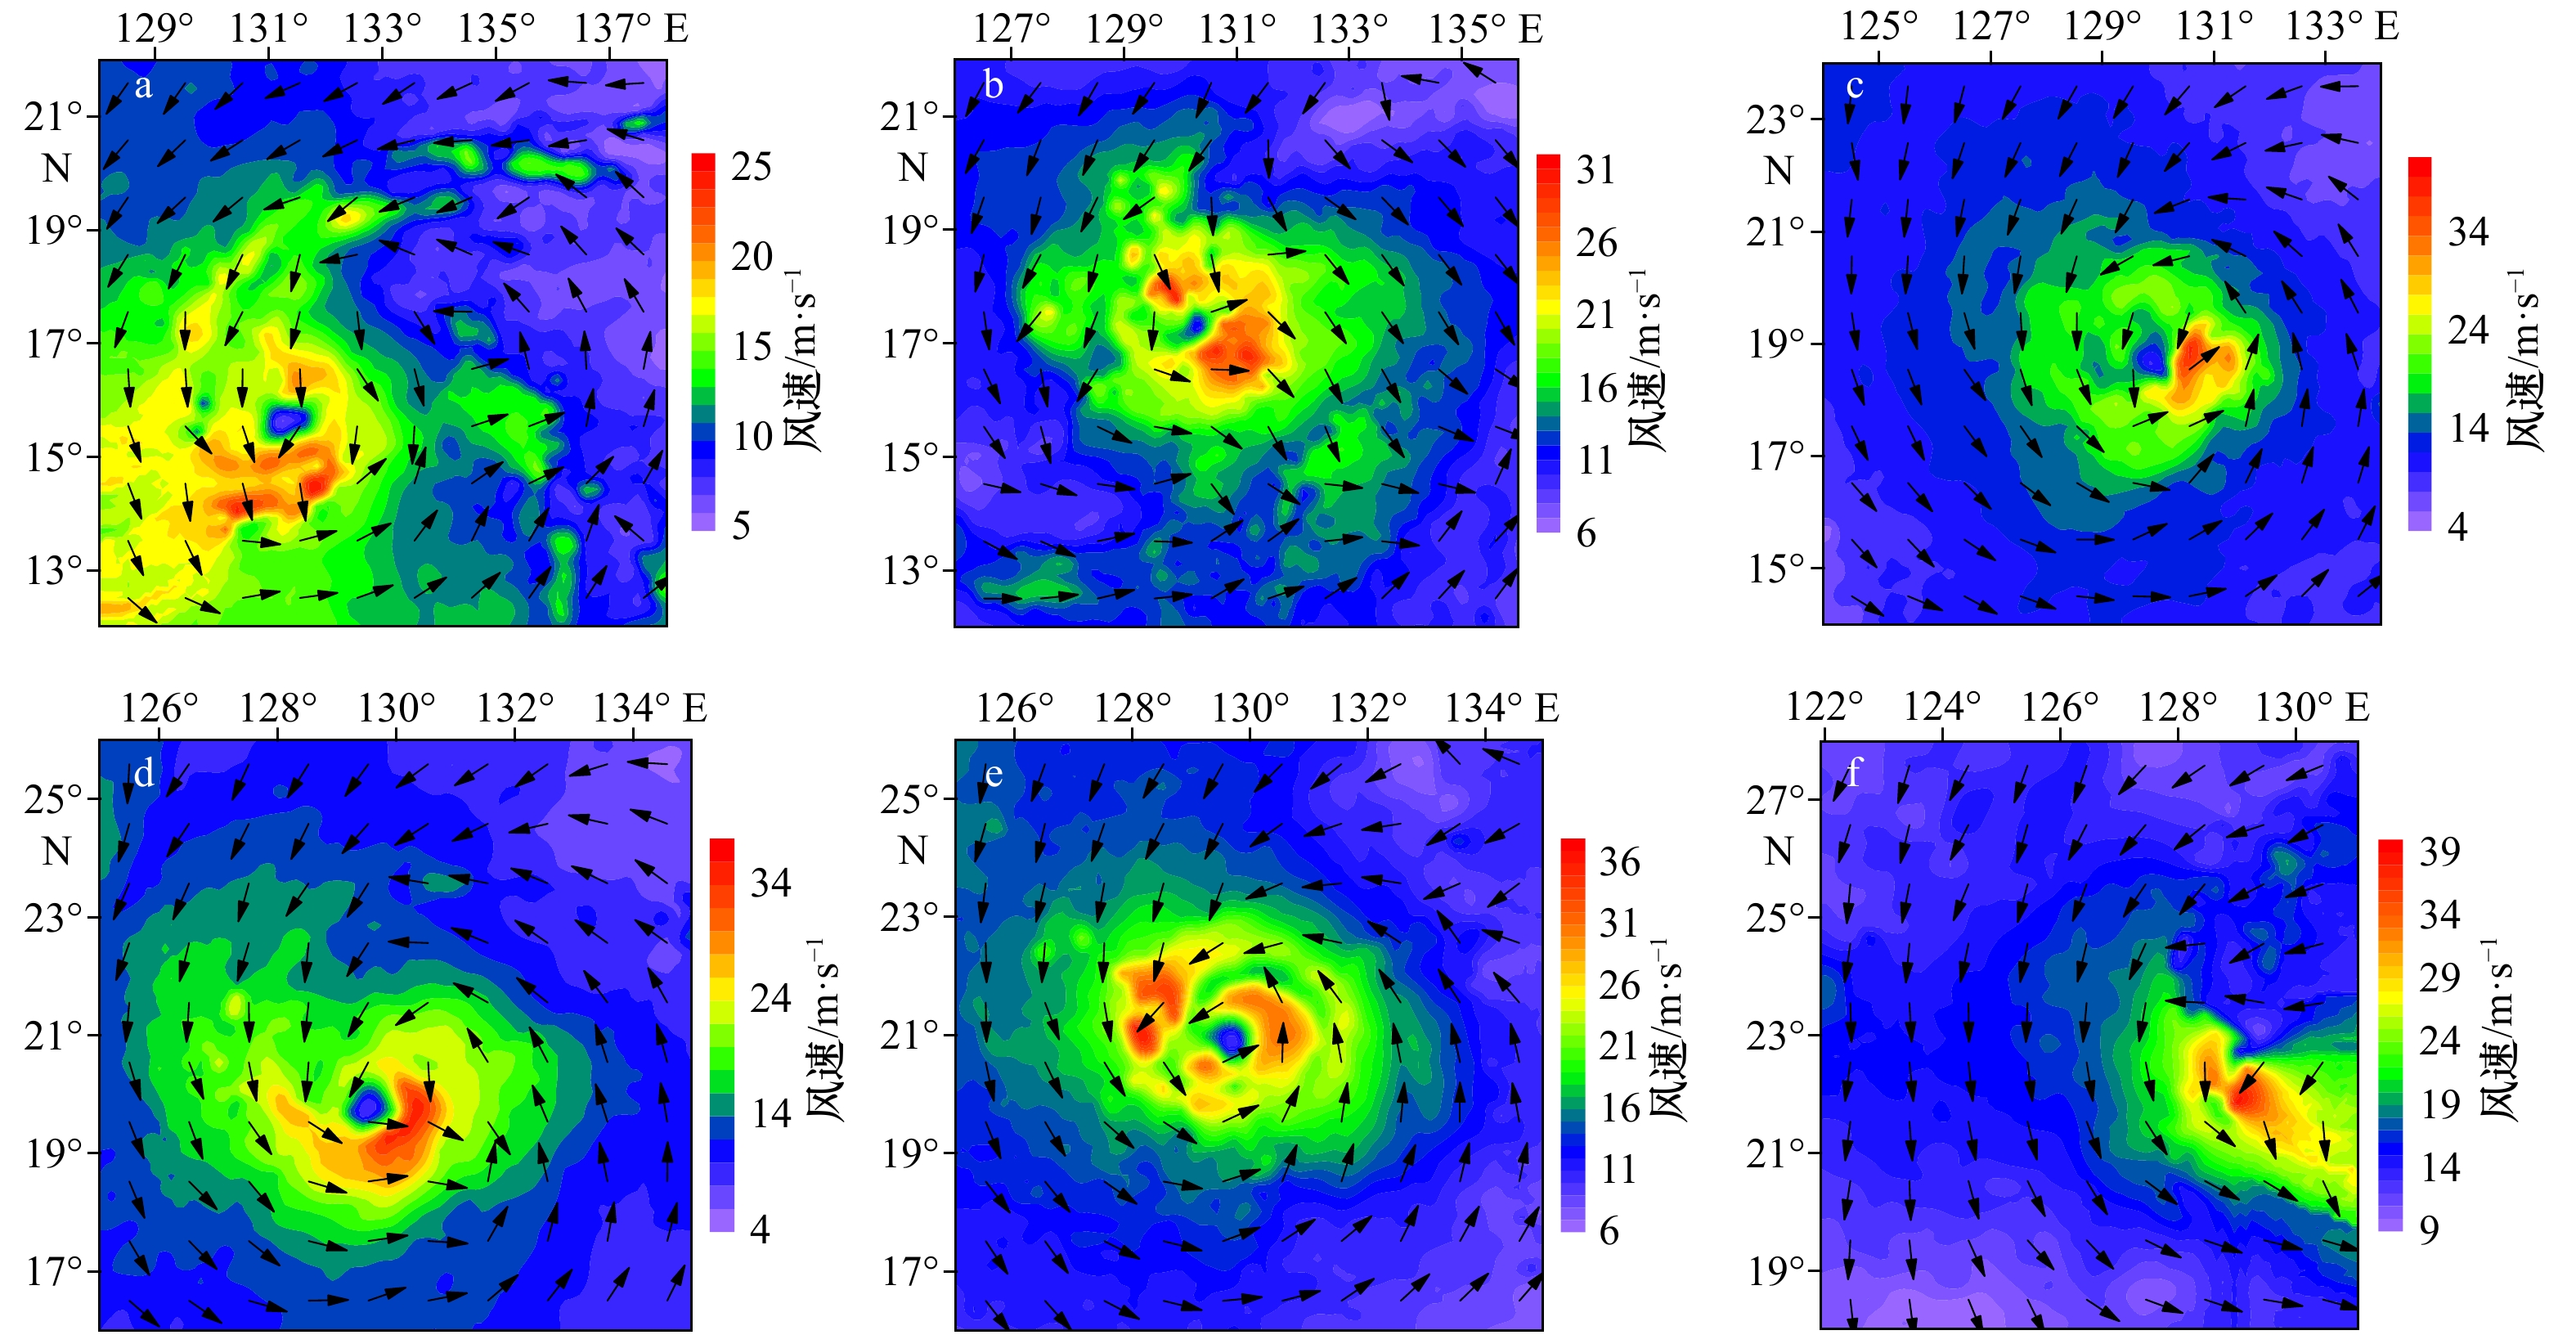
图 6 台风“菲特”风场图
a. 10月01日09时;b. 10月01日21时;c. 10月02日09时;d. 10月02日21时;e. 10月03日09时;f. 10月03日21时
Fig. 6 Wind field map of Typhoon Fitow
a. 09:00 on October 1;b. 21:00 on October 1;c. 09:00 on October 2;d. 21:00 on October 2;e. 09:00 on October 3;f. 21:00 on October 3
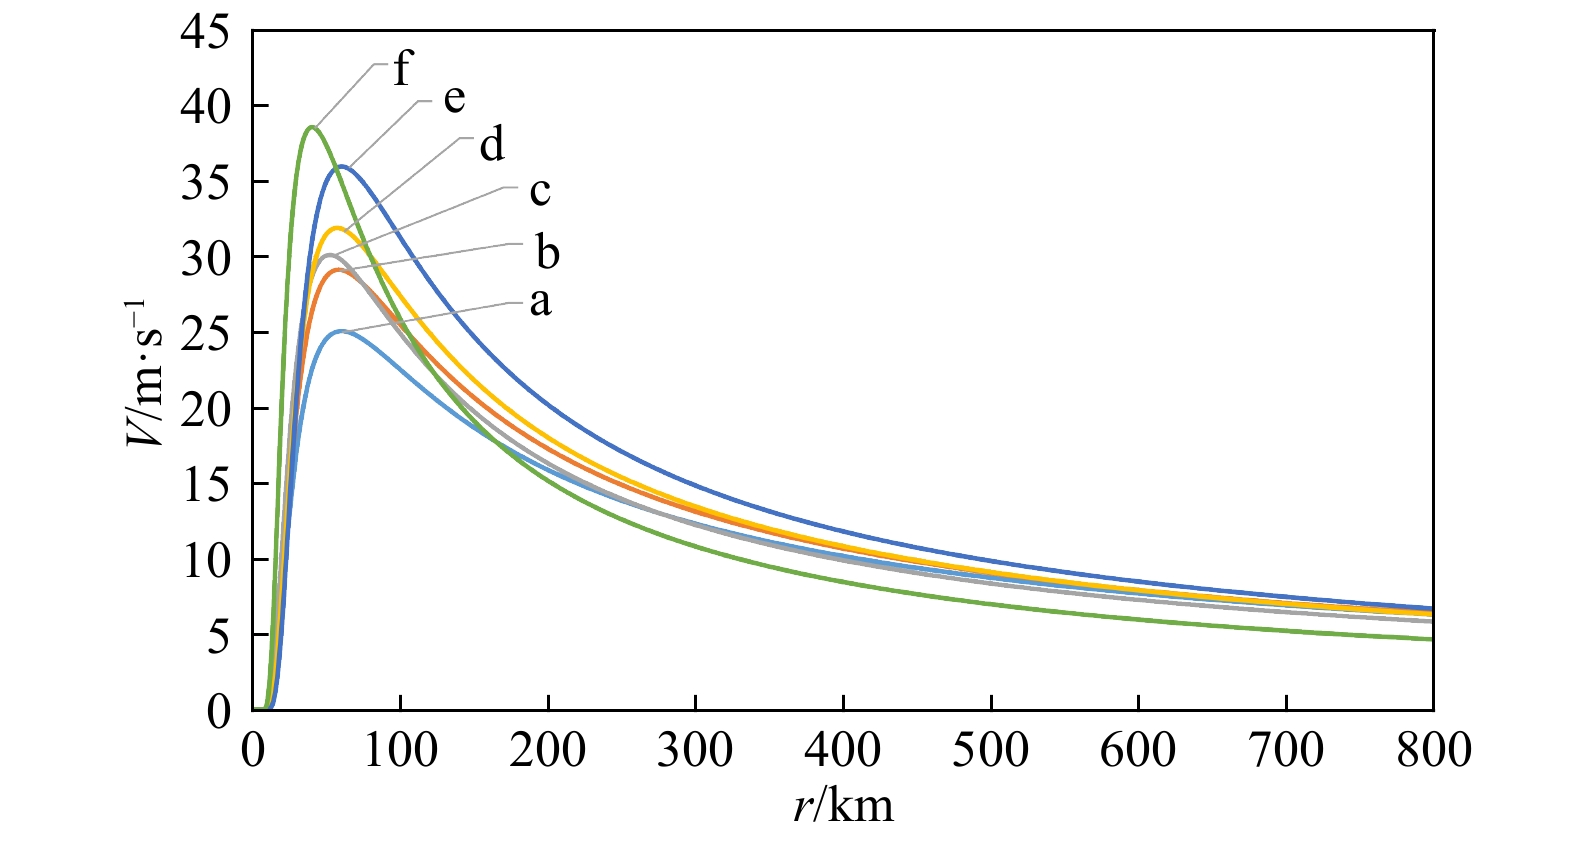
图 7 台风“菲特”Willoughby B值计算法风速剖面拟合曲线
a. 10月01日09时;b. 10月01日21时;c. 10月02日09时;d. 10月02日21时;e. 10月03日09时;f. 10月03日21时
Fig. 7 Wind speed profile fitting curve of Typhoon Fitow with value B calculated by Willoughby’s method
a. 09:00 on October 1;b. 21:00 on October 1;c. 09:00 on October 2;d. 21:00 on October 2;e. 09:00 on October 3;f. 21:00 on October 3
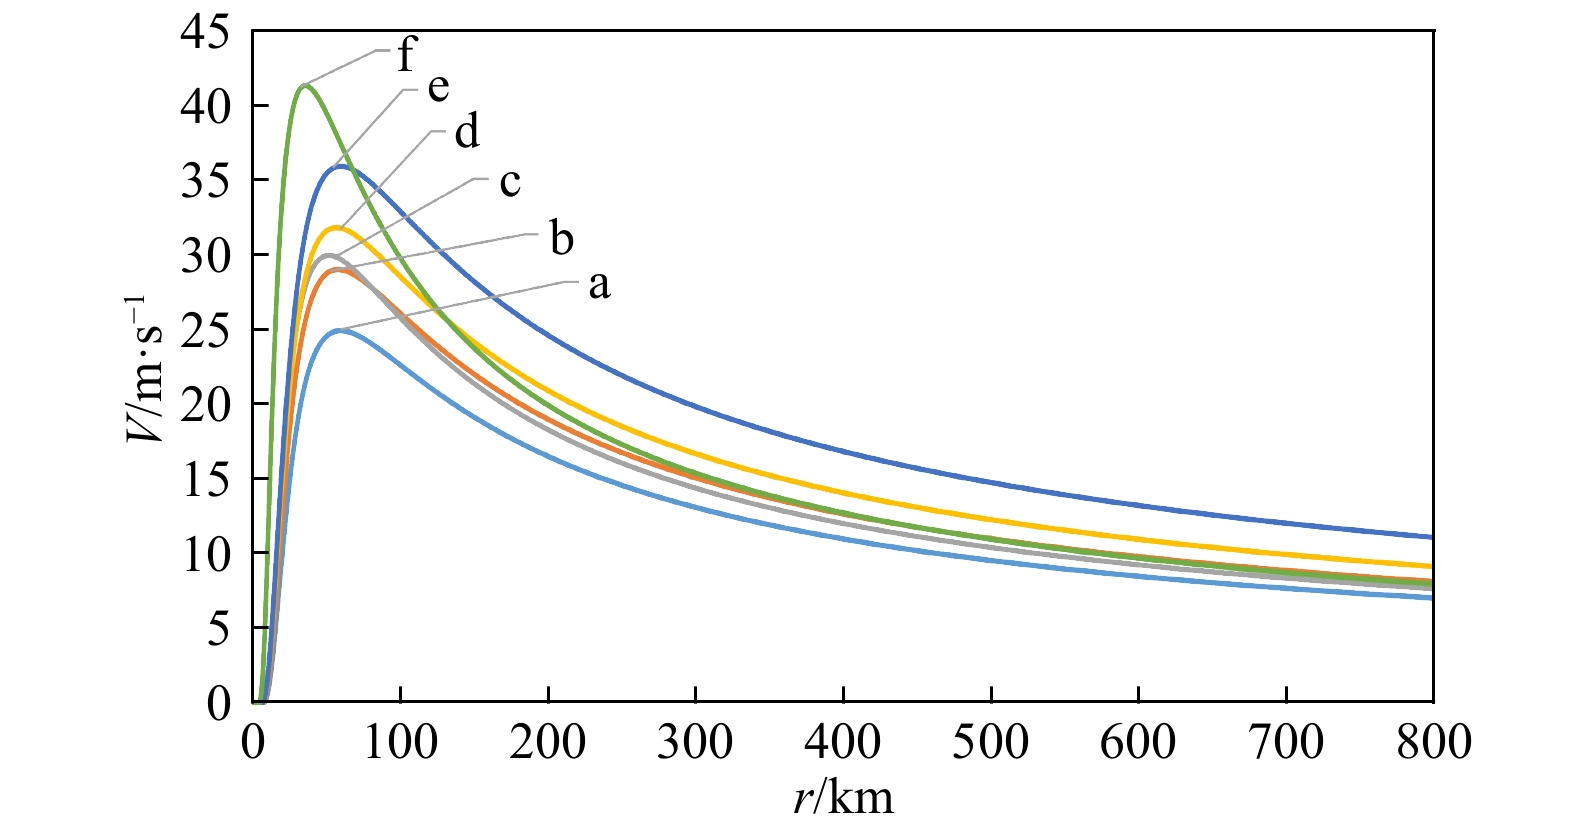
图 8 台风“菲特”Vickery B值计算法风速剖面拟合曲线
a. 10月01日09时;b. 10月01日21时;c. 10月02日09时;d. 10月02日21时;e. 10月03日09时;f. 10月03日21时
Fig. 8 Wind speed profile fitting curve of Typhoon Fitow with value B calculated by Vickery’s method
a. 09:00 on October 1;b. 21:00 on October 1;c. 09:00 on October 2;d. 21:00 on October 2;e. 09:00 on October 3;f. 21:00 on October 3
表 1 台风“珊瑚”结构参数对比
Tab. 1 Comparison of structural parameters of Typhoon Sanvu
日期 时间 中心纬度 中心经度 最大风速/m·s−1 最大风速半径/km B值 SM JTWC SM JTWC SM JTWC SM JTWC W V 5月23日 09:00 17.20°N 17.10°N 140.90°E 140.10°E 26.1 29.6 46 46 1.484 1.402 5月23日 21:00 18.71°N 18.55°N 139.20°E 139.20°E 31.2 30.8 45 42 1.587 1.388 5月24日 09:00 20.27°N 20.30°N 138.80°E 138.90°E 32.8 32.1 48 46 1.627 1.351 5月24日 21:00 21.95°N 21.85°N 139.10°E 139.00°E 36.0 37.3 48 46 1.697 1.329 5月25日 09:00 23.40°N 23.30°N 139.70°E 139.70°E 38.0 39.8 41 46 1.749 1.350 5月26日 20:00 26.52°N 26.45°N 144.40°E 144.55°E 27.5 28.3 50 51 1.588 1.259 注:SM代表海洋二号散射计数据,W表示Willoughby B值计算法,V表示Vickery B值计算法。  下载: 导出CSV
表 2 台风“珊瑚”风圈半径对比
Tab. 2 Comparison of wind radii of Typhoon Sanvu
日期 时间 34 kt风圈半径/km 50 kt风圈半径/km W V JTWC W V JTWC 5月23日 09:00 135 144 162 54 54 51 5月23日 21:00 162 194 181 86 94 65 5月24日 09:00 179 234 182 99 115 70 5月24日 21:00 192 281 205 111 141 93 5月25日 09:00 168 255 207 101 131 79 5月26日 20:00 149 197 218 71 78 83 注:W表示Willoughby B值计算法的风圈半径,V表示Vickery B值计算法的风圈半径。
下载: 导出CSV
表 3 台风“菲特”结构参数对比
Tab. 3 Comparison of structural parameters of Typhoon Fitow
日期 时间 中心纬度 中心经度 最大风速/m·s−1 最大风速半径/km B值 SM JTWC SM JTWC SM JTWC SM JTWC W V 10月1日 09:00 15.60°N 15.60°N 131.20°E 131.40°E 25.0 25.7 60 65 1.444 1.345 10月1日 21:00 17.30°N 17.30°N 130.30°E 130.50°E 29.1 28.3 58 56 1.531 1.334 10月2日 09:00 18.67°N 18.60°N 129.90°E 129.90°E 30.0 30.8 52 56 1.562 1.350 10月2日 21:00 19.81°N 19.80°N 129.50°E 129.50°E 31.8 30.8 57 56 1.600 1.307 10月3日 09:00 20.89°N 20.90°N 129.70°E 129.70°E 36.0 36.0 60 56 1.680 1.276 10月3日 21:00 21.90°N 21.90°N 129.90°E 129.90°E 38.5 41.1 40 31 1.745 1.375 注:SM代表海洋二号散射计数据,W表示Willoughby B值计算法,V表示Vickery B值计算法。
下载: 导出CSV
表 4 台风“菲特”风圈对比
Tab. 4 Comparison of wind radii of Typhoon Fitow
日期 时间 34 kt风圈/km 50 kt风圈/km W V JTWC W V JTWC 10月1日 09:00 168 182 130 10月1日 21:00 196 234 153 97 105 65 10月2日 09:00 180 218 176 92 101 74 10月2日 21:00 208 278 218 112 131 97 10月3日 09:00 243 378 273 141 185 120 10月3日 21:00 168 248 292 101 131 120 注:W表示Willoughby B值计算法的风圈半径,V表示Vickery B值计算法的风圈半径。
下载: 导出CSV
表 5 2012−2017年间14个台风风圈的RMSE
Tab. 5 RMSE of 14 typhoons’ wind radii between 2012 and 2017
编号 名称 景数 RMSE/km 34 kt W 34 kt V 50 kt W 50 ktV 201203 玛娃 2 17.1 39.6 13.7 20.6 201209 苏拉 4 28.5 50.6 18.6 24.2 201307 苏力 2 31.7 38.9 12.2 17.9 201319 天兔 3 51.8 75.2 5.5 8.5 201320 帕布 3 32.7 24.2 13.2 7.6 201324 丹娜丝 2 13.0 20.4 11.1 15.4 201325 百合 2 25.6 50.8 17.9 24.4 201410 麦德姆 2 20.1 38.7 13.7 22.3 201418 巴蓬 3 15.5 104.1 10.4 28.7 201507 白海豚 7 29.5 34.7 20.0 22.2 201509 灿鸿 6 19.6 51.9 15.1 33.3 201521 杜鹃 2 29.9 43.5 6.5 27.3 201623 米雷 4 31.8 54.2 19.7 27.8 201709 纳沙 3 12.0 45.5 8.3 21.4 注:34 kt W、34 kt V、50 kt W、50 kt V分别表示Willoughby B值计算法与Vickery B值计算法获取的风圈半径的34 kt风圈与50 kt风圈的RMSE。
下载: 导出CSV
表 6 2012−2017年间14个台风风圈的MAE
Tab. 6 MAE of 14 typhoons’ wind radii between 2012 and 2017
编号 名称 景数 MAE/km 34 kt W 34 kt V 50 kt W 50 kt V 201203 玛娃 2 16.3 37.3 11.8 18.6 201209 苏拉 4 24.0 45.8 16.5 22.0 201307 苏力 2 24.6 32.5 9.7 13.1 201319 天兔 3 44.8 65.7 5.5 8.5 201320 帕布 3 31.6 23.7 12.8 6.4 201324 丹娜丝 2 12.0 18.3 9.1 12.9 201325 百合 2 24.7 40.1 17.4 21.2 201410 麦德姆 2 19.3 29.4 12.2 20.0 201418 巴蓬 3 13.2 99.3 9.7 27.1 201507 白海豚 7 23.5 26.5 13.8 15.3 201509 灿鸿 6 16.3 47.1 13.7 31.7 201521 杜鹃 2 25.8 36.7 5.5 25.6 201623 米雷 4 26.4 42.4 15.4 22.4 201709 纳沙 3 8.7 44.2 7.0 20.6 注:34 kt W、34 kt V、50 kt W、50 kt V分别表示Willoughby B值计算法与Vickery B值计算法获取的风圈半径的34 kt风圈与50 kt风圈的MAE。
下载: 导出CSV
-
[1] 许映龙, 张玲, 高拴柱. 我国台风预报业务的现状及思考[J]. 气象, 2010, 36(7): 43−49. doi: 10.7519/j.issn.1000-0526.2010.07.009Xu Yinglong, Zhang Ling, Gao Shuanzhu. The advances and discussions on China operational typhoon forecasting[J]. Meteorological Monthly, 2010, 36(7): 43−49. doi: 10.7519/j.issn.1000-0526.2010.07.009 [2] 薛建军, 李佳英, 张立生, 等. 我国台风灾害特征及风险防范策略[J]. 气象与减灾研究, 2012, 35(1): 59−64. doi: 10.3969/j.issn.1007-9033.2012.01.010Xue Jianjun, Li Jiaying, Zhang Lisheng, et al. Characteristics of typhoon disasters in China and risk prevention strategies[J]. Meteorology and Disaster Reduction Research, 2012, 35(1): 59−64. doi: 10.3969/j.issn.1007-9033.2012.01.010 [3] 向纯怡, 吴立广, 田伟, 等. 多平台热带气旋表面风场资料在台风结构分析中的应用[J]. 气象, 2016, 42(11): 1315−1324. doi: 10.7519/j.issn.1000-0526.2016.11.003Xiang Chunyi, Wu Liguang, Tian Wei, et al. Applications of MTCSWA data to the characteristic analysis of tropical cyclone structure[J]. Meteorological Monthly, 2016, 42(11): 1315−1324. doi: 10.7519/j.issn.1000-0526.2016.11.003 [4] 张勇, 刘黎平, 仰美霖, 等. “天鹅”台风风场结构特征[J]. 气象, 2011, 37(6): 659−668. doi: 10.7519/j.issn.1000-0526.2011.06.002Zhang Yong, Liu Liping, Yang Meilin, et al. Analysis on the structure characteristics of typhoon Goni[J]. Meteorological Monthly, 2011, 37(6): 659−668. doi: 10.7519/j.issn.1000-0526.2011.06.002 [5] 张余得, 商少平, 谢燕双, 等. 基于强风圈半径的台风风场模型[J]. 厦门大学学报: 自然科学版, 2014, 53(2): 252−256.Zhang Yude, Shang Shaoping, Xie Yanshuang, et al. Typhoon wind field model based on the radii of wind circle[J]. Journal of Xiamen University: Natural Science, 2014, 53(2): 252−256. [6] 孔宁谦. 南海台风大风半径的求算方法[J]. 气象, 1982, 8(5): 5−6. doi: 10.7519/j.issn.1000-0526.1982.05.002Kong Ningqian. Calculation method of typhoon wind radii in South China Sea[J]. Meteorological Monthly, 1982, 8(5): 5−6. doi: 10.7519/j.issn.1000-0526.1982.05.002 [7] Sampson C R, Knaff J A. A consensus forecast for tropical cyclone gale wind radii[J]. Weather & Forecasting, 2015, 30(5): 1397−1403. [8] Knaff J A, Sampson C R, Chirokova G. A global statistical-dynamical tropical cyclone wind radii forecast scheme[J]. Weather & Forecasting, 2017, 32(2): 629−644. [9] 陈德文, 董剑, 袁方超. 基于QuikSCAT卫星遥感风场的台风最大风速半径反演及个例分析[J]. 海洋通报, 2012, 31(4): 376−383.Chen Dewen, Dong Jian, Yuan Fangchao. Retrieving the radius of maximum wind of typhoon from QuikSCAT wind fields and case analysis[J]. Marine Science Bulletin, 2012, 31(4): 376−383. [10] 董克勤. 应用气候规律预报台风移动[J]. 气象, 1979(1): 17−18. doi: 10.7519/j.issn.1000-0526.1979.01.005Dong Keqin. Prediction of typhoon movement by climate rule[J]. Meteorological Monthly, 1979(1): 17−18. doi: 10.7519/j.issn.1000-0526.1979.01.005 [11] 方钟圣, 金承仪. 日本浮标站台风浪波高与风速等参数的统计分析[J]. 船舶力学, 2003, 7(5): 1−10. doi: 10.3969/j.issn.1007-7294.2003.05.001Fang Zhongsheng, Jin Chengyi. Statistical analysis on wave height, wind speed and other parameters due to tropical cyclones in the northwest pacific area[J]. Journal of Ship Mechanics, 2003, 7(5): 1−10. doi: 10.3969/j.issn.1007-7294.2003.05.001 [12] Aberson S D, Black M L, Black R A, et al. Thirty years of tropical cyclone research with the NOAA P-3 aircraft[J]. Bulletin of the American Meteorological Society, 2006, 87(8): 1039−1056. doi: 10.1175/BAMS-87-8-1039 [13] Martin J D, Gray W M. Tropical cyclone observation and forecasting with and without aircraft reconnaissance[J]. Weather & Forecasting, 1993, 8(4): 519−532. [14] 钱传海, 李泽椿, 张福青, 等. 国际热带气旋飞机观测综述[J]. 气象科技进展, 2012, 2(6): 6−16.Qian Chuanhai, Li Zechun, Zhang Fuqing, et al. Review on international aircraft reconnaissance of tropical cyclones[J]. Advances in Meteorological Science and Technology, 2012, 2(6): 6−16. [15] 杨学联, 季晓阳, 黄润恒, 等. 卫星遥感资料在台风数值预报中的应用[J]. 海洋预报, 2001, 18(4): 1−8. doi: 10.3969/j.issn.1003-0239.2001.04.001Yang Xuelian, Ji Xiaoyang, Huang Runheng, et al. Application of satellite remote sensing data in numerical forecast of typhoon[J]. Marine Forecasts, 2001, 18(4): 1−8. doi: 10.3969/j.issn.1003-0239.2001.04.001 [16] 冯倩. 多传感器卫星海面风场遥感研究[D]. 青岛: 中国海洋大学, 2004.Feng Qian. Study of sea surface wind remote sensing by satellite multi-sensor data[D]. Qingdao: Ocean University of China, 2004. [17] 杨亮. 基于遥感数据的西北太平洋海面风场时空特征分析[D]. 青岛: 国家海洋局第一海洋研究所, 2007.Yang Liang. Temporal and spatial characteristics analysis of sea surface wind on the northwest Pacific based on remote sensing data[D]. Qingdao: The First Institute of Oceanography, State Oceanic Administration, 2007. [18] 窦芳丽, 卢乃锰, 谷松岩. FY-3双频散射计反演台风降水区风场的模拟研究[C]//2011年第二十八届中国气象学会年会论文集. 北京: 中国气象学会, 2011: 1-13.Dou Fangli, Lu Naimeng, Gu Songyan. Simulation Study on inversion of wind field in typhoon precipitation area by FY-3 dual-frequency scatterometer[C]//Annual Meeting of the Chinese Meteorological Society. Beijing: Chinese Meteorological Society, 2011: 1−13. [19] 吴俞, 李静, 杨仁勇. 基于卫星资料对“海燕”台风影响海南岛风雨分布的分析[J]. 热带农业科学, 2015, 35(5): 95−101.Wu Yu, Li Jing, Yang Renyong. Influence of “Haiyan” Typhoon on the wind and rain distribution in Hainan Island based on satellite data[J]. Chinese Journal of Tropical Agriculture, 2015, 35(5): 95−101. [20] Park J D, Byon J Y, Sohn E, et al. Operational technique in typhoon wind radii using satellite microwave remote sensor data[C]//IGARSS 2008-2008 IEEE International Geoscience and Remote Sensing Symposium. Boston, MA, USA: IEEE, 2008: I-343-I-346. [21] Chavas D R, Emanuel K A. A QuikSCAT climatology of tropical cyclone size[J]. Geophysical Research Letters, 2010, 37(18): L18816. [22] Said F, Long D G. Determining selected tropical cyclone characteristics using QuikSCAT's ultra-high resolution images[J]. IEEE Journal of Selected Topics in Applied Earth Observations & Remote Sensing, 2011, 4(4): 857−869. [23] 刘晓燕, 杨学联, 邢建勇. WRF Hybrid方法同化HY-2A散射计风资料在台风"菲特"预报中的应用[J]. 海洋预报, 2016, 33(1): 1−10. doi: 10.11737/j.issn.1003-0239.2016.01.001Liu Xiaoyan, Yang Xuelian, Xing Jianyong. Application of HY-2A scatter wind data assimilation with the WRF hybrid method for typhoon Fitow forecasts[J]. Marine Forecasts, 2016, 33(1): 1−10. doi: 10.11737/j.issn.1003-0239.2016.01.001 [24] 赵勇, 赵朝方, 孙如瑶. HY-2A散射计数据在台风“苏力”海表面风场结构研究中的应用[J]. 海洋湖沼通报, 2017(2): 39−47.Zhao Yong, Zhao Chaofang, Sun Ruyao. Application of HY-2A/SCAT records to understanding the surface wind field structure of typhoon Soulik[J]. Transactions of Oceanology and Limnology, 2017(2): 39−47. [25] 兰友国, 郎姝燕, 林明森, 等. 海洋二号卫星A星微波散射计在台风遥感监测中的应用[J]. 卫星应用, 2018(5): 40−42. doi: 10.3969/j.issn.1674-9030.2018.05.011Lan Youguo, Lang Shuyan, Lin Mingsen, et al. Application of HY-2A microwave Scatterometer in typhoon remote sensing monitoring[J]. Satellite Application, 2018(5): 40−42. doi: 10.3969/j.issn.1674-9030.2018.05.011 [26] 邹巨洪, 林明森, 邹斌, 等. HY-2卫星散射计热带气旋自动识别算法[J]. 海洋学报, 2015, 37(1): 73−79.Zou Juhong, Lin Mingsen, Zou Bin, et al. Automated cyclone detection using HY-2 satellite data[J]. Haiyang Xuebao, 2015, 37(1): 73−79. [27] Hu Tangao, Wang Xiao, Zhang Dengrong, et al. Study on typhoon center monitoring based on HY-2 and FY-2 data[J]. IEEE Geoscience & Remote Sensing Letters, 2017, 14(12): 2350−2354. [28] 杨典, 宋清涛, 蒋兴伟, 等. 基于散射计风场数据的台风强度诊断方法——以海洋二号卫星数据为例[J]. 海洋学报, 2019, 41(1): 151−159.Yang Dian, Song Qingtao, Jiang Xingwei, et al. A typhoon intensity estimation technique based on scatterometer winds observed from the HY-2 satellite[J]. Haiyang Xuebao, 2019, 41(1): 151−159. [29] Wang Zhixiong, Zhao Chaofang, Zou Juhong, et al. An improved wind retrieval algorithm for the HY-2A scatterometer[J]. Chinese Journal of Oceanology and Limnology, 2015, 33(5): 1201−1209. doi: 10.1007/s00343-015-4145-3 [30] 林明森, 邹巨洪, 解学通, 等. HY-2A微波散射计风场反演算法[J]. 中国工程科学, 2013, 15(7): 68−74. doi: 10.3969/j.issn.1009-1742.2013.07.010Lin Mingsen, Zou Juhong, Xie Xuetong, et al. HY-2A microwave scatterometer wind retrieval algorithm[J]. Engineering Sciences, 2013, 15(7): 68−74. doi: 10.3969/j.issn.1009-1742.2013.07.010 [31] 张毅. 海洋二号卫星台风监测概况[J]. 卫星应用, 2016(6): 31−34.Zhang Yi. General situation of typhoon monitoring by HY-2[J]. Satellite Application, 2016(6): 31−34. [32] 杨典. 一种基于散射计数据的台风定强方法[D]. 北京: 国家海洋环境预报中心, 2018.Yang Dian. A method of typhoon strength determination based on scatterometer data[D]. Beijing: National Marine Environmental Forecasting Center, 2018. [33] Holland G J. An analytic model of the wind and pressure profiles in hurricanes[J]. Monthly Weather Review, 1980, 108(8): 1212−1218. doi: 10.1175/1520-0493(1980)108<1212:AAMOTW>2.0.CO;2 [34] Willoughby H E, Rahn M E. Parametric representation of the primary hurricane vortex. Part I: observations and evaluation of the Holland (1980) model[J]. Monthly Weather Review, 2004, 132(12): 3033−3048. doi: 10.1175/MWR2831.1 [35] 杨万康, 尹宝树, 伊小飞, 等. 基于Holland风场的台风浪数值计算[J]. 水利水运工程学报, 2017(4): 28−34.Yang Wankang, Yin Baoshu, Yi Xiaofei, et, al. Numerical calculation and research of typhoon waves based on Holland wind field[J]. Hydro-Science and Engineering, 2017(4): 28−34. [36] Vickery P J, Skerlj P F, Steckley A C, et al. Hurricane wind field model for use in hurricane simulations[J]. Journal of Structural Engineering, 2000, 126(10): 1203−1221. doi: 10.1061/(ASCE)0733-9445(2000)126:10(1203) [37] 贾永君, 刘建强, 林明森, 等. 海洋二号卫星3个主要载荷风速测量比较[J]. 中国工程科学, 2014, 16(6): 27−32. doi: 10.3969/j.issn.1009-1742.2014.06.004Jia Yongjun, Liu Jianqiang, Lin Mingsen, et al. Comparison of wind speed from 3 main payloads of HY-2 satellite[J]. Engineering Science, 2014, 16(6): 27−32. doi: 10.3969/j.issn.1009-1742.2014.06.004 -

计量
- 文章访问数: 291
- HTML全文浏览量: 48
- PDF下载量: 91
- 被引次数: 0
