

A statistical analysis on cyclonic gale processes along Chinese Antarctic Research Expedition routes
-
摘要: 综合使用“雪龙”号走航气象观测数据、SeaSpace极轨卫星云图、ERA-Interim再分析数据,研究了中国第19~34次南极考察航线上由南大洋气旋导致的气旋大风过程,分析了其发生数量及时间间隔、强度和空间分布等特征,探讨了气旋大风发生间隔与南极涛动的关系。南大洋气旋对中国南极考察航线影响频繁且强烈,气旋大风过程数量与航次时长呈显著正相关,平均而言每个航次出现约18(4)次气旋大风过程(强过程),平均每间隔6.5(30)天就出现一次;气旋大风过程中,过程风速平均达8级,最大可达12级。但气旋大风过程的数量、发生时间间隔、最大风速都存在较为明显的航次差异。气旋大风过程时间间隔与南半球夏季南极涛动指数呈负相关,且对于发生在55°S以南的过程负相关更为显著;南极涛动通过调整中高纬度风压带强弱,并影响气旋活动数量和活动区域,进而影响考察航线上气旋大风过程发生数量和频率。气旋大风过程可以发生在南大洋和极区内的任意航段,其中以45°~60°S绕极西风带内发生最为频繁,尤其易出现在气旋中心及其北侧与副热带高压配合产生的强梯度风区内。在4个重点考察海域中,由于阿蒙森低压的存在,阿蒙森海气旋大风过程和强过程发生最为频繁,其次是南极半岛海域,而普里兹湾和罗斯海气旋大风过程频率明显低于前两个海域,由于罗斯海最为偏南,不易受到气旋大风过程影响。Abstract: Using the meteorological observation data and SeaSpace polar-orbiting satellite images collected on the R/V Xuelong, in conjunction with the ERA-Interim reanalysis data, this paper studies the cyclonic gale processes (CGPs) that occurred in the 19th to 34th Chinese Antarctic Research Expedition (CHINARE-Antarctic). The characteristics of the number, occurrence interval, intensity, and spatial distribution are analyzed statistically. And the relationship between occurrence interval of CGPs and the Antarctic Oscillation (AAO) is discussed. The Southern Ocean cyclones have frequent and strong impacts on the CHINARE-Antarctic routes. A significant positive correlation can be seen between CGPs number and the time duration of voyages. On average, there are about 18 (4) CGPs (strong ones) per voyage, which occurs once every 6.5(30) days, and the average wind speed during CGPs reaches Beaufort wind scale 8, while the maximum of which can reach scale 12. However, the number, occurrence interval and maximum wind speed of CGPs vary significantly during different voyages. There is a negative correlation between the occurrence interval of CGPs and the austral summer AAO index, which is significant for the CGPs appeared over the poleward side of 55°S. AAO adjusts the strength of the mid-high latitude pressure regime and affects the number and active area of cyclone activities, which in turn affects the number and frequency of CGPs. The CGPs can occur in any segment of the Southern Ocean and Polar Region, with the most frequent occurrence over the circumpolar westerly in 45°~60°S, especially in the strong pressure gradient zone produced by the combination of the low-pressure system and the northern subtropical high. In the four key expedition areas around Antarctica, the CGP and strong CGP over the Amundsen Sea occur most frequently because of the strong Amundsen Sea Low, followed by the Antarctic Peninsula, while the Prydz Bay and Ross Sea CGPs are significantly lower than the former two regions. Compared with the Prydz Bay, the Ross Sea is less susceptible to cyclones due to its southernmost position.
-

图 1 南极考察航线气旋大风过程个例
a. “雪龙”号2011年12月24−26日走航气象观测序列,蓝色六角星表示观测时有雪;b. 2011年12月25日06:51UTC极轨红外卫星云图;c. ERA-Interim再分析数据2011年12月25日06UTC地面实况分析图;b和c中红色十字代表船位
Fig. 1 An example of cyclonic gale process along the Chinese National Antarctic Research Expedition route
a. The time series of meteorological observation collected on the R/V Xuelong on 24th to 26th December, 2011, blue six-pointed star represents snowing; b. the polar-orbiting infrared satellite image at 06:51UTC on 25th December, 2011; c. the surface analysis of 06UTC on 25th December, 2011 based on ERA-Interim reanalysis data; red crosses in panel b and c represent the locations of R/V Xuelong
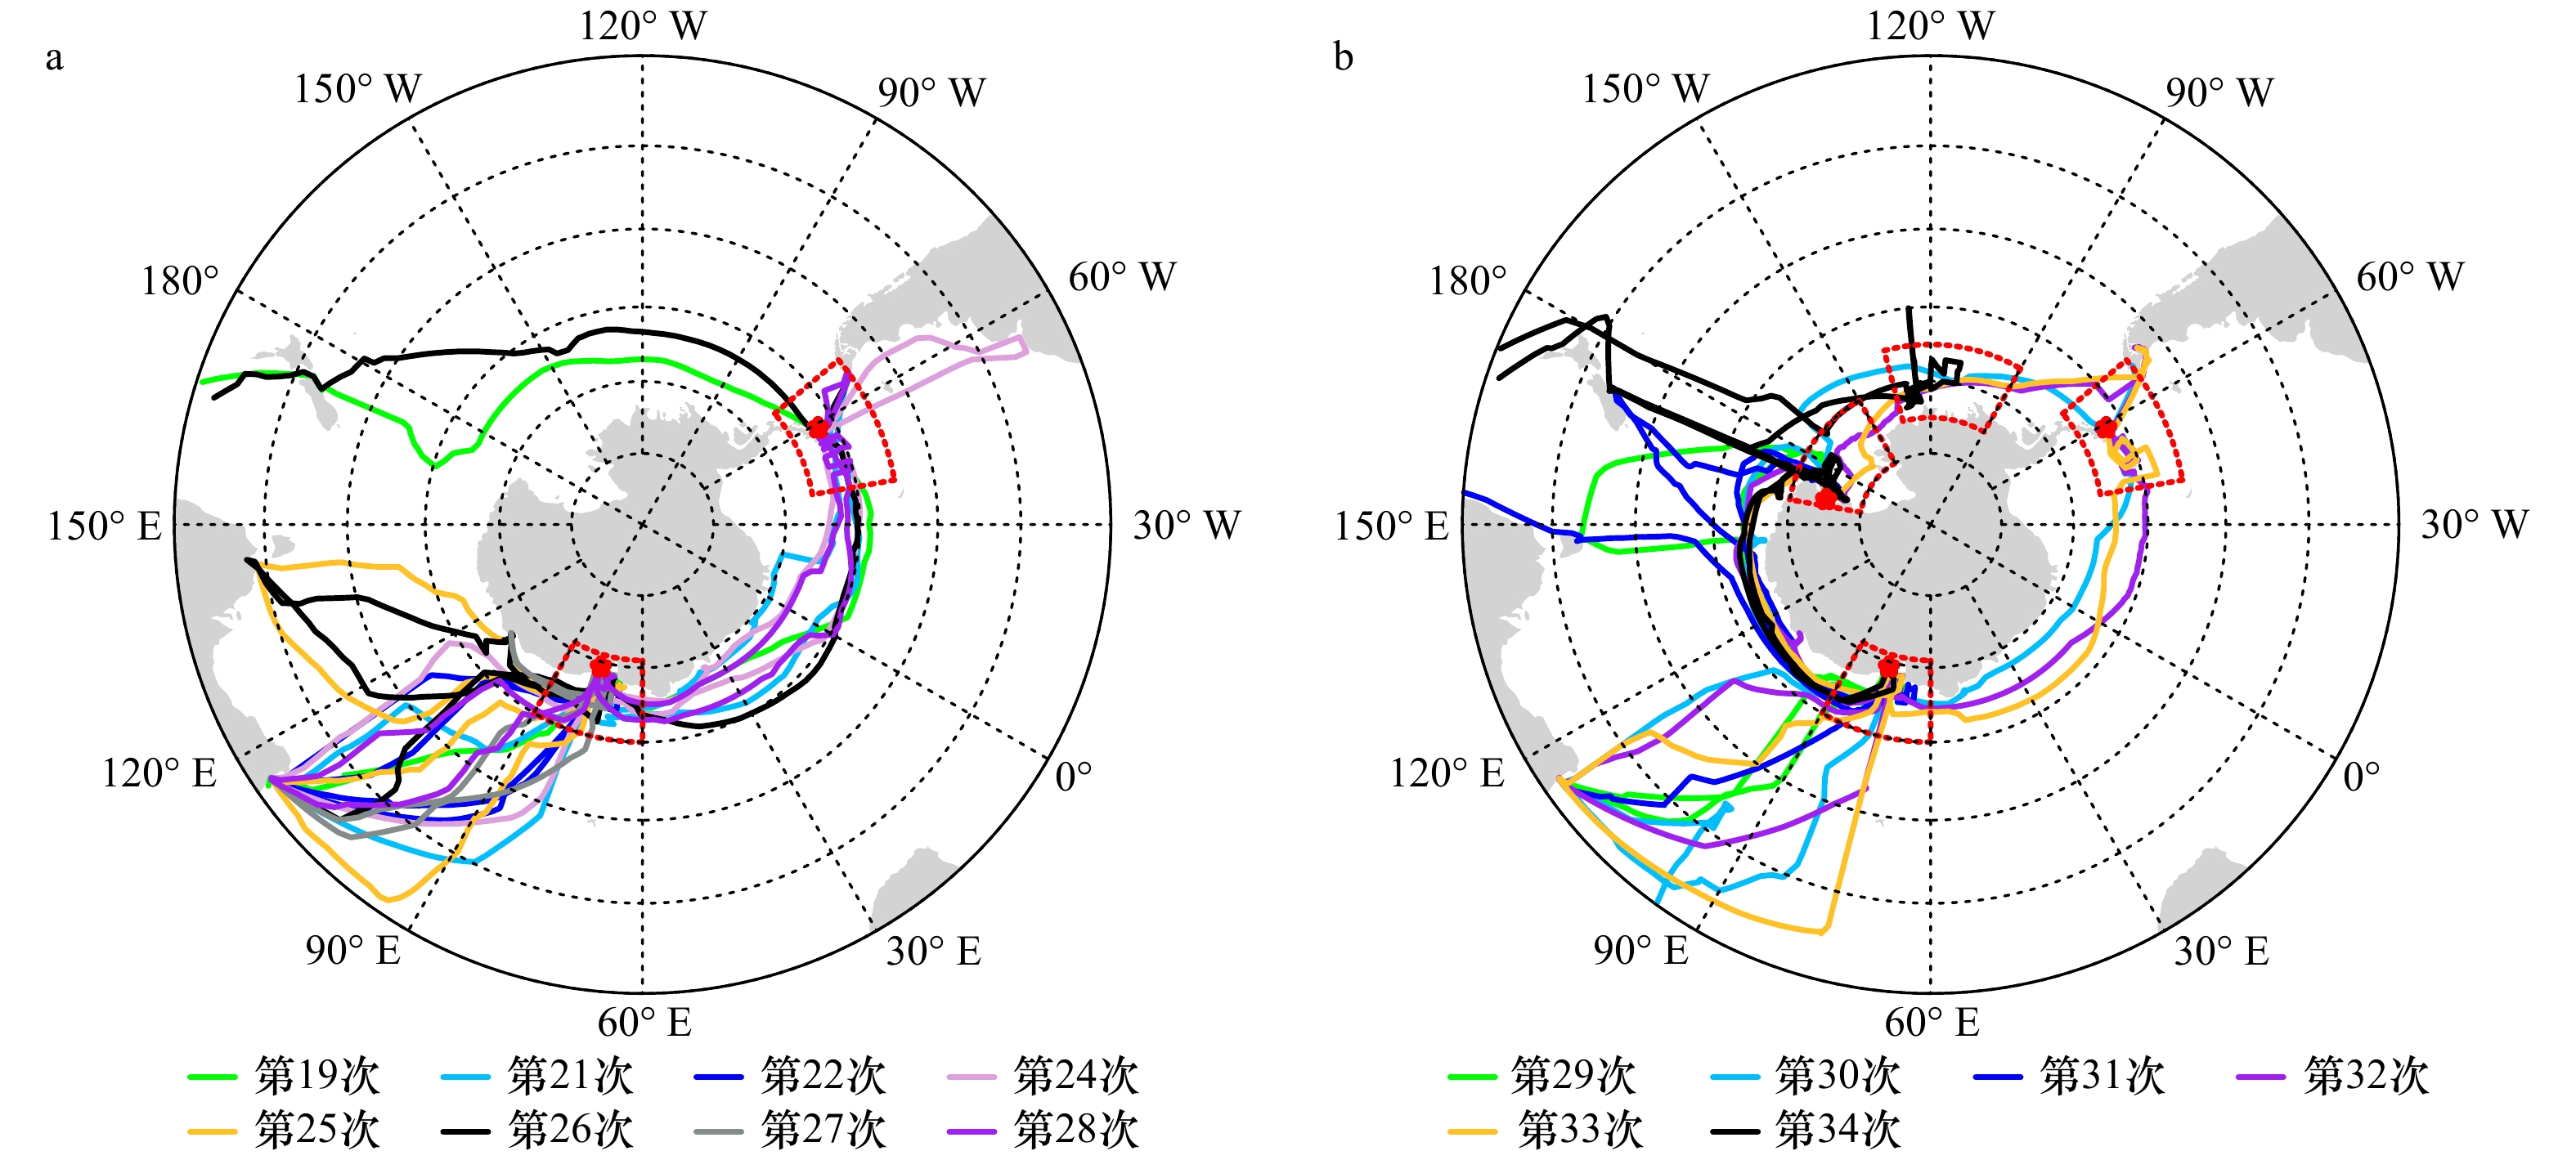
图 2 中国第19~28次(a)和第29~34次(b)南极考察航迹
红色五角星代表科考站位置,红色虚线扇形区域代表重点考察海域
Fig. 2 The routes of 19th to 28th (a), 29th to 34th (b) of the Chinese National Antarctic Research Expedition
Red stars represent the scientific investigation stations, red fan-shaped regions represent the key expedition areas

图 3 南半球夏季中高纬度平均海平面气压(黑线,单位:hPa)和10 m风速场(填色)(a),10 m风速达到6级以上概率(填色)分布(b)
Fig. 3 The distribution of mean sea level pressure (black lines, unit: hPa), wind speed at 10 meter above the sea level (shaded) (a), and mean frequency above Beaufort wind scale 6 (shaded) (b) over the Southern Hemisphere extratropical regions in austral summer

图 4 航次时长(紫线,单位:d)、气旋大风过程数量(蓝色柱状)、强过程数量(红色柱状)及强过程数量占总数百分比(黑线)
蓝色(红色)数字为气旋大风过程(强过程)数量与航次时长的相关系数
Fig. 4 The time duration of voyages (purple line, units: d), the number of cyclonic gale process (blue bar), the number of strong cyclonic gale process (red bar), and percentage of strong cyclonic gale process (black line)
Blue (red) text represents the correlation coefficient of the number of (strong) cyclonic gale process with the time duration of voyages
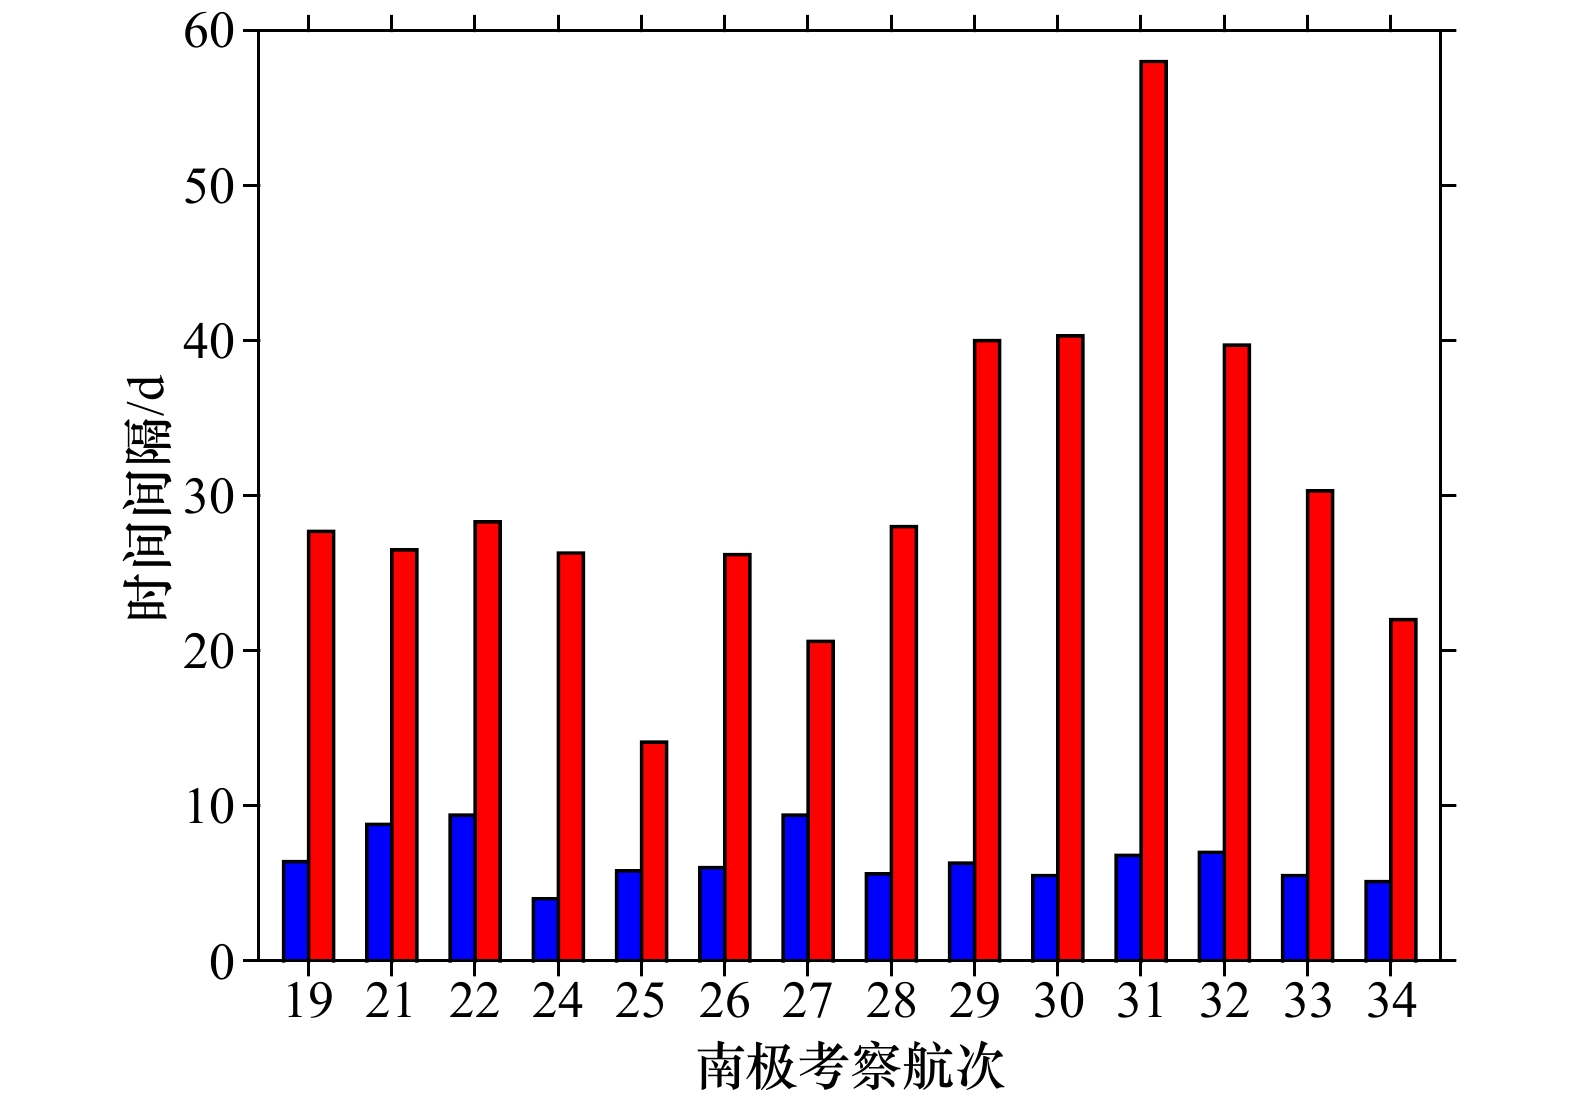
图 5 气旋大风过程(蓝色柱状)、强过程(红色柱状)发生时间间隔序列
Fig. 5 The occurrence interval series of cyclonic gale process (blue bar), strong cyclonic gale process (red bar)
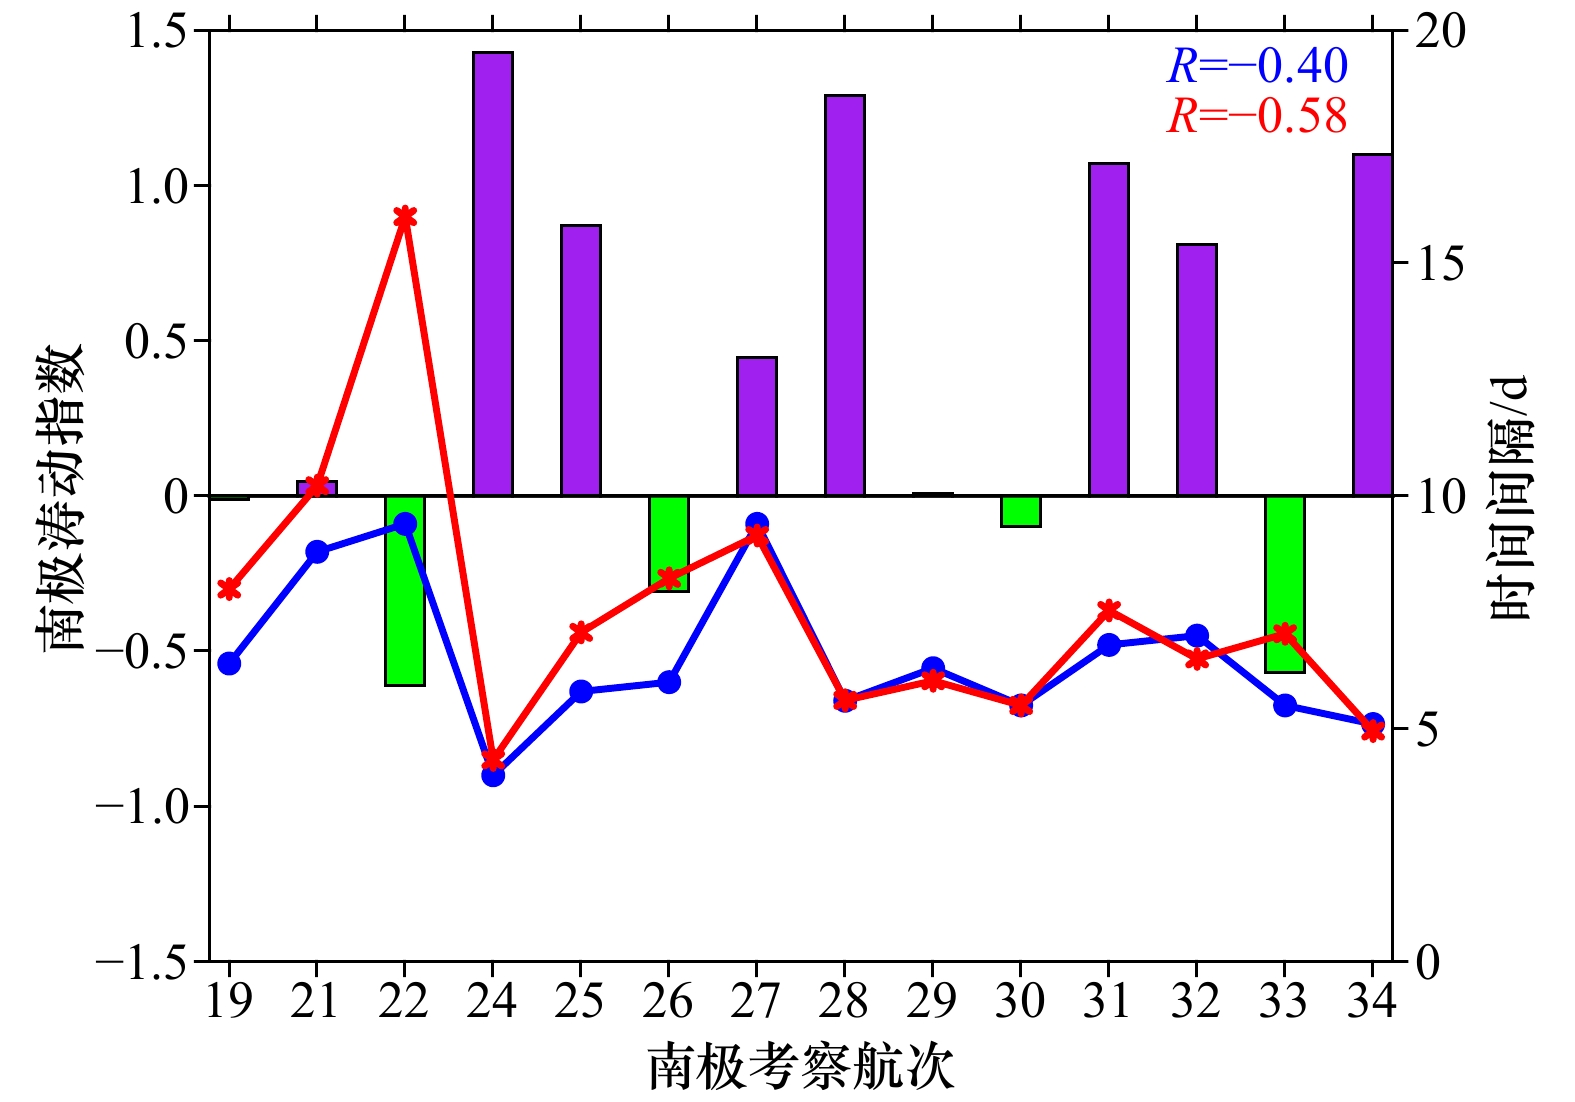
图 6 南半球夏季南极涛动指数(柱状,正:紫色,负:绿色)与气旋大风过程发生时间间隔(实线,单位:d)序列
蓝色(红色)实线和数字表示55°S以南气旋大风过程发生时间间隔及其与南极涛动指数的相关系数
Fig. 6 The series of Antarctic Oscillation index (positive: purple bar, negative: green bar) in austral summer and the occurrence interval of cyclonic gale process (solid lines, unit: d)
Blue line and text represent the occurrence interval of all cyclonic gale process and its correlation coefficient with Antarctic Oscillation index, red ones represent the cyclonic gale process poleward of 55°S, respectively
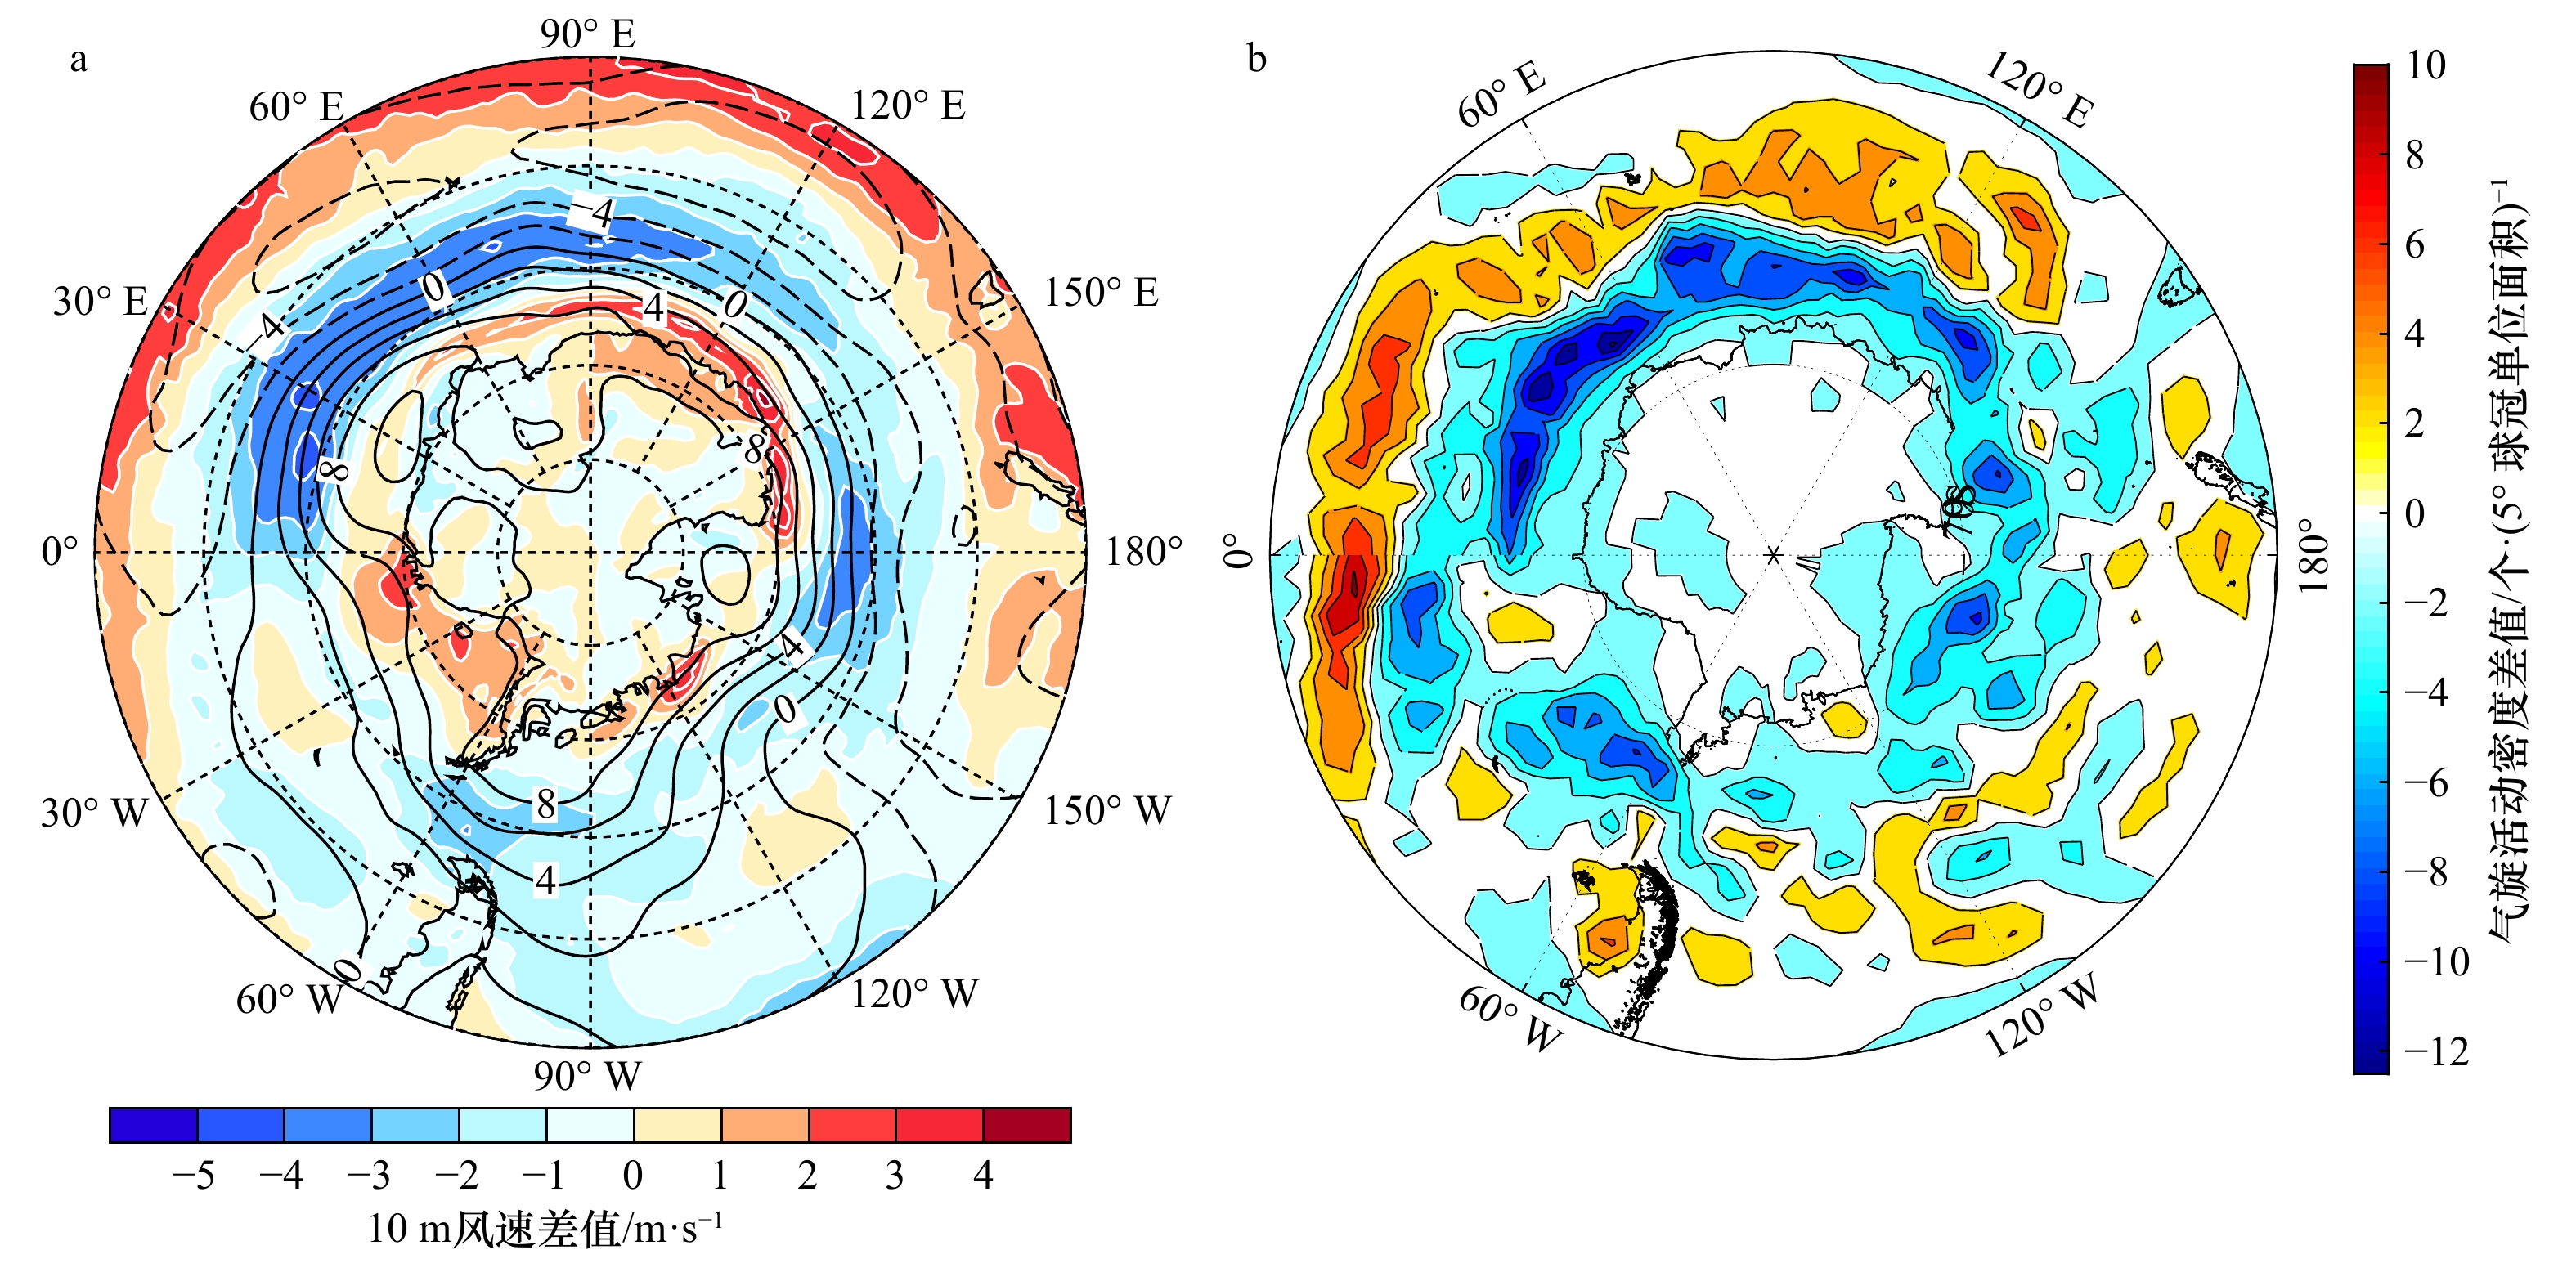
图 7 南半球夏季海平面气压(黑线,单位:hPa)、10 m风速(填色)差值场(a)和气旋活动密度(填色)差值场(b)(2005/2006减2007/2008)
Fig. 7 The difference fields (2005/2006 minus 2007/2008) of sea level pressure (black lines, unit: hPa), wind speed at 10 meter above the sea level (shaded) (a), and cyclone density (shaded) (b) of Southern Hemisphere in summer
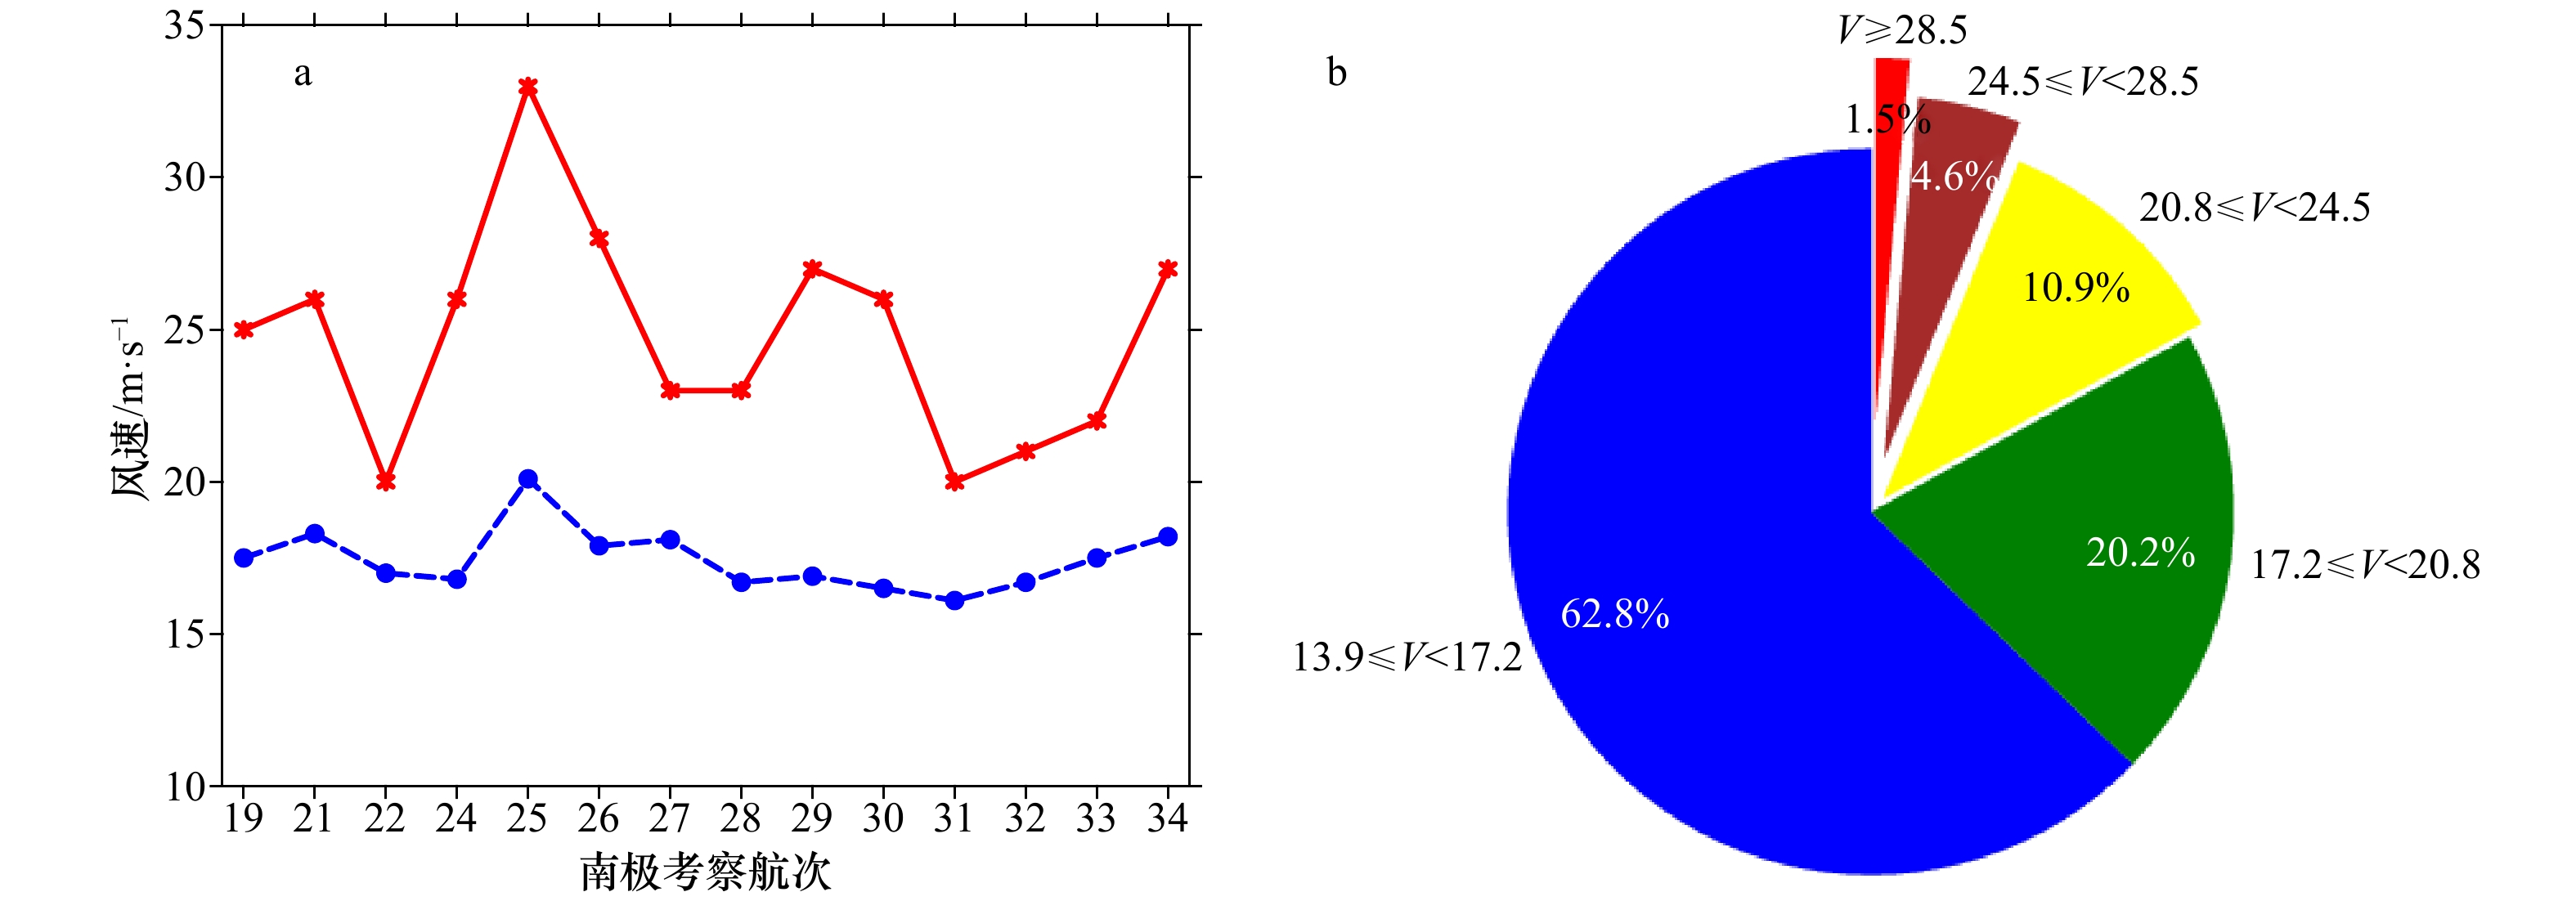
图 8 气旋大风过程强度序列(a)和百分比分布(b)
a图中红色实线表示最大过程风速;蓝色虚线表示平均过程风速;b图中V表示过程风速(单位:m/s)
Fig. 8 The series (a) and probability (b) distribution of cyclonic gale process intensity
Red solid (blue dashed) line in a represent the maximum (average) wind speed; V in b represent the maximum wind speed during a cyclonic gale process (unit: m/s)
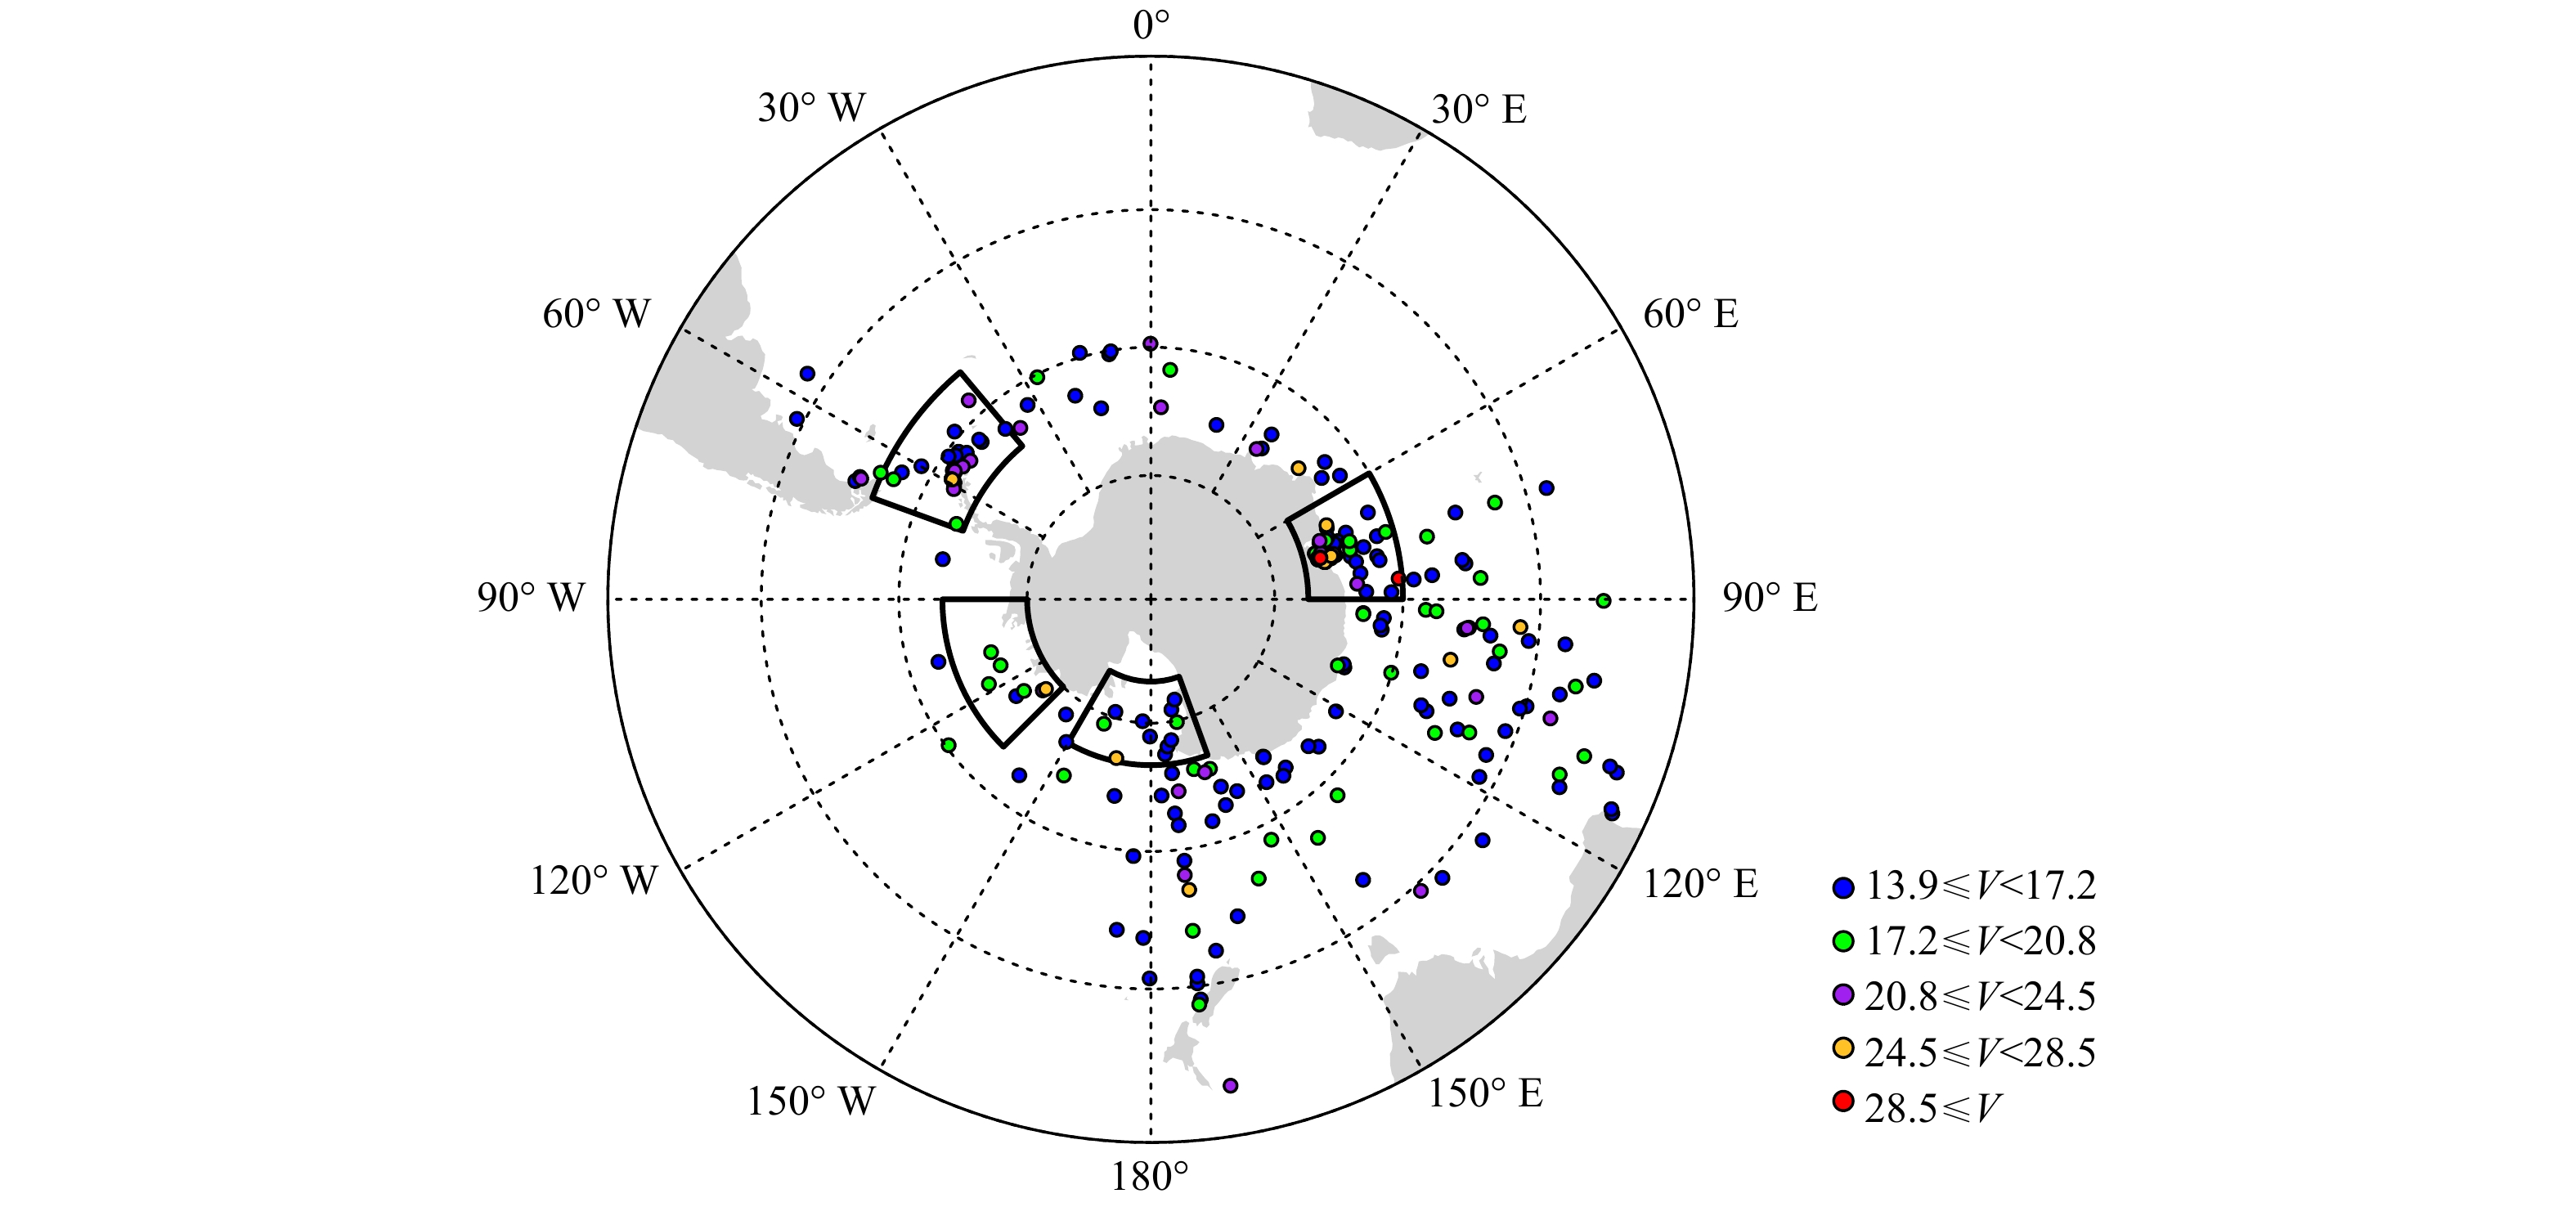
图 9 气旋大风过程空间分布
V表示过程风速,单位:m/s;扇形框代表4个重点科考海域
Fig. 9 The spatial distribution of cyclonic gale process
V is the maximum wind speed during a cyclonic gale process, unit: m/s; fan-shaped regions represent the four key expedition areas
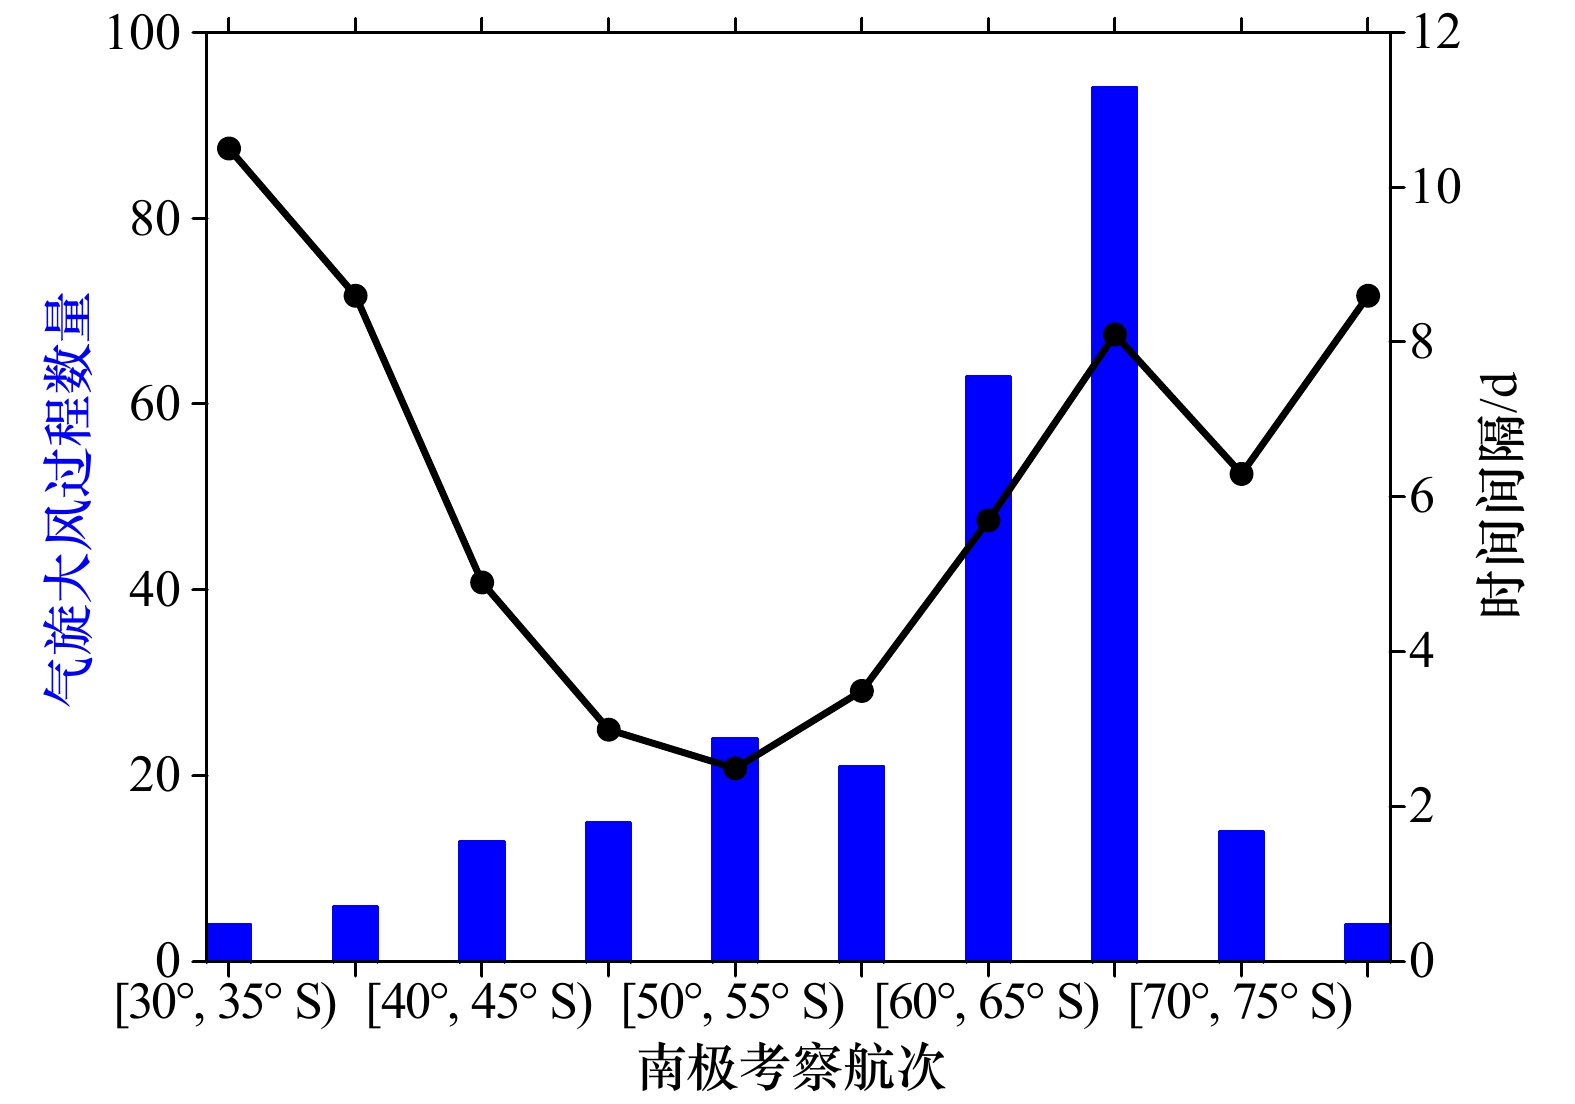
图 10 气旋大风过程纬度分布
蓝色柱状表示气旋大风过程数量,黑色线表示气旋大风过程时间间隔
Fig. 10 The latitudinal distribution of cyclonic gale process
Blue bar represent the number of cyclonic gale process, black line represent the occurrence interval of cyclonic gale process
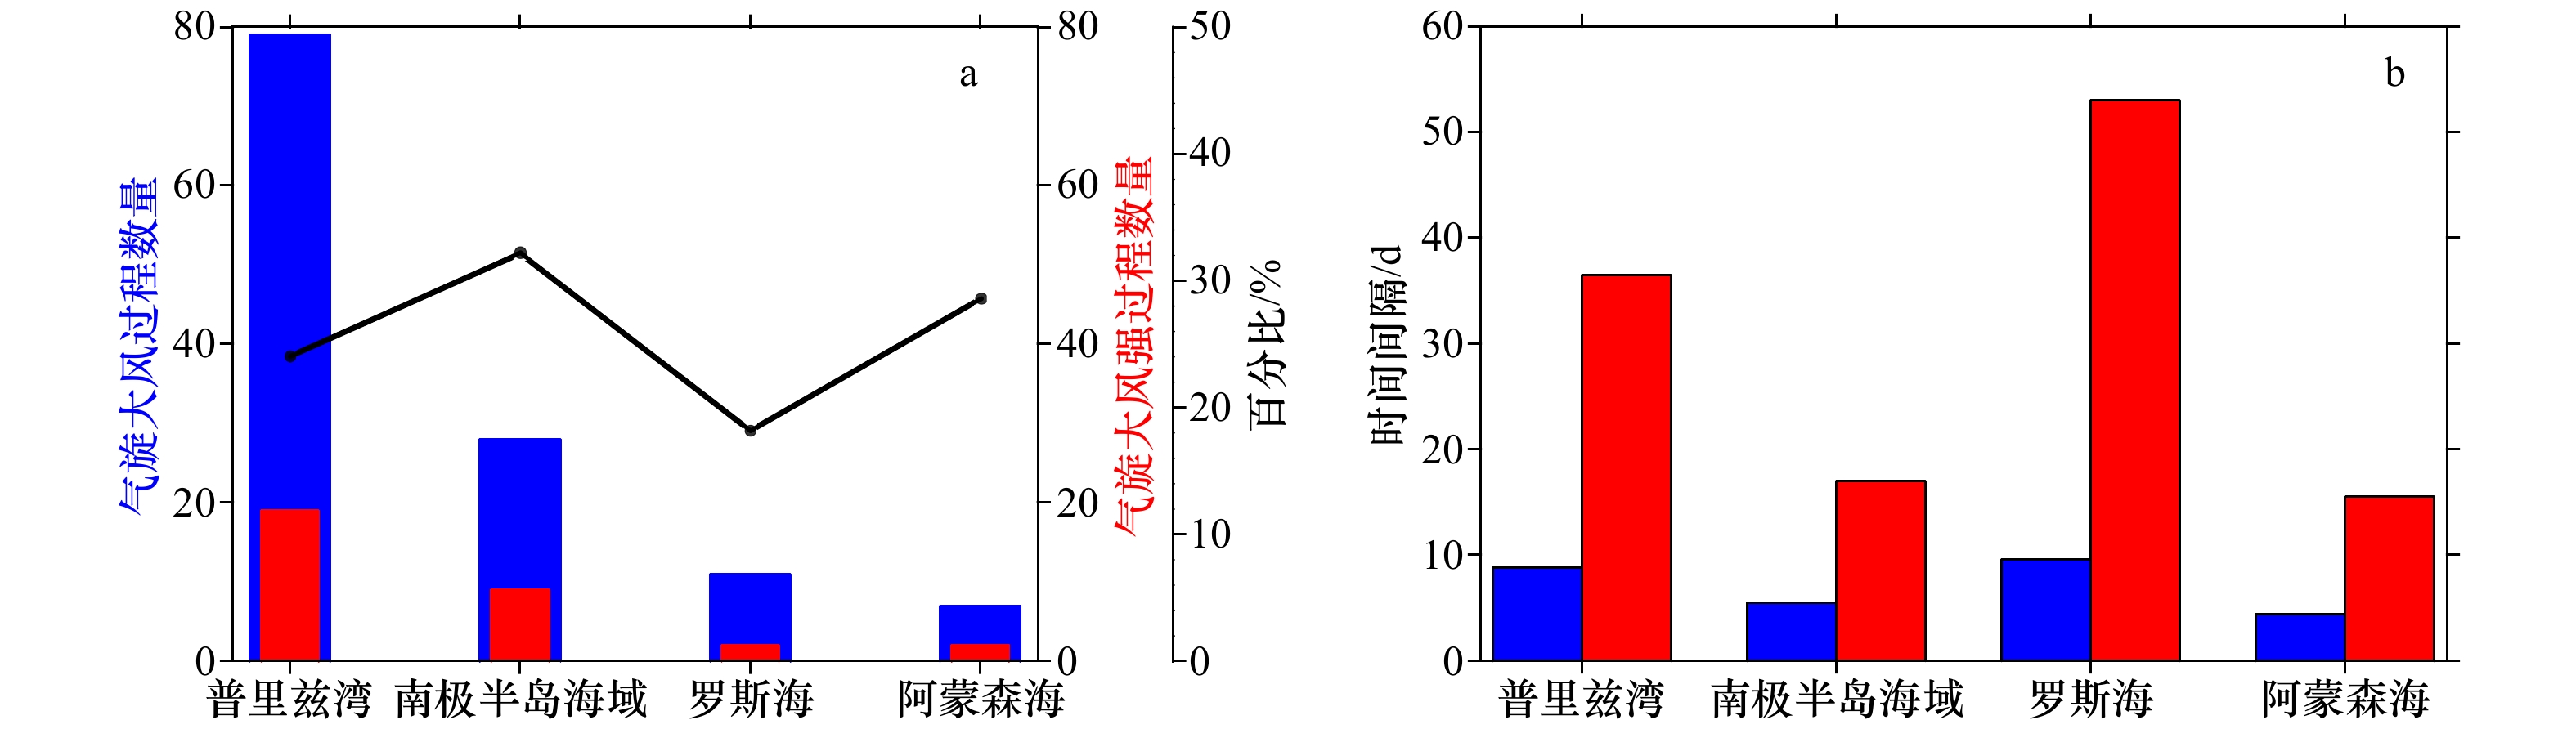
图 11 重点科考海域气旋大风过程数量(a)和发生时间间隔(b)
a图中蓝色和红色柱状表示气旋大风过程和强过程发生次数,黑色线表示强过程所占百分比;b图中蓝色和红色柱状表示气旋大风过程和强过程发生时间间隔
Fig. 11 The number (a) and occurrence interval (b) of cyclonic gale process occurred over the key expedition areas
In panel a, blue and red bar represent the number of cyclonic gale process or strong ones, respectively, and black line indicates the percentage of strong ones. In panel b, blue and red bar represent same as panel a, except for the occurrence interval
表 1 南极周边重点科考海域的划分
Tab. 1 The division of key expedition areas around Antarctica
考察海域 经纬度范围 总考察时间/d 普里兹湾 60°~90°E,60°S以南 693 南极半岛海域 40°~70°W,55°S以南 153 罗斯海 160°E~150°W,70°S以南 106 阿蒙森海 90°~135°W,65°S以南 31  下载: 导出CSV
-
[1] Wei Lixin, Qin Ting. Characteristics of cyclone climatology and variability in the Southern Ocean[J]. Acta Oceanologica Sinica, 2016, 35(7): 59−67. doi: 10.1007/s13131-016-0913-y [2] Uotila P, Vihma T, Pezza A B, et al. Relationships between antarctic cyclones and surface conditions as derived from high-resolution numerical weather prediction data[J]. Journal of Geophysical Research: Atmospheres, 2011, 116(D7): D07109. [3] Taljaard J J. Development, distribution and movement of cyclones and anticyclones in the Southern Hemisphere during the IGY[J]. Journal of Applied Meteorology, 1967, 6(6): 973−987. doi: 10.1175/1520-0450(1967)006<0973:DDAMOC>2.0.CO;2 [4] Streten N A, Troup A J. A synoptic climatology of satellite observed cloud vortices over the Southern Hemisphere[J]. Quarterly Journal of the Royal Meteorological Society, 1973, 99(419): 56−72. doi: 10.1002/qj.49709941906 [5] Murray R J, Simmonds I. A numerical scheme for tracking cyclone centres from digital data. Part I: development and operation of the scheme[J]. Australian Meteorological Magazine, 1991, 39(3): 156−166. [6] Hodges K I. A general method for tracking analysis and its application to meteorological data[J]. Monthly Weather Review, 1994, 122(11): 2573−2586. doi: 10.1175/1520-0493(1994)122<2573:AGMFTA>2.0.CO;2 [7] Nakamura H, Shimpo A. Seasonal variations in the Southern Hemisphere storm tracks and jet streams as revealed in a reanalysis dataset[J]. Journal of Climate, 2004, 17(9): 1828−1844. doi: 10.1175/1520-0442(2004)017<1828:SVITSH>2.0.CO;2 [8] Jones D A, Simmonds I. A climatology of Southern Hemisphere extratropical cyclones[J]. Climate Dynamics, 1993, 9(3): 131−145. doi: 10.1007/BF00209750 [9] 刘娜, 傅刚, 郭敬天, 等. 南大洋夏季气旋的统计特征[J]. 中国海洋大学学报, 2007, 37(4): 517−524, 662.Liu Na, Fu Gang, Guo Jingtian, et al. Characteristics of cyclones in summer over the Southern Oceans[J]. Periodical of Ocean University of China, 2007, 37(4): 517−524, 662. [10] Rao V B, do Carmo A M C, Franchito S H. Seasonal variations in the Southern Hemisphere storm tracks and associated wave propagation[J]. Journal of the Atmospheric Sciences, 2002, 59(6): 1029−1040. doi: 10.1175/1520-0469(2002)059<1029:SVITSH>2.0.CO;2 [11] 陈锦年, 乐肯堂, 贾传明, 等. 南半球气旋发生频数的变化及其与赤道东太平洋水温和南方涛动的关系[J]. 海洋学报, 2000, 22(3): 86−93.Chen Jinnian, Le Kentang, Jia Chuanming, et al. The change of the frequency of cyclone occurrece in the southern hemisphere influence on SST in the East Pacific and Southern Oscillation[J]. Haiyang Xuebao, 2000, 22(3): 86−93. [12] Pezza A B, Durrant T, Simmonds I, et al. Southern Hemisphere synoptic behavior in extreme phases of SAM, ENSO, sea ice extent, and southern Australia rainfall[J]. Journal of Climate, 2008, 21(21): 5566−5584. doi: 10.1175/2008JCLI2128.1 [13] Pezza A B, Rashid H A, Simmonds I. Climate links and recent extremes in Antarctic sea ice, high-latitude cyclones, Southern Annular Mode and ENSO[J]. Climate Dynamics, 2012, 38(1/2): 57−73. [14] 陈善敏, 张遴煜, 逯昌贵. 西南极地区极地气旋路径的统计分析[J]. 气象科学研究院院刊, 1989, 4(2): 150−155.Chen Shanmin, Zhang Linyu, Lu Changgui. A statistical analysis of cyclone tracks in west Antarctic region[J]. Journal of Academy of Meteorological Science, 1989, 4(2): 150−155. [15] 王景毅, 谭燕燕. 南极南大洋夏季气旋爆发性发展的观测实例及分析[J]. 海洋学报, 1990, 12(2): 251−256.Wang Jingyi, Tan Yanyan. The observational analysis of the explosive cyclones in summer over the Southern Ocean[J]. Haiyang Xuebao, 1990, 12(2): 251−256. [16] 郭进修. 东南极普里兹湾1990年1−2月大风过程与气旋和锋面活动分析[J]. 南极研究, 1991, 3(1): 39−46.Guo Jinxiu. Analysis of strong wind processes and action of cyclones and fronts during January-February, 1990, over Prydz Bay, Eastern Antarctic[J]. Antarctic Research, 1991, 3(1): 39−46. [17] 胡胜利. 南极考察航线选择和灾害性天气系统[J]. 海洋预报, 1995, 12(2): 74−78. doi: 10.11737/j.issn.1003-0239.1995.02.011Hu Shengli. The disastrous synoptic systems and the selection of Chinese Antarctic Expedition routes[J]. Marine Forecasts, 1995, 12(2): 74−78. doi: 10.11737/j.issn.1003-0239.1995.02.011 [18] 解思梅, 郝春江, 梅山, 等. 南极普里兹湾气旋的生消发展[J]. 海洋学报, 2002, 24(6): 11−19.Xie Simei, Hao Chunjiang, Mei Shan, et al. Cyclone formation-development in the Antarctic Prydz Bay[J]. Haiyang Xuebao, 2002, 24(6): 11−19. [19] 胡胜利. 长城站极地气旋与暴风雪天气[J]. 海洋预报, 2004, 21(4): 35−39. doi: 10.3969/j.issn.1003-0239.2004.04.005Hu Shengli. The polar cyclones and the blizzard weather at the Great Wall Station[J]. Marine Forecasts, 2004, 21(4): 35−39. doi: 10.3969/j.issn.1003-0239.2004.04.005 [20] 耿淑琴, 蔡琳. 第十九次南极考察期间的航线天气及预报[J]. 海洋预报, 2004, 21(2): 37−43. doi: 10.3969/j.issn.1003-0239.2004.02.006Geng Shuqin, Cai Lin. An introduction to the weather and its forecasting work along the route of the Chinese 19th Antarctic expedition[J]. Marine Forecasts, 2004, 21(2): 37−43. doi: 10.3969/j.issn.1003-0239.2004.02.006 [21] 傅刚, 郝燕, 刘娜, 等. 2004年11月南大洋上一对气旋的结构分析[J]. 海洋学报, 2007, 29(6): 15−22.Fu Gang, Hao Yan, Liu Na, et al. An observational study of two cyclones over the Southern Ocean in November 2004[J]. Haiyang Xuebao, 2007, 29(6): 15−22. [22] 国家海洋环境预报中心. 极地考察海洋气象论文集[G]. 北京: 海洋出版社, 2008.National Marine Environmental Forecasting Center. Proceedings of Marine Meteorology during Polar Expedition[G]. Beijing: China Ocean Press, 2008. [23] 秦听, 魏立新, 李珵. 我国南极科考站附近气旋的特征分析[J]. 海洋学报, 2017, 39(5): 44−60.Qin Ting, Wei Lixin, Li Cheng. The statistic and variance of cyclones enter in scientific investigation station of China in Antarctic[J]. Haiyang Xuebao, 2017, 39(5): 44−60. [24] 中国气象局. 地面气象观测规范[M]. 北京: 气象出版社, 2003: 126.China Meteorological Administration. Specifications for Surface Meteorological Observation[M]. Beijing: China Meteorological Press, 2003: 126. [25] 中华人民共和国国家质量监督检验检疫总局, 中国国家标准化管理委员会. GB/T 12763.3-2007, 海洋调查规范第3部分: 海洋气象调查[S]. 北京: 中国标准出版社, 2008.General Administration of Quality Supervision, Inspection and Quarantine of the People's Republic of China, China National Standardization Administration. GB/T 12763.3-2007, Specifications for oceanographic survey-Part 3: Marine meteorological observations[S]. Beijing: China Standards Press, 2008. [26] Dee D P, Uppala S M, Simmons A J, et al. The ERA-Interim reanalysis: configuration and performance of the data assimilation system[J]. Quarterly Journal of the Royal Meteorological Society, 2011, 137(656): 553−597. doi: 10.1002/qj.828 [27] 魏文良. 中国极地考察航线海洋气象研究[M]. 北京: 海洋出版社, 2008: 81-82.Wei Wenliang. A Study on the Marine Meteorology Along the Routes of Chinese Polar Expedition[M]. Beijing: China Ocean Press, 2008: 81-82. [28] Hoskins B J, Hodges K I. A new perspective on Southern Hemisphere storm tracks[J]. Journal of Climate, 2005, 18(20): 4108−4129. doi: 10.1175/JCLI3570.1 [29] Xia Lan, Zahn M, Hodges K I, et al. A comparison of two identification and tracking methods for polar lows[J]. Tellus A: Dynamic Meteorology and Oceanography, 2012, 64(1): 17196. doi: 10.3402/tellusa.v64i0.17196 [30] Gong Daoyi, Wang Shaowu. Definition of Antarctic oscillation index[J]. Geophysical Research Letters, 1999, 26(4): 459−462. doi: 10.1029/1999GL900003 [31] 孙启振, 张林, 张占海, 等. 南极中山站夏季下降风数值模拟个例研究[J]. 海洋学报, 2016, 38(3): 71−81.Sun Qizhen, Zhang Lin, Zhang Zhanhai, et al. Numerical simulation of summer katabatic wind at Zhongshan Station, Antarctica: a case study[J]. Haiyang Xuebao, 2016, 38(3): 71−81. [32] 孙启振, 张占海, 丁卓铭, 等. 南极特拉诺瓦湾下降风特征[J]. 极地研究, 2018, 30(2): 140−153.Sun Qizhen, Zhang Zhanhai, Ding Zhuoming, et al. Characteristics of katabatic winds in Terra Nova Bay, Antarctica[J]. Chinese Journal of Polar Research, 2018, 30(2): 140−153. [33] Turner J, Phillips T, Hosking J S, et al. The Amundsen Sea low[J]. International Journal of Climatology, 2013, 33(7): 1818−1829. doi: 10.1002/joc.3558 [34] 秦听, 刘健, 魏立新, 等. 南极阿蒙森海域气象和海况特征分析[J]. 极地研究, 2019, 31(2): 144−156.Qin Ting, Liu Jian, Wei Lixin, et al. Analysis of meteorological and sea conditions in the Amundsen Sea, Antarctica[J]. Chinese Journal of Polar Research, 2019, 31(2): 144−156. -

计量
- 文章访问数: 796
- HTML全文浏览量: 135
- PDF下载量: 125
- 被引次数: 0
