

Study of the Yellow Sea responses to peripheral processes of Typhoon Chan-hom
-
摘要: 2015年9月台风“灿鸿”经过黄海海域的QF111浮标,该浮标观测到黄海海洋的温度和流速响应。受台风影响,黄海海表温度有明显的下降,降温幅度在2~4°C,且在台风路径右侧形成了海表面温度低于20°C的低温斑块。流速的响应主要表现为台风过境期间流速增强,达1.2~1.5 m/s,呈现出全水深强化的特征。风一直对海洋有能量输入,且在台风过境期间风输入海洋的能量最大,旋转功率谱的分析结果表明台风输入海洋的能量向海洋内部传播。黄海海域由台风激发出的近惯性振荡衰减较快,近惯性振荡e折时间尺度约为2 d。Abstract: In September 2015, Typhoon Chan-hom passed over the buoy named QF111 that can record the ocean temperature and current in the Yellow Sea. Affected by the typhoon, the drop of the sea surface temperatures is obvious, the cooling rate is in 2−4℃, and there formed low temperature patches below 20℃ at the right side of the typhoon path. The current increased during the transit of the typhoon, the velocity is up to 1.2−1.5 m/s, presenting the characteristics of reinforcement from the surface to the bottom. The result that wind did the work to the ocean indicates that wind always input the energy to the ocean, it reached the largest during typhoon transited, and the rotate power spectrum analysis results show that the energy from the wind spread to the ocean interior. The inertial oscillation inspired by the typhoon damp faster in the Yellow Sea, according to the evolution of the inertia horizontal kinetic energy, the e-folding time of the inertial oscillation is about two days.
-

图 1 台风“灿鸿”在黄海海域的移动路径
棕黄色实线代表其仍为台风级别,黄色实线代表其降为热带风暴级别,蓝色代表其消散过程。黑色实点代表浮标QF111的位置,底图颜色代表水深,黑色虚线为30 m等深线,左上子图为QF111浮标实景与示意图
Fig. 1 The path of Typhoon Chan-hom in the Yellow Sea
The tan line represents it’s typhoon level, the yellow line represents it’s tropical storm level and the blue line represents it’s dissipation. The black dot indicates the position of buoy QF111, the contour represents water depth and the black dotted line is the isobath of 30 m, and the upper-left subplot is the picture of QF111

图 2 7月10−15日海表面温度场的演变过程
c图彩色实线代表台风路径,18℃、20℃及22℃等温线以黑色实线标出
Fig. 2 The sea surface temperature variation from 10 to 15, July
The line in c represents the path of the typhoon, the black lines indicate the isotherm of 18℃、20℃ and 22℃ in each subplot
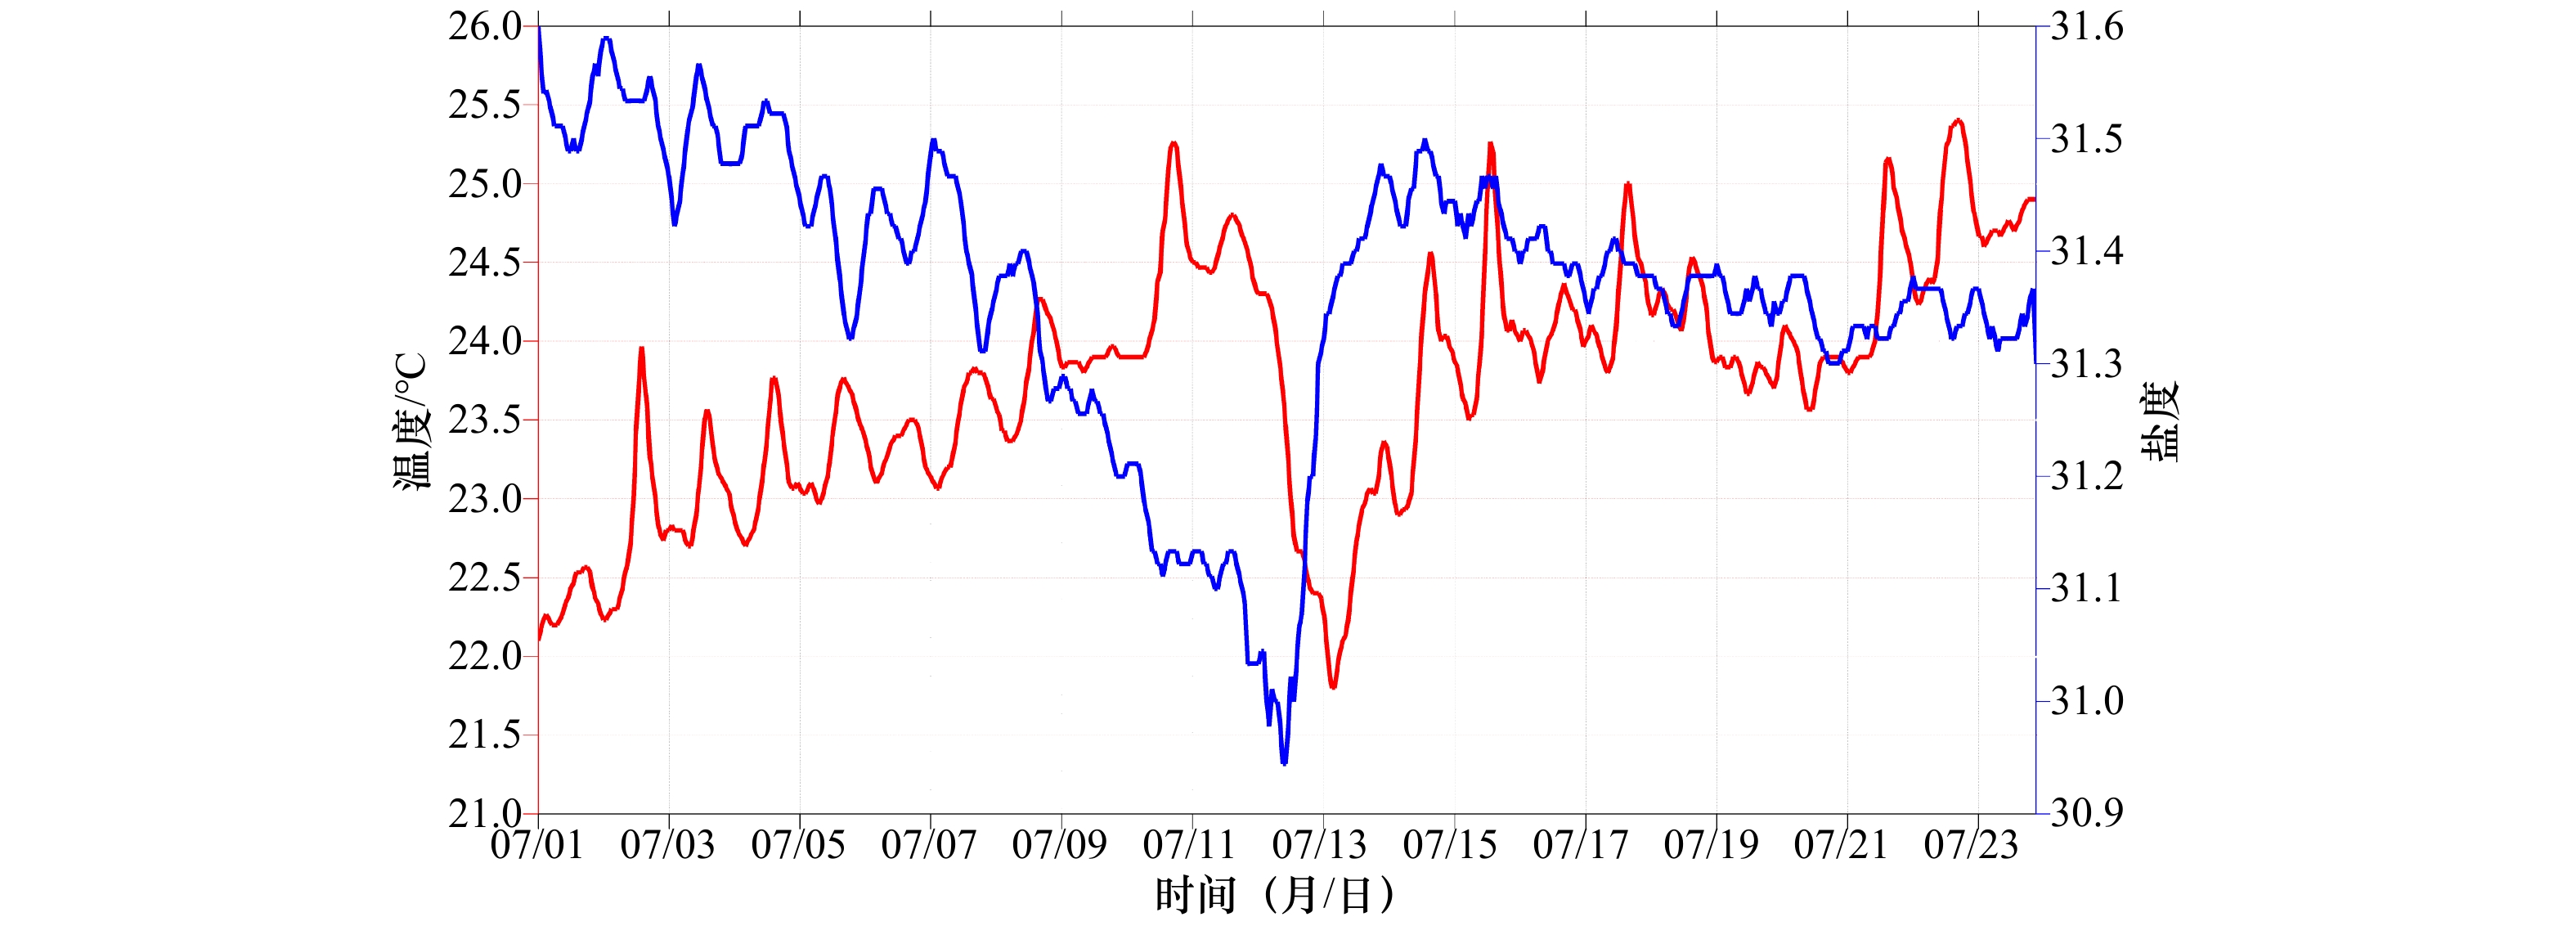
图 3 台风过境期间QF111浮标表层温度及盐度随时间的变化
Fig. 3 Sea surface temperature and salinity variation detected by the buoy QF111 during the typhoon passed

图 4 QF111浮标观测到的东西方向(a)及南北方向(b)原始流速随深度和时间变化
a图中正值代表东方向流速,负值代表西方向流速,b图中正值代表北方向流速,负值代表南方向流速
Fig. 4 Time series of the eastward (a) and northward (b) components of the original velocity observed by the buoy QF111
The positive and negative values in a represent the eastward and westward components of the velocity, respectively. And the positive and negative values in b represent the northward and southward velocity, respectively
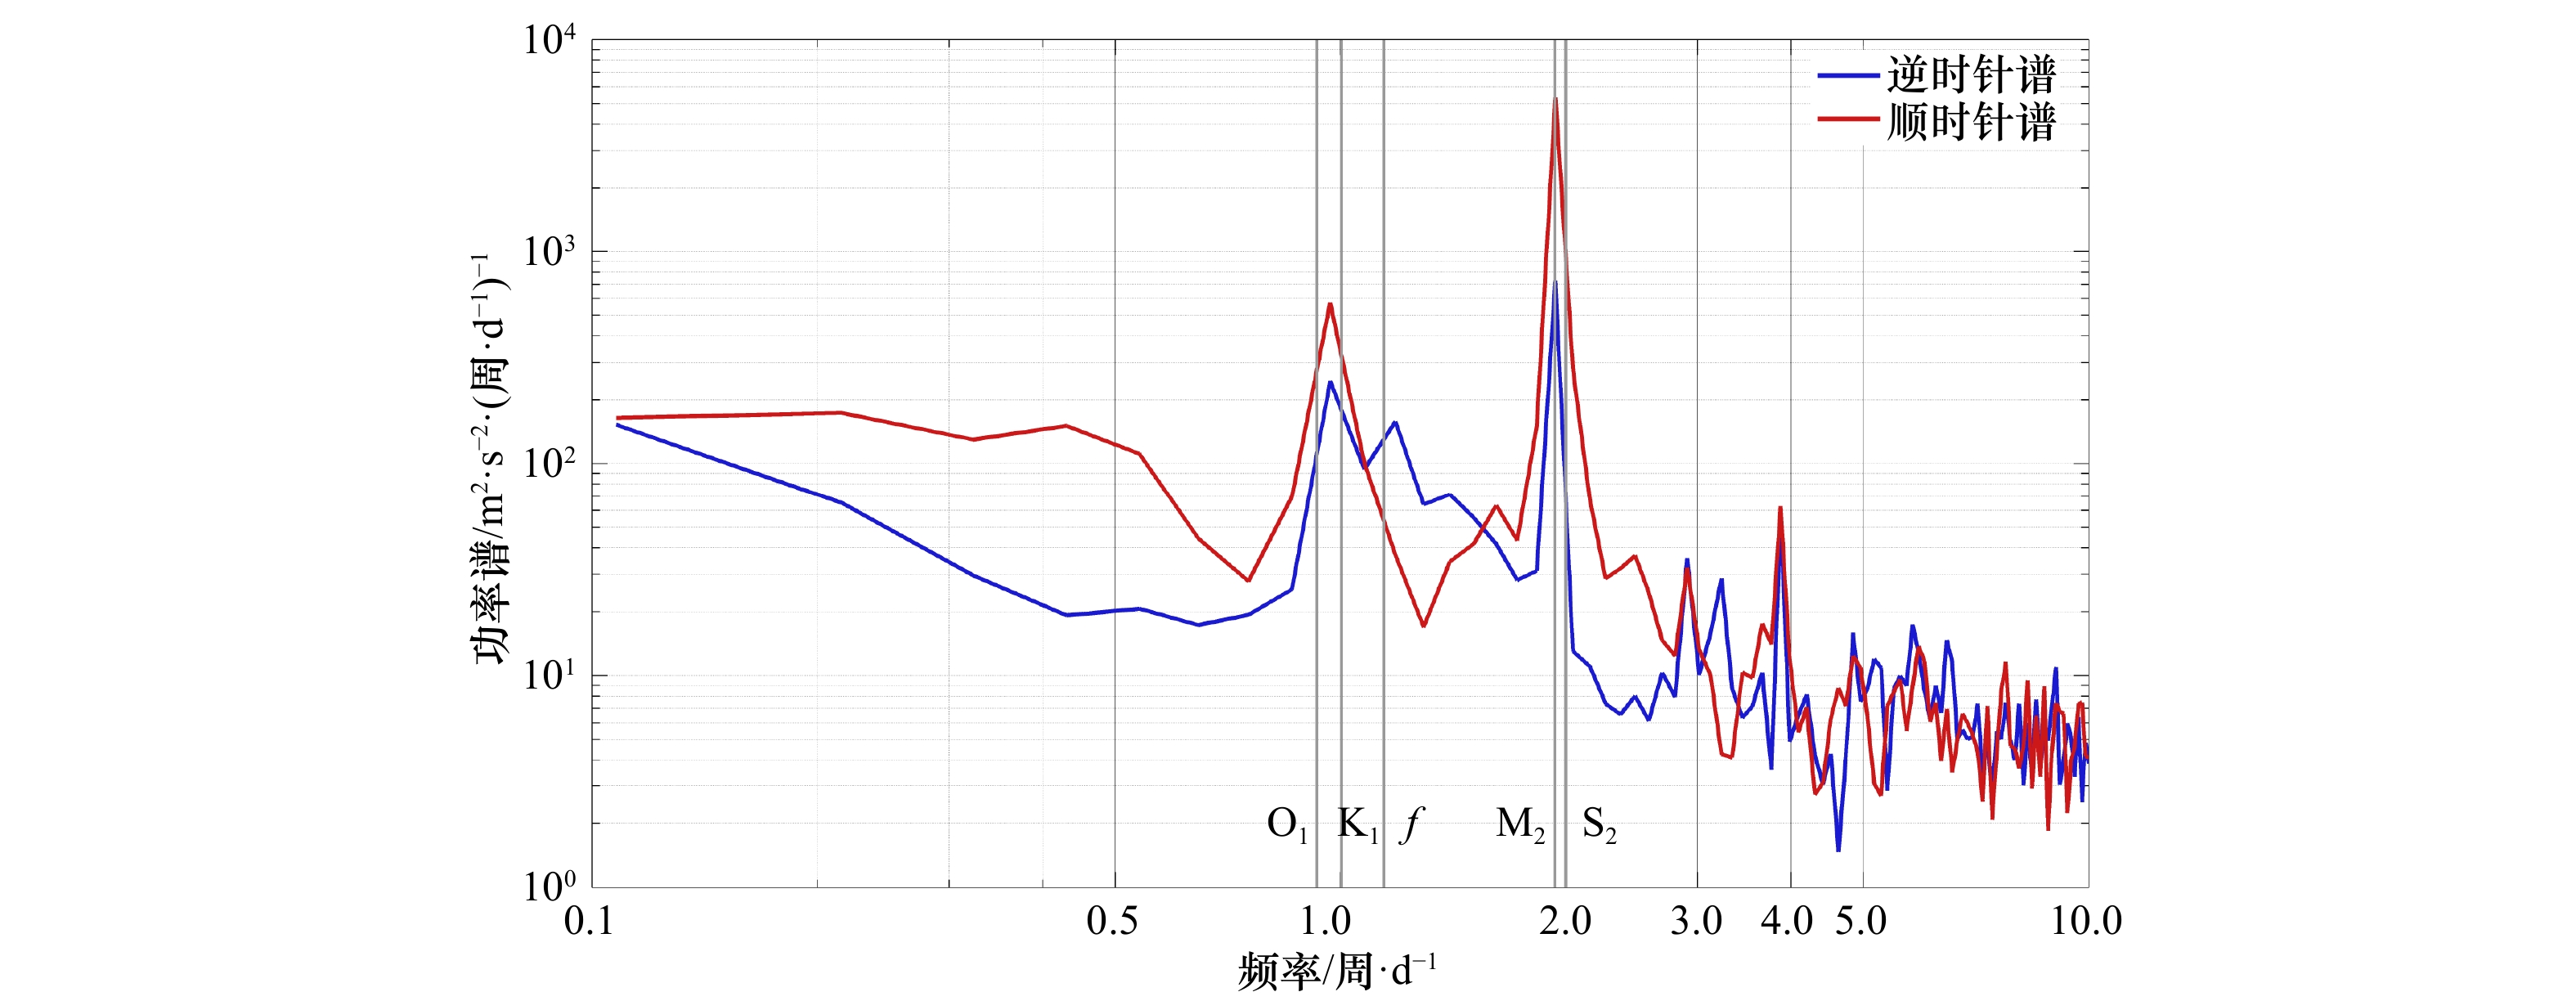
图 5 QF111浮标20 m以上原始流速旋转功率谱深度平均结果
Fig. 5 Depth-averaged rotary frequency spectrum of the original velocity above 20 m of the buoy QF111
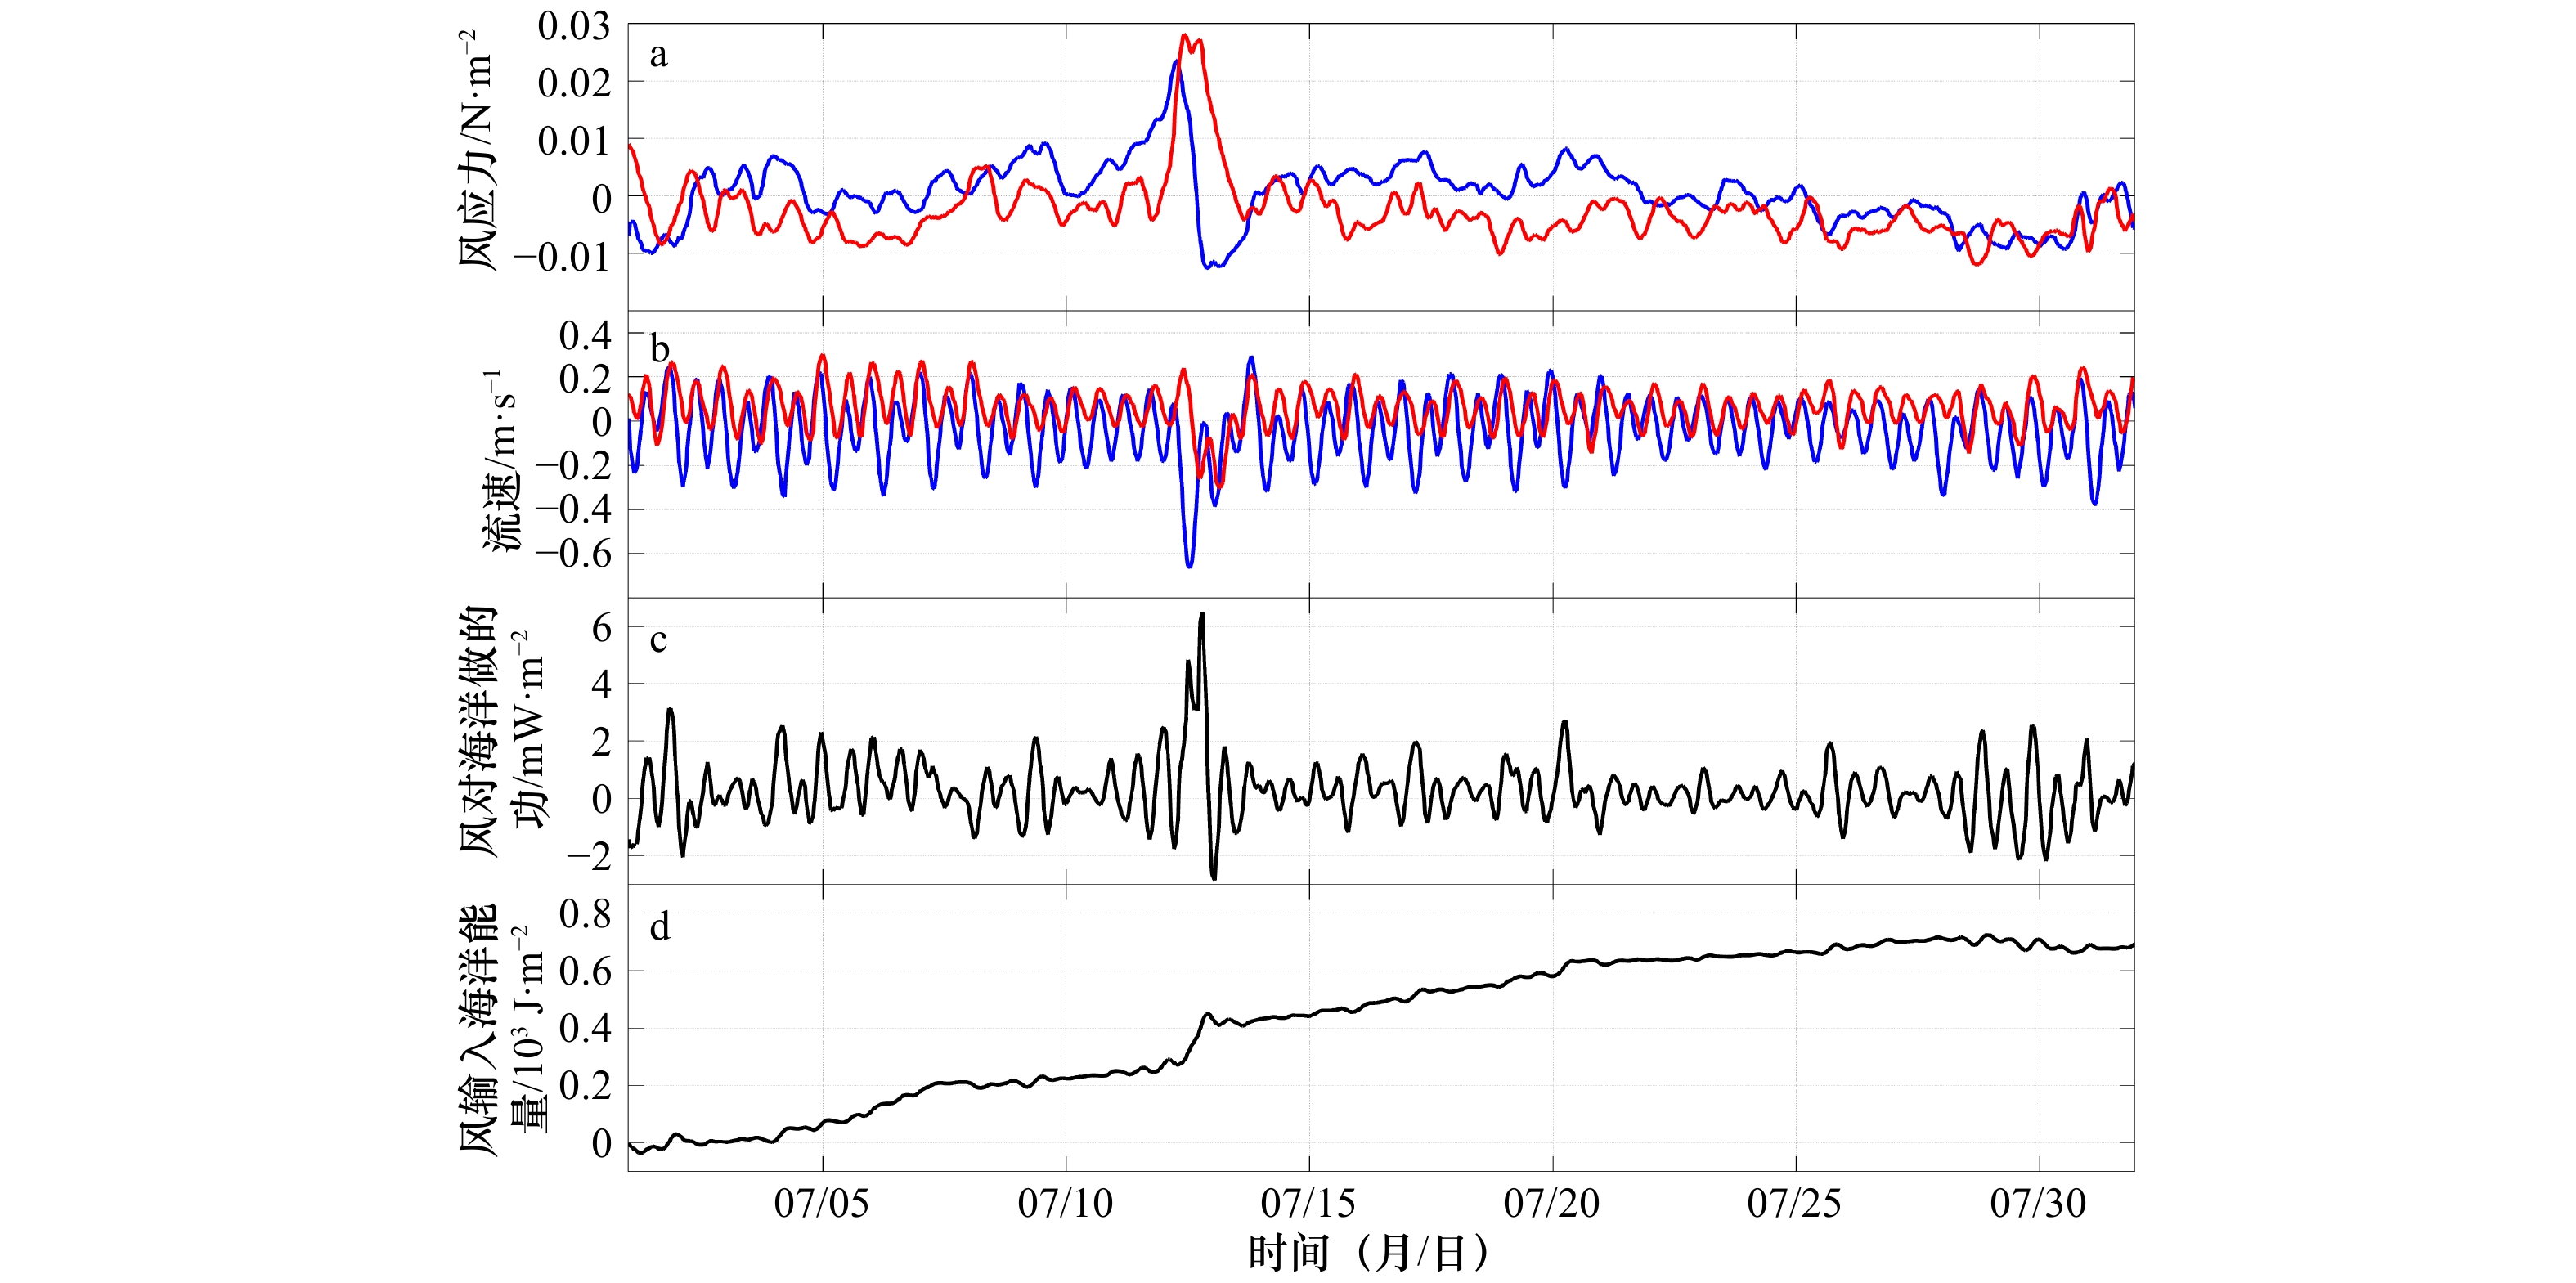
图 6 风应力的时间序列(a),流速的时间序列(b),风对海洋做功的时间序列(c),风输入海洋能量的时间积分(d)
a图和b图中红线为东西方向,蓝线为南北方向,正值代表东方向和北方向,负值代表西方向和南方向
Fig. 6 The time series of the wind stress (a), the time series of the wind (b), wind-induced energy flux to ocean in the surface (c), the time integral of the wind-induced energy flux (d)
The red and blue lines in subplot a and b show the east-westward and south-northward components, respectively. And the positive values represent the eastward and northward components, the negative values represent the westward and southward components

图 7 7月6–26日QF111浮标东西方向(a)和南北方向(b)流速带通滤波提取的近惯性波段流速随深度和时间的变化
黑色实线标注的是±2 cm/s的流速区域;a图中正值代表东方向流速,负值代表西方向流速,b图中正值代表北方向流速,负值代表南方向流速
Fig. 7 Time series of the eastward (a) and northward (b) components of the near-inertial wave current profiles of the buoy QF111 from 6 to 26, July
Black contours mark the velocity of ±2 cm/s. The positive and negative values in a represent the eastward and westward components of the velocity, respectively. And the positive and negative values in b represent the northward and southward velocity, respectively
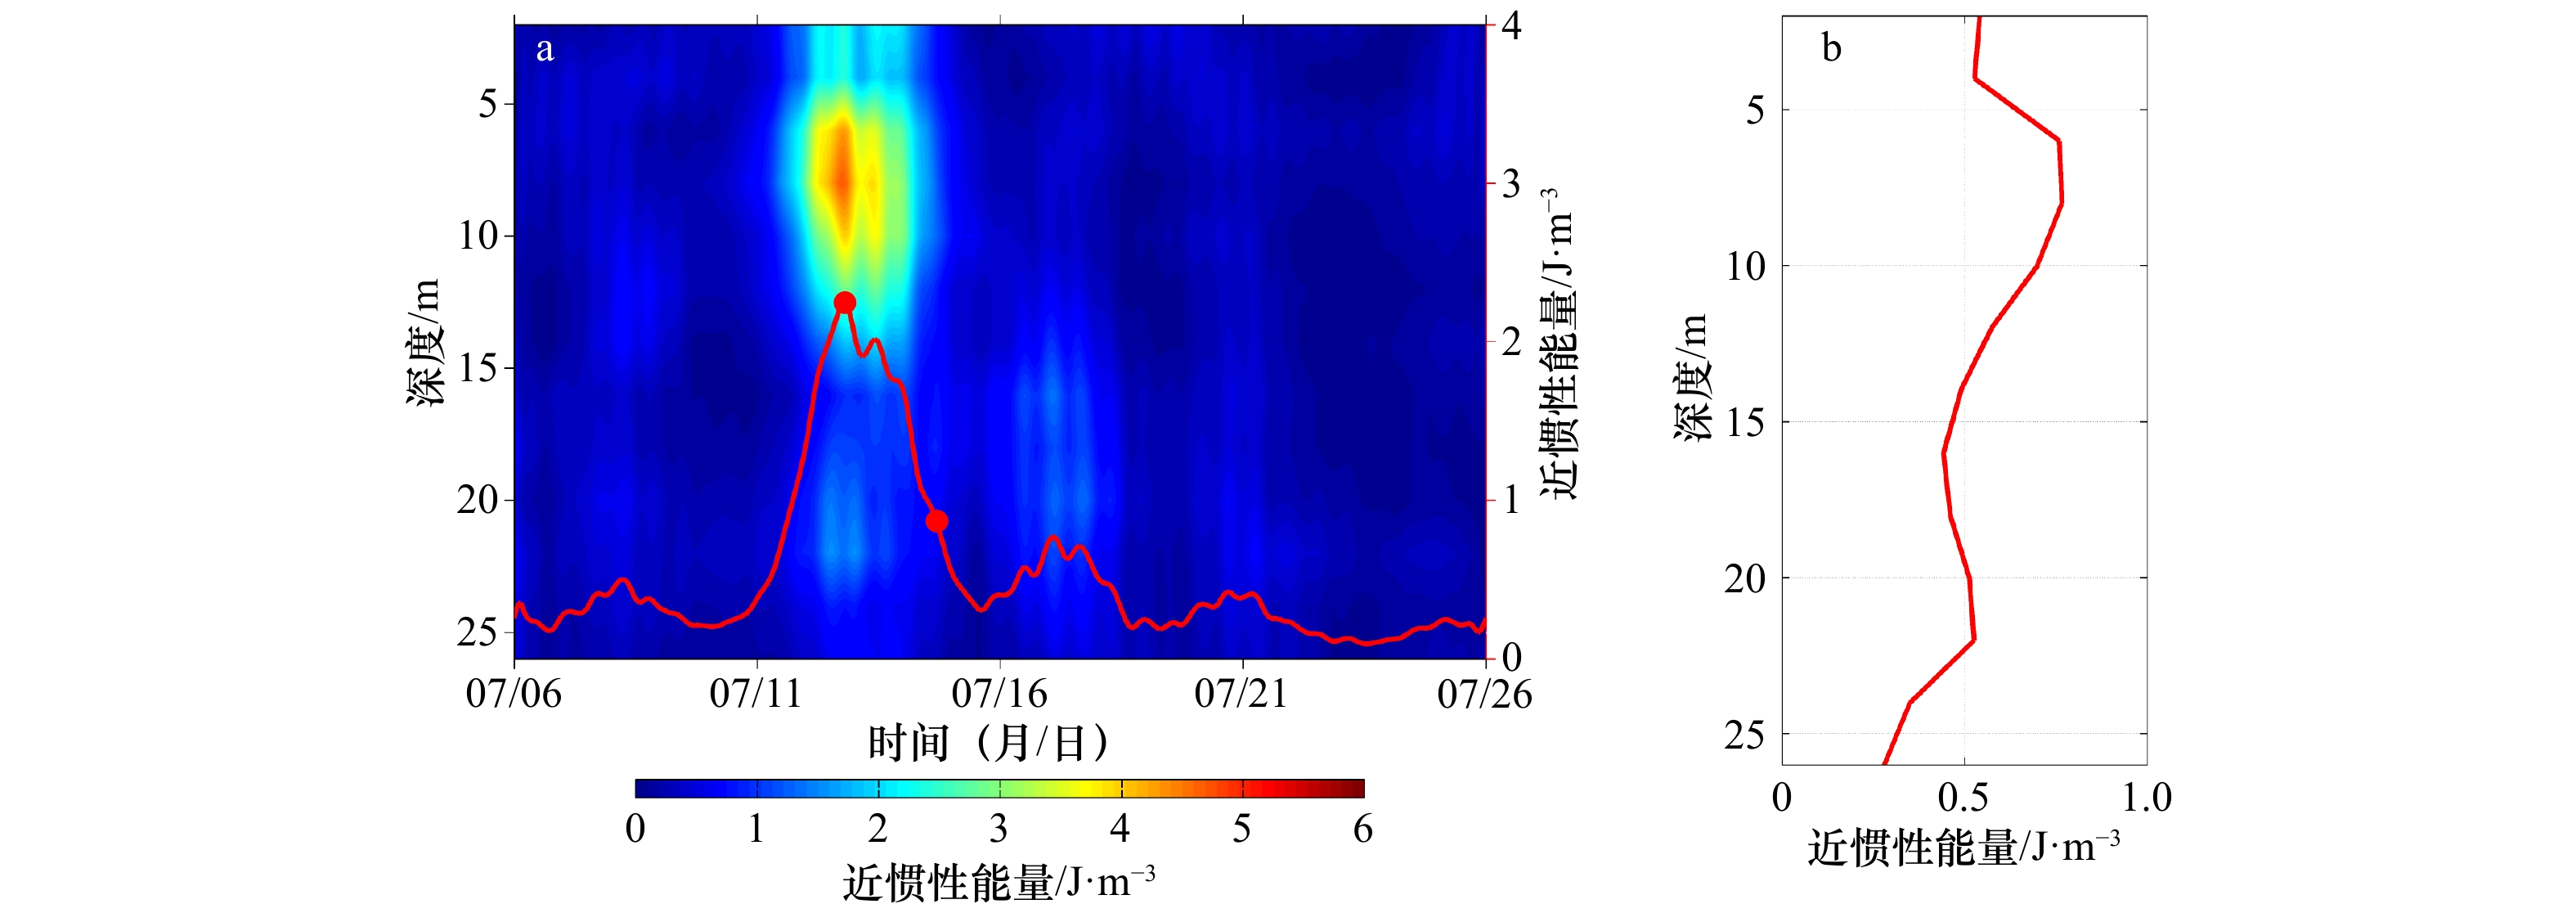
图 8 QF111浮标近惯性能量时间分布(a),近惯性能量7月6–26日时间平均的垂向分布(b)
a图中红色实线为上20 m的能量的深度平均的时间序列,两个红点分别为近惯性能量最大和e折衰减的时刻
Fig. 8 Time evolution of the near-inertial wave kinetic energy in the buoy QF111 (a), and the time-average kinetic energy from 6 to 26, July (b)
The red line in a represents the depth-average kinetic energy above 20 m, the two red dots indicate the max and the e-folding moments of the kinetic energy
-
[1] Price J F. Upper ocean response to a hurricane[J]. Journal of Physical Oceanography, 1981, 11(2): 153−175. doi: 10.1175/1520-0485(1981)011<0153:UORTAH>2.0.CO;2 [2] Price J F. Internal wave wake of a moving storm. Part I. Scales, energy budget and observations[J]. Journal of Physical Oceanography, 1983, 13(6): 949−965. doi: 10.1175/1520-0485(1983)013<0949:IWWOAM>2.0.CO;2 [3] Sanford T B, Price J F, Girton J B. Upper-ocean response to hurricane Frances (2004) observed by profiling EM-APEX floats[J]. Journal of Physical Oceanography, 2011, 41(6): 1041−1056. doi: 10.1175/2010JPO4313.1 [4] D'Asaro E A. The energy flux from the wind to near-inertial motions in the surface mixed layer[J]. Journal of Physical Oceanography, 1985, 15(8): 1043−1059. doi: 10.1175/1520-0485(1985)015<1043:TEFFTW>2.0.CO;2 [5] 朱大勇, 李立. 台风Wayne过后南海北部陆架海域的近惯性振荡[J]. 热带海洋学报, 2007, 26(4): 1−7. doi: 10.3969/j.issn.1009-5470.2007.04.001Zhu Dayong, Li Li. Near inertial oscillations in shelf-break of northern South China Sea after passage of typhoon Wayne[J]. Journal of Tropical Oceanography, 2007, 26(4): 1−7. doi: 10.3969/j.issn.1009-5470.2007.04.001 [6] 管守德. 南海北部近惯性振荡研究[D]. 青岛: 中国海洋大学, 2014.Guan Shoude. Near inertial oscillations in the northern southern South China Sea[D]. Qingdao: Ocean University of China, 2014. [7] Teague W J, Jarosz E, Wang D W, et al. Observed oceanic response over the upper continental slope and outer shelf during hurricane Ivan[J]. Journal of Physical Oceanography, 2007, 37(9): 2181−2206. doi: 10.1175/JPO3115.1 [8] Zhang Han, Chen Dake, Zhou Lei, et al. Upper ocean response to typhoon Kalmaegi (2014)[J]. Journal of Geophysical Research: Oceans, 2016, 121(8): 6520−6535. doi: 10.1002/2016JC012064 [9] 单海霞, 管玉平, 王东晓, 等. 赤道海洋对罕见台风“画眉”的响应[J]. 热带海洋学报, 2012, 31(1): 28−34.Shan Haixia, Guan Yuping, Wang Dongxiao, et al. Responses of equatorial ocean to rare typhoon Vamei[J]. Journal of Tropical Oceanography, 2012, 31(1): 28−34. [10] Shan Haxia, Guan Yuping, Huang Jianping. Investigating different bio-responses of the upper ocean to Typhoon Haitang using Argo and satellite data[J]. Chinese Science Bulletin, 2014, 59(8): 785−794. doi: 10.1007/s11434-013-0101-9 [11] 孟庆军, 李培良. 黄海在有无潮作用下对“布拉万”不同响应的数值模拟研究[J]. 海洋与湖沼, 2015, 46(6): 1241−1254.Meng Qingjun, Li Peiliang. A numerical study of the Yellow Sea responses to BOLAVEN with and without tides[J]. Oceanologia et Limnologia Sinica, 2015, 46(6): 1241−1254. [12] Lin I, Liu W T, Wu C C, et al. New evidence for enhanced ocean primary production triggered by tropical cyclone[J]. Geophysical Research Letters, 2003, 30(13): 1718. [13] Jacob S D, Shay L K, Mariano A J, et al. The 3D oceanic mixed layer response to hurricane Gilbert[J]. Journal of Physical Oceanography, 2000, 30(6): 1407−1429. doi: 10.1175/1520-0485(2000)030<1407:TOMLRT>2.0.CO;2 [14] 陈大可, 雷小途, 王伟, 等. 上层海洋对台风的响应和调制机理[J]. 地球科学进展, 2013, 28(10): 1077−1086. doi: 10.11867/j.issn.1001-8166.2013.10.1077Chen Dake, Lei Xiaotu, Wang Wei, et al. Upper ocean response and feedback mechanisms to typhoon[J]. Advances in Earth Science, 2013, 28(10): 1077−1086. doi: 10.11867/j.issn.1001-8166.2013.10.1077 [15] 韩林生, 高佳, 郭俊如, 等. 上层海洋对热带气旋的响应与反馈研究进展[J]. 海洋通报, 2012, 31(2): 233−239. doi: 10.3969/j.issn.1001-6392.2012.02.016Han Linsheng, Gao Jia, Guo Junru, et al. Research progress of the response and feedback of the upper ocean to Tropical Cyclones[J]. Marine Science Bulletin, 2012, 31(2): 233−239. doi: 10.3969/j.issn.1001-6392.2012.02.016 [16] Zhang Zhiwei, Qiu Bo, Tian Jiwei, et al. Latitude-dependent finescale turbulent shear generations in the Pacific tropical-extratropical upper ocean[J]. Nature Communications, 2018, 9: 4086. doi: 10.1038/s41467-018-06260-8 [17] Zheng Jie, Tian Jiwei, Liang Hui. Observation of near-inertial internal waves on the continental slope in the northwestern South China Sea[J]. Journal of Ocean University of China, 2017, 16(2): 184−190. doi: 10.1007/s11802-017-3153-7 -

 下载:
下载:
计量
- 文章访问数: 483
- HTML全文浏览量: 107
- PDF下载量: 127
- 被引次数: 0
